
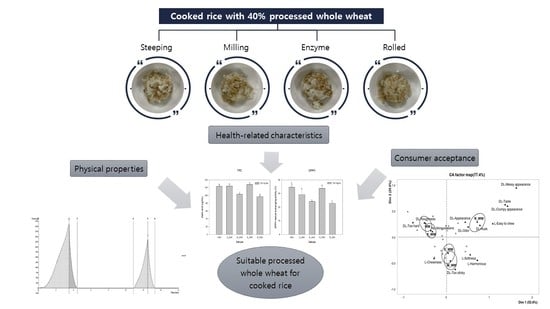
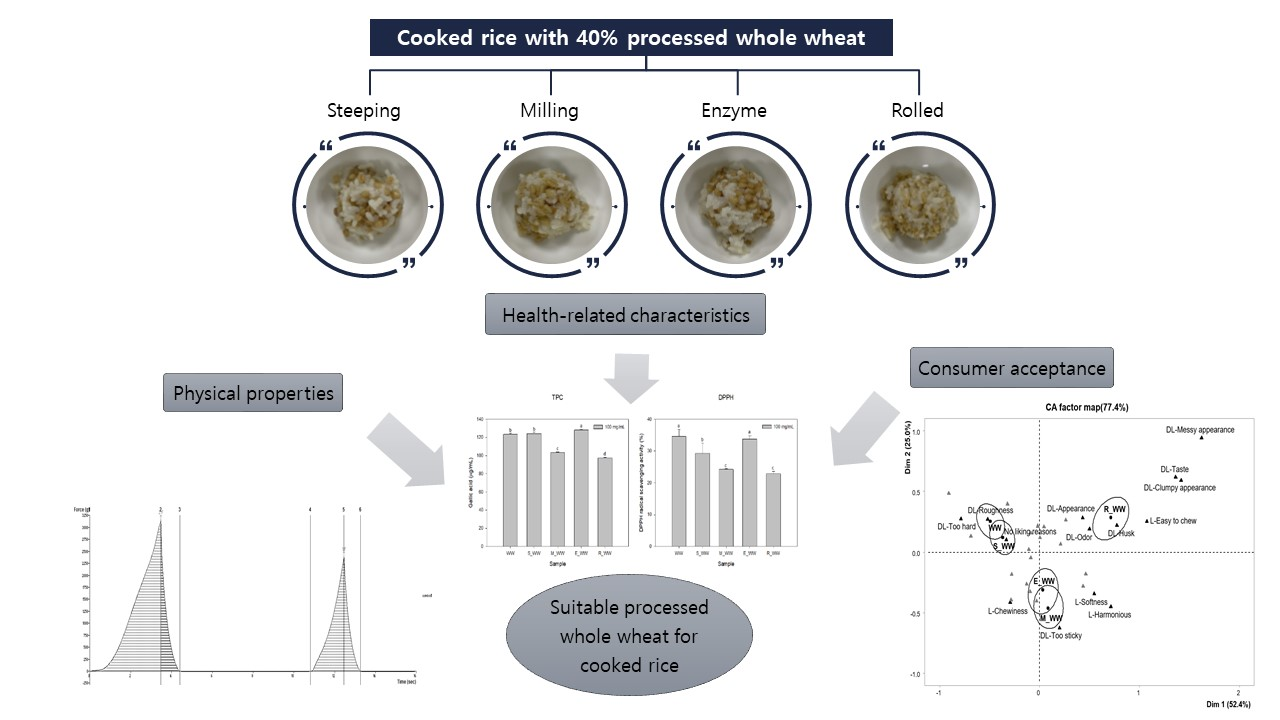
Physicochemical Properties and Drivers of Liking and Disliking for Cooked Rice Containing Various Types of Processed Whole Wheat


Abstract
:
1. Introduction
2. Materials and Methods
2.1. Physicochemical Property
2.1.1. Materials
2.1.2. Cooked Rice with Whole Wheat
2.1.3. Physical Property Analysis of Cooked Rice with Whole Wheat
2.1.4. Starch Hydrolysis Index
2.2. Consumer Acceptance Test
2.2.1. Sample Preparation and Presentation
2.2.2. Cooked Rice with Whole Wheat
2.3. Statistical Analysis
2.3.1. Physicochemical Properties
2.3.2. Consumer Acceptance Test
3. Results
3.1. Characteristics of Cooked Rice with Various Types of Processed Whole Wheat
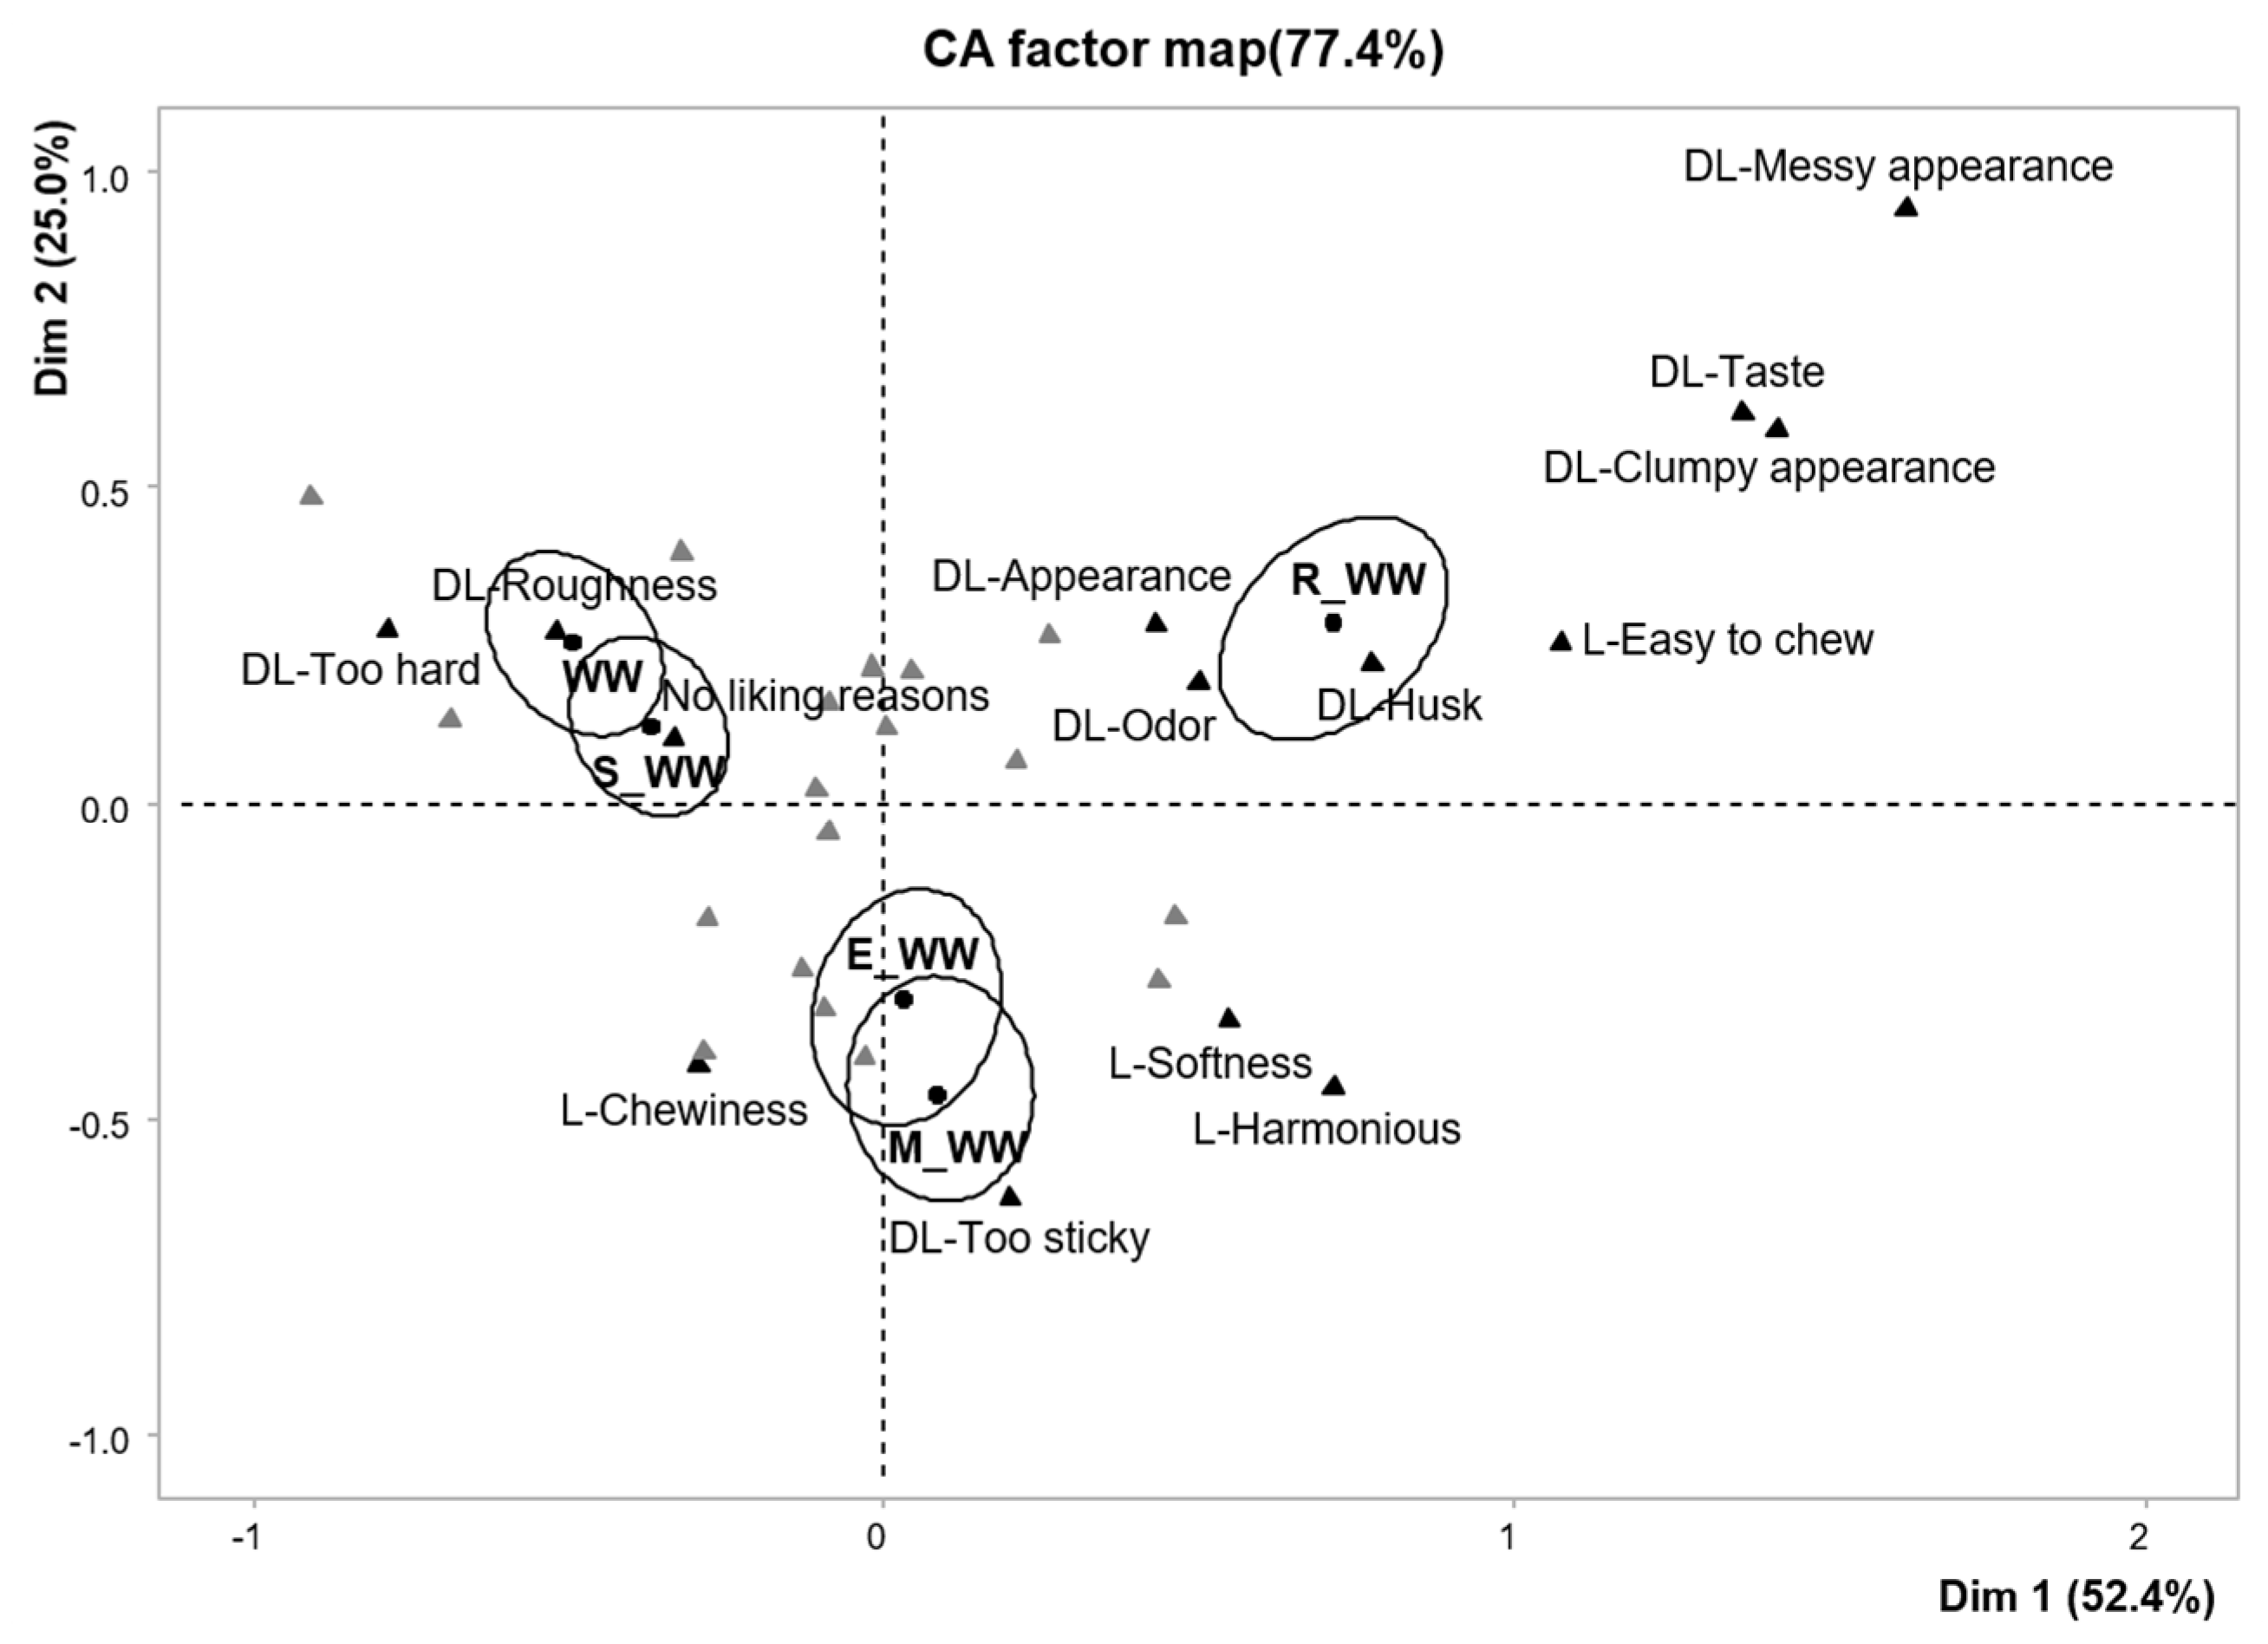
3.2. Consumer Acceptance Test
3.2.1. Consumers’ Liking Scores
3.2.2. Drivers of Liking and Disliking
4. Discussion
5. Conclusions
Author Contributions
Funding
Data Availability Statement
Conflicts of Interest
References
- Han, G.; Lee, Y. Analysis of consumption status of cooked rice with different grains and related factors in a Korean population: Based on data from 2011 Korean National Health and Nutritional Examination Survey (KNHANES). J. East Asian Soc. Diet. Life 2014, 24, 748–758. [Google Scholar] [CrossRef]
- Mafra, I.; Ferreira, I.M.; Oliveira, M.B.P. Food authentication by PCR-based methods. Eur. Food Res. Technol. 2008, 227, 649–665. [Google Scholar] [CrossRef]
- Arzani, A.; Ashraf, M. Cultivated ancient wheats (Triticum spp.): A potential source of health-beneficial food products. Compr. Rev. Food Sci. Food Saf. 2017, 16, 477–488. [Google Scholar] [CrossRef] [PubMed] [Green Version]
- Slavin, J.L.; Martini, M.C.; Jacobs, D.R., Jr.; Marquart, L. Plausible mechanisms for the protectiveness of whole grains. Am. J. Clin. Nutr. 1999, 70, 459s–463s. [Google Scholar] [CrossRef] [PubMed]
- Slavin, J.; Jacobs, D.; Marquart, L. Whole-grain consumption and chronic disease: Protective mechanisms. Nutr. Cancer 1997, 27, 14–21. [Google Scholar] [CrossRef]
- Jacobs, D.R., Jr.; Meyer, K.A.; Kushi, L.H.; Folsom, A.R. Whole-grain intake may reduce the risk of ischemic heart disease death in postmenopausal women: The Iowa Women’s Health Study. Am. J. Clin. Nutr. 1998, 68, 248–257. [Google Scholar] [CrossRef]
- McKeown, N.M.; Meigs, J.B.; Liu, S.; Wilson, P.W.; Jacques, P.F. Whole-grain intake is favorably associated with metabolic risk factors for type 2 diabetes and cardiovascular disease in the Framingham Offspring Study. Am. J. Clin. Nutr. 2002, 76, 390–398. [Google Scholar] [CrossRef] [Green Version]
- Bae, I.Y.; Im Lee, H.; Ko, A.; Lee, H.G. Substituting whole grain flour for wheat flour: Impact on cake quality and glycemic index. Food Sci. Biotechnol. 2013, 22, 1–7. [Google Scholar] [CrossRef]
- Faye, P.; Brémaud, D.; Teillet, E.; Courcoux, P.; Giboreau, A.; Nicod, H. An alternative to external preference mapping based on consumer perceptive mapping. Food Qual. Prefer. 2006, 17, 604–614. [Google Scholar] [CrossRef]
- Symoneaux, R.; Galmarini, M.; Mehinagic, E. Comment analysis of consumer’s likes and dislikes as an alternative tool to preference mapping. A case study on apples. Food Qual. Prefer. 2012, 24, 59–66. [Google Scholar] [CrossRef]
- Fonseca, F.G.; Esmerino, E.A.; Tavares Filho, E.R.; Ferraz, J.P.; da Cruz, A.G.; Bolini, H.M. Novel and successful free comments method for sensory characterization of chocolate ice cream: A comparative study between pivot profile and comment analysis. J. Dairy Sci. 2016, 99, 3408–3420. [Google Scholar] [CrossRef]
- Ares, G.; Varela, P.; Rado, G.; Giménez, A. Identifying ideal products using three different consumer profiling methodologies. Comparison with external preference mapping. Food Qual. Prefer. 2011, 22, 581–591. [Google Scholar] [CrossRef]
- Greenhoff, K.; MacFie, H. Preference mapping in practice. In Measurement of Food Preferences; Springer: Boston, MA, USA, 1994; pp. 137–166. [Google Scholar]
- Ten Kleij, F.; Musters, P.A. Text analysis of open-ended survey responses: A complementary method to preference mapping. Food Qual. Prefer. 2003, 14, 43–52. [Google Scholar] [CrossRef]
- Looker, E.D.; Denton, M.A.; Davis, C.K. Bridging the gap: Incorporating qualitative data into quantitative analyses. Soc. Sci. Res. 1989, 18, 313–330. [Google Scholar] [CrossRef]
- Piqueras-Fiszman, B. Open-ended questions in sensory testing practice. In Rapid Sensory Profiling Techniques; Woodhead Publishing: Amsterdam, The Netherlands, 2015; pp. 247–267. [Google Scholar]
- Sozer, N.; Cicerelli, L.; Heiniö, R.-L.; Poutanen, K. Effect of wheat bran addition on in vitro starch digestibility, physico-mechanical and sensory properties of biscuits. J. Cereal Sci. 2014, 60, 105–113. [Google Scholar] [CrossRef]
- Somogyi, M. Notes on sugar determination. J. Biol. Chem. 1952, 195, 19–23. [Google Scholar] [CrossRef]
- Williams, E.J. Experimental designs balanced for the estimation of residual effects of treatments. Aust. J. Chem. 1949, 2, 149–168. [Google Scholar] [CrossRef]
- MacFie, H.J.; Bratchell, N.; GREENHOFF, K.; Vallis, L.V. Designs to balance the effect of order of presentation and first-order carry-over effects in hall tests. J. Sens. Stud. 1989, 4, 129–148. [Google Scholar] [CrossRef]
- Peryam, D.R.; Pilgrim, F.J. Hedonic scale method of measuring food preferences. Food Technol. 1957, 11, 9–14. [Google Scholar]
- Lê, S.; Worch, T. Qualitative descriptive approaches (Part II). In Analyzing Sensory Data with R; CRC Press: Boca Raton, FL, USA, 2015; pp. 111–148. [Google Scholar]
- Lê, S.; Josse, J.; Husson, F. FactoMineR: An R package for multivariate analysis. J. Stat. Softw. 2008, 25, 1–18. [Google Scholar] [CrossRef] [Green Version]
- R Core Team. Available online: https://www.R-project.org/ (accessed on 2 March 2021).
- RStudio Team. Available online: http://www.rstudio.com/ (accessed on 2 March 2021).
- Maskan, M. Effect of maturation and processing on water uptake characteristics of wheat. J. Food Eng. 2001, 47, 51–57. [Google Scholar] [CrossRef]
- Tagawa, A.; Muramatsu, Y.; Nagasuna, T.; Yano, A.; Iimoto, M.; Murata, S. Water absorption characteristics of wheat and barley during soaking. Trans. ASAE 2003, 46, 361. [Google Scholar] [CrossRef]
- Thakur, A.K.; Gupta, A. Water absorption characteristics of paddy, brown rice and husk during soaking. J. Food Eng. 2006, 75, 252–257. [Google Scholar] [CrossRef]
- Park, J.K.; Kim, S.S.; Kim, K.O. Effect of milling ratio on sensory properties of cooked rice and on physicochemical properties of milled and cooked rice. Cereal Chem. 2001, 78, 151–156. [Google Scholar] [CrossRef]
- Gujral, H.S.; Kumar, V. Effect of accelerated aging on the physicochemical and textural properties of brown and milled rice. J. Food Eng. 2003, 59, 117–121. [Google Scholar] [CrossRef]
- Szczesniak, A.S. Texture is a sensory property. Food Qual. Prefer. 2002, 13, 215–225. [Google Scholar] [CrossRef]
- Bourne, M. Food Texture and Viscosity: Concept and Measurement; Elsevier: Amsterdam, The Netherlands, 2002. [Google Scholar]
- Herrero, A.; De la Hoz, L.; Ordóñez, J.; Herranz, B.; de Avila, M.R.; Cambero, M. Tensile properties of cooked meat sausages and their correlation with texture profile analysis (TPA) parameters and physico-chemical characteristics. Meat Sci. 2008, 80, 690–696. [Google Scholar] [CrossRef]
- Rahman, M.S.; Al-Farsi, S.A. Instrumental texture profile analysis (TPA) of date flesh as a function of moisture content. J. Food Eng. 2005, 66, 505–511. [Google Scholar] [CrossRef]
- Di Monaco, R.; Cavella, S.; Masi, P. Predicting sensory cohesiveness, hardness and springiness of solid foods from instrumental measurements. J. Texture Stud. 2008, 39, 129–149. [Google Scholar] [CrossRef]
- Kim, S.S.; Lee, S.E.; Kim, O.W.; Kim, D.C. The Relationship between Sensory Quality and Market Price of Rice in Korea. Food Sci. Biotechnol. 2000, 9, 195–198. [Google Scholar]
- Kim, H.; Kim, O.W.; Kwak, H.S.; Kim, S.S.; Lee, H.J. Prediction model of rice eating quality using physicochemical properties and sensory quality evaluation. J. Sen. Stud. 2017, 32, e12273. [Google Scholar] [CrossRef]
- Choi, W.S.; Jarma Arroyo, S.E.; Seo, H.S. Cross-cultural comparisons between Korean and US adults with respect to texture perception and acceptance of cooked milled rice. Int. J. Food Sci. Technol. 2018, 53, 2181–2194. [Google Scholar] [CrossRef]
- Juliano, B.O.; Perez, C.M.; Barber, S.; Blakeney, A.B.; Iwasaki, T.A.; Shibuya, N.; Keneaster, K.K.; Chung, S.; Laignelet, B.; Launay, B. International cooperative comparison of instrument methods for cooked rice texture. J. Texture Stud. 1981, 12, 17–38. [Google Scholar] [CrossRef]
- Li, H.; Prakash, S.; Nicholson, T.M.; Fitzgerald, M.A.; Gilbert, R.G. Instrumental measurement of cooked rice texture by dynamic rheological testing and its relation to the fine structure of rice starch. Carbohydr. Polym. 2016, 146, 253–263. [Google Scholar] [CrossRef] [PubMed] [Green Version]
- Lu, S.; Cik, T.T.; Lii, C.Y.; Lai, P.; Chen, H.H. Effect of amylose content on structure, texture and α-amylase reactivity of cooked rice. LWT-Food Sci. Technol. 2013, 54, 224–228. [Google Scholar] [CrossRef]
- Galmarini, M.V.; Symoneaux, R.; Chollet, S.; Zamora, M.C. Understanding apple consumers’ expectations in terms of likes and dislikes. Use of comment analysis in a cross-cultural study. Appetite 2013, 62, 27–36. [Google Scholar] [CrossRef] [PubMed] [Green Version]
- Vidal, L.; Ares, G.; Le Blond, M.; Jin, D.; Jaeger, S.R. Emoji in open-ended questions: A novel use in product research with consumers. J. Sens. Stud. 2020, 35, e12610. [Google Scholar] [CrossRef]
- Letarte, A.; Dube, L.; Troche, V. Similarities and differences in affective and cognitive origins of food likings and dislikes. Appetite 1997, 28, 115–129. [Google Scholar] [CrossRef] [PubMed]
- Peeters, G.; Czapinski, J. Positive-negative asymmetry in evaluations: The distinction between affective and informational negativity effects. Eur. Rev. Soc. Psychol. 1990, 1, 33–60. [Google Scholar] [CrossRef]


| Sample | Water Content (%) ***1 | TPA | HI | |||||
|---|---|---|---|---|---|---|---|---|
| Hardness (g) *** | Adhesiveness | Springiness | Cohesiveness *** | Chewiness (g) *** | Resilience ** | |||
| WW | 57.8 c2 | 4693 a | −79.2 | 0.50 | 0.35 b | 810 a | 0.16 ab | 526 |
| S_WW | 60.6 b | 3830 b | −85.8 | 0.48 | 0.31 c | 563 bc | 0.13 c | 563 |
| M_WW | 60.6 b | 3822 b | −87.1 | 0.43 | 0.32 bc | 532 bc | 0.14 bc | 593 |
| E_WW | 60.8 b | 3349 c | −82.9 | 0.47 | 0.38 a | 600 b | 0.17 a | 596 |
| R_WW | 62.3 a | 2469 d | −80.2 | 0.52 | 0.39 a | 505 c | 0.18 a | 602 |
| Sample | Overall ***1 | Appearance *** | Odor *** | Texture *** | Taste/Flavor *** |
|---|---|---|---|---|---|
| r2 | 1.00 | 0.59 | 0.59 | 0.74 | 0.76 |
| WW | 4.8 ± 1.9 cd3 | 5.0 ± 1.8 b | 5.9 ± 1.6 ab | 4.6 ± 2.3 b | 5.4 ± 1.8 b |
| S_WW | 5.0 ± 1.8 bc | 5.0 ± 1.9 b | 5.9 ± 1.5 ab | 4.5 ± 2.1 b | 5.5 ± 1.7 ab |
| M_WW | 5.8 ± 1.5 a | 5.6 ± 1.7 a | 6.1 ± 1.5 a | 5.7 ± 1.8 a | 5.9 ± 1.6 a |
| E_WW | 5.3 ± 1.7 b | 5.0 ± 1.7 b | 5.5 ± 2.0 b | 5.5 ± 1.7 a | 5.6 ± 2.0 ab |
| R_WW | 4.4 ± 1.8 d | 4.0 ± 1.9 c | 4.7 ± 1.9 c | 4.6 ± 1.9 b | 4.6 ± 2.0 c |
| Major Driver of (Dis) Liking | Samples | |||||
|---|---|---|---|---|---|---|
| WW | S_WW | M_WW | E_WW | R_WW | Total | |
| Reasons of liking | ||||||
| Appearance | 6 | 4 | 9 | 3 | 1 | 23 |
| Odor | 8 | 8 | 4 | 8 | 9 | 37 |
| Corn odor | 6 | 6 | 4 | 8 | 2 | 26 |
| Nutty odor | 5 | 5 | 5 | 2 | 4 | 21 |
| Taste | 5 | 4 | 6 | 8 | 3 | 26 |
| Sweetness | 2 | 6 | 7 | 6 | 3 | 24 |
| Nutty flavor | 6 | 9 | 5 | 3 | 9 | 32 |
| Chewiness | 16 | 17 | 20 | 25 (+)1*2 | 2 (−)*** | 80 |
| Softness | 2 | 0 (−)* | 8 | 5 | 8 | 23 |
| Sticky | 4 | 6 | 5 | 3 | 4 | 22 |
| Not watery | 2 | 5 (+)* | 1 | 1 | 0 | 9 |
| Less after-effect | 3 | 4 | 5 | 1 | 6 | 19 |
| Easy to chew | 0 | 1 | 4 | 0 | 10 (+)*** | 15 |
| Looks healthy | 6 | 3 | 3 | 2 | 2 | 16 |
| Harmonious | 0 | 0 | 5 | 3 | 5 | 13 |
| No liking reasons | 28 (+)* | 19 | 14 | 13 | 26 | 100 |
| Reasons of disliking | ||||||
| Appearance | 9 | 6 | 4 | 10 | 22 (+)*** | 51 |
| Husk | 0 | 2 | 1 | 3 | 7 (+)*** | 13 |
| Clumpy appearance | 0 | 0 | 1 | 0 | 6 (+)*** | 7 |
| Messy appearance | 0 | 0 | 0 | 0 | 6 (+)*** | 6 |
| Odor | 2 | 2 | 2 | 3 | 7 | 16 |
| Off-odor | 0 (−)*** | 3 | 1 | 10 | 7 | 21 |
| Taste | 0 | 0 | 0 | 1 | 5 (+)*** | 6 |
| Texture | 4 | 2 | 3 | 1 | 6 | 16 |
| Too watery | 8 (−)*** | 5 (−)** | 29 (+)*** | 10 | 25 | 77 |
| Too hard | 33 (+)*** | 22 (+)* | 10 | 3 (−)** | 0 (−)*** | 68 |
| Roughness | 17 | 18 (+)* | 1 (−)*** | 8 | 10 | 54 |
| Too sticky | 2 | 1 | 8 (+)*** | 4 | 3 | 18 |
| Chewiness | 3 | 5 | 1 | 1 | 1 | 11 |
| Strong after-effect | 14 | 20 | 8 | 11 | 15 | 68 |
| Feels undercooked | 10 (+)*** | 1 | 1 | 1 | 0 | 13 |
| No disliking reasons | 13 | 21 | 24 (+)*** | 14 | 10 (−)*** | 82 |
| Driver of (dis)liking | ||||||
| Total reasons of liking | 103 | 109 | 128 | 122 | 101 | 563 |
| Total reasons of disliking | 145 | 122 | 97 | 115 | 163 | 642 |
Publisher’s Note: MDPI stays neutral with regard to jurisdictional claims in published maps and institutional affiliations. |
© 2021 by the authors. Licensee MDPI, Basel, Switzerland. This article is an open access article distributed under the terms and conditions of the Creative Commons Attribution (CC BY) license (https://creativecommons.org/licenses/by/4.0/).
Share and Cite
Lee, D.-B.; Kim, M.-R.; Heo, J.-A.; Byeon, Y.-S.; Kim, S.-S. Physicochemical Properties and Drivers of Liking and Disliking for Cooked Rice Containing Various Types of Processed Whole Wheat. Foods 2021, 10, 1470. https://doi.org/10.3390/foods10071470
Lee D-B, Kim M-R, Heo J-A, Byeon Y-S, Kim S-S. Physicochemical Properties and Drivers of Liking and Disliking for Cooked Rice Containing Various Types of Processed Whole Wheat. Foods. 2021; 10(7):1470. https://doi.org/10.3390/foods10071470
Chicago/Turabian StyleLee, Da-Been, Mi-Ran Kim, Jeong-Ae Heo, Yang-Soo Byeon, and Sang-Sook Kim. 2021. "Physicochemical Properties and Drivers of Liking and Disliking for Cooked Rice Containing Various Types of Processed Whole Wheat" Foods 10, no. 7: 1470. https://doi.org/10.3390/foods10071470
APA StyleLee, D.-B., Kim, M.-R., Heo, J.-A., Byeon, Y.-S., & Kim, S.-S. (2021). Physicochemical Properties and Drivers of Liking and Disliking for Cooked Rice Containing Various Types of Processed Whole Wheat. Foods, 10(7), 1470. https://doi.org/10.3390/foods10071470