Article

Improvement of Must Fermentation from Late Harvest cv. Tempranillo Grapes Treated with Pulsed Light

1
enotecUPM, Chemistry and Food Technology Department, Escuela Técnica Superior de Ingeniería Agronómica, Alimentaria y de Biosistemas, Universidad Politécnica de Madrid, Avenida Puerta de Hierro 2, 28040 Madrid, Spain
2
Biotechnology and Vegetal Biology Department, Escuela Técnica Superior de Ingeniería Agronómica, Alimentaria y de Biosistemas, Universidad Politécnica de Madrid, Avenida Puerta de Hierro 2, 28040 Madrid, Spain
*
Author to whom correspondence should be addressed.
Foods 2021, 10(6), 1416; https://doi.org/10.3390/foods10061416
Submission received: 20 May 2021 / Revised: 15 June 2021 / Accepted: 17 June 2021 / Published: 18 June 2021

Abstract

:
Pulsed light irradiation is a nonthermal technology currently used for the elimination of pathogens from a diverse range of food products. In the last two decades, the results obtained using PL at laboratory scale are encouraging wine experts to use it in the winemaking industry. PL can reduce native yeast counts significantly, which facilitates the use of starter cultures, reducing SO2 requirements at the same time. In this experimental set up, Tempranillo grapes were subjected to pulsed light treatment, and the fermentative performance of non-Saccharomyces yeasts belonging to the species Schizosaccharomyces pombe, Lachancea thermotolerans, Torulaspora delbrueckii, Metschnikowia pulcherrima and Hanseniaspora vineae was monitored in sequential fermentations against spontaneous fermentation and pure culture fermentation with the species Saccharomyces cerevisiae. The experimental analyses comprised the determination of anthocyanin (High performance liquid chromatography with photodiode array detector—HPLC-DAD), polyphenol index and colour (Ultraviolet-visible spectroscopy—UV-Vis spectrophotometer), fermentation-derived volatiles (Gas chromatography with flame ionization detector—GC-FID), oenological parameters (Fourier transform Infrared spectroscopy—FT-IR) and structural damage of the skin (atomic force microscopy—AFM). The results showed a decrease of 1.2 log CFU/mL yeast counts after pulsed light treatment and more rapid and controlled fermentation kinetics in musts from treated grapes than in untreated samples. The fermentations done with treated grapes allowed starter cultures to better implant in the must, although a larger anthocyanin loss (up to 93%) and an increase in hue values (1 unit) towards more yellow hues were observed for treated grapes. The development of biomass was larger in musts from treated grapes. The profile of volatile compounds and oenological parameters reveals that fermentations carried out with untreated grapes are prone to deviations from native microbiota (e.g., production of lactic acid). Finally, no severe damage on the skin was observed with the AFM on treated grapes.

1. Introduction

Pulsed light irradiation (PL) is an emerging nonthermal technology currently used for the sanitation of food products [1,2,3]. It is considered nonthermal since the temperature of the treated meal does not experience a significant increase. PL irradiation, as well as other nonthermal technologies, has been used effectively in the reduction of spoilage microbial populations [4,5], and this may eventually reduce the risk of the accumulation of biogenic amines, especially from lactic acid bacteria [6], as a tool to ensure quality control. PL comprises irradiation from the near-infrared, visible and ultraviolet fractions (UV-A, UV-B and UV-C) in the electromagnetic spectrum. The effectiveness of this nonthermal technology is based on the damage produced to cellular wall structures and at the DNA level by the ultraviolet fraction from the pulses [7,8], especially the fraction UV-C. The damages include the formation of dimers from adjacent thymines, inhibition of DNA replication and single and double-stranded breaks of DNA chains. The UV fraction can eliminate wild microbial populations located in the pruina of grape skins as previously reported [9].
There is currently little research on the PL treatment of grapes for winemaking. Documented treatments include 5 to 10 pulses and fluences up to 1.8 J/cm2 [9]. Treatments in white wine, for the reduction of spoilage yeasts, have used larger fluence values (>10 J/cm2) [10]. In comparison, in the treatment of other food matrices with PL, the fluence can reach 14 J/cm2 and 16 J/cm2 for avocado and raspberry, respectively [11]. The fluence may vary in function of the power of the apparatus and the duration of the pulses. The energy is kept in the capacitors before it is released in the ultrashort periods of time [7].
The use of PL as a pretreatment in vinification would allow winemakers to use starter cultures to better control the fermentation process [11,12]. PL would reduce the wild native yeasts, mainly non-Saccharomyces yeasts which are larger in number than the Saccharomyces genus, stopping spontaneous fermentations from taking over and allowing selected strains or starter cultures to implant faster. Non-Saccharomyces yeasts, especially the genus Hanseniaspora, are particularly present in higher amounts in the pruina of the grapes and are responsible for the start of the fermentation [13].
PL can also be used in other winemaking processes. The irradiation emitted is also capable of reducing spoilage yeasts in wines. Such is the case of white wine inoculated with Brettanomyces bruxellensis. The treatment with PL produced up to a 2-log reduction with a fluence of 10.7 J/cm2 [10]. Nonetheless, the use of PL for this purpose may induce changes in the quality of the wines as a result of the modification of the organoleptic parameters. Other technologies, such as pulsed electric fields and UV-C irradiation, have also demonstrated inactivating spoilage yeast from the species B. bruxellensis [14].
Other effects attributed to the use of PL pretreatments in other food matrices are: (1) the preservation of quality properties, as the energy associated with this technology does not modify the phenolic composition and antioxidant properties [15], and the preservation of organoleptic attributes associated with food matrices [16] and (2) the increased extraction of phenolics and anthocyanin’s fractions [17,18], the effect of which is an enhanced colour expression. In the winemaking process, the colour improvement attributed to PL goes together with appropriate practices and, mainly, a proper maceration, which is a physicochemical process in which mechanical operations, temperature and aeration are involved [19].
The principal challenge found for PL to be used for musts in the winemaking process is low transparency and suspended solids [20]. Suspended solids would reduce the penetration of the irradiation. For the UV fraction to be effective in red wine must, due to the high UV absorbance of nonclarified liquids, the width of the piping should be thin [21]. An arrangement of lamps and pipes is to be designed to achieve the microbial reduction needed.
In this experimental work, microfermentations of red wine Vitis vinifera L. cv. Tempranillo were prepared from untreated and PL-treated grapes. Non-Saccharomyces yeast strains were compared with Saccharomyces cerevisiae (Sc) and spontaneous fermentations. The resulting wines were assessed analytically to evaluate the fermentative performance of the strains after the use of PL as a potential sanitizing technology for winemaking production to reduce the use of SO2.

2. Materials and Methods

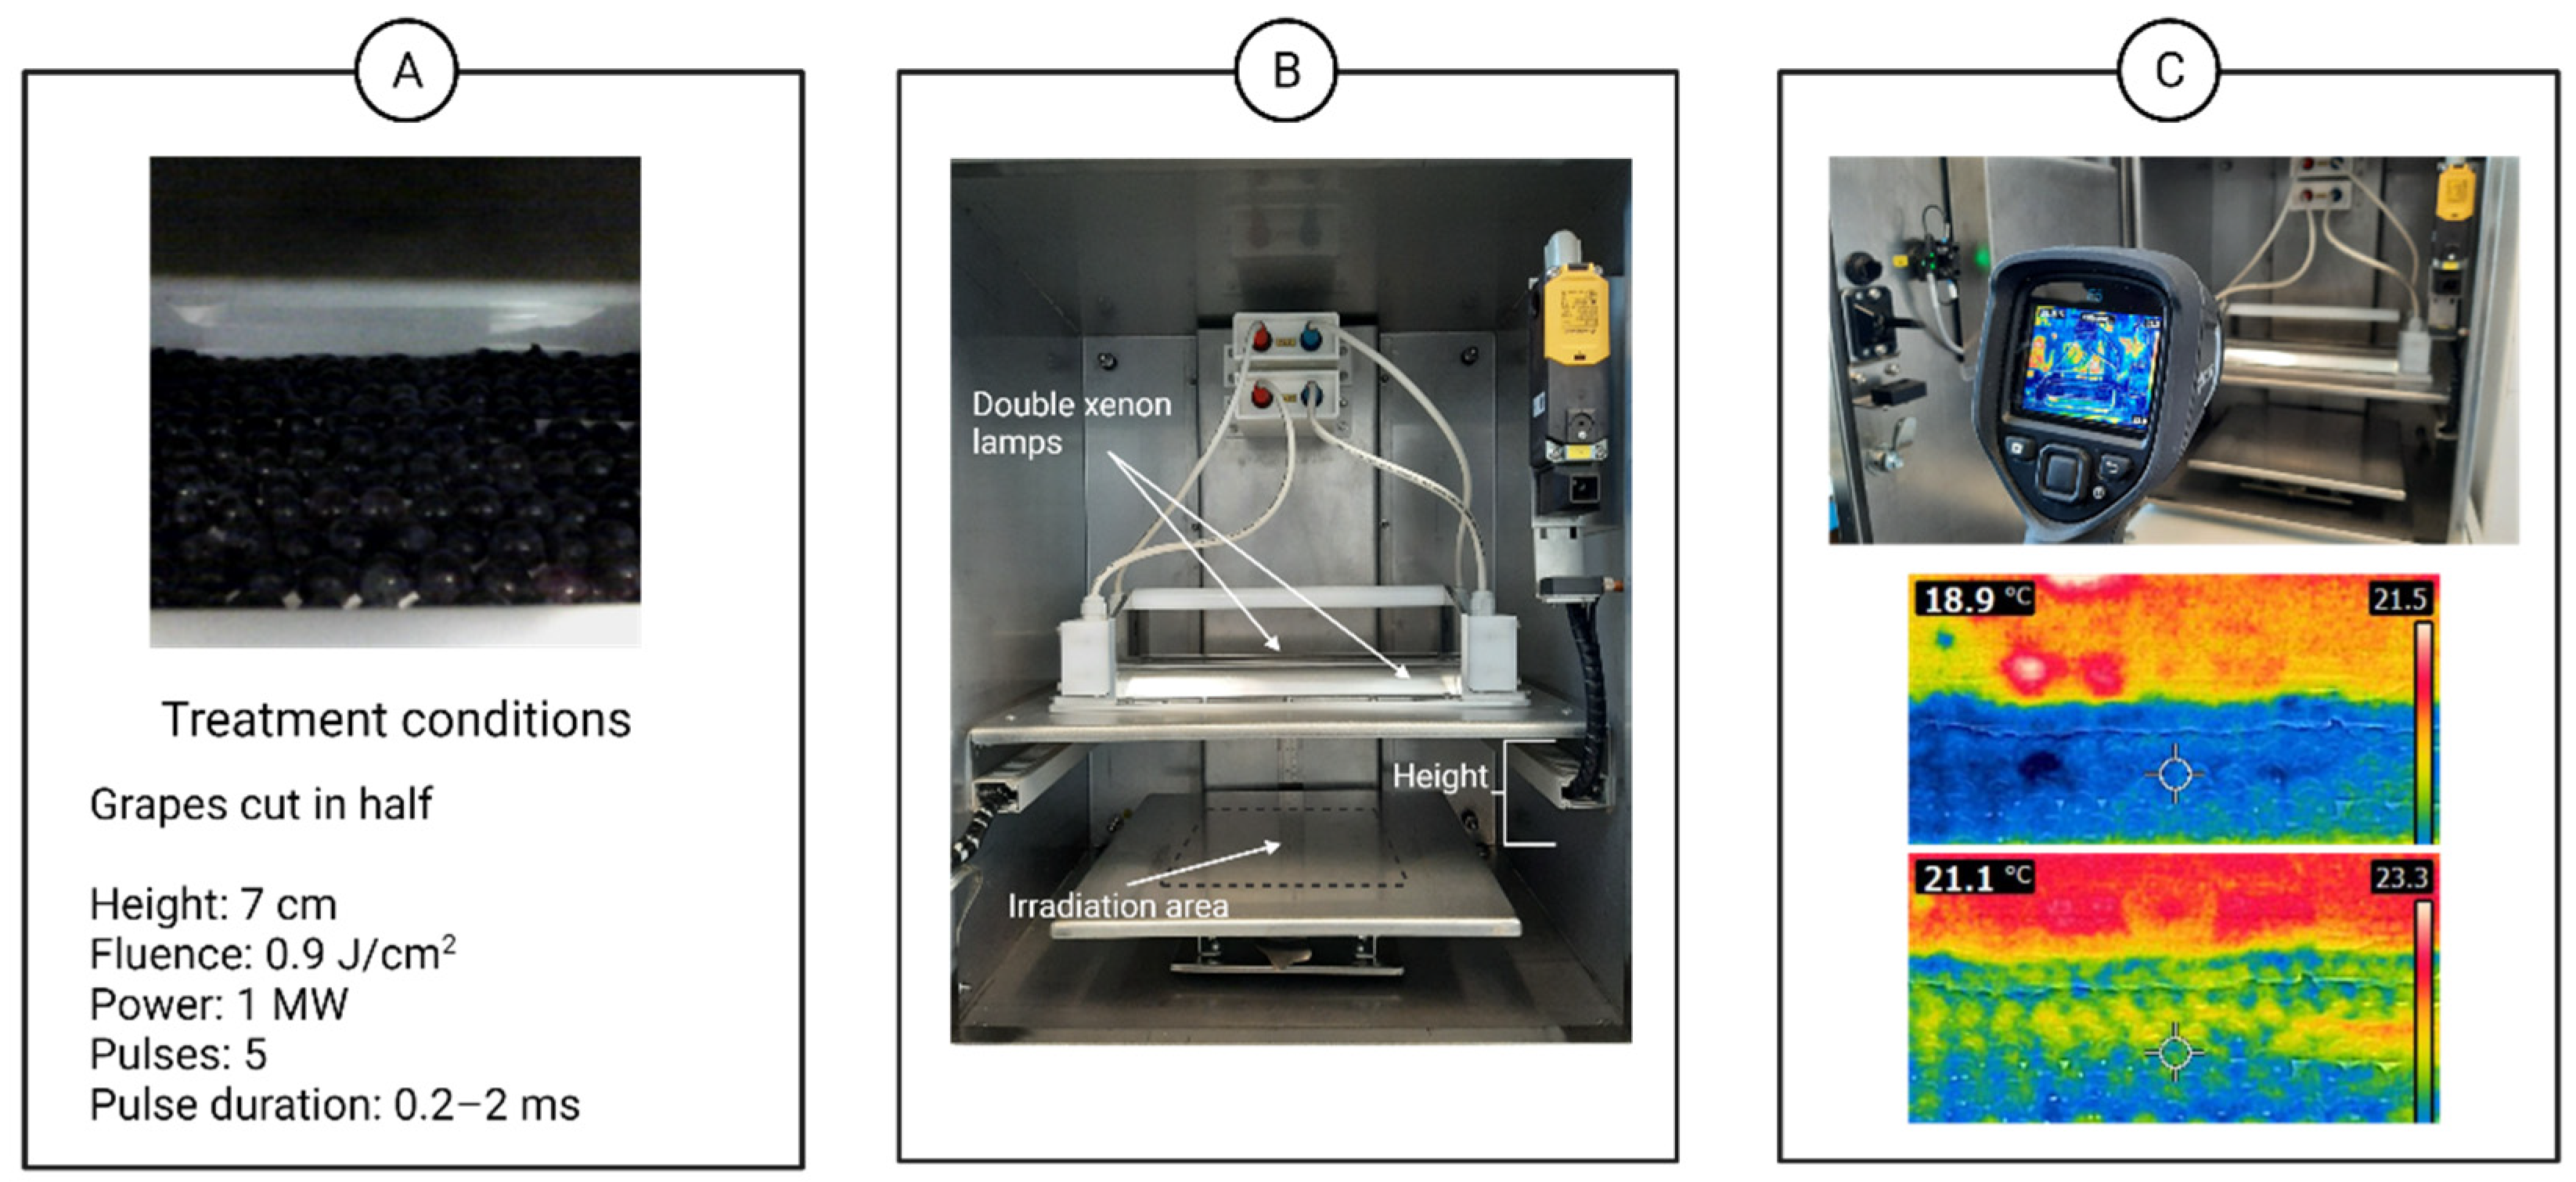
2.1. Pulsed Light Treatment

Grapes from Vitis vinifera L. cv. Tempranillo from late harvest were manually destemmed, cut in half and placed on sterile plates prior to PL treatments (Figure 1A). This procedure was followed to ensure irradiation over the majority of the surface of the grapes. The grapes were handled inside a laminar flow hood wearing sterile nitrile gloves. The treatment consisted of five pulses applied with a power of 1 MW/pulse with a pulse width of 0.2 to 2 milliseconds. Therefore, the fluence achieved was 0.9 J/cm2. The treatment area was 25 cm long and 13 cm wide. The distance between the lamps and the sample was adjusted to 7 cm. A double xenon lamp laboratory-scale customized Claranor device was used (Figure 1B) (Claranor, Avignon, France). Treatments were performed at room temperature and a 2 °C temperature increase was observed with the use of an infrared thermal camera (Figure 1C). The temperature was measured right after the end of the treatment once the front door was opened. After treatment, the samples were manually pressed in sterile flasks and then placed in sterile 100-mL brown glass flasks for fermentation with the use of Müller valves for CO2 release. Untreated must was also obtained following the same aseptic procedure for comparison. All experiments were conducted in triplicate. The experiments are described as (A) control fermentations and (B) PL treatment samples.

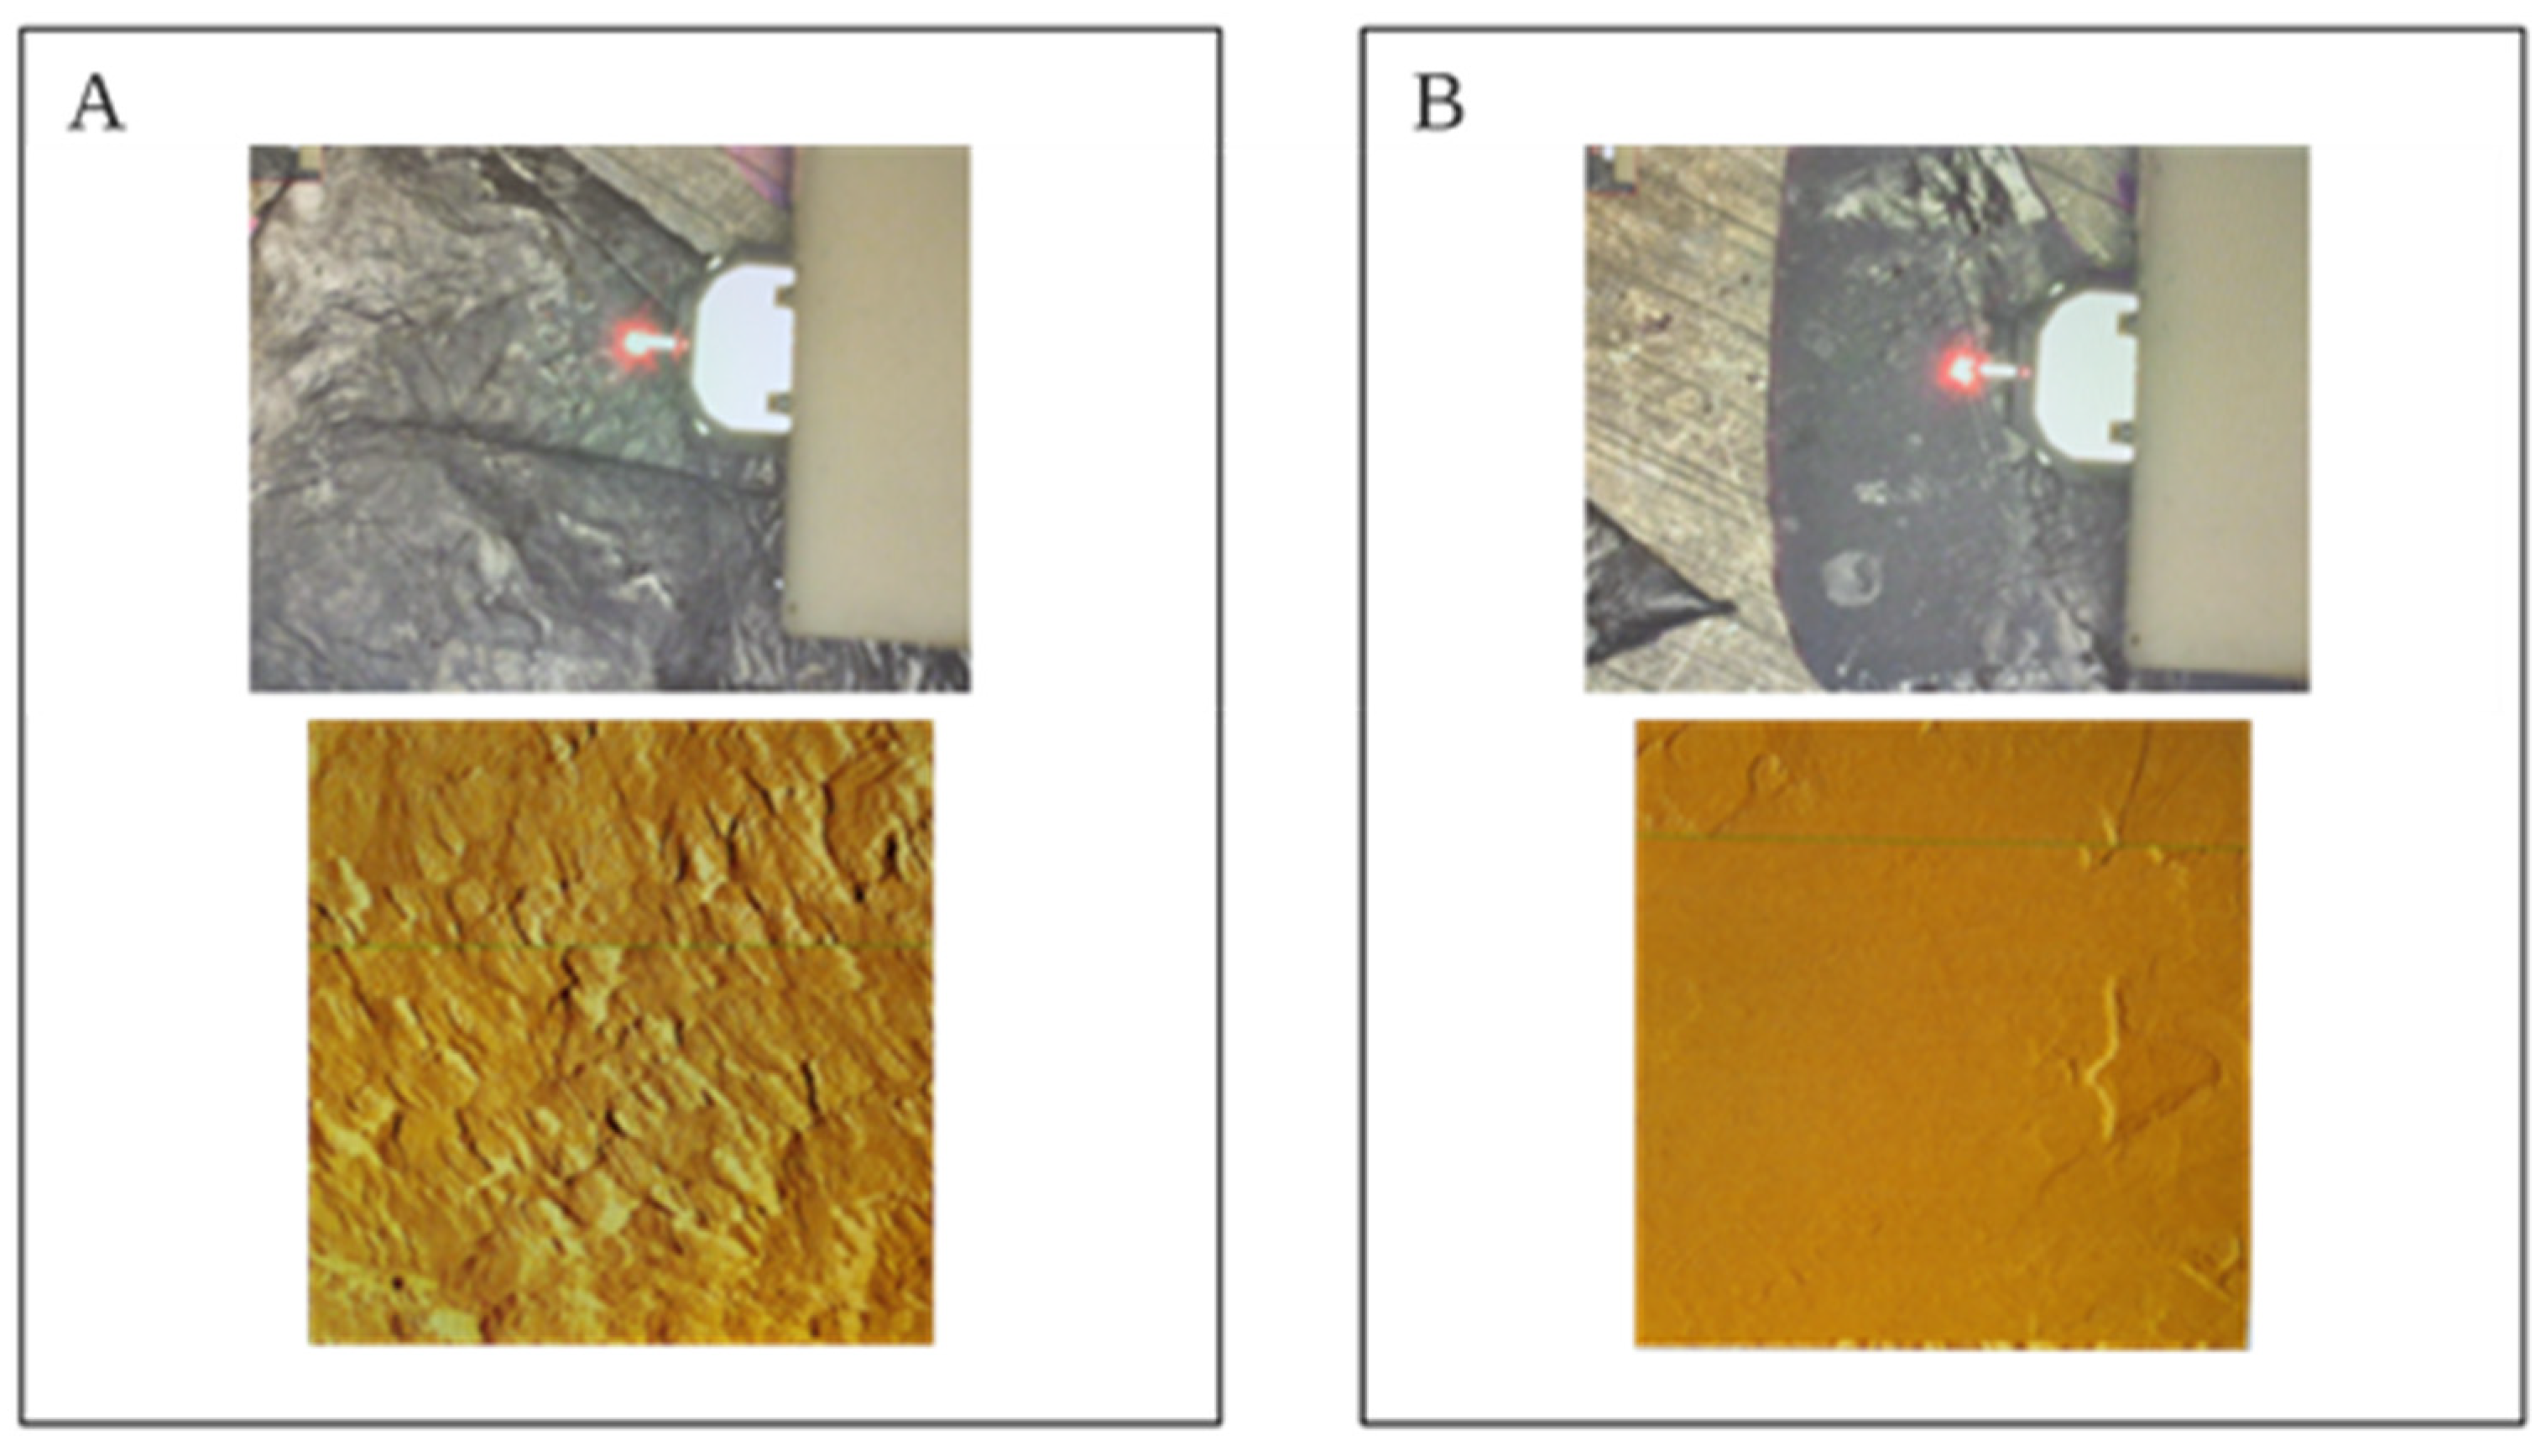
2.2. Atomic Force Microscopy

The surface of treated and untreated grapes was analysed with atomic force microscopy (AFM) to determine any structural damage on the skin after the PL treatment. Topographic measurements of the skins were carried out using a Nano-Observer AFM (Concept Scientific Instruments, Les ULIS, France) operating in resonant mode. A 1-N/m rectangular silicon cantilever (model Fort, AppNano, Mountain View, CA, USA) with an 8-nm nominal tip radius was selected. Typical set point amplitudes of 4–5 volts were used during the measurements with high values of feedback and proportional and integral gains (P and I) to compensate for the high topographic variations (1–4 microns).

2.3. Yeast Strains and Microfermentations

The experimental design used yeast strains with different fermentative competitiveness as starters for the sequential fermentation with Sc. These strains are Torulaspora delbrueckii (Td) strain 1880 (CECT, Valencia, Spain), Schizosaccharomyces pombe (Sp) strain 938 (IFI-938, Madrid, Spain), Metschnikowia pulcherrima (Mp) strain MP 346 (Lallemand Bio, Madrid, Spain), Lachancea thermotolerans (Lt) strain L3.1 (Lallemand Bio, Madrid, Spain) and Hanseniaspora vineae (Hv) (Universidad de la República, Montevideo, Uruguay). Sc strain 7VA (ETSIAAB, Technical University of Madrid, Madrid) was used for pure culture fermentation and for the sequential inoculation of all previous fermentation trials. The population of the inocula used is available in Table 1. All strains were grown in YEPD media (1% yeast extract, 2% bacteriological peptone and 2% D-glucose) (Condalab, Barcelona) at a constant 25 °C for 48 h in an orbital shaker.
The fermentations were carried out in triplicate in 100-mL brown glass flasks with Müller valves for CO2 release. The fermentation volume was 60 mL. One millilitre of each strain was added in each flask and the time was registered as t0. The sequential fermentation took place at day 8 (d8). The fermentation kinetics were followed up by weight loss during the span of the fermentation since it relates to the amount of CO2 produced. The CO2 released was used to estimate the ethanol produced at every stage of the fermentation process (ethanol% v/v), and it was also useful to determine the time for the sequential fermentation to take place. The stoichiometric relation yields two molecules of ethanol and two molecules of CO2 from each hexose fermented. The yeasts’ populations were determined by plate counting every 48 h in YEPD agar medium (yeast extract 1%, peptone 2%, dextrose 2%, agar 1.5%) and a synthetic Lysine agar medium (Oxoid, Hampshire, UK). Total yeasts were counted on YEPD agar plates and non-Saccharomyces were counted on Lysine agar plates. The plates were kept at a constant 25 °C for 48 h.

2.4. Oenological Parameters

The main oenological parameters (sugar concentration, concentration of titratable acids and ethanol) were measured with Fourier transform infrared spectroscopy (FTIR) analysis with a OenoFossTR apparatus (Foss Iberia, Barcelona, Spain). Samples were stirred with the use of a vortex mixer to remove any CO2 trapped to avoid interferences. Then, the samples were filtered with 0.45-μm cellulose methyl ester membrane filters (Phenomenex, Madrid, Spain). For the analysis, 1 mL of filtered wine was needed. The integrated software of the OenoFoss equipment provides these parameters directly. Relative accuracy is >0.95. The pH has been determined with the use of a Crison micropH 2000 pH meter.

2.5. Aromatic Volatile Compounds

Gas chromatography with a flame ionization detector (GC-FID) was used to determine volatile compounds. Samples were injected after filtration through 0.45-μm cellulose methyl ester membrane filters (Phenomenex, Madrid, Spain). An Agilent Technologies 6850 gas chromatograph (Palo Alto, CA, USA) was used. The injection temperature was 250 °C, and the detector temperature was 300 °C. A DB-624 column (60 m × 250 µm × 1.40 µm) was used with a temperature ramp of 40 °C during the first 5 min, followed by a linear increase of 10 °C per minute until 250 °C. This temperature was maintained for 5 min. The total runtime was 40 min per sample. Hydrogen was used as the carrier gas. The peak identification was possible with the retention time of the compounds using a calibration curve in accordance with the method (OIV-MA-AS315-27) [22]. The volatile compounds identified were: acetaldehyde, methanol, 1-propanol, diacetyl, ethyl acetate, 2-butanol, isobutanol, 1-butanol, acetoin, 2-methyl-1-butanol, 3-methyl-1-butanol, ethyl lactate, isobutyl acetate, 2,3-butanediol, isoamyl acetate, 2-phenylethyl acetate and 2-phenylethyl alcohol. One hundred microlitres of internal standard (4-Methyl-2-pentanol, 500 mg/L) (Fluka Chemie GmbH, Buchs, Switzerland) was added to 1-mL test samples. The limit of detection was 1 mg/L. The concentration of the volatiles is expressed as mg/L. This method is in accordance with [23].

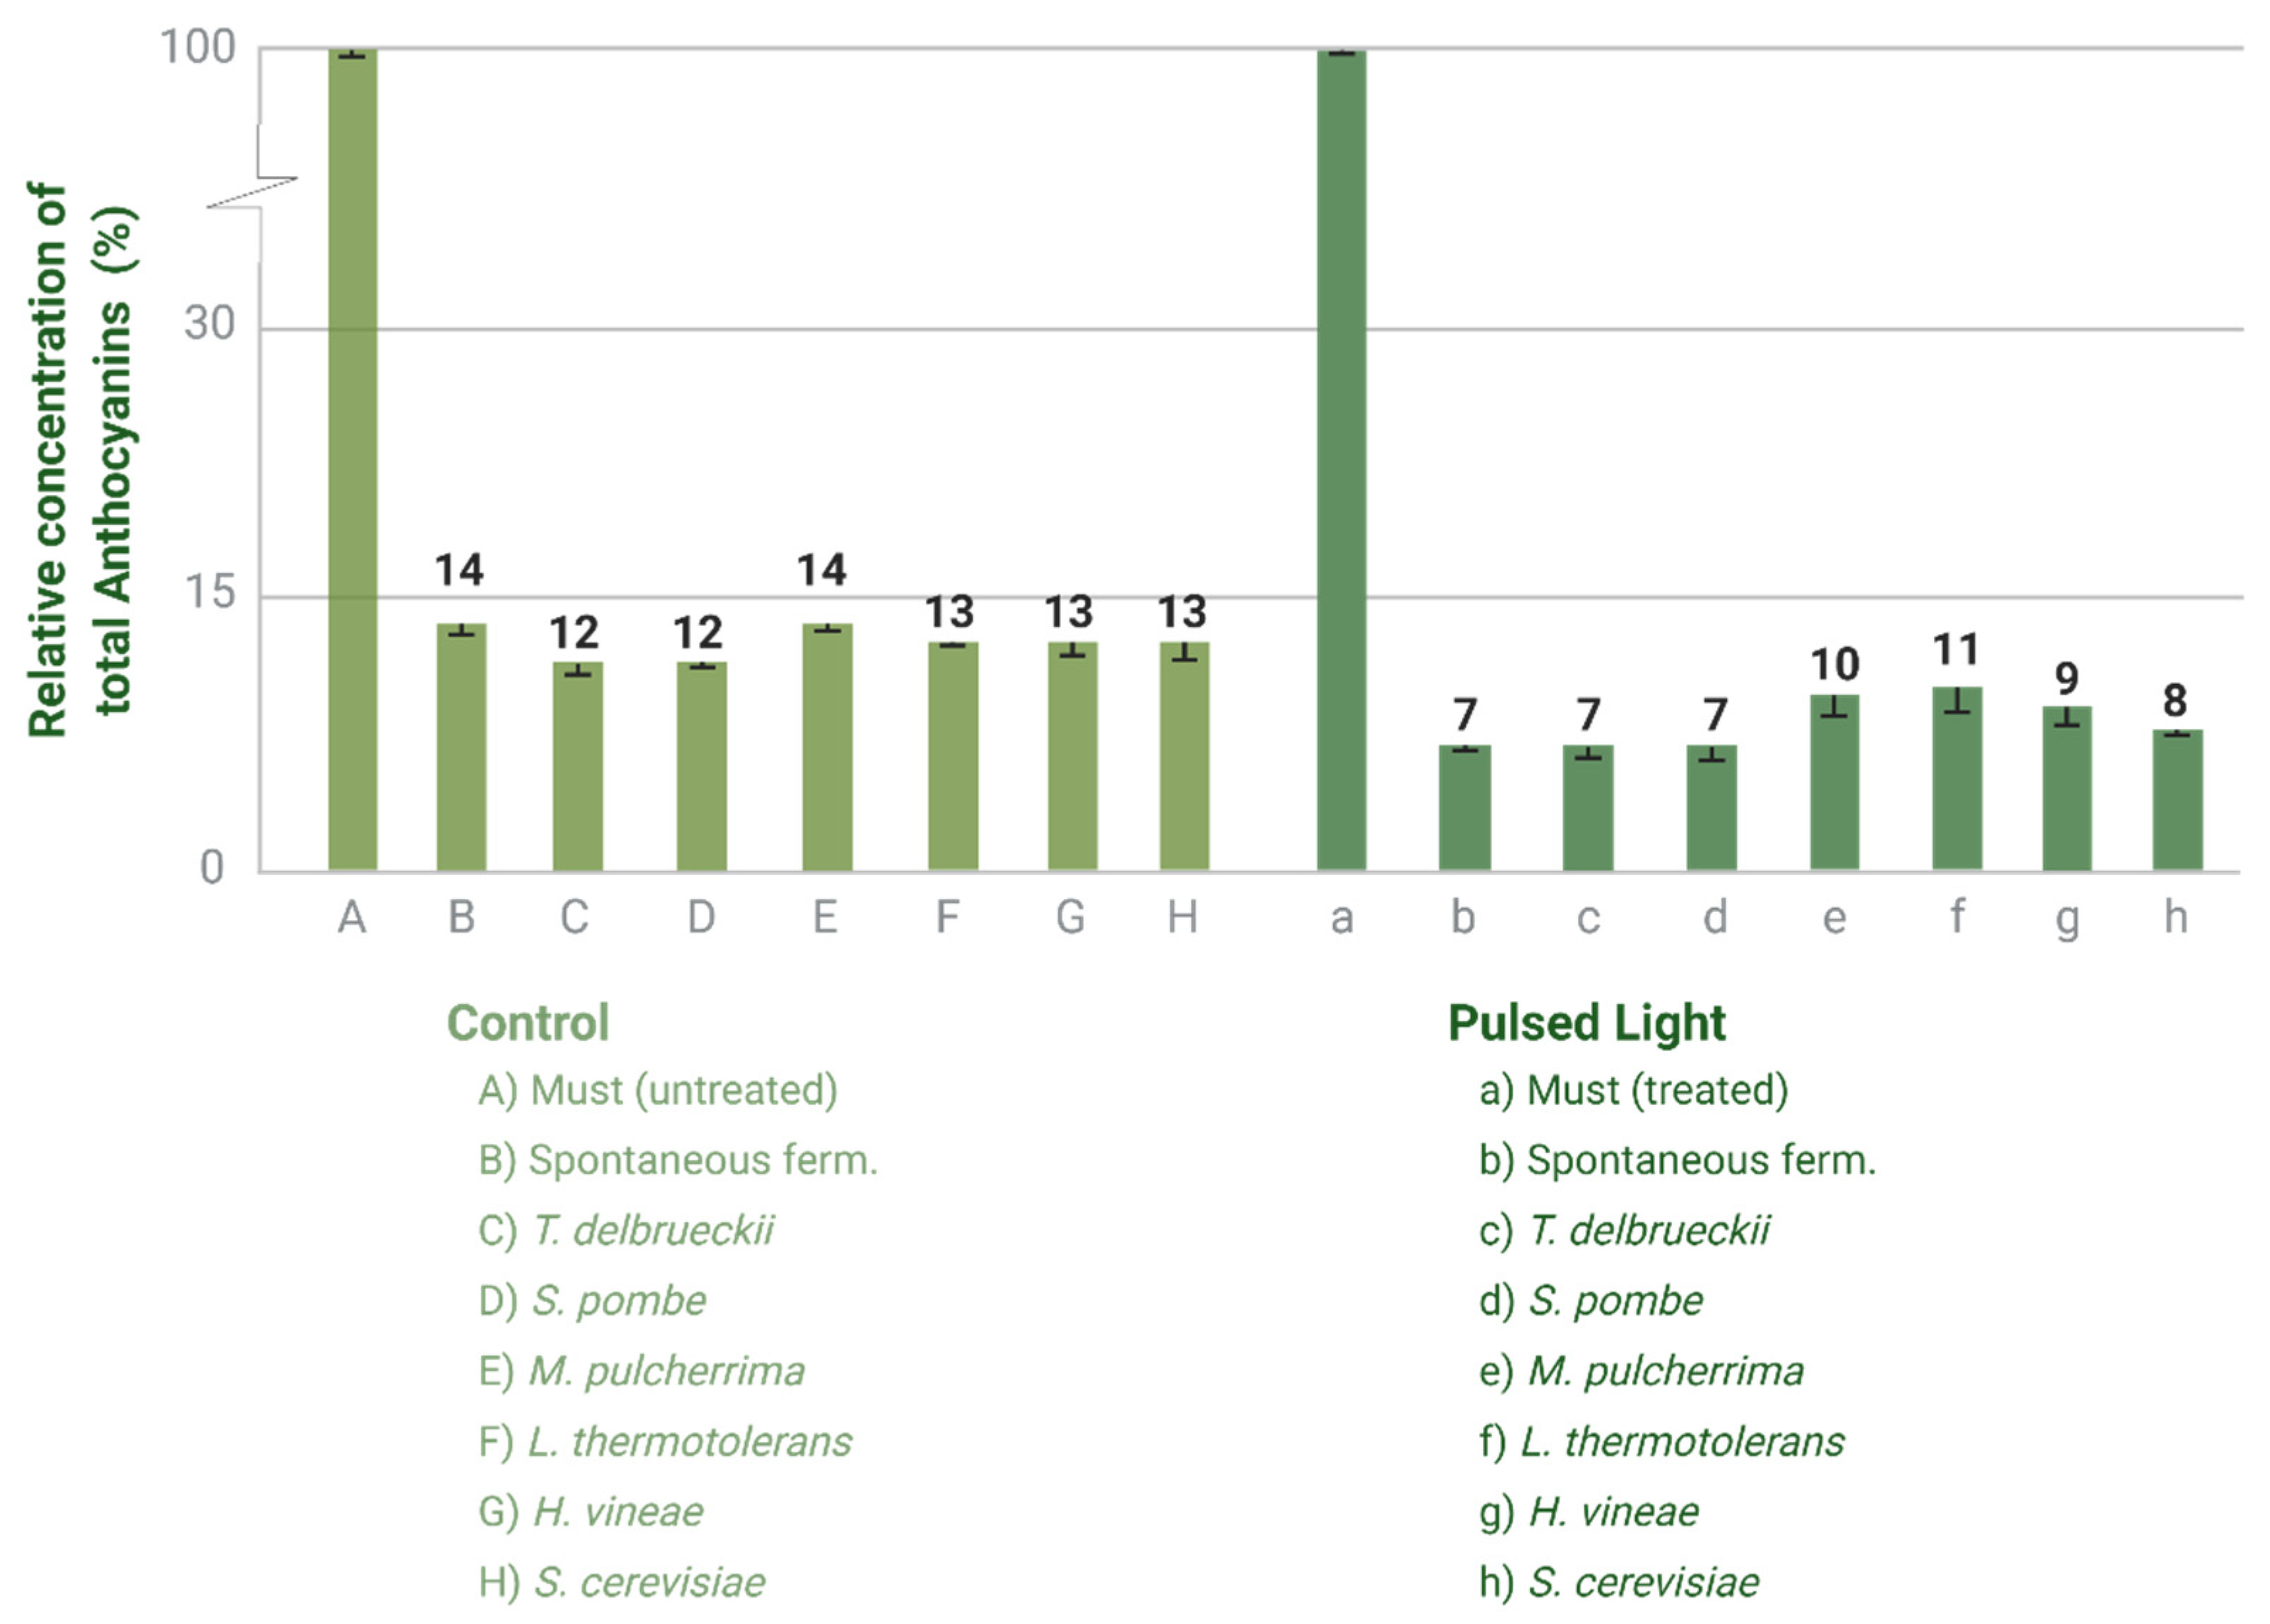
2.6. Anthocyanins Quantification

The anthocyanins were identified and quantified with a series 1100 high performance liquid chromatograph (HPLC) (Hewlett-Packard, Palo Alto, CA, USA), equipped with a diode array detector (DAD). Twenty-microlitre samples of previously filtered (0.45-μm membrane) wines were injected into the HPLC apparatus. Gradients of solvents A (water/formic acid, 95:5 v/v) (Sigma-Aldrich GmbH, Buchs, Switzerland) and B (methanol/formic acid, 95:5 v/v) (Sigma-Aldrich GmbH, Buchs, Switzerland) were used in a reverse-phase Poroshell 120 C18 column (Phenomenex, Torrance, CA, USA) (50 × 4.6 mm; particle size 2.7 μm) as follows: 0–2 min, 15% B (working flow 0.8 mL/min); 2–10 min, 15–50% B linear; 10–12 min, 50% B; 12–13 min, 50–15% B linear; and 13–15 min, re-equilibration. Detection was performed by scanning in the 400–600 nm range. Quantification was performed by comparison against an external standard at 525 nm and expressed as milligram per litre of malvidin-3-O-glucoside (Extrasynthese, Genay Cedex, France) (r2 = 0.9999). Anthocyanins were identified by their retention time and by comparing their UV-visible maximum absorbance. The detection limit was 0.1 mg/L. The method was adapted from [9].

2.7. Statistical Analysis

Statgraphics Centurion 18 software V.18.1.06 (Graphics Software Systems, Rockville, MD, USA) was used to calculate means, standard deviation and ANOVA. One-way ANOVA between groups was performed with the least significant differences (LSD). Significance was set at p < 0.05 for the ANOVA matrix.

3. Results

In this experiment, the temperature increased 2 to 3 °C, as it was documented with a thermal camera before and after the treatment (Figure 1C). Additionally, some roughness on the skin of the berries is observed after pulses are applied (Figure 2) with the use of AFM. No severe damage was found after the treatments.

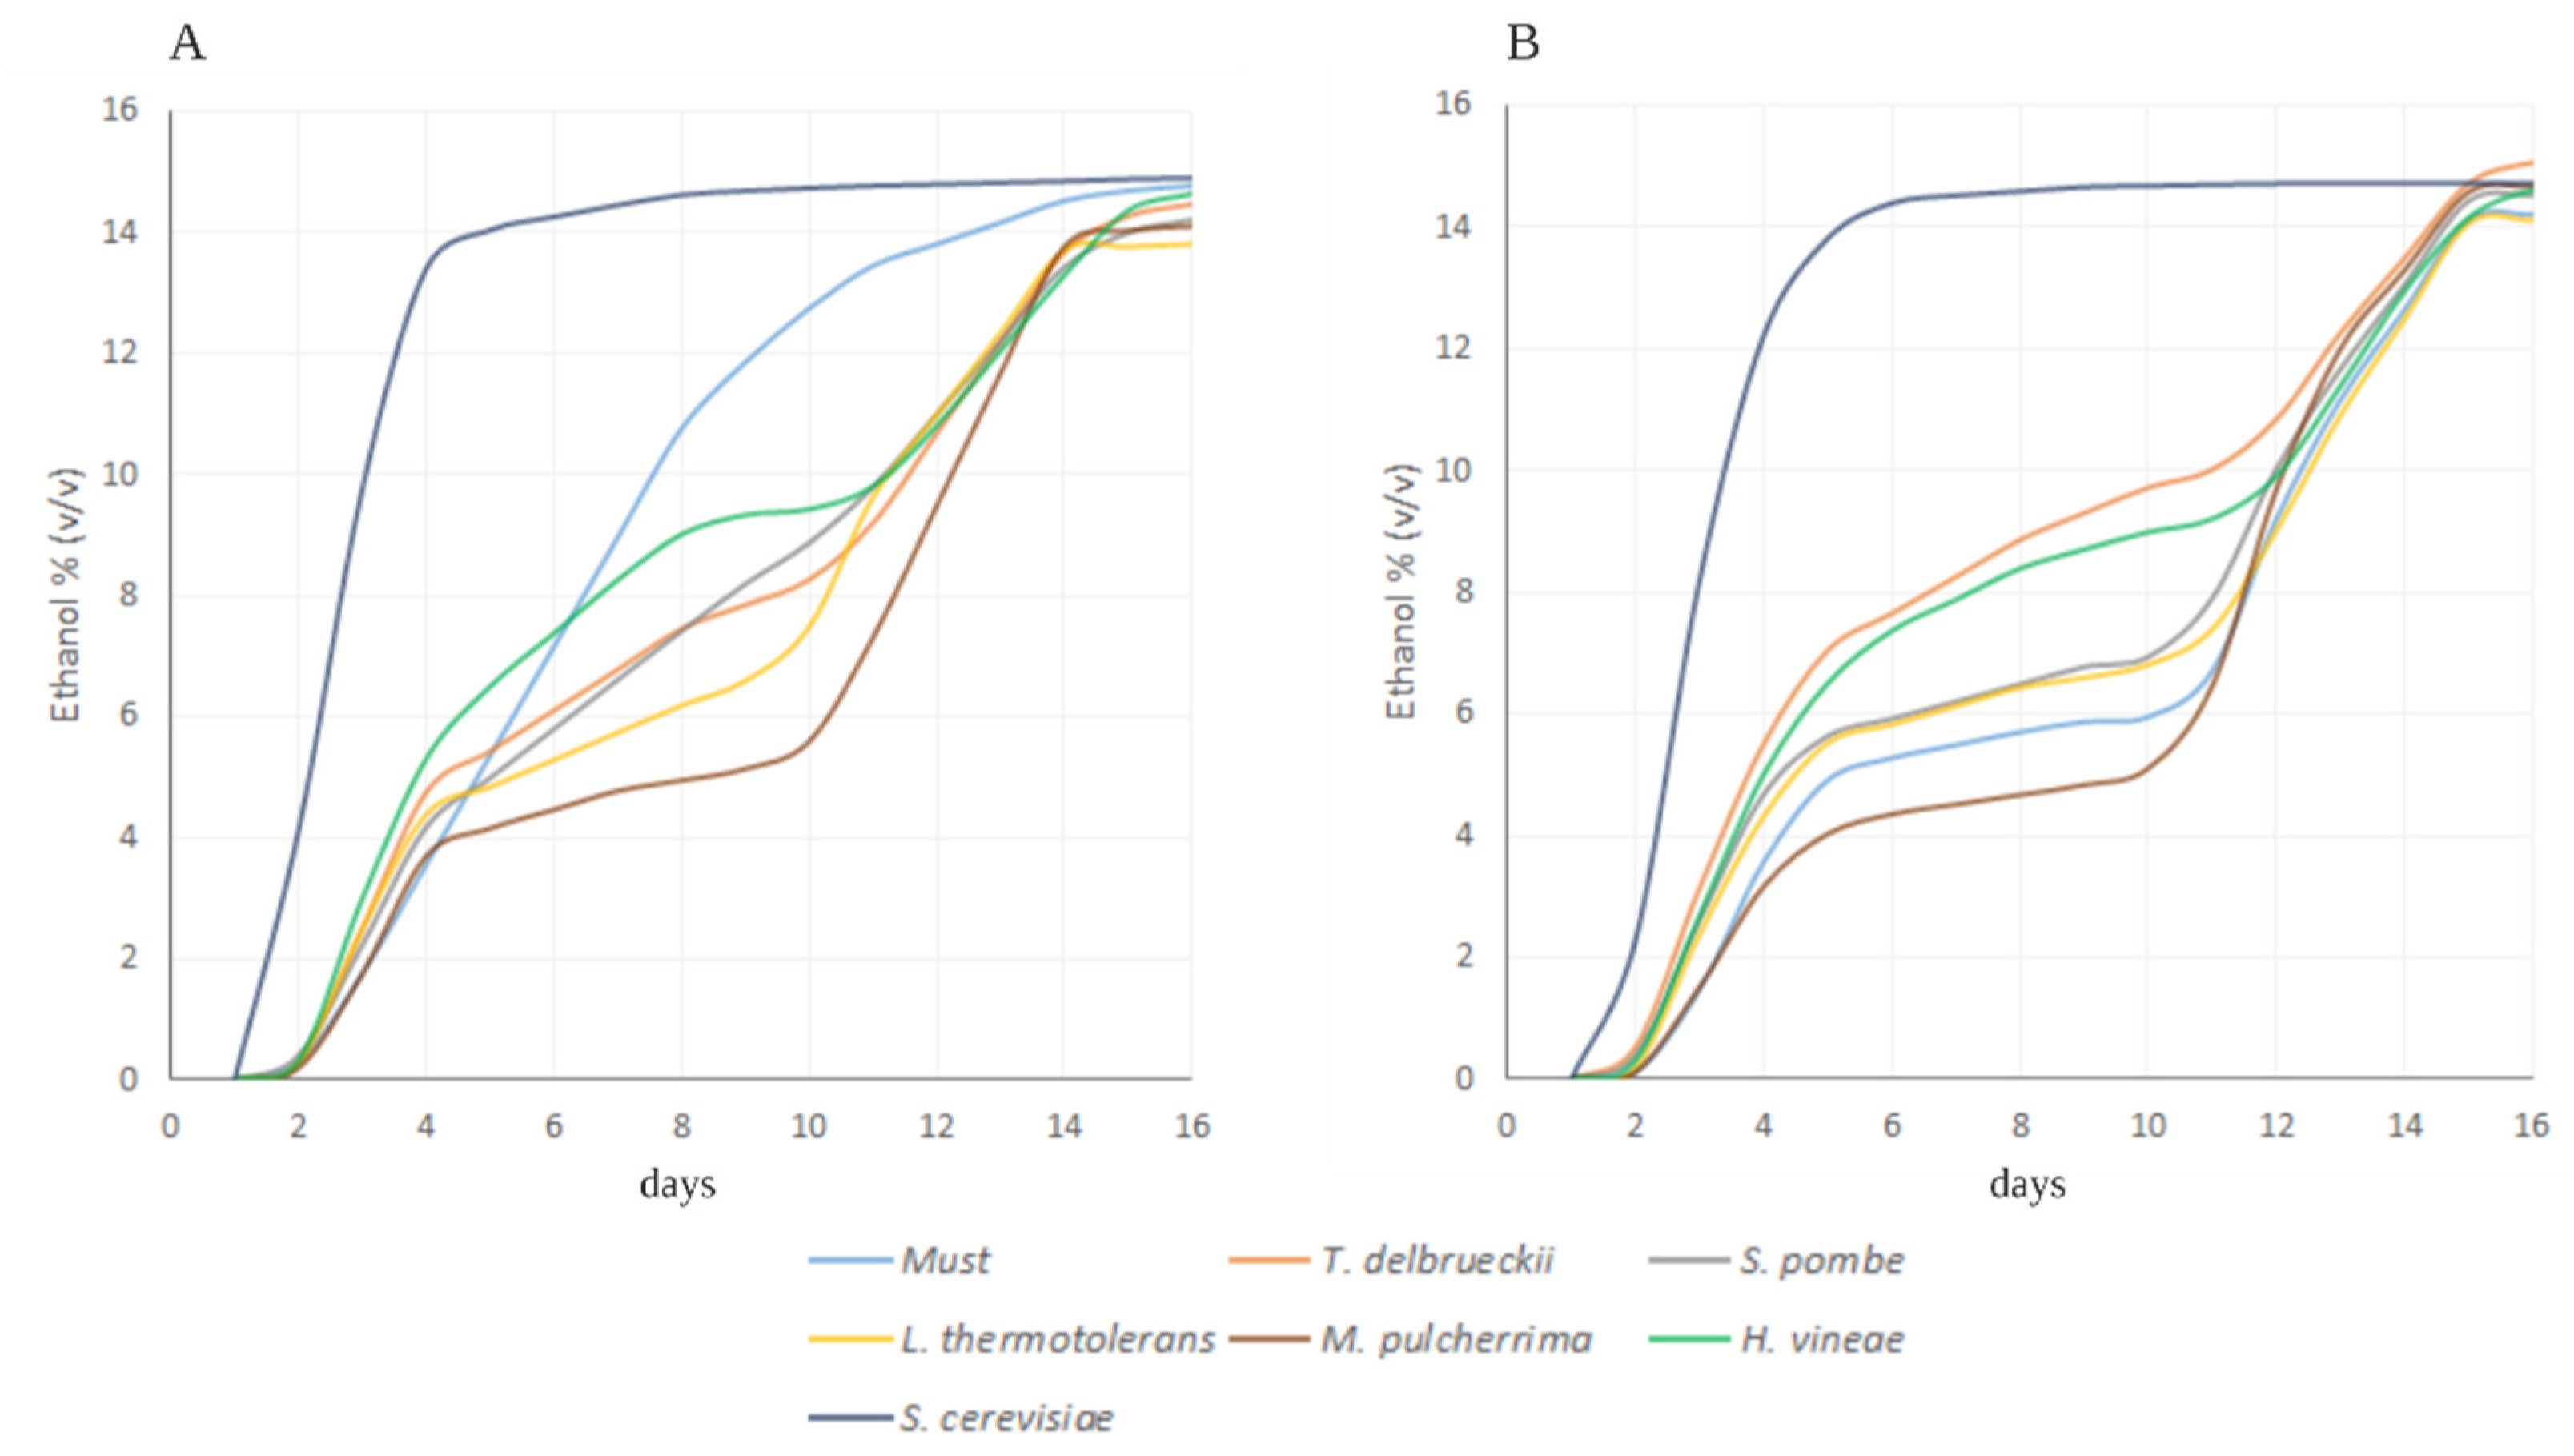
3.1. Microfermentations

The population of wild yeast in the pruina was reduced approximately 1.2 log from 8.8 × 10⁵ CFU/mL, found initially, to 1.1 × 10⁴ CFU/mL after the pulsed light treatment. The fermentation kinetics of musts with both treated and untreated grape are shown in Figure 3. The production of ethanol (% v/v) is estimated for the two weeks that the fermentations spanned as described in Section 2.3.
The must with untreated grapes underwent a rapid uncontrolled fermentative process after a relatively slow start (Figure 3A). In the case of treated grapes, the spontaneous fermentation did not thrive until the sequential inoculation of S. cerevisiae strain 7VA (Figure 3B).

3.2. Oenological Parameters

Table 2 summarises the oenological parameters measured in all vinifications after completion. All vinifications are dry, and the concentration of sugars is below 4 g/L. The pH is significantly lower (3.5–3.6) in the fermentations with L. thermotolerans since the concentration of lactic acid is higher. The concentration of L-malic acid is lower, especially in the untreated vinifications, when non-Saccharomyces strains were inoculated.
Deviations observed in the concentration of L-lactic acid and L-malic acid are further explained in the discussion section. These deviations are more obvious in the vinifications from untreated grapes.

3.3. Volatile Fraction and Phenolic Profile

The volatile compounds and the phenolic profile are shown in Table 3 and Table 4, respectively. The volatile fraction was determined with the use of gas chromatography once the fermentation was completed. The results shown in Table 3 evince the influence of the different yeast strains used as starter cultures and, in the case of the PL treatment (Table 3-B), a more characteristic profile expected for each yeast species.
The TPI and the colour and the hue values observed in the vinifications after completion are shown in Table 4. In both treatments, the TPI observed was higher for the fermentations with S. cerevisiae with statistical significance. In addition, the hue values are above 1.5 units for all vinifications done with treated grapes.
Lastly, the most remarkable difference observed in the colour profile of the wines produced is a greater decrease in anthocyanins, and therefore of colour, in the wines elaborated with treated grapes. The initial concentration of anthocyanins measured in the musts prior to the fermentation was 211.5 mg/L, and no improvement of anthocyanins extraction due to PL was detected. The anthocyanin loss during fermentation is related to the microbial counts and the fermentative process itself. The percentage loss was between 86 and 88% in the case of untreated grapes and between 89 and 93% for treated grapes (Figure 4).

4. Discussion

PL is considered a nonthermal technology, as the global temperature increase at the surface of the berries after treatments is rather low. Although the temperature can increase locally up to 130 °C [24], this increase of temperature does not represent a detriment to the properties of the grape at the macro level. The roughness observed on the grape’s skin after the light pulses is perceived as scales on the surface (Figure 2A), which appear clearer than the actual skin roughness in untreated grapes (Figure 2B). The damage on the skin has been previously documented as a consequence of the disruption caused by the UV-C light component from the flashes [25]. Despite the evidence of disruption documented in previous studies, the roughness observed on the surface of the grapes may not affect the vacuoles containing anthocyanins. This does not produce an increase of anthocyanins concentration in the must, as it has been previously documented for cv. Tempranillo grapes [26].
Structural damage on the skins is then expected to increase the release of polyphenolic compounds, not only anthocyanins, during maceration in the winemaking process on a large scale. This phenomenon may be particularly important for varieties with fewer anthocyanins or wines with short maceration times.

4.1. Microfermentations

The reduction of counts in this experiment is smaller in comparison to reductions of about 5 to 6 log, observed with a different energy applied and different energy density [7,8]. Nonetheless, the reduction in the microbial population achieved with PL treatment affected how the selected yeast strains were implanted, and it also modulated the fermentation kinetics, as observed in Figure 3. The most noteworthy case is the spontaneous fermentation with any inoculated strain. Spontaneous fermentations are carried out in the beginning by non-Saccharomyces yeasts but completed by Saccharomyces strains whose population accounts for 10% at the 3rd day and circa 100% after the 10th day [27].
The phenomenon observed for the spontaneous fermentation with treated grapes was also observed in other fermentations with untreated grapes, as the initial wild population of yeasts was higher and interfered with the inoculum used. Such is the case for S. pombe and T. delbrueckii, with higher levels of ethanol produced at day 8 (Figure 3A). The case of S. pombe is peculiar since the consumption of sugars by this genus, both fructose and glucose, is normally slower [28]; therefore, a pure culture fermentation with this genus would take longer to be completed, whilst fermentations where this genus was inoculated together with a large amount of native yeast strains would carry on faster and in an uncontrolled manner. In general, all fermentations done with treated must seemed to have occurred at a lower rate until the sequential inoculation with S. cerevisiae took place.

4.2. Oenological Parameters

In the same way that the kinetics of fermentation differ from untreated to treated musts during the fermentation process, the oenological parameters show differences. The fermentative strains are responsible for these differences. In this way, a lower pH was expected in the fermentations where L. thermotolerans was inoculated, as observed in the fermentation with treated must, and also in those fermentations where malolactic fermentation (MLF) may have taken place. MLF was prone to occurring with a higher impact in untreated musts (Table 2A), as lactic acid bacteria (LAB) have shown to be less sensitive than yeasts to the same number of PL pulses [9]. This situation can be observed in fermentations with S. pombe and M. pulcherrima, where lactic acid production, presumably produced by LAB, is enhanced in vinifications from untreated grapes.
Regarding L-malic acid concentration, in the fermentations where S. pombe was used, it was expected to be consumed to almost 0 mg/L [29]. In this experiment, both fermentations had a final concentration of 0.5 g/L, but the formation of L-lactic acid suggests that the MLF took place faster and that the depletion of L-malic acid was partially carried out by bacteria and not by S. pombe alone. In all other fermentations where L-malic acid decreased its concentration and L-lactic acid was produced, it is deduced that LAB proliferated and thus produced L-lactic acid to different extents since, microbiology-wise, Schizosaccharomyces is the only genus able to reduce L-malic acid concentration efficiently [30].
The volatile compounds found in wines, including the volatile acids, mainly accounted for by acetic acid, are related to the grape microbiota involved in the fermentation process. Non-Saccharomyces yeasts usually produce volatile acidity in the range of 0.51–0.69 g/L [13]. The wines produced with untreated grapes and more uncontrolled fermentations produced higher amounts of volatile acidity in general than the treated wines (Table 2). From all the microvinifications, the untreated spontaneous one and the untreated inoculated with S. pombe and M. pulcherrima produced the highest concentrations of volatile acidity with 0.5 g/L, 0.6 g/L and 0.7 g/L, respectively. Although the species S. pombe can produce high values of volatile acidity at laboratory scale, usually related to its slower fermentation kinetics [31], the production of volatile acidity in these fermentations might be related to bacterial metabolism and spoilage wild yeast strains. The formation of acetic acid might be related to Indigenous Lactobacilli, the yeast genus Hanseniaspora and other spoilage yeasts genera, such as Pichia, Candida and Saccharomycodes [32].
Finally, although there are statistically significant differences among strains in each treatment, all fermentations were completed and produced wines with less than 4 g/L total sugars and more than 13.6% v/v ethanol.

4.3. Volatile Fraction and Anthocyanin Profile

4.3.1. Aromatic Volatile’s Fraction

In a broad sense, the concentration observed for butanediol was in general higher in the fermentations carried out with PL-treated grapes, while 3-methyl-1-butanol and 2-methyl-1-butanol were generally in higher concentrations in the fermentations done with nontreated grapes. The species Saccharomyces cerevisiae produces high concentrations of butanediol in comparison to other non-Saccharomyces species [33]; thus, a better implantation in a fermentative must is expected to increase the amounts of this metabolite during fermentation. The concentration of higher alcohols has been reported to be directly proportional to the initial concentration of the inoculum [34], as was the case observed in treated grapes. Nonetheless, although the concentration of other higher alcohols is also higher with this fermentative species, in this experiment, the fermentations with nontreated grapes have given higher values in general than the PL-treated grapes. In terms of esters, the overall results do not indicate more influence towards treated and nontreated grapes except for the ethyl lactate, whose concentration tends to be higher in the nontreated grapes. In parallel, the accumulation of ethyl lactate may be closely related to the presence of lactic acid bacteria [35], which normally takes place during MLF with the conversion of L-malic acid into L-lactic acid and lactic acid producer yeasts, such as L. thermotolerans. Nontreated grapes are prone to having larger amounts of Indigenous strains, whilst PL-treated grapes reduce their counts and their influence in the volatile aroma profile of wines.
On the other hand, judging the microfermentations by strain, some differences may be attributed to a better implantation of yeasts after PL treatment in treated grape musts. T. delbrueckii has been reported to increase the concentration of aromatic compounds as fruity esters, such as isoamyl acetate, and decrease unwanted aromas, such as higher alcohols [36]. Such a decrease relates to pure culture fermentation with Saccharomyces cerevisae. Sequential fermentations of T. delbrueckii with S. cerevisiae yield lower values of 3-methyl-1-butanol [37].
PL-treated wines reported higher amounts of isobutyl acetate, ethyl acetate and isoamyl acetate, and lower concentrations of 2-methyl-1-butanol and 3-methyl-1-butanol. For fermentations carried out with S. pombe, in addition to the notorious decrease of malic acid expected, there are no particular off-flavours associated with this yeast species [28]; nonetheless, the nontreated grapes have produced wines with larger amounts of higher alcohols, especially 3-methyl-1-butanol, and considerably higher amounts of acetoin than the PL-treated grapes. Wine with PL-treated grapes had a higher concentration of ethyl lactate and ethyl acetate, which may contribute to enhancing the wine’s aroma. L. thermotolerans is known as a producer of variable amounts of L-lactic acid and to promote the production of 2-phenylethanol and glycerol [38]. The fermentations done with H. vineae are very similar in volatile compounds, except for the concentration of ethyl lactate observed in the nontreated wine. An increase of floral and fruity aromas was expected in these last wines from the production of 2-phenylethanol, as a consequence of its particular metabolism of phenylpropanoid-related compounds [39], but this was not the case. Lastly, the fermentations done with M. pulcherrima and S. cerevisiae do not have noticeable differences between treated and nontreated grapes in general, except for the higher concentration of ethyl acetate with the first species and ethyl lactate with the latter species in the treated wines. A higher concentration of esters would give wines a floral and fruity aroma and, together with other fermentative metabolites, such as higher alcohols, volatile fatty acids, carbonyl compounds and sulphur compounds, is important for the overall sensorial profile of wines [40].
In accordance with Lu et al. [41], spontaneous fermentations tend to increase the total amount of volatile compounds as a consequence of the proliferation of apiculate yeasts at the initial steps of the fermentation. In this last matter, S. cerevisiae strains used in sequential fermentations carried out with starter cultures have shown to modulate the expression of attributes observed in fermentations with non-Saccharomyces yeasts [42], which can be understood as a decrease of aromatic compounds, including esters, in comparison to spontaneous fermentations. This observation is valid for the spontaneous fermentations in both treatments. Finally, the use of PL has demonstrated an effect on the profile of volatile, as well as nonvolatile, compounds. Such is the case for the treatment of shiitake mushrooms to improve the synthesis of Vitamin D2 [43]. In this experimental set up, none of the variations observed in the volatile profile can be attributed to the use of PL with the established working conditions. Nonetheless, this effect is to be studied for larger fluences.

4.3.2. Anthocyanin’s Profile

It is well documented that yeast strains are capable of removing anthocyanins from the fermentative media through adsorption through the cell walls [44], although the loss occurs mainly at the end of the fermentation when the cell viability is lower and the yeasts cells are permeabilised [45]. The composition of the cell walls and the polarity of the anthocyanins are two factors involved in this interaction [46]. In this regard, Saccharomyces cerevisiae strains had a special affinity for acyl-derivatives over nonacylated anthocyanin derivatives [44]. Differences in the amount of anthocyanins adsorbed have been recorded based on the yeast genera [46], but differences within strains from the same genus may also be expected. Other parameters involved in how anthocyanins are adsorbed into cell walls are the pH value, ethanol concentration, SO2 concentration and temperature [47]. In terms of the total amount of anthocyanins adsorbed by cell walls, Saccharomyces strains can remove between 1.6% and 5.85% from the initial pigment concentration [48]. Therefore, if the initial concentration is already low, the reduction due to adsorption would be more evident. In this experiment, the fermentations where the yeast strains had more impact on the final concentration of anthocyanins are those where the strains of T. delbrueckii and S. pombe were used. On the other hand, the fermentations carried out with strains of M. pulcherrima and L. thermotolerans retained the highest amount of anthocyanins in solution. Despite the fact that yeast strains interacted with anthocyanins during fermentation, causing colour loss by the deglycosylation of anthocyanins and pigment adsorption, other chemical interactions (oxidation, interactions with pyruvate, acetaldehyde, flavanols, condensed tannins, etc.) may have caused an even larger reduction of anthocyanins and, as a consequence, of total phenolic compounds [45]. Due to the small fermentation volume used, the skins were removed after the grapes were crushed, and the pigment’s extraction was limited. The reduction of anthocyanins is more evident in small fermentation volumes without skin maceration.
Another consequence of the higher interaction of the strains in the treated must is the higher values obtained for the hue (Table 4). This can be explained by a higher loss of acyl-derivatives, promoting the reduction of blue colour and increasing the yellow fraction in wines [44]. Acetylated anthocyanins in particular are very important for predicting the colour of wines noticeable by the naked eye [49]. The values for CI correspond to the concentration of anthocyanins measured and are therefore higher for the wines produced from the untreated must, as are the total polyphenolic index (TPI) values. Occasionally, Saccharomyces cerevisiae has less β-glucosidase strain-related activity than non-Saccharomyces yeasts in spontaneous and inoculated fermentations [50]. Moreover, this strain has also rapider fermentation kinetics. These two features may have resulted in higher TPI and CI values.

5. Conclusions

The use of PL to reduce the Indigenous yeast strains in late harvest grapes has demonstrated its suitability for the implantation of selected yeast strains, in particular for the use of Lachancea thermotolerans, which is interesting for the increase of L-lactic acid during winemaking in warm areas. Starter cultures have better options to thrive once the native strains reduce their counts without the use of SO2. Nonetheless, the energy density used for the pretreatment should be higher, or the number of pulses larger, to avoid the opportunity for bacteria to thrive and coferment with the starter culture. Low fluence treatments, below 1 J/cm2, may be prone to poorly reducing microbial counts. The drawback observed at laboratory scale regarding colour loss should not be a problem on a large scale where it is possible to have musts with a proper maceration time; however, even so, the higher loss observed in wines produced with treated must calls for a larger number of counts and a better implantation. The efficiency of this nonthermal technology is yet to be tested on a large scale in liquids with the opacity, particle distribution, and density of wine must as a pretreatment after crushing to reduce the use of SO2 as much as possible. Finally, other effects of the use of PL to be considered include the stability of colour and the organoleptic properties of wine over time.

Author Contributions

Conceptualization, A.M.; Data curation, C.E., C.L. and I.L.; Formal analysis, C.E., I.L., M.A.B. and W.T.; Investigation, C.E., C.L. and I.L.; Methodology, C.E., C.L. and I.L.; Project administration, A.M.; Resources, A.M.; Software, I.L.; Supervision, J.A.S.-L. and A.M.; Validation, C.G. and A.M.; Visualization, A.M.; Writing—original draft, C.E. and I.L.; Writing—review and editing, C.L., C.G., M.A.B., W.T. and J.A.S.-L. All authors have read and agreed to the published version of the manuscript.

Funding

This research was funded by MICINN (Ministerio de Ciencia, Innovación y Universidades -Spain), grant number RTI2018-096626-B-100.

Data Availability Statement

No new data were created or analysed in this study. Data sharing is not applicable to this article.

Acknowledgments

Special thanks to Pilar Baeza and Juan Manuel del Fresno for the grapes collected for this experimental setup.

Conflicts of Interest

The authors declare no conflict of interest.

References

  1. MacGregor, S.J.; Rowan, N.J.; McIlvaney, L.; Anderson, J.G.; Fouracre, R.A.; Farish, O. Light inactivation of food-related pathogenic bacteria using a pulsed power source. Lett. Appl. Microbiol. 1998, 27, 67–70. [Google Scholar] [CrossRef]
  2. Rowan, N.J.; MacGregor, S.J.; Anderson, J.G.; Fouracre, R.A.; McIlvaney, L.; Farish, O. Pulsed-Light Inactivation of Food-Related Microorganisms. Appl. Environ. Microbiol. 1999, 65, 1312–1315. [Google Scholar] [CrossRef] [PubMed] [Green Version]
  3. Dunn, J. Pulsed light and pulsed electric field for foods and eggs. Poult. Sci. 1996, 75, 1133–1136. [Google Scholar] [CrossRef]
  4. Anderson, J.G.; Rowan, N.J.; MacGregor, S.J.; Fouracre, R.A.; Parish, O. Inactivation of food-borne enteropathogenic bacteria and spoilage fungi using pulsed-light. IEEE Trans. Plasma Sci. 2000, 28, 83–88. [Google Scholar] [CrossRef]
  5. Kramer, B.; Wunderlich, J.; Muranyi, P. Recent findings in pulsed light disinfection. J. Appl. Microbiol. 2017, 122, 830–856. [Google Scholar] [CrossRef] [Green Version]
  6. Nannelli, F.; Claisse, O.; Gindreau, E.; De Revel, G.; Lonvaud-Funel, A.; Lucas, P.M. Determination of lactic acid bacteria producing biogenic amines in wine by quantitative PCR methods. Lett. Appl. Microbiol. 2008, 47, 594–599. [Google Scholar] [CrossRef] [PubMed]
  7. Elmnasser, N.; Guillou, S.; Leroi, F.; Orange, N.; Bakhrouf, A.; Federighi, M. Pulsed-light system as a novel food decontamination technology: A review. Can. J. Microbiol. 2007, 53, 813–821. [Google Scholar] [CrossRef] [Green Version]
  8. Gómez-López, V.M.; Ragaert, P.; Debevere, J.; Devlieghere, F. Pulsed light for food decontamination: A review. Trends Food Sci. Technol. 2007, 18, 464–473. [Google Scholar] [CrossRef]
  9. Escott, C.; Vaquero, C.; del Fresno, J.M.; Bañuelos, M.A.; Loira, I.; Han, S.; Bi, Y.; Morata, A.; Suárez-Lepe, J.A. Pulsed light effect in red grape quality and fermentation. Food Bioprocess Technol. 2017, 10, 1540–1547. [Google Scholar] [CrossRef]
  10. Pérez-López, A.J.; Rodríguez-López, M.I.; Burló, F.; Carbonell-Barrachina, Á.A.; Gabaldón, J.A.; Gómez-López, V.M. Evaluation of Pulsed Light to Inactivate Brettanomyces bruxellensis in White Wine and Assessment of Its Effects on Color and Aromatic Profile. Foods 2020, 9, 1903. [Google Scholar] [CrossRef] [PubMed]
  11. Santamera, A.; Escott, C.; Loira, I.; Del Fresno, J.M.; González, C.; Morata, A. Pulsed light: Challenges of a non-thermal sanitation technology in the winemaking industry. Beverages 2020, 6, 45. [Google Scholar] [CrossRef]
  12. Morata, A.; Loira, I.; Guamis, B.; Raso, J.; del Fresno, J.M.; Escott, C.; Bañuelos, M.A.; Álvarez, I.; Tesfaye, W.; González, C.; et al. Emerging Technologies to Increase Extraction, Control Microorganisms, and Reduce SO2. In Winemaking—Stabilization, Aging Chemistry and Biochemistry; Cosme, F., Ed.; IntechOpen: London, UK, 2020; pp. 1–20. [Google Scholar]
  13. Liu, P.T.; Lu, L.; Duan, C.Q.; Yan, G.L. The contribution of indigenous non-Saccharomyces wine yeast to improved aromatic quality of Cabernet Sauvignon wines by spontaneous fermentation. LWT—Food Sci. Technol. 2016, 71, 356–363. [Google Scholar] [CrossRef]
  14. Pinto, L.; Baruzzi, F.; Cocolin, L.; Malfeito-Ferreira, M. Emerging technologies to control Brettanomyces spp. in wine: Recent advances and future trends. Trends Food Sci. Technol. 2020, 99, 88–100. [Google Scholar] [CrossRef]
  15. Avalos-Llano, K.R.; Martín-Belloso, O.; Soliva-Fortuny, R. Effect of pulsed light treatments on quality and antioxidant properties of fresh-cut strawberries. Food Chem. 2018, 264, 393–400. [Google Scholar] [CrossRef] [PubMed]
  16. Kwaw, E.; Ma, Y.; Tchabo, W.; Tibiru Apaliya, M.; Sackle Sackey, A.; Wu, M.; Xiao, L. Effect of pulsed light treatment on the phytochemical, volatile, and sensorial attributes of lactic-acid-fermented mulberry juice. Int. J. Food Prop. 2018, 21, 213–228. [Google Scholar] [CrossRef]
  17. Kwaw, E.; Ma, Y.; Tchabo, W.; Apaliya, M.T.; Sackey, A.S.; Wu, M.; Xiao, L. Impact of ultrasonication and pulsed light treatments on phenolics concentration and antioxidant activities of lactic-acid-fermented mulberry juice. LWT—Food Sci. Technol. 2018, 92, 61–66. [Google Scholar] [CrossRef]
  18. Rodov, V.; Vinokur, Y.; Horev, B. Brief postharvest exposure to pulsed light stimulates coloration and anthocyanin accumulation in fig fruit (Ficus carica L.). Postharvest Biol. Technol. 2012, 68, 43–46. [Google Scholar] [CrossRef]
  19. Morata, A.; González, C.; Tesfaye, W.; Loira, I.; Suárez-Lepe, J.A. Maceration and Fermentation: New Technologies to Increase Extraction. In Red Wine Technology; Morata, A., Ed.; Elsevier: Amsterdam, The Netherlands, 2018; pp. 35–49. ISBN 9780128144008. [Google Scholar]
  20. Bintsis, T.; Litopoulou-Tzanetaki, E.; Robinson, R.K. Existing and potential applications of ultraviolet light in the food industry—A critical review. J. Sci. Food Agric. 2000, 80, 637–645. [Google Scholar] [CrossRef]
  21. Wright, J.R.; Sumner, S.S.; Hackney, C.R.; Pierson, M.D.; Zoecklein, B.W. Efficacy of Ultraviolet Light for Reducing Escherichia coli O157:H7 in Unpasteurized Apple Cider. J. Food Prot. 2000, 63, 563–567. [Google Scholar] [CrossRef]
  22. OIV. Analysis of Volatile Compounds in Wines by Gas Chromatography; OIV: Paris, France, 2016. [Google Scholar]
  23. Bañuelos, M.A.; Loira, I.; Buenaventura, G.; Escott, C.; del Fresno, J.M.; Codina-Torrella, I.; Quevedo, J.M.; Gervilla, R.; Rodríguez Chavarría, J.M.; de Lamo, S.; et al. White wine processing by UHPH without SO2. Elimination of microbial populations and effect in oxidative enzymes, colloidal stability and sensory quality. Food Chem. 2020, 332, 127417. [Google Scholar] [CrossRef] [PubMed]
  24. Wekhof, A. Disinfection with flash lamps. PDA J. Pharm. Sci. Technol. 2000, 54, 264–276. [Google Scholar]
  25. Fava, J.; Hodara, K.; Nieto, A.; Guerrero, S.; Alzamora, S.M.; Castro, M.A. Structure (micro, ultra, nano), color and mechanical properties of Vitis labrusca L. (grape berry) fruits treated by hydrogen peroxide, UV-C irradiation and ultrasound. Food Res. Int. 2011, 44, 2938–2948. [Google Scholar] [CrossRef]
  26. Morata, A.; Loira, I.; Vejarano, R.; González, C.; Callejo, M.J.; Suárez-Lepe, J.A. Emerging preservation technologies in grapes for winemaking. Trends Food Sci. Technol. 2017, 67, 36–43. [Google Scholar] [CrossRef]
  27. Medina, K.; Boido, E.; Fariña, L.; Gioia, O.; Gómez, M.; Barquet, M.; Gaggero, C.; Dellacassa, E.; Carrau, F. Increased flavour diversity of Chardonnay wines by spontaneous fermentation and co-fermentation with Hanseniaspora vineae. Food Chem. 2013, 141, 2513–2521. [Google Scholar] [CrossRef] [PubMed]
  28. Loira, I.; Morata, A.; Palomero, F.; González, C.; Suárez-Lepe, J.A. Schizosaccharomyces pombe: A promising biotechnology for modulating wine composition. Fermentation 2018, 4, 70. [Google Scholar] [CrossRef] [Green Version]
  29. Suárez-Lepe, J.A.; Morata, A. New trends in yeast selection for winemaking. Trends Food Sci. Technol. 2012, 23, 39–50. [Google Scholar] [CrossRef]
  30. Suárez-Lepe, J.A.; Palomero, F.; Benito, S.; Calderón, F.; Morata, A. Oenological versatility of Schizosaccharomyces spp. Eur. Food Res. Technol. 2012, 235, 375–383. [Google Scholar] [CrossRef]
  31. Loira, I.; Morata, A.; Comuzzo, P.; Callejo, M.J.; González, C.; Calderón, F.; Suárez-Lepe, J.A. Use of Schizosaccharomyces pombe and Torulaspora delbrueckii strains in mixed and sequential fermentations to improve red wine sensory quality. Food Res. Int. 2015, 76, 325–333. [Google Scholar] [CrossRef] [PubMed]
  32. Vilela, A. Lachancea thermotolerans, the Non-Saccharomyces Yeast that Reduces the Volatile Acidity of Wines. Fermentation 2018, 4, 56. [Google Scholar] [CrossRef] [Green Version]
  33. Clemente-Jimenez, J.M.; Mingorance-Cazorla, L.; Martínez-Rodríguez, S.; Las Heras-Vázquez, F.J.; Rodríguez-Vico, F. Molecular characterization and oenological properties of wine yeasts isolated during spontaneous fermentation of six varieties of grape must. Food Microbiol. 2004, 21, 149–155. [Google Scholar] [CrossRef]
  34. Mateo, J.J.; Jiménez, M.; Pastor, A.; Huerta, T. Yeast starter cultures affecting wine fermentation and volatiles. Food Res. Int. 2001, 34, 307–314. [Google Scholar] [CrossRef]
  35. Cappello, M.S.; Zapparoli, G.; Logrieco, A.; Bartowsky, E.J. Linking wine lactic acid bacteria diversity with wine aroma and flavour. Int. J. Food Microbiol. 2017, 243, 16–27. [Google Scholar] [CrossRef] [PubMed]
  36. Ramírez, M.; Velázquez, R. The Yeast Torulaspora delbrueckii: An Interesting But Difficult-To-Use Tool for Winemaking. Fermentation 2018, 4, 94. [Google Scholar] [CrossRef] [Green Version]
  37. Loira, I.; Vejarano, R.; Bañuelos, M.A.; Morata, A.; Tesfaye, W.; Uthurry, C.; Villa, A.; Cintora, I.; Suárez-Lepe, J.A. Influence of sequential fermentation with Torulaspora delbrueckii and Saccharomyces cerevisiae on wine quality. LWT—Food Sci. Technol. 2014, 59, 915–922. [Google Scholar] [CrossRef] [Green Version]
  38. Morata, A.; Loira, I.; Tesfaye, W.; Bañuelos, M.A.; González, C.; Suárez Lepe, J.A. Lachancea thermotolerans applications in wine technology. Fermentation 2018, 4, 53. [Google Scholar] [CrossRef] [Green Version]
  39. Martin, V.; Giorello, F.; Fariña, L.; Minteguiaga, M.; Salzman, V.; Boido, E.; Aguilar, P.S.; Gaggero, C.; Dellacassa, E.; Mas, A.; et al. De novo synthesis of benzenoid compounds by the yeast Hanseniaspora vineae increases the flavor diversity of wines. J. Agric. Food Chem. 2016, 64, 4574–4583. [Google Scholar] [CrossRef] [Green Version]
  40. Swiegers, J.H.; Bartowsky, E.J.; Henschke, P.A.; Pretorius, I.S. Yeast and bacterial modulation of wine aroma and flavour. Aust. J. Grape Wine Res. 2005, 11, 139–173. [Google Scholar] [CrossRef]
  41. Lu, Y.; Sun, F.; Wang, W.; Liu, Y.; Wang, J.; Sun, J.; Mu, J.; Gao, Z. Effects of spontaneous fermentation on the microorganisms diversity and volatile compounds during “Marselan” from grape to wine. LWT—Food Sci. Technol. 2020, 134, 110193. [Google Scholar] [CrossRef]
  42. Domizio, P.; Romani, C.; Lencioni, L.; Comitini, F.; Gobbi, M.; Mannazzu, I.; Ciani, M. Outlining a future for non-Saccharomyces yeasts: Selection of putative spoilage wine strains to be used in association with Saccharomyces cerevisiae for grape juice fermentation. Int. J. Food Microbiol. 2011, 147, 170–180. [Google Scholar] [CrossRef]
  43. Xiaokang, W.; Brunton, N.P.; Lyng, J.G.; Harrison, S.M.; Carpes, S.T.; Papoutsis, K. Volatile and non-volatile compounds of shiitake mushrooms treated with pulsed light after twenty-four hour storage at different conditions. Food Biosci. 2020, 36, 100619. [Google Scholar] [CrossRef]
  44. Morata, A.; Gómez-Cordovés, M.C.; Suberviola, J.; Bartolomé, B.; Colomo, B.; Suárez, J.A. Adsorption of Anthocyanins by Yeast Cell Walls during the Fermentation of Red Wines. J. Agric. Food Chem. 2003, 51, 4084–4088. [Google Scholar] [CrossRef]
  45. Echeverrigaray, S.; Scariot, F.J.; Menegotto, M.; Delamare, A.P.L. Anthocyanin adsorption by Saccharomyces cerevisiae during wine fermentation is associated to the loss of yeast cell wall/membrane integrity. Int. J. Food Microbiol. 2020, 314, 108383. [Google Scholar] [CrossRef] [PubMed]
  46. Morata, A.; Escott, C.; Loira, I.; Del Fresno, J.M.; González, C.; Suárez-Lepe, J.A. Influence of Saccharomyces and non-Saccharomyces Yeasts in the Formation of Pyranoanthocyanins and Polymeric Pigments during Red Wine Making. Molecules 2019, 24, 4490. [Google Scholar] [CrossRef] [Green Version]
  47. Vasserot, Y.; Caillet, S.; Maujean, A. Study of Anthocyanin Adsorption by Yeast Lees. Effect of Some Physicochemical Parameters. Am. J. Enol. Vitic. 1997, 48, 433–437. [Google Scholar]
  48. Morata, A.; Gómez-Cordovés, M.C.; Colomo, B.; Suárez, J.A. Cell wall anthocyanin adsorption by different Saccharomyces strains during the fermentation of Vitis vinifera L. cv Graciano grapes. Eur. Food Res. Technol. 2005, 220, 341–346. [Google Scholar] [CrossRef]
  49. Gómez-Míguez, M.; González-Miret, M.L.; Heredia, F.J. Evolution of colour and anthocyanin composition of Syrah wines elaborated with pre-fermentative cold maceration. J. Food Eng. 2007, 79, 271–278. [Google Scholar] [CrossRef]
  50. Loira, I.; Morata, A.; Bañuelos, M.A.; Suárez-Lepe, J.A. Isolation, Selection, and Identification Techniques for Non-Saccharomyces Yeasts of Oenological Interest. In Biotechnological Progress and Beverage Consumption; Grumezescu, A.M., Holban, A.M., Eds.; Elsevier Inc.: Amsterdam, The Netherlands, 2020; pp. 467–578. [Google Scholar]
Figure 1. Sequence showing (A) interior of the PL treatment chamber; (B) grapes cut in half and placed under the lamps; (C) thermal camera used (above) and thermal effect (below).
Foods 10 01416 g001
Figure 2. Details of the indentation done with the atomic force microscopy (AFM) on treated skin (A) and untreated skin (B) are seen in the top images, and the details on the roughness of the skin are seen on the bottom images.
Foods 10 01416 g002
Figure 3. Kinetics of the alcoholic fermentation as a percentage of the estimated ethanol produced (% v/v) after the 2nd inoculation (sequential inoculation). (A) Vinifications from untreated grapes; (B) vinifications from PL-treated grapes.
Foods 10 01416 g003
Figure 4. Percentage loss of anthocyanins in (left) wines produced with untreated grapes and (right) wines produced with treated grapes.
Foods 10 01416 g004
Table 1. Population determined with plate counting for each inoculum. The two first columns indicate the inocula used as fermentation starter (d0), and the third column refers to the inoculum used for the sequential fermentation with Sc (d8).
StarterInocula d0 CFU/mLSequential Inocula d8 CFU/mL
T. delbrueckii1.1 × 108 Sc 6.0 × 10⁷
S. pombe3.2 × 107Sc 6.0 × 10⁷
M. pulcherrima6.9 × 107Sc 6.0 × 10⁷
L. thermotolerans6.0 × 107Sc 6.0 × 10⁷
H. vineae1.3 × 108Sc 6.0 × 10⁷
S. cerevisiae1.0 × 108Sc 6.0 × 10⁷
Table 2. Oenological parameters determined with Fourier transform infrared spectroscopy (FTIR) for (A) control fermentations with untreated must and (B) Pulsed light irradiation (PL) treatment. Average and standard deviation (STD) for n = 3. Different letters indicate statistical difference within each treatment p > 0.05.
EthanolpHTotal Acidity 1Volatile Acidity 2Malic AcidLactic AcidFructoseGlucose
% v/v g/Lg/Lg/Lg/Lg/Lg/L
A
Spontaneous14.1 ± 0.1 a4.0 ± 0.0 a4.4 ± 0.1 b0.5 ± 0.0 bc0.7 ± 0.1 c1.3 ± 0.1 bc2.7 ± 0.1 ab0.0 ± 0.0 b
T. delbrueckii14.1 ± 0.1 a3.9 ± 0.0 a4.3 ± 0.2 b0.1 ± 0.0 d1.3 ± 0.0 b0.1 ± 0.0 c2.6 ± 1.0 ab0.4 ± 0.2 b
S. pombe13.7 ± 0.3 b4.0 ± 0.1 a5.5 ± 1.6 ab0.6 ± 0.1 b0.5 ± 0.2 c1.9 ± 0.9 bc1.3 ± 1.5 bc1.0 ± 0.8 b
M. pulcherrima13.7 ± 0.3 b3.9 ± 0.0 a6.8 ± 1.3 a0.9 ± 0.3 a0.1 ± 0.1 d3.1 ± 0.8 ab0.3 ± 0.3 c2.2 ± 1.3 a
L. thermotolerans13.8 ± 0.2 ab3.6 ± 0.2 b6.9 ± 1.1 a0.4 ± 0.0 bc0.2 ± 0.3 d4.6 ± 1.7 a0.0 ± 0.1 c0.1 ± 0.2 b
H. vineae14.2 ± 0.1 a3.9 ± 0.0 a4.1 ± 0.1 b0.3 ± 0.0 cd1.4 ± 0.1 b0.0 ± 0.0 c3.0 ± 0.6 a0.9 ± 0.3 b
S. cerevisiae13.8 ± 0.2 ab3.9 ± 0.0 a5.6 ± 0.1 ab0.2 ± 0.0 cd2.2 ± 0.1 a0.7 ± 0.2 c0.5 ± 0.1 c0.0 ± 0.0 b
B
Spontaneous14.1 ± 0.1 a3.9 ± 0.0 c4.8 ± 0.0 c0.4 ± 0.1 ab1.6 ± 0.0 b0.0 ± 0.0 b0.9 ± 0.1 b0.1 ± 0.1 b
T. delbrueckii13.6 ± 0.2 cd3.9 ± 0.0 bc4.6 ± 0.1 c0.2 ± 0.1 d1.3 ± 0.1 bc0.2 ± 0.1 b1.7 ± 0.6 a0.3 ± 0.3 a
S. pombe13.8 ± 0.2 bc4.0 ± 0.0 a3.6 ± 0.2 d0.3 ± 0.0 c0.5 ± 0.1 d0.5 ± 0.1 b0.9 ± 0.2 b0.2 ± 0.1 ab
M. pulcherrima13.4 ± 0.2 d3.9 ± 0.0 b4.7 ± 0.3 c0.4 ± 0.0 a0.0 ± 0.1 e0.8 ± 0.1 b0.0 ± 0.0 d0.3 ± 0.1 a
L. thermotolerans13.7 ± 0.1 bc3.5 ± 0.0 d7.2 ± 0.5 a0.3 ± 0.0 bc1.1 ± 0.6 c4.9 ± 0.7 a0.7 ± 0.2 bc0.0 ± 0.0 b
H. vineae13.8 ± 0.1 ab3.9 ± 0.0 c4.4 ± 0.1 c0.3 ± 0.0 bc1.3 ± 0.1 bc0.2 ± 0.1 b1.0 ± 0.1 b0.1 ± 0.1 b
S. cerevisiae13.6 ± 0.1 cd3.9 ± 0.0 c5.8 ± 0.1 b0.2 ± 0.0 d2.1 ± 0.1 a0.7 ± 0.0 b0.3 ± 0.1 cd0.0 ± 0.0 b
1 Expressed as tartaric acid; 2 Expressed as acetic acid.
Table 3. Volatile fraction, in mg/L, determined with flame ionization detector (GC-FID). The results correspond to (A) control fermentations and (B) PL treatment. Average and STD for n = 3. Different letters indicate a significant difference within the same treatment for each compound.
ASpontaneousT. delbrueckiiS. pombeL. thermotoleransH. vineaeM. pulcherrimaS. cerevisiae
Acetaldehyde7.8 ± 0.9 a12.6 ± 8.4 a13.1 ± 3.3 a9.4 ± 1.0 a8.4 ± 0.5 a7.9 ± 0.3 a7.1 ± 1.2 a
Methanol26.9 ± 1.0 ab26.6 ± 4.2 b23.0 ± 0.3 ab23.1 ± 1.2 b24.9 ± 3.7 b23.7 ± 1.7 b29.7 ± 2.0 a
1-propanol43.2 ± 4.0 b52.2 ± 1.3 a42.6 ± 1.2 b44.6 ± 1.6 b40.3 ± 4.6 b41.2 ± 1.6 b20.1 ± 1.0 c
Diacetyl1.5 ± 0.1 ab1.5 ± 0.1 b1.7 ± 0.1 ab1.6 ± 0.1 ab1.9 ± 0.2 a1.6 ± 0.1 b1.7 ± 0.4 ab
Ethyl acetate159.8 ± 17.9 a82.2 ± 16.2 c90.9 ± 10.3 c62.9 ± 7.6 d80.8 ± 1.4 c113.1 ± 7.4 b19.8 ± 1.5 e
2-butanoln.d.n.d.n.d.n.d.n.d.n.d.n.d.
Isobutanol45.0 ± 7.6 ab56.9 ± 12.9 a39.8 ± 3.2 b38.9 ± 5.1 b23.4 ± 1.7 c42.6 ± 5.7 b27.0 ± 0.5 c
1-butanol4.3 ± 0.2 a4.8 ± 0.5 a4.4 ± 0.3 a4.6 ± 0.3 a4.9 ± 5.1 a4.8 ± 0.1 a4.8 ± 0.1 a
Acetoin6.0 ± 0.5 b5.4 ± 0.4 b19.2 ± 10.1 a6.2 ± 0.7 b7.3 ± 1.4 b7.1 ± 1.0 b5.8 ± 0.3 b
3-methyl-1-butanol102.5 ± 4.7 c139.4 ± 18.1 b95.2 ± 6.3 c113.0 ± 7.0 bc106.4 ± 13.1 c93.6 ± 5.0 c192.4 ± 37.5 a
2-methyl-1-butanol47.4 ± 2.6 a45.2 ± 2.7 a45.2 ± 1.2 a38.7 ± 3.2 a35.2 ± 1.9 a47.0 ± 2.8 a64.8 ± 56.1 a
Isobutyl acetate1.1 ± 1.5 a1.1 ± 1.9 a1.0 ± 1.7 a2.3 ± 0.9 a1.6 ± 2.8 a3.3 ± 0.8 a3.0 ± 0.6 a
Ethyl butyrate0.8 ± 1.1 ab3.0 ± 2.4 a0.9 ± 0.7 b1.8 ± 0.9 ab0.9 ± 0.8 ab0.9 ± 0.8 ab1.4 ± 0.4 ab
Ethyl lactate46.5 ± 8.8 ab31.9 ± 17.0 bc13.7 ± 4.5 d21.8 ± 8.3 cd51.2 ± 6.6 a15.6 ± 1.5 d11.6 ± 1.2 d
2,3-butanediol529.2 ± 17.4 bcd547.4 ± 67.8 bc672.6 ± 35.7 a586.7 ± 63.5 b470.2 ± 53.7 cd614.5 ± 33.4 ab445.9 ± 24.4 d
Isoamyl acetate1.9 ± 0.1 abc2.7 ± 0.3 a1.8 ± 0.1 bc2.5 ± 0.1 ab1.9 ± 0.1 ab1.9 ± 0.0 b1.2 ± 1.0 c
Hexanol4.1 ± 0.8 b4.4 ± 0.1 b4.6 ± 0.1 ab4.4 ± 0.1 b4.3 ± 0.1 b4.6 ± 0.1 ab5.0 ± 0.6 a
2-phenyl ethanol29.2 ± 0.8 cd35.7 ± 2.8 bc29.8 ± 1.2 cd41.5 ± 7.3 b25.6 ± 1.5 d34.5 ± 2.3 bc76.6 ± 6.5 a
2-phenyl ethyl acetate6.5 ± 1.5 a5.3 ± 0.2 a5.1 ± 0.1 a5.0 ± 0.3 a6.2 ± 1.9 a5.2 ± 0.3 a5.2 ± 0.4 a
BSpontaneousT. delbrueckiiS. pombeL. thermotoleransH. vineaeM. pulcherrimaS. cerevisiae
Acetaldehyde14.1 ± 0.9 a10.0 ± 1.2 b10.0 ± 3.0 b8.2 ± 1.8 b13.5 ± 0.7 a7.8 ± 1.2 b8.4 ± 0.1 b
Methanol21.7 ± 1.2 ab24.0 ± 2.0 a24.0 ± 3.5 a22.4 ± 3.3 ab17.9 ± 1.3 b26.0 ± 0.2 a22.5 ± 3.6 a
1-propanol54.0 ± 1.2 bc71.5 ± 5.0 a40.6 ± 15.1 c52.8 ± 1.3 b48.7 ± 2.2 bc40.5 ± 7.1 c26.6 ± 0.6 d
Diacetyl1.5 ± 0.1 b1.7 ± 0.3 ab1.6 ± 0.1 ab1.5 ± 0.1 b1.8 ± 0.1 a1.5 ± 0.0 b1.5 ± 0.1 b
Ethyl acetate147.3 ± 3.2 a118.5 ± 17.8 b120.3 ± 3.2 b96.5 ± 4.6 c81.2 ± 3.2 c134.1 ± 16.3 ab24.6 ± 2.8 d
2-butanoln.d.n.d.n.d.n.d.n.d.n.d.n.d.
Isobutanol64.4 ± 2.7 a53.5 ± 6.1 ab39.2 ± 6.5 c42.2 ± 11.0 c19.5 ± 0.4 d45.3 ± 2.6 bc25.5 ± 0.8 d
1-butanol4.4 ± 0.1 bc4.5 ± 0.2 abc4.4 ± 0.5 bc4.9 ± 0.4 a4.5 ± 0.1 abc4.1 ± 0.1 c4.8 ± 0.1 ab
Acetoin4.8 ± 0.2 a7.2 ± 1.4 a8.0 ± 3.9 a7.1 ± 1.5 a8.4 ± 2.5 a6.3 ± 0.7 a5.8 ± 1.0 a
3-methyl-1-butanol89.5 ± 3.2 cd132.9 ± 16.4 b64.2 ± 14.8 e113.0 ± 16.5 bc100.0 ± 4.6 cd80.6 ± 14.2 de167.3 ± 3.0 a
2-methyl-1-butanol51.2 ± 0.3 b44.1 ± 4.5 bc33.3 ± 7.9 de36.4 ± 8.7 cd25.4 ± 1.0 e31.4 ± 2.7 de81.5 ± 1.9 a
Isobutyl acetate2.6 ± 0.1 ab3.1 ± 0.9 a2.3 ± 1.0 ab1.0 ± 0.9 b1.8 ± 1.8 ab3.2 ± 0.9 a0.8 ± 1.5 b
Ethyl butyrate2.7 ± 0.1 a1.3 ± 0.0 ab1.1 ± 1.8 ab1.4 ± 0.2 ab0.5 ± 0.8 b1.1 ± 1.1 ab1.6 ± 0.5 ab
Ethyl lactate36.1 ± 2.2 a25.6 ± 16.2 a31.2 ± 3.2 a42.2 ± 3.9 a22.5 ± 8.1 a12.2 ± 0.7 a28.7 ± 13.3 a
2,3-butanediol766.5 ± 8.5 a588.3 ± 22.0 bc775.9 ± 182.3 a687.5 ± 73.7 ab459.7 ± 38.1 c638.7 ± 54.0 ab596.7 ± 41.4 bc
Isoamyl acetate1.7 ± 0.0 cd8.2 ± 0.4 a1.7 ± 0.0 d2.3 ± 0.6 bc2.3 ± 0.3 b1.8 ± 0.1 bcd2.0 ± 0.1 bcd
Hexanol4.2 ± 0.0 a3.8 ± 0.0 b4.1 ± 0.2 ab3.9 ± 0.2 ab4.1 ± 0.2 ab4.1 ± 0.1 a4.1 ± 0.2 ab
2-phenyl ethanol24.6 ± 1.6 cd35.2 ± 8.1 b20.5 ± 4.1 d29.6 ± 0.9 bc25.5 ± 2.0 cd24.1 ± 2.6 cd62.9 ± 2.1 a
2-phenyl ethyl acetate5.5 ± 0.1 a5.5 ± 0.4 a6.3 ± 2.1 a4.2 ± 3.8 a6.6 ± 0.8 a6.0 ± 1.5 a5.1 ± 0.1 a
n.d.—no-data below detection limit.
Table 4. Total polyphenolic index (TPI), colour intensity (CI) and hue for wines produced from (A) control fermentations and (B) PL treatment. Average and STD for n = 3. Different letters indicate significant differences within the same treatment.
TPICIHue
A
Spontaneous11.1 ± 0.1 bc0.8 ± 0.0 b1.2 ± 0.0 bc
T. delbrueckii10.4 ± 0.6 c0.6 ± 0.1 c1.3 ± 0.1 b
S. pombe11.2 ± 0.2 bc0.7 ± 0.0 bc1.4 ± 0.0 a
M. pulcherrima10.7 ± 0.1 bc0.8 ± 0.0 b0.9 ± 0.0 d
L. thermotolerans11.3 ± 0.3 b0.8 ± 0.0 b1.3 ± 0.0 b
H. vineae10.9 ± 0.1 bc0.6 ± 0.0 c1.3 ± 0.0 ab
S. cerevisiae13.0 ± 0.1 a1.0 ± 0.0 a1.1 ± 0.0 cd
B
Spontaneous8.7 ± 0.0 b0.6 ± 0.0 a2.0 ± 0.0 ab
T. delbrueckii8.2 ± 0.1 b0.3 ± 0.0 c2.6 ± 0.1 a
S. pombe8.9 ± 0.1 b0.5 ± 0.1 ab2.0 ± 0.3 ab
M. pulcherrima8.4 ± 0.3 b0.4 ± 0.1 abc2.1 ± 0.1 ab
L. thermotolerans8.5 ± 0.4 b0.3 ± 0.1 bc1.5 ± 0.1 b
H. vineae8.7 ± 0.2 b0.3 ± 0.1 c2.4 ± 0.5 a
S. cerevisiae10.7 ± 0.9 a0.4 ± 0.0 abc1.5 ± 0.1 b
Publisher’s Note: MDPI stays neutral with regard to jurisdictional claims in published maps and institutional affiliations.

