Review

Proton Low Field NMR Relaxation Time Domain Sensor for Monitoring of Oxidation Stability of PUFA-Rich Oils and Emulsion Products

Phyto-Lipid Biotechnology Lab (PLBL), Department of Biotechnology, Faculty of Engineering Sciences, Ben Gurion University of the Negev, Beer Sheva 84105, Israel
*
Author to whom correspondence should be addressed.
Foods 2021, 10(6), 1385; https://doi.org/10.3390/foods10061385
Submission received: 3 May 2021 / Accepted: 2 June 2021 / Published: 15 June 2021
(This article belongs to the Topic Future Food Analysis and Detection)

Abstract

:
The nutritional characteristics of fatty acid (FA) containing foods are strongly dependent on the FA’s chemical/morphological arrangements. Paradoxically the nutritional, health enhancing FA polyunsaturated fatty acids (PUFAs) are highly susceptible to oxidation into harmful toxic side products during food preparation and storage. Current analytical technologies are not effective in the facile characterization of both the morphological and chemical structures of PUFA domains within materials for monitoring the parameters affecting their oxidation and antioxidant efficacy. The present paper is a review of our work on the development and application of a proton low field NMR relaxation sensor (1H LF NMR) and signal to time domain (TD) spectra reconstruction for chemical and morphological characterization of PUFA-rich oils and their oil in water emulsions, for assessing their degree and susceptibility to oxidation and the efficacy of antioxidants. The NMR signals are energy relaxation signals generated by spin–lattice interactions (T1) and spin–spin interactions (T2). These signals are reconstructed into 1D (T1 or T2) and 2D graphics (T1 vs. T2) by an optimal primal-dual interior method using a convex objectives (PDCO) solver. This is a direct measurement on non-modified samples where the individual graph peaks correlate to structural domains within the bulk oil or its emulsions. The emulsions of this review include relatively complex PUFA-rich oleosome-oil bodies based on the aqueous extraction from linseed seeds with and without encapsulation of externally added oils such as fish oil. Potential applications are shown in identifying optimal health enhancing PUFA-rich food formulations with maximal stability against oxidation and the potential for on-line quality control during preparation and storage.

1. Introduction

Polyunsaturated fatty acids (PUFAs) such as α-linolenic acid (ALA), eicosapentaenoic acid (EPA) and docosahexaenoic acid (DHA) are important nutrients that regulate a wide variety of biological functions, from blood pressure to the development and functioning of the brain and nervous system [1,2,3,4]. Paradoxically, although PUFAs are very important for health, they also undergo oxidation during storage to form toxic oxidant products [5]. Our major research objective has been to develop a facile and efficient analytical tool to measure directly on non-modified highly nutritious PUFA containing food samples, their chemical and morphological arrangements using energy relaxation times controlled by spin–spin and spin–lattice relaxation on a single graph, to guide the controlling of nutritional stability and prevention of oxidation during preparation, shelf life and digestion. This is related to the functionality and oxidant stability of PUFA foods being based on their food components internal physical and morphological arrangements [6,7].
In this regard we have recently shown the efficacy of 1H LF NMR energy relaxation sensing and signal reconstruction algorithms for generating the complex chemical and morphological arrangement of the polysaccharides, proteins, sugars and fats of biomass used for biofuels on a single 2D energy relaxation graph [8,9]. In the present paper we review our work using 1H LF NMR energy relaxation technology with modified signal reconstruction algorithms for characterizing PUFA and their triglyceride oils and oil in water (O/W) emulsions with respect to their internal chemical and morphological arrangement. This correlates to their susceptibility to oxidation and antioxidant efficacy in food preparation and storage.

1.1. 1H LF NMR Relaxation Sensor Technology

1H 1H LF NMR is a rapid, non-destructive technology extensively used in the food, polymer, petroleum and pharmaceutical industries [10,11]. It is widely used in quality control for the determination of solid-to-liquid and oil-to-water ratios in materials as diverse as oil-bearing rock, food emulsions and plant seeds [12].
The field of 1H LF NMR relaxometry is a powerful tool for identifying molecular species and to study their dynamics even in complex materials. This relates to the measurement of energy relaxation constants as a consequence of interactions among nuclear spins and between them and their surroundings matrix. Longitudinal magnetization returns to equilibrium following application of a radio frequency field because of energy transferred to the lattice, and transverse energy relaxation arises from spin–spin interactions following a 90° pulse. The time constants for longitudinal and transverse energy relaxations are T1 and T2 respectively.
Relaxation time distribution experiments range from simple and rapid one dimensional (1D) tests to more complicated multidimensional ones. One-dimensional tests use constant intervals between pulses, allowing for either longitudinal or transverse relaxation to be evaluated, whereas in multidimensional experiments, the signal is measured as a function of two or more independent variables, allowing the spin system to evolve under different relaxation mechanisms [13]. In biological samples, spins exist in a variety of different environments, giving rise to a distribution of relaxation times in which the measured relaxation decay is a sum of contributions from all spins [14].
Most commonly applied, 1D NMR tools are based on either acquisition of the free induction decay signal following a 90° pulse, or pulse sequences such as the spin echo [15], CPMG [16,17] or inversion/saturation recovery [18].
More recently, a new two-dimensional (2D) energy relaxation time distribution pulse sequences has been suggested, including T1 and T2 [13], T2-store-T2 [19] and T2-Diffusion measurements [20].
The basic principle of the 1H LF NMR relaxation TD sensor, is that the oils FA’s composition directly affects and dominates the proton energy relaxation time. This principle is shown by three different oils in Figure 1. For the most viscous castor oil composed of about 90% ricinoleic acid (12-OH-18:1) with hydroxyl groups, has T2 aliphatic chain proton energy relaxation time values significantly shorter than the other two oils. Monounsaturated olive oil, of lower viscosity, with about 60% oleic acid (18:1) shows an intermediate T2 relaxation time, while PUFA-rich linseed oil of lowest viscosity, with about 55% linolenic acid (18:3) is the most mobile and the T2 relaxation time is the longest of the three oils. This clearly shows the effect of both the chemical composition and its structural arrangement on the NMR signal generation in terms of proton time spin–spin energy relaxation values. However, significantly more information on the oil’s chemical and morphological material arrangements can be obtained from this data, as described below, by more advanced algorithms for signals collection and T1 and T2 spectrum reconstructing. It is clear that further enhanced data processing of the progress and changing relaxation times along the curves in Figure 1, contains significant additional material information about the oils.
New computing approach and algorithms for efficient and better processing of 1H LF NMR signals collected energy relaxation data were developed in our research team. This new computing approach applies combined L1-norm and L2-norm regularization to find sparse solutions, using a formulation suitable for the PDCO solver (primal-dual interior method for convex objectives). Using these algorithms, we were able to better solve inverse Laplace transformation problem and to produce and generate 1D and 2D T1 vs. T2 graphical representation of the proton mobility in simple liquid and solid and complex samples as well. These proton relaxation data processing methods significantly improved the common L2-norm (least squares) results and enable to separate many additional new time domains (TD) in the tested samples.
1H LF-NMR spectroscopy generates energy relaxation time exponential decay signals, from which the PDCO solver transforms the exponential decay curves components into spectra of material samples that can distinguish between different chemical and morphological components of the analyzed sample. Transforming relaxation curves into 1D spectra of T1, T2 and 2D T1 vs. T2 spectra is an ill posed problem of the inverse Laplace transform (ILT) [21].
This inverse problem, like all inverse problems, is complex to solve for at least two major reasons: (1) any set of measurements may be consistent with different relaxation times, i.e., the solution of the inverse problem at hand is not unique; (2) finding a solution may require exploration of a huge parameter space. These issues must be resolved with an appropriate solver, which until recently the most common numerical method implemented is based on L2-norm regularization [12,21]. Sparse representation methods, however using L1 regularization and convex optimization are a relatively new approach for effective analysis and processing of digital images and signals. A numerical optimization method for analyzing LF NMR data by including non-negativity constraints and L1 regularization and by applying a convex optimization solver PDCO, which allows general linear constraints to be treated as linear operators, was shown to provide better resolved and more accurate solutions when compared to existing methodologies [21]. An example of the latest methodologies analysis of system relaxation data acquired using LF NMR is presented in Figure 2a–h for the common system based on WinDXP compared to the novel PDCO solver, respectively. A rapeseed oil sample was chosen as the chemical model for comparison. The solutions are ordered in each graph by descending signal to noise ratio (SNR) values. In contrast to WinDXP solution that produced only two main moderately resolved peaks, the PDCO solutions have four distinct resolved peaks [21]. As can be seen, all four repetitions of the PDCO solutions are highly repeatable and stable. PDCO formulation provides better resolved relaxation time distributions and more accurate solutions. Furthermore, the accuracy of the PDCO solver spectral generation was demonstrated in both 1D and 2D T1-T2 simulation studies [22,23].
In brief, the present developed 1H LF NMR energy relaxation TD sensor system consists of different interconnected components as shown in Figure 3. In effect: A fat-rich food product is initially used for T1 and T2 proton energy relaxation signals collection from exponential decay curves generated by the LF NMR unit [21,24]. Then the exponential decay data of 1H relaxation signals is processed by an inverse Laplace transformation using a PDCO solver with optimized regularization parameters for reconstruction of 1D and 2D T1-T2 spectra on a single graph [22,23]. The 2D T1-T2 graph is presented with numerical values for each separate TD peak. Following this data processing and reconstruction, each TD peak assignment is conducted according to referenced previous work, for the different segmental motions of the FA for pure FAs and oils described in Figure 1 and Figure 2, and their respective time relaxation values. This was further supported by HF 1H NMR in an intensive study for assignment of T1 and T2 values of common SAFA, MUFA and PUFA of various chain length [25]. Peak assignment for O/W emulsion will be described and demonstrated in subsequent sections.

1.2. Determination of Chemical and Physical Structure of Oils and Emulsions by the 1H LF NMR TD Sensor

The 1H LF NMR technology described in this review is related to the need to monitor the internal physical/morphological arrangements of biological and nutritional oils as it strongly influences their chemical, oxidant and physical properties [26]. The different molecular structures monitored are the arrangements of the amphiphilic chains of the oil’s FAs whether saturated (SFA), MUFA or PUFA, and also their liquid bulk oil phase aggregate structures. These structures are formed by the carboxylic group’s head groups that hydrogen-bond to form a dimer of two FAs in a hydrophobic environment of the alkyl chains [26]. The head-to-head dimers aggregate as quasiliquid crystal clusters alternating head to tail arrangement forming aggregates that determine the FAs (Figure 4a), which further aggregated with void spaces to form a microstructural morphology resembling a house of cards (Figure 4b) [26].
The 1H LF NMR as applied to highly complex PUFA structures, for example, can detect their four different rigidity-mobility segments along the alkyl chain [25] where the most physically rigid microstructures are the head groups and secondly the alkyl chains double bonds. The more mobile segments are the saturated aliphatic chains between the head segment and the double bonds with the aliphatic tail chain, from the outer most double bond, is the most mobile segment [25,26]. This is also applicable to food oils composed of triacylglycerol (TAG) molecules that have structures characterized by a glycerol molecule that bridges three FAs chains. A PUFA-rich TAG structure (Figure 5) consists of four different rigidity-mobility segments with the glycerol segment as the most rigid microstructure with the double bonds the second most rigid [27]. The aliphatic chain between the glycerol and double bonds is more mobile as described above for PUFA (Figure 4), without glycerol wherein the aliphatic tail chain segment is the most mobile.
A common morphological form of PUFAs are oil-in-water (O/W) and water-in-oil (W/O) emulsion structures. Emulsions are essential components in a vast number of important commercial products such as foods, cosmetics, pharmaceuticals and petroleum [28,29,30]. Monitoring their chemical morphological structure by LF H1 NMR as described in this review has many applications in the preparation of optimal PUFA emulsion products. Emulsions can be defined as a mixture of two or more immiscible liquids in which the minor component is dispersed as small droplets throughout the other [31]. The O/W emulsion consists of oil droplets dispersed in an aqueous phase as in common commercial O/W emulsions such as mayonnaise, milk, ice-cream and sauces. The W/O emulsion is defined by water droplets dispersed in an oil phase as in butter and margarine [32]. O/W Emulsions may also be prepared with complex aggregate structures of oleosomes derived from seed oleosomes, found in seed oil bodies such as linseed, which are rich in the PUFA α-linolenic acid (ALA). In Figure 6 a schematic figure of O/W emulsion oleosome vesicle with an outer surface layer of an amphiphilic oleosin protein associated with water from outside and polar heads of phospholipids coating a core matrix of hydrophobic TAGs [33].

1.3. Oxidation of PUFA-Rich Oils and O/W Emulsions Food Products

In the present review paper, we show how the complex arrangement of the different phases and components of emulsions can indeed be further characterized using a novel 1H LF NMR energy relaxation time domain (TD) sensor including an optimized reconstruction program for generating chemical morphological fingerprinting maps. In this section we describe the complex oxidation mechanisms of PUFA rich products that are monitored by 1H LF NMR technology of this review: For example, in highly complex O/W emulsions of oil bodies extracted from linseed [24,27,34]. PUFA-rich oils found in many commercial products are highly susceptible to oxidation via complex free radical chain reactions characterized by an initiation, a propagation sequence and termination steps [24,27]. The initiation of oxidation may be catalyzed/triggered by relatively high temperatures, light exposure, transition metals and other initiators. Initiation begins on a PUFA molecule’s allylic carbons by hydrogen radical (H˙) abstraction, forming an akyl radicals (R˙), resulting in conjugations of PUFA’s double bond’s. The hydrogen atom attached to bisallylic carbon on PUFA requires the least amount of energy to be removed and is the molecular site of oxidation initiation [35,36]. The propagation step then includes the reaction between oxygen molecules and the akyl radicals, creating a peroxy radical (ROO˙). This radical can later react with another hydrogen atom from a different FA chain, thus propagating the reaction onwards. The oxidation products of the subsequent propagation and termination steps are responsible for the off-flavor in oxidized PUFA-rich products and are also associated in biological systems/tissues with pathological processes such as sclerosis, degradation of biologically-active proteins and the aging processes [37]. During the termination step of the free radical chain reaction, carbon radicals react with each other forming a covalent bond to produce stable species.
The susceptibility of PUFA oxidation in many food products is well known and there is an effort to reduce it by the localization of reactants inside the food matrix, one major approach is by O/W emulsions [38]. Oil in water emulsions are widely found in foods and supplements and in many cases show improved stability against oxidation as compared to the pure oils [35]. In most reports emphasis is given to the interfacial region, which is the contact between the oil phase and the aqueous phase, as a critical area of the system regarding lipid oxidation. This is due to the observation that oil droplet size (and therefore interfacial area) or emulsifier type and interfacial surfactant composition including protein-stabilized interfacial layers, significantly affect an emulsion’s lipid oxidation [38]. There have been many studies on the effect of emulsifiers on oxidant stability of O/W emulsion and the functionality of the interfacial region structure to control oxidation, and how this affects the general mechanisms of lipid oxidation. Yet, many apparent contradictions on the interfaces functionality have been published, which can be partially attributed to the structural complexity of emulsion systems and to its complex behavior. For example, a few recent studies have correlated the lipid oxidation of an emulsion with respect to the physical and chemical structure of the emulsion’s interface [38]. More information about the physical and chemical barrier effect of interfaces according to their molecular composition and physical organization is needed, and adequate models of oil–water interfaces and their tools for characterization must be developed. The potential to characterize an emulsion’s complex morphological structures including the interface using novel 1H LF NMR and reconstruction algorithms is described in subsequent sections.

1.4. Comparison of 1H LF NMR with Common Methods of Characterizing Oil Oxidation

Numerous chemical and physical analytical methods have been developed to assess lipid oxidation such as peroxide values (PV) and p-anisidine (PAV), high performance liquid chromatography (HPLC), gas chromatography–mass spectrometry (GC–MS), Fourier transformation infrared spectroscopy (FTIR), electron spin resonance (ESR) and HR NMR [17,35,39]. There are however deficiencies and lack of consistency in many of the results from these studies. The analytical methods cannot efficiently resolve morphologies and multiple chemical components or they are designed to detect one type of oxidation product while lipid oxidation is complex and generates multiple products at different stages of oxidation. The common methodologies peroxide value (PV) and p-anisidine value (PAV) have many drawbacks, such as strict time regimes during individual stages of analyzes, control of reaction conditions and components including light and atmospheric oxygen exposure and large amount of environmental harmful solvents [40]. Though these tests allow the evaluation of either primary or secondary oxidation products anyone tests does not give a measure of both products. Despite the simplicity of the thiobarbituric acid (TBA) spectrophotometric test for measuring secondary oxidation products it has many limitations in identifying them [37]. TBA reacts with malondialdehyde (MDA), which is one of the several low-molecular weight end products formed from the decomposition of some primary and secondary lipid peroxidation products. However, not all peroxidation reactions generate MDA, therefore TBA data may be misleading. GC–MS is another common methodology used in the assessment of PUFA’s degree of oxidation, that requires a complex sample preparation characterized by lipid extraction and subsequent derivation steps, which are very time consuming [37].These and other spectroscopic methods such as HF 1H NMR and FTIR are limited in the resolution they can achieve of the different chemical and morphological states of PUFA oils and emulsions [7,41]. Hwang [7] suggested the development of methods that combine the concomitant detection of multiple oxidation products for the consistent assessment of lipid oxidation. In this respect, 1H LF NMR spectroscopy technology of the present review paper demonstrates a significant potential in readily elucidating the molecular structures and their physical arrangements within different lipid oxidation products.

1.5. Applications of 1H LF NMR Relaxation in Food Industry

1H LF NMR is a rapid non-invasive and non-destructive technology extensively used in the agro, food, polymer, petroleum and pharmaceutical industries [8,34,42]. An important application is in industrial quality control for the determination of solid-to-liquid and oil-to-water ratios in materials, food emulsions and plant seeds [43]. In biological samples, 1H spins exist in a variety of different environments, giving rise to a distribution of relaxation times in which the measured relaxation decay is a sum of contributions from all spins [14]. Examples of different applications are measurements of fat content in meat [44], determination of the water content of meat, fish [45] and in agro food products [46], molecular mobility in wheat starch [47], study of protein denaturation in eggs and whey [48], the effect of the formulation on liquid and solid fat ice cream [49] and quality control of food such as avocados [50]. There are also multiple applications in many different food products and peak assignment for exploratory purposes in other foodstuffs including eggs, fish, dairy products, salad cream and cake [51]. As described in subsequent sections these graphs can efficiently monitor oxidation process, potential oxidation stability, and assess antioxidants efficacy in oils and emulsions [24,27,34]. In agreement with Berton-Carabin et al. [38] oils and O/W emulsion’s chemical and morphological arrangements has not been extensively studied and this is one of the main issues that is focused upon in the present review using 1H LF NMR and reconstruction algorithms.

2. Demonstration of TD Sensor Fingerprint Mapping of FAs, Oils, Seeds and Paste Products

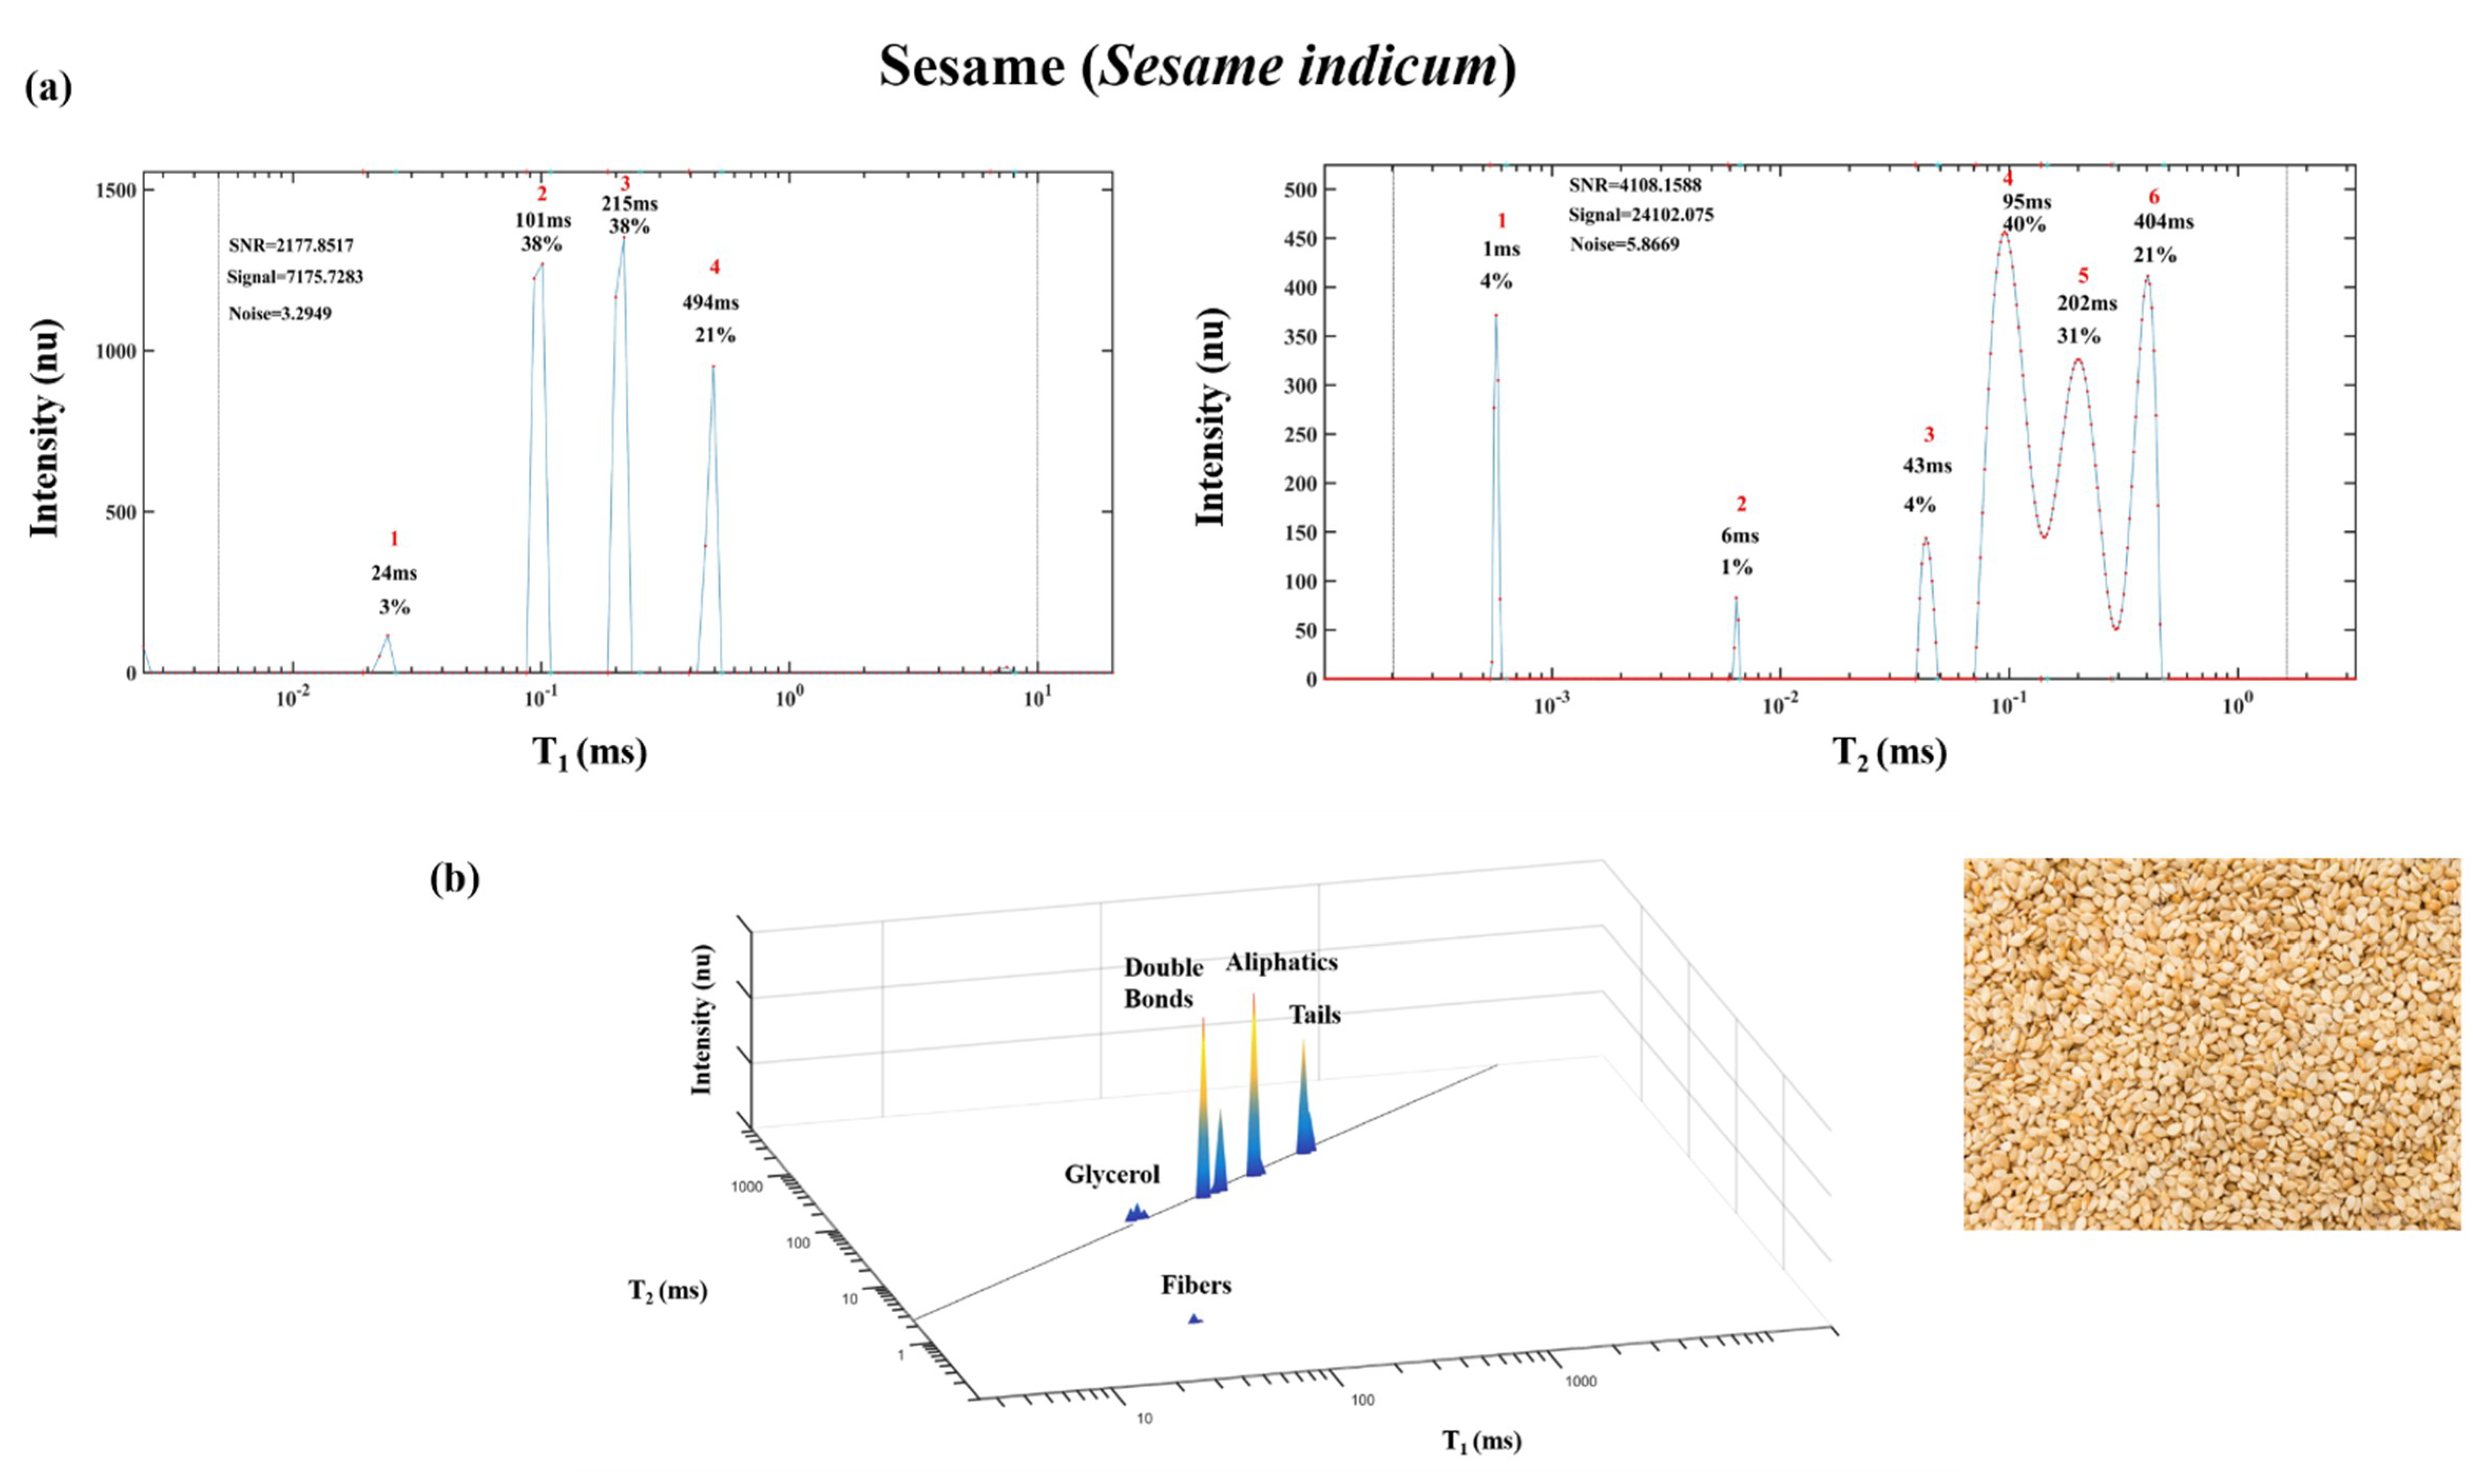
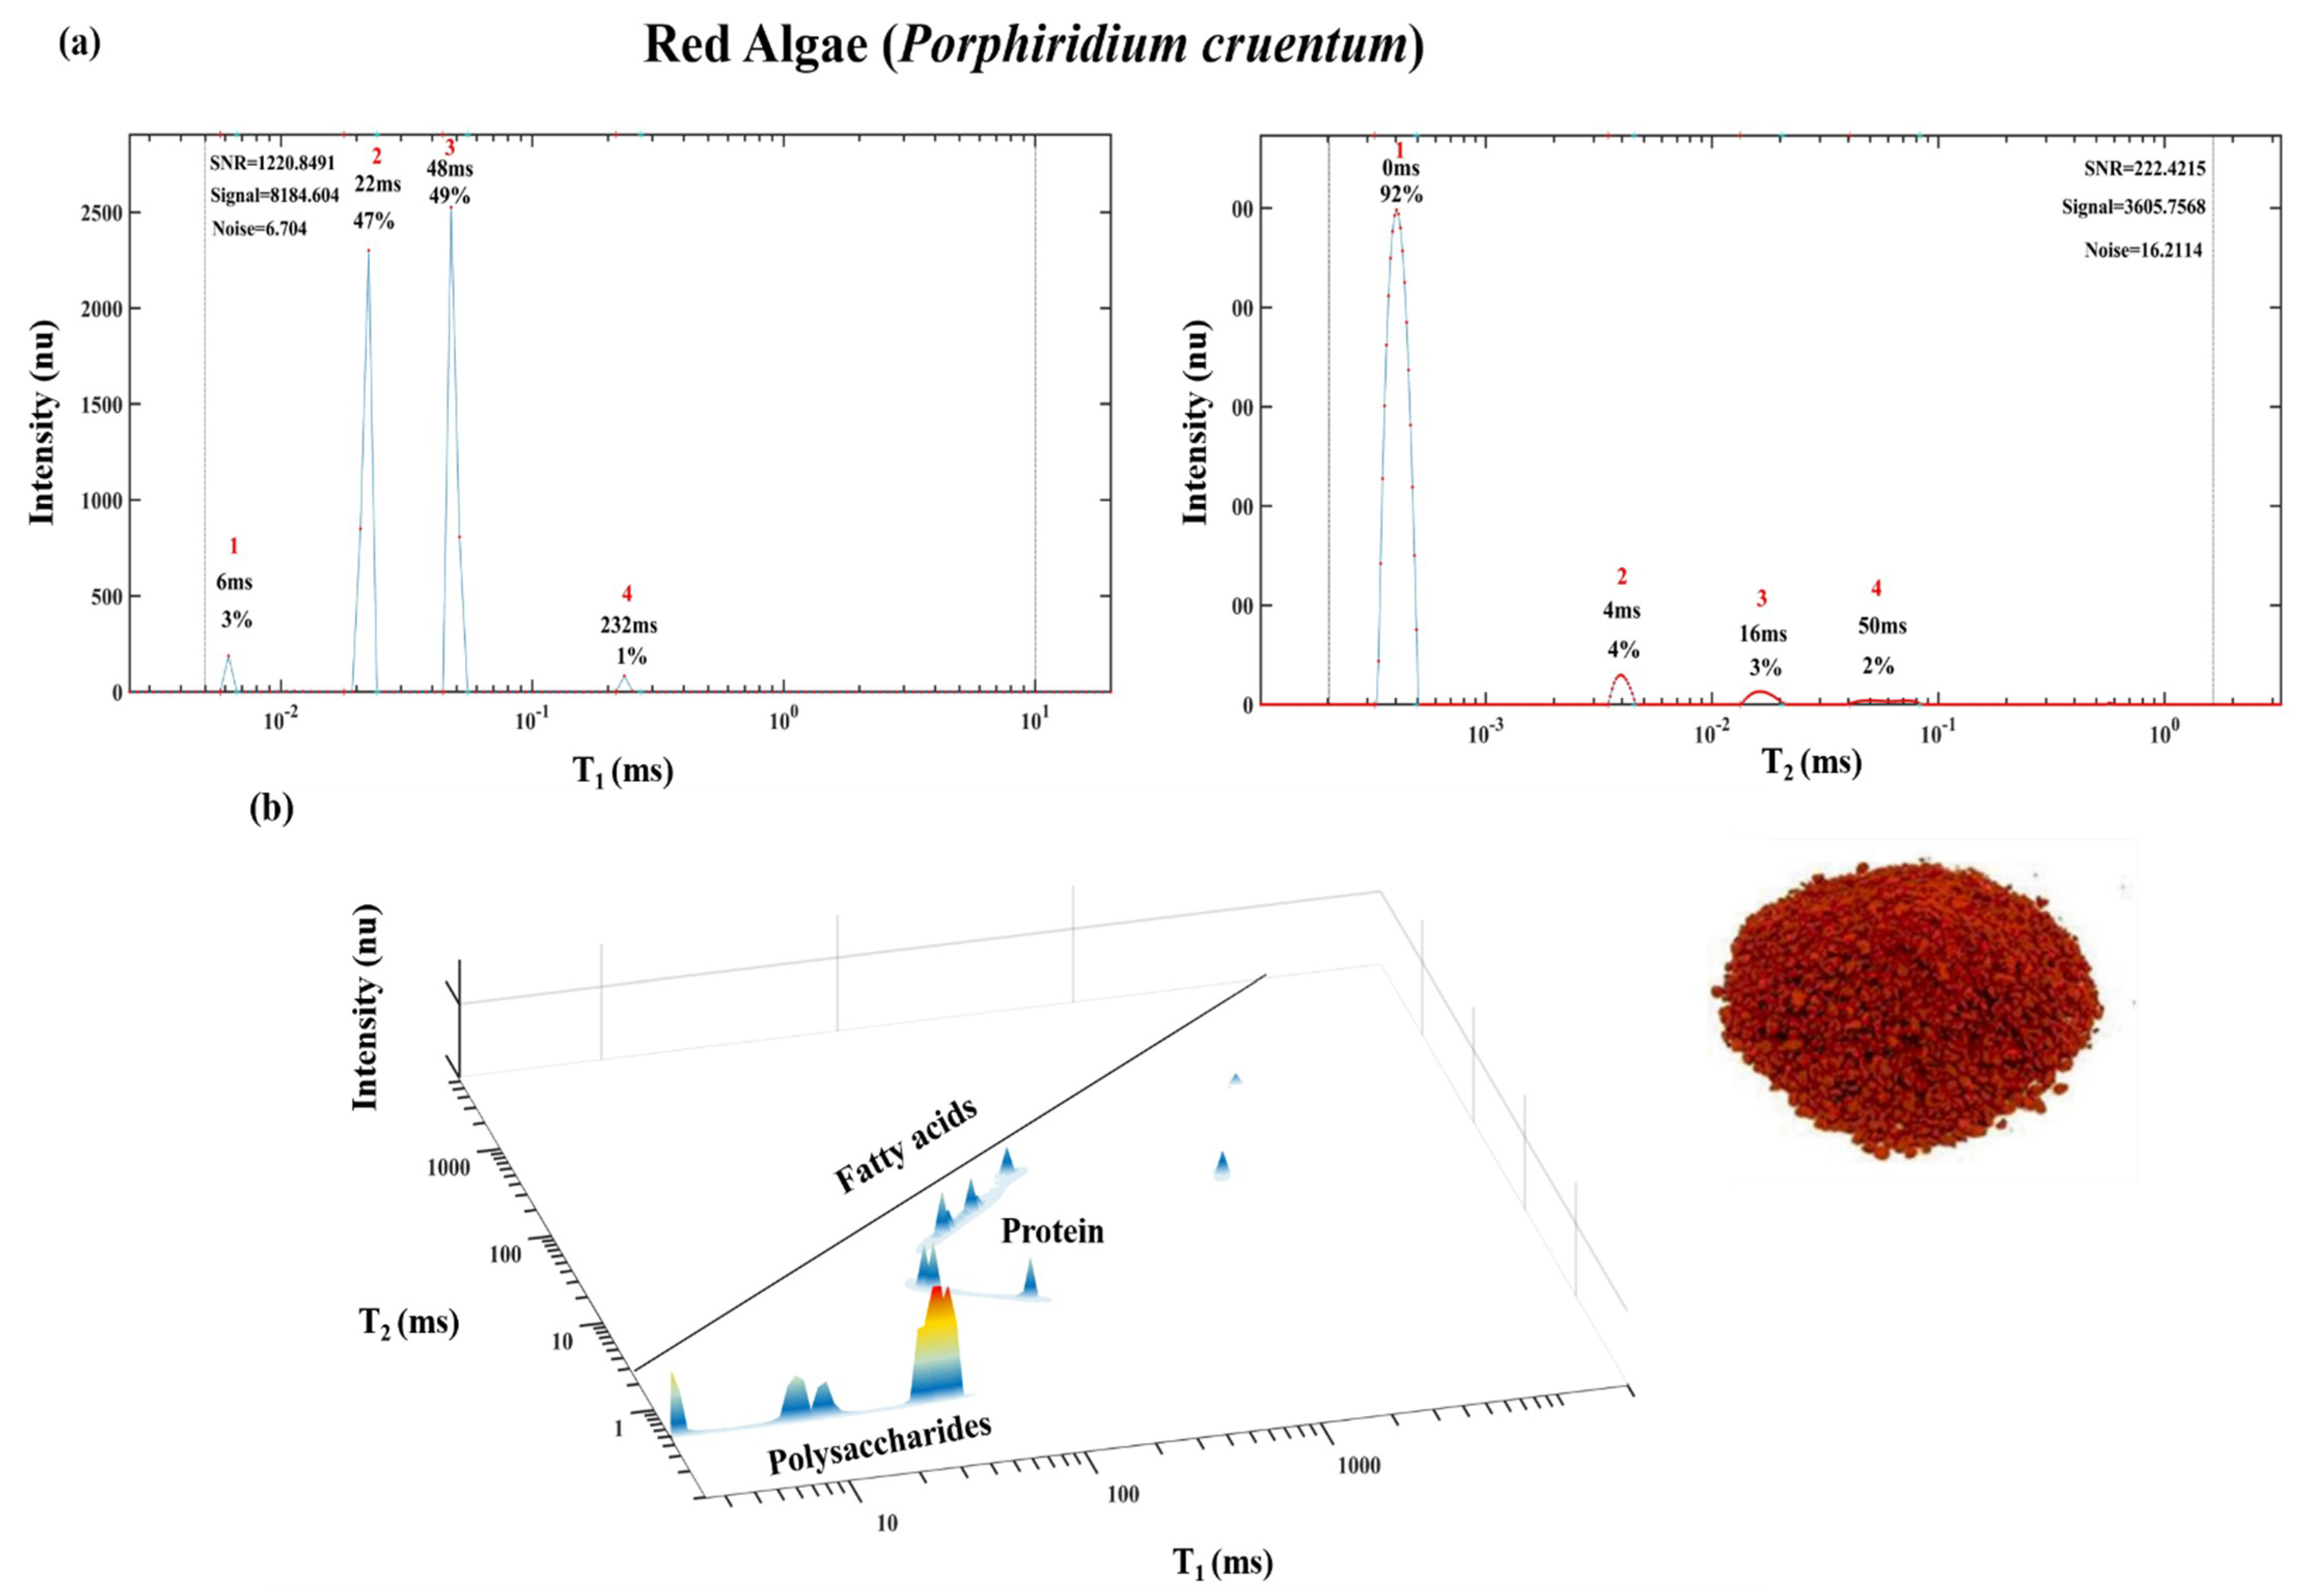
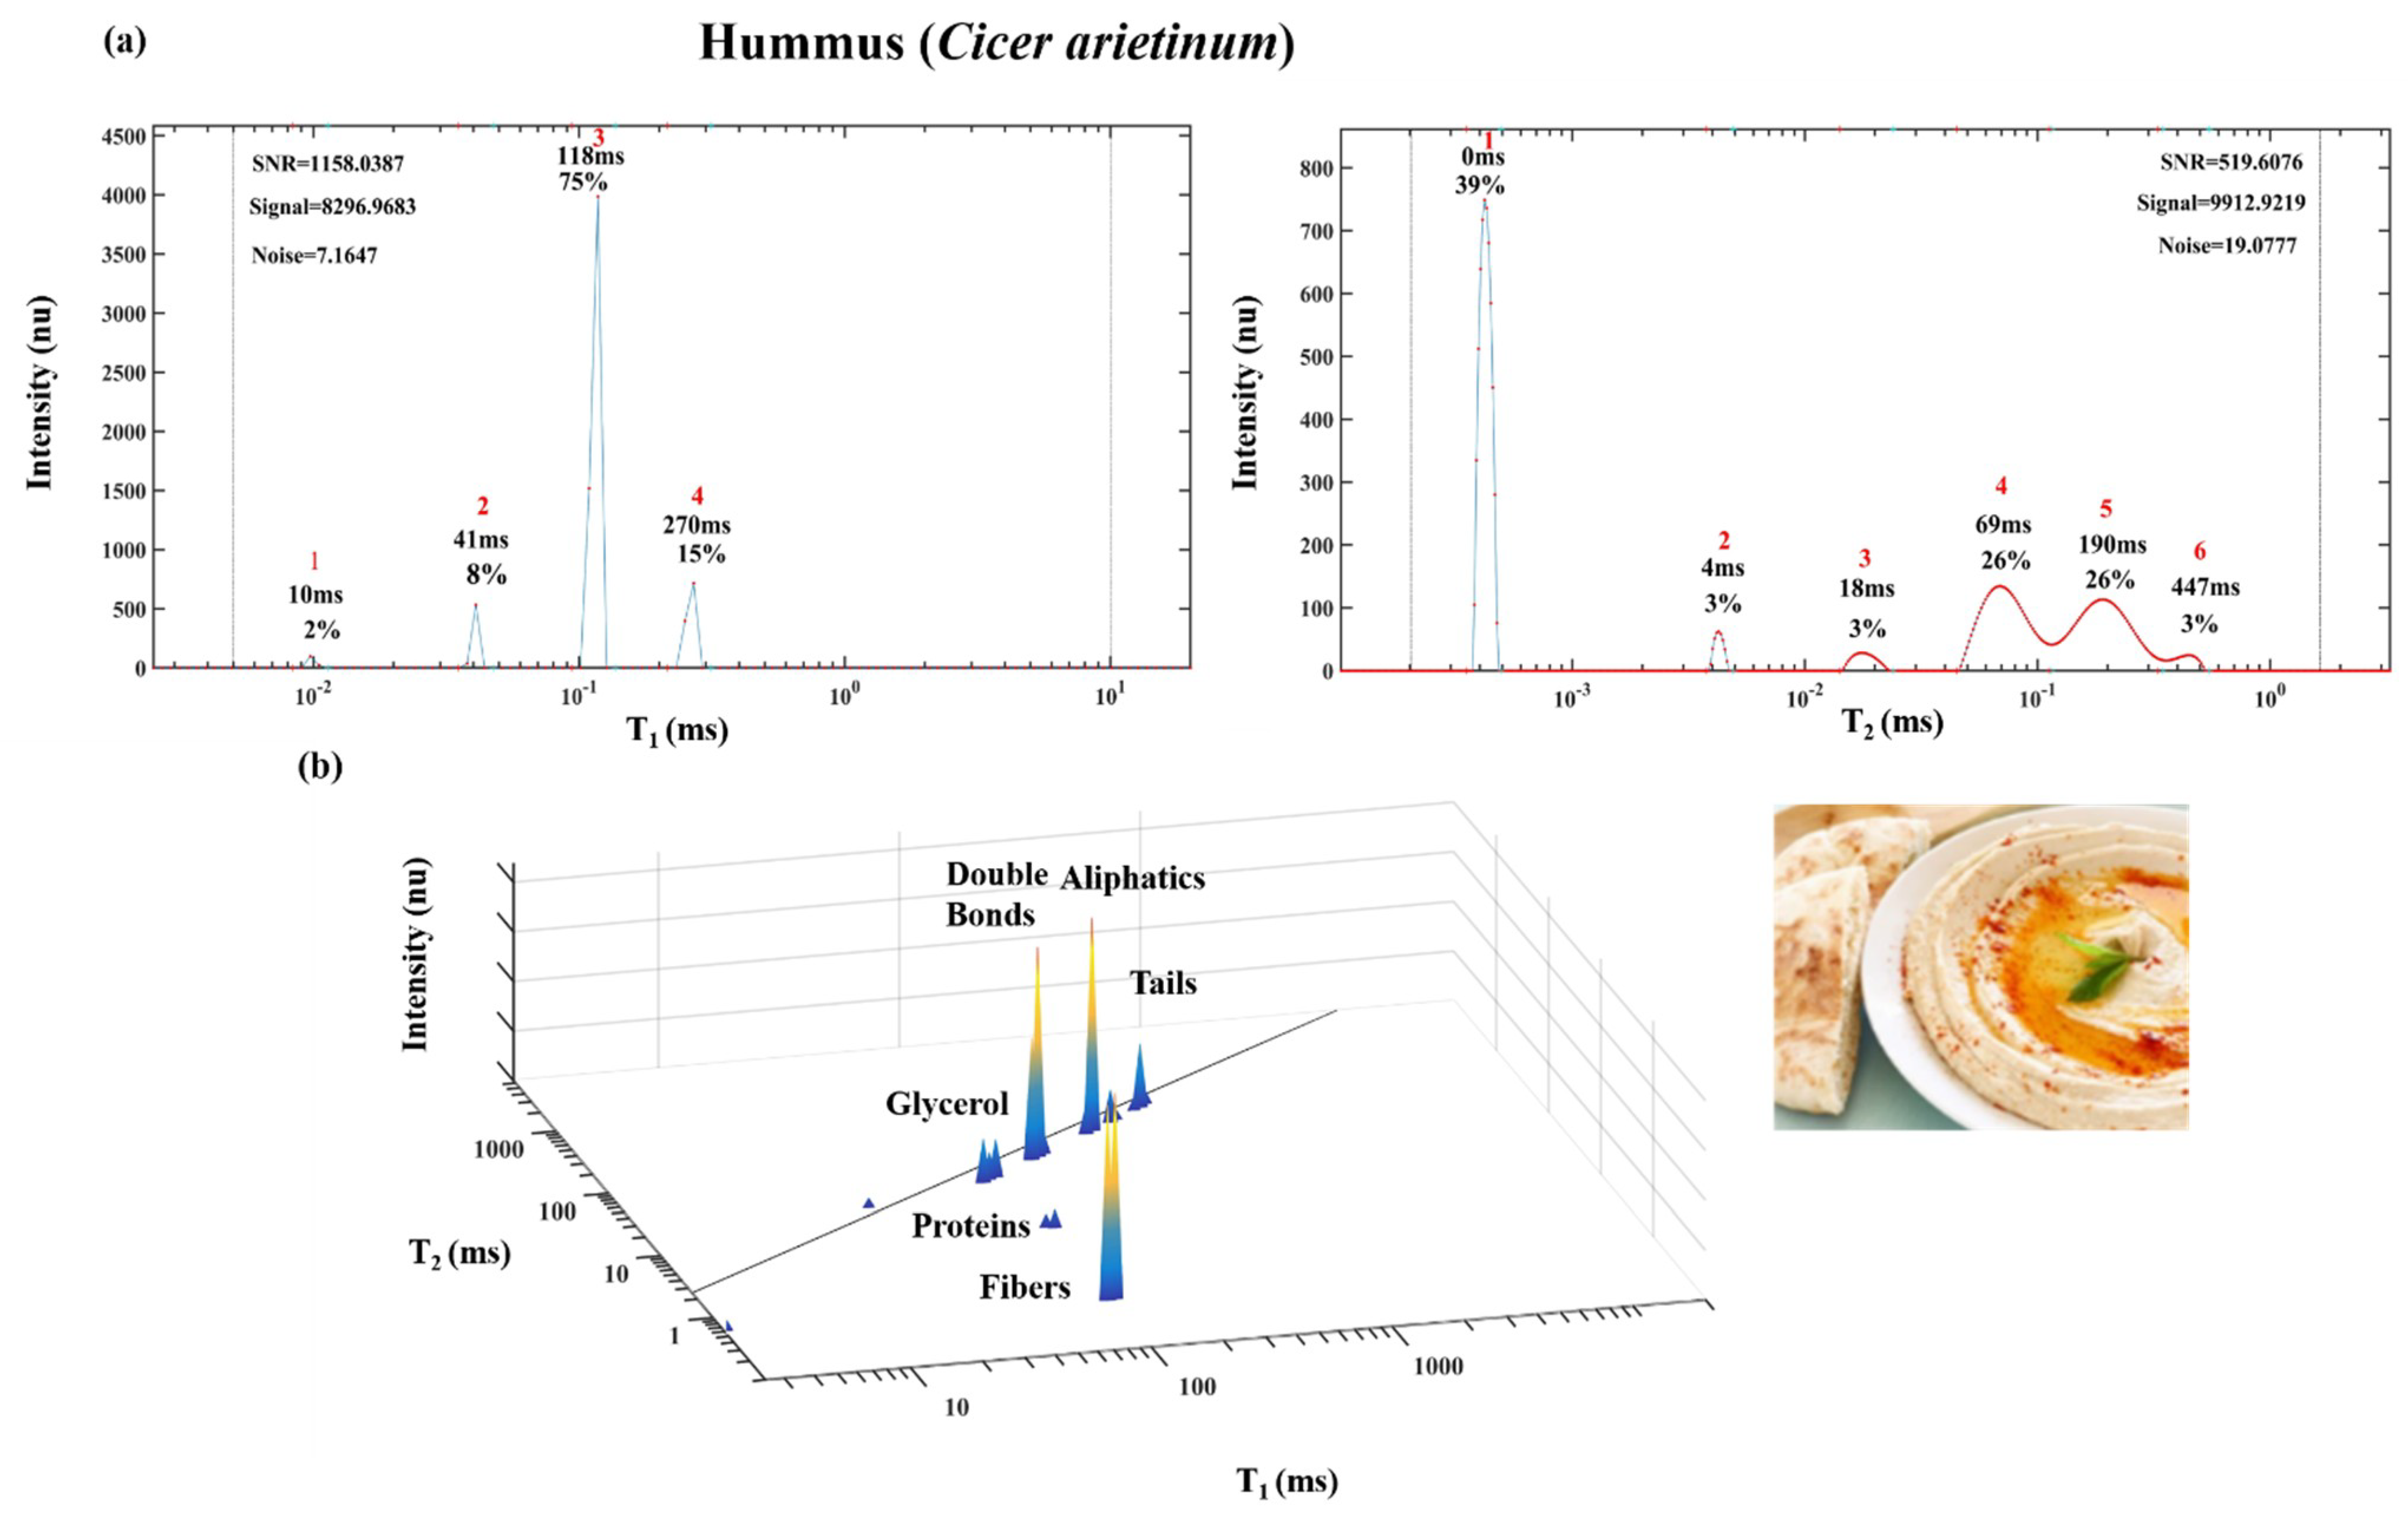
2.1. TD Fingerprint Mapping of FAs, Oils, Seeds and Paste Products

This section demonstrates TD fingerprint mapping of various basic lipid components in food products. In addition to the FAs dimer head-to-head microstructural morphology, self-assembly as described above in the introduction section (Figure 1 [25]), Figure 7 shows the 2D T1-T2 LF NMR sensor analysis of two standard PUFA dimers, linoleic acid (18:2) and linolenic acid (18:3). The rigidity/mobility of the different segments in these two PUFAs is marked (Figure 7a,b, respectively). Most rigid head-to-head segments correspond to peak 1 in the T1 vs. T2 spectra. Second rigid double bonds segment, relatively mobile aliphatic chain segment and most mobile tail domain segments correspond to peaks 2, 3 and 4, respectively, as shown and comprehensively described in the publications by Resende et al. [24,27].
The PUFAs linoleic and linolenic acid have similar spectra with four different peaks and each one of these peaks is correlated with one of the PUFA’s segmental motion TD [21,44], with the major difference being in the mobile terminal aliphatic chains T1 and T2 values. As tabulated in Table 1, peak 1 had the most rigid/lowest values of T1 and T2 (T1 (18:2) 320 ms and T2 (18:2) 292 ms; T1 (18:3) 309 ms and T2 (18:3) 302 ms), was assigned to the most rigid segment of head-to-head configuration. The second most rigid PUFA segmental motion TD are the double bonds (peak 2 (T1 (18:2) 845 ms and T2 (18:2) 512 ms; T1 (18:3) 442 ms and T2 (18:3) 444 ms)). The more mobile aliphatic chain was assigned as the peak 3 (T1 (18:2) 1111 ms and T2 (18:2) 852 ms; T1 (18:3) 1099 ms and T2 (18:3) 927 ms). The most mobile PUFA segmental motion TD is the tail, with the longest relaxation times (peak 4 (T1 (18:2) 1267 ms and T2 (18:2) 950 ms; T1 (18:3) 2288 ms and T2 (18:3) 1948 ms)).
Food oils based on triacylglycerides (TAGs) were also readily characterized by 1H LF NMR and T1 and T2 reconstruction into TD graphics. Figure 8 shows linolenic rich linseed oil’s (LSO) 1D T1 and T2 and 2D T1 vs. T2 relaxation time spectra. LSO’s chemical structure is characterized by four different segmental motion TD: glycerol, double bonds, aliphatic chain and tail as shown for the fatty acids in Figure 8 and Table 2. The NMR relaxation analyses gives a spectrum (Figure 8) with four peaks and these peaks were correlated with the PUFA’s rich LSO segmental motions TDs. Glycerol is the most rigid TD and therefore it corresponds to peak 1 with the lowest values of T1 and T2. Double bonds are the second most rigid TD and assigned to peak 2. The more mobile aliphatic chain is assigned to peak 3 with higher values of T1 and T2. The tail is the most mobile TD and it is assigned to peak 4 with the highest values of T1 and T2. These values differ significantly from the T1 and T2 values of the FAs linoleic and linolenic acids shown in Table 1, because free FAs without a glycerol connectivity, have different self-assembled aggregate structures as would be expected from the TAG’s molecular structures. This demonstrates the efficiency of the chemical and morphological TD fingerprinting technology to characterize different fats and oils.
Figure 9 shows sesame seeds’ oils and fibers 1D T1 and T2 and 2D T1 vs. T2 energy relaxation time spectra. The chemical structure of sesame seed oil is characterized by the four lipids different segmental motion TD: glycerol, double bonds and aliphatic chain described above. In this example, an additional segment appears below the diagonal line at lower T1 and T2 that represents solid fibers as determined based on standards [8]. The large difference between linseed oil (Figure 8) and the T1 and T2 values of sesame seed oils (Figure 9), shows the potential of characterizing the differences between the oils.
As shown below, T1 vs. T2 spectra that can also be generated for biological aggregate structures such as microalgae (Figure 10), humus seed paste (Figure 11) and many other organic food products.
Figure 10 shows dry red microalgae prepared from Porphyridium cruentum sp., 1D T1 and T2 and 2D T1 vs. T2 energy relaxation time spectra. The chemical structure of dry microalgae is also characterized by a lipid TD close to the diagonal line, in the 2D spectra. Additional TDs below the diagonal are obtained and assigned to a protein (based on a standard). In the lowest T2 level, three TDs according to the increasing levels of T1 are obtained. This last group of TDs are assigned as sulfonated polysaccharides most abundant in Porphyridium cruentum sp. red microalgae [52]. The lowest T1 TD is assigned to the most crystalized polysaccharide and the longest T1 is the most amorphous sulfonated polysaccharide [8].
Figure 11 shows humus paste product prepared from Cicer arietinum seeds with added olive oil, and their 1D T1 and T2 and 2D T1-T2 energy relaxation time spectra. The chemical structure of humus product is also characterized by the lipid’s four different segmental motion TD: glycerol, double bonds, aliphatic chain and aliphatic tail as described above. In this paste product, an additional two segments appear below the diagonal line. One segment is assigned, based on the standard, to a protein and the second is assigned to lignocellulose solid fibers.

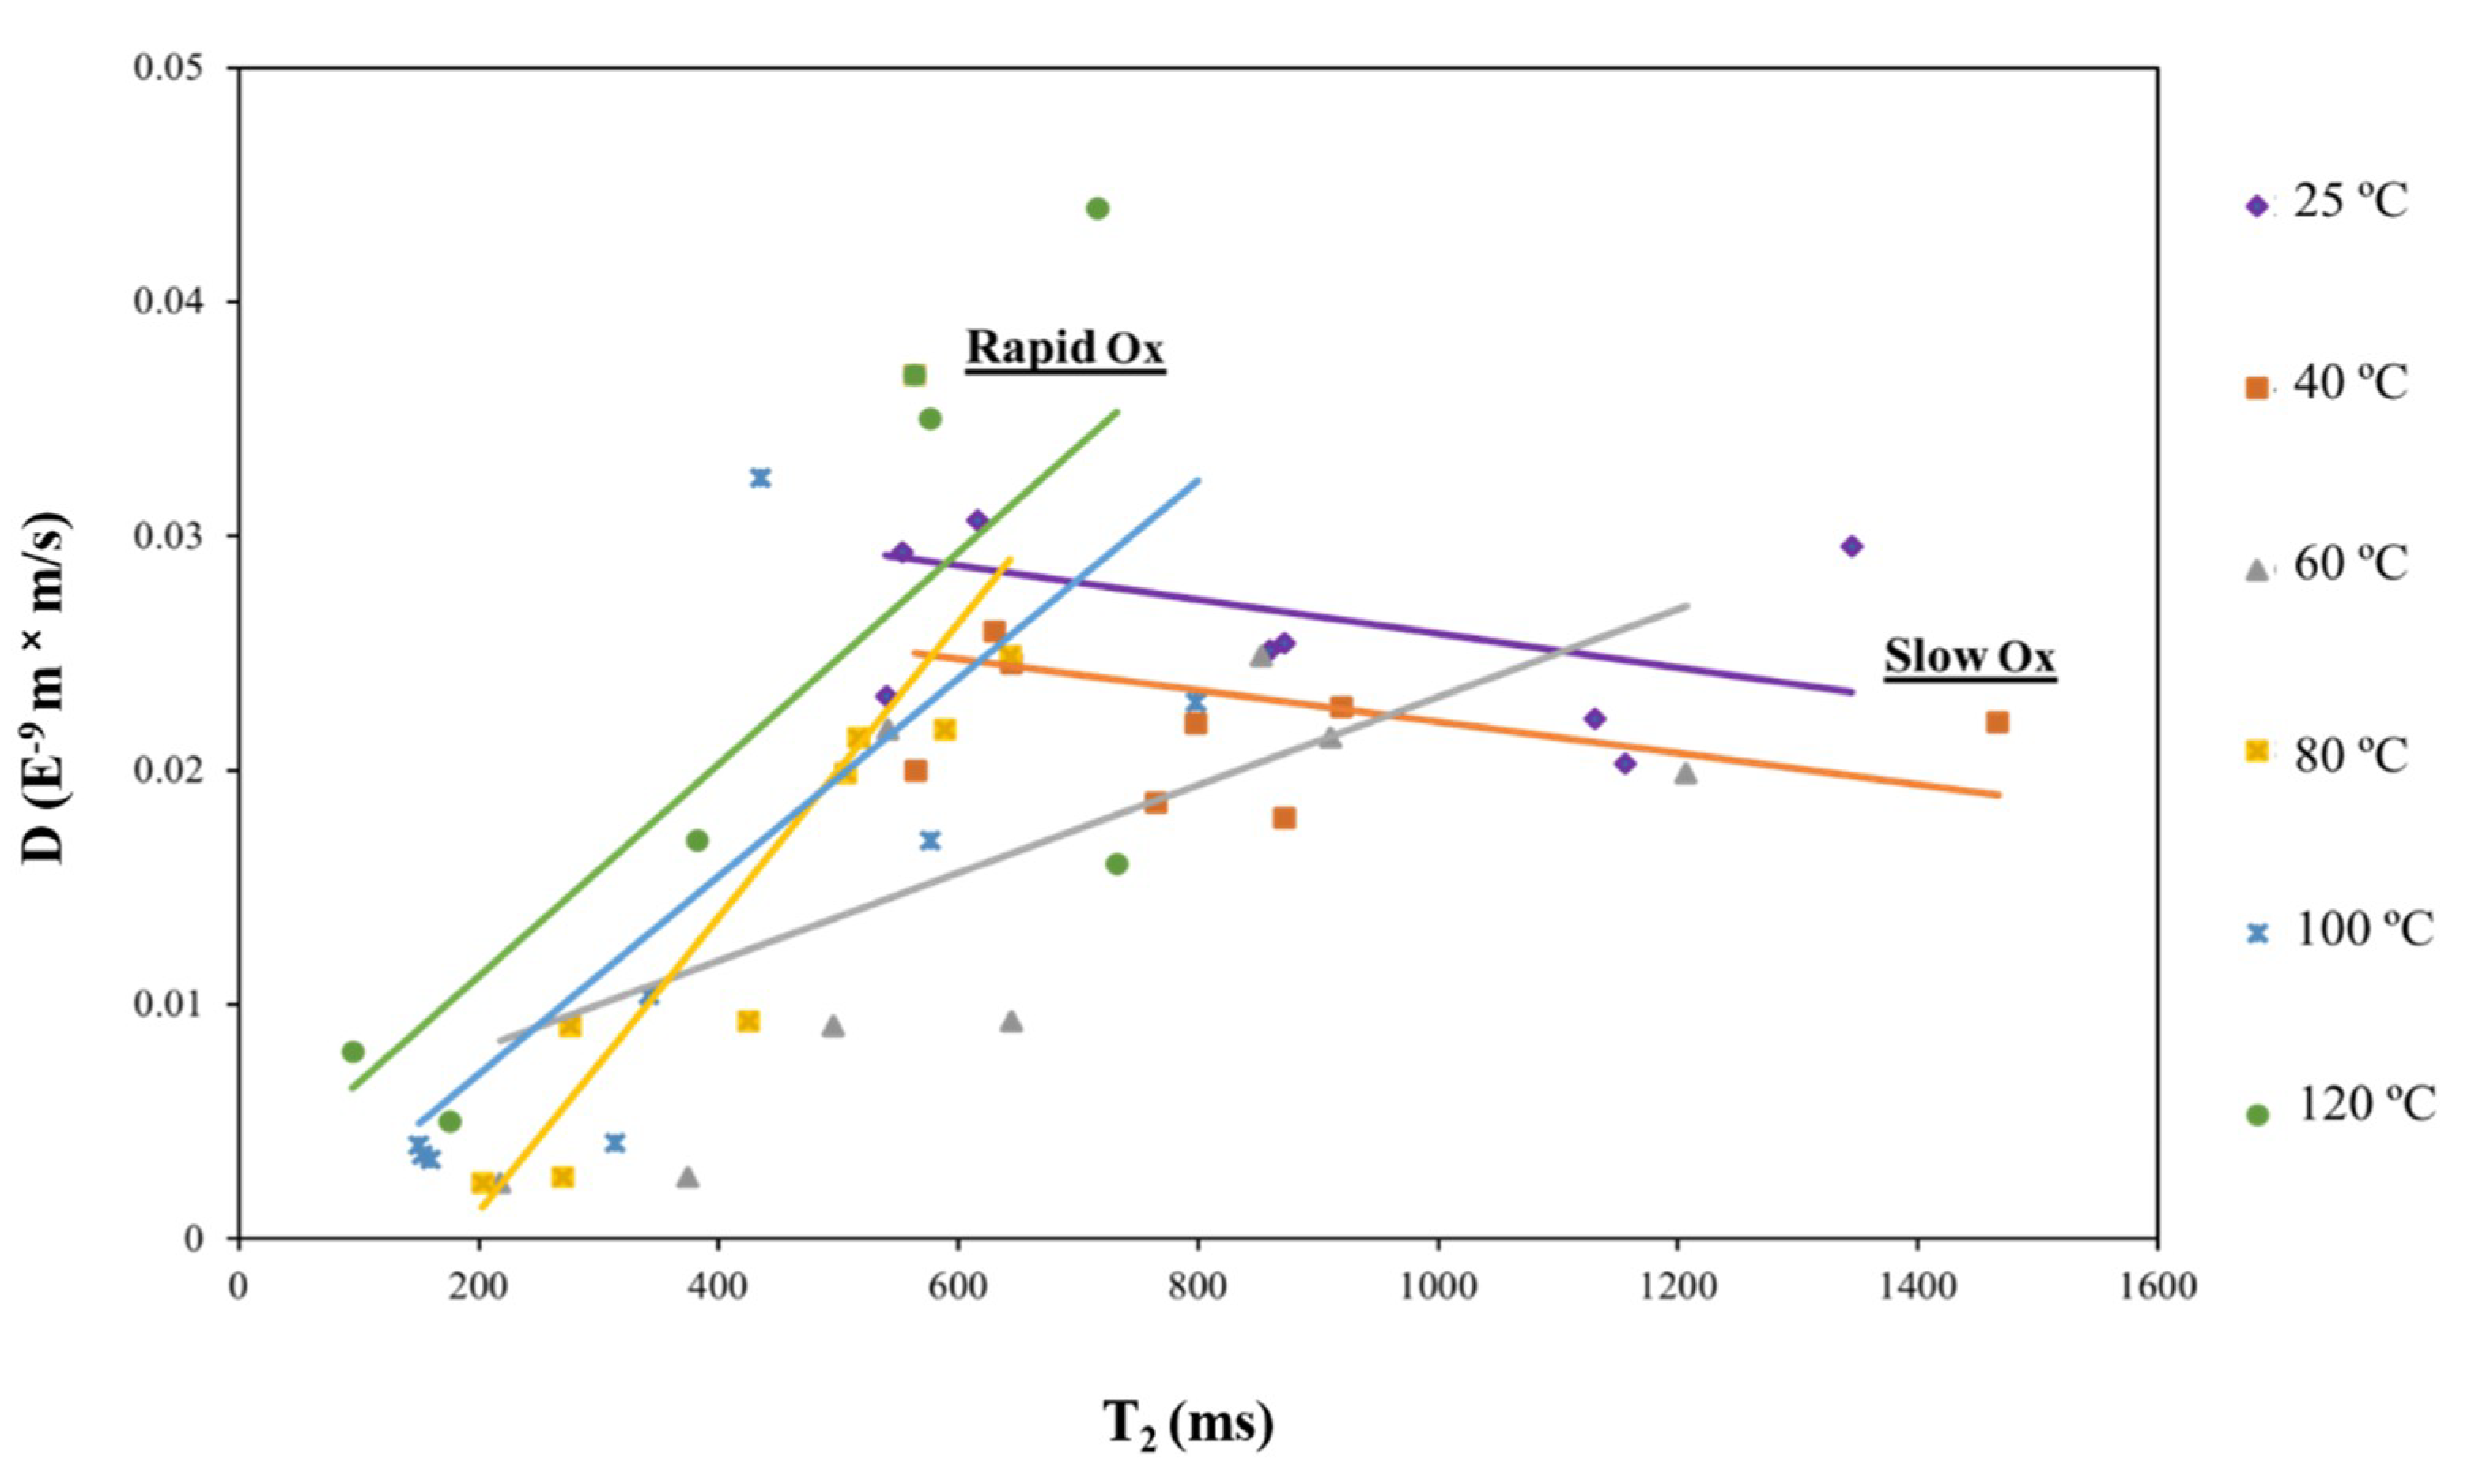
2.2. Demonstration of TD Sensor Fingerprint Mapping of FA Oil Oxidation

The analysis of molecular configuration and aggregate structures of PUFA oils or within their O/W emulsions with respect to its susceptibility and degree of oxidation is important for foods and many other applications because of PUFA oil’s facile oxidation into toxic side products. The oxidation process generates both low molecular weight and volatile side products and polymeric structures. Though 1H LF NMR was providing only limited and basic chemical information, it has recently proven to be useful for characterizing dynamical properties of polymer chains [52]. The magnitude of the energy relaxation times T1 and T2 are dependent upon the interaction between proton spins and their surrounding environment (lattice) that is modulated by molecular mobility. In fact, there is a well-known dependence with the motional correlation time τc, described by the BPP equations (Bloembergen–Purcell–Pound) [53]. Thus, practically for the liquid phase of small molecules including fatty acids and oils, T1 and T2 values for a given TD are similar. For polymers, proteins and large molecules while T2 is continuously decreasing T1 is increasing. Taking advantage of this phenomena related to chemical and structural changes, it was possible to develop the present 1H LF NMR TD sensor application to monitor a lipid’s oxidation process.
Linseed oil (LSO) oxidation results in structural and physical changes of the oil, which could be followed by our 1H LF NMR TD sensor with high efficacy (Resende et al., [10,17]). As LSO is a relatively small molecule the T1 and T2 have similar values on the diagonal (Figure 12). The glycerol 1H is the most rigid TD and therefore is characterized by lower T1 and T2 values, followed by the double bond and the aliphatic chain TD respectively. The tail is the most mobile TD and therefore corresponds to the peak of highest values of T1 and T2. After 96 h of oxidation at 80 °C, the 2D T1-T2 energy relaxation time spectra shows formation of new peaks that are the oxidation products resulting from crosslinking and polymerization in the termination phase of oxidation. The relatively high molecular weight of the oxidation products is characterized by different values of T1 and T2 per peak, forming the characteristic oxidized bending effect from the T1 = T2 diagonal in the spectra curve. The four characteristics LSO TDs (peaks 1–4) remain but they have lower values because of the secondary interactions between the non-oxidized LSO and its oxidation products.
The speed with which data is obtained and the complexity of the signal acquired can become overwhelming unless suitable methods for interpretation are used. For industrial on-line monitoring of food production with PUFA components, rapid analysis of the oxidation status of the components would be important. In one of our recent studies [34], the T2 values of the oil’s aliphatic chain tail oxidation could be rapidly monitored to measure the samples degree of oxidation. The omega-3 linolenic acid-rich LSO molecular structure and the released aldehydes as determined by GC–MS analysis are shown in Figure 13a. The specific T2 NMR values of the different LSO molecular components are shown in Figure 13b wherein the tail segment’s T2 is used to follow oxidant degradation as shown by the changing T2 values in Figure 13c. This is a graphic presentation of LSO tail T2 values changes during heating at 25, 40, 60, 80, 100 and 120 °C, together with air pumping for 168 h (25 and 40 °C is designated as Group A and 60, 80, 100 and 120 °C designated as Group B).
Figure 13a shows a simplified scheme of LSO oxidation decomposition. LSO is composed mainly of the FA linolenic acid (55%). The LSO chemical structure is a triacylglycerol (TAG) with two linolenic acid and one oleic acid. The FA’s tails are circled in red, that during oxidation cleave forming the volatile low molecular weight aldehyde malonaldehyde (MDA) and the high molecular weight non-volatile aldehydes 4-hydroxy-trans-2-nonenal (HNE) and 4-hydroxy-trans-2-hexanal (HHE) that remain within the oxidized oil and react with other oxidation products forming highly cross-linked polymer products that increase the oxidized oils viscosity.
Figure 13b presents a 1D T2 relaxation time spectra of LSO. Although the 2D T1-T2 spectra was reported to efficiently characterize PUFA rich material’s oxidation [24,27], its relatively long acquisition time (e.g., T2 20 s vs. 20 min for T1) limits its application for on-line and at-line industrial production processes [7]. Considering that T1 and T2 have almost equal values for relatively small molecules such as TGA, but T1 has technically a longer acquisition time, the 1D T2 TD is more appropriated for a rapid NMR relaxation methodology for monitoring of LSO oxidation. Data processing based on PDCO is able to efficiently reconstruct the T2 NMR signal onto spectra. The T2 reconstructed spectra characterizes both chemically and morphologically the different segmental sections of LSO: glycerol, double bonds, aliphatic chain and tail. Glycerol is the most rigid segment, and it is assigned to peak 1 with the shortest T2 relaxation time. Double bonds are the second most rigid segments and they assigned to peak 2. Aliphatic chains are more mobile and corresponds to peak 3. Highlighted in red the most mobile segment is the aliphatic tail chain that corresponds to peak 4 with the longest T2.
This study suggests a methodology that uses TD tail T2 values as a marker for a rapid assessment of PUFA’s rich oil oxidation such as LSO. Figure 13c shows LSO tail T2 values during oxidation at 25, 40, 60, 80 and 120 °C during 168 h. The LSO tail segments T2 before oxidation was approximately 750 ms. The oxidation curves were separated into two groups: A (slow oxidation) and B (rapid oxidation).
To further support this last finding, self-diffusion tests using 1H LF NMR were carried out for each of the samples. Self-diffusion provides good and accurate physical information regarding the movement and mixing capability of the components included in the sample [16,34]. It is well known to correlate with the samples measured viscosity (not shown). Figure 14 shows the correlation between the NMR self-diffusion (D) values and the T2 tail values of the LSO oxidized at 25, 40, 60, 80, 100 and 120 °C during 168 h. The results show that the LSO autoxidation follows two different patterns according to the oxidation temperature. The LSO samples oxidized at low temperatures (25 and 40 °C) have a T2 vs. D curve with a negative slope, which can be rationalized by the slow LSO oxidation rate, and formation of low MW products, which decrease viscosity. LSO samples, however oxidized at higher temperatures (60 80, 100 and 120 °C) are characterized by a positive T2 vs. D slope, which can be explained by the rapid LSO oxidation rate and formation of high MW products that increase viscosity. The temperature of 60 °C although also presents a positive slope, it is more moderated than the ones of higher temperatures. Therefore, 60 °C is considered the initial point for a rapid LSO oxidation [34].

2.3. Demonstration of TD Sensor Fingerprint Mapping of Food O/W Emulsion Products and Oxidation

Linseed O/W emulsions (LSEs) of the present study are made from linseed oleosomes (oil bodies, OB) as described in detail by Resende et al. [41]. In Section 2.2 the structural organization of LSE vesicles was described as oil encapsulated on the inside by different interfacial components such as polar head groups of amphiphiles, with their hydrophobic tails within the vesicle’s core isolated from the continuous aqueous matrix environment. The interfacial surface of LSE’s vesicles has phospholipids, residual linseed mucilage components and amphiphilic proteins such as oleosins, caleosins and steroleosins [54,55]. These interfacial surface components are responsible for the physical stability of the OB’s vesicles and therefore the emulsion’s stability. In the present review paper, the chemical and morphological structures of the linseed emulsions (LSE) and LSE with coencapsulated fish oil (LSFE) are characterized in terms of the OB’s vesicles chemical and morphological structures with a multicomponent amphiphilic surface and lipophilic core of encapsulated PUFA-rich oil. Linseed OB aggregates have structural components that are postulated to enhance the stability against oxidation of the internal encapsulated PUFA oils [38].
1H LF NMR relaxation was used to characterize chemical and structural LSE O/W emulsions before and after thermal oxidation. Figure 15 shows the 1D T1 and T2 and 2D T1-T2 relaxation time spectra and Table 3 numerical TD values of LSE before and after 96 h of thermal oxidation at 55 °C. 1H LF NMR relaxation sensor analysis indicates in the T1-T2 fingerprinting map two main TDs: one is the TAG molecules inside the vesicle’s core and the other is the vesicle’s interfacial surface. The 1D T1 relaxation time spectra for LSE T-0 h and LSE T-96 h show three small peaks that are postulated to correspond to the TAG molecules inside the OB’s core and one peak of higher intensity that corresponds to the OB’s interfacial surface. The high peak of the surface is explained by the fact that the outer surface layer of the OB particles contains a significantly higher level of protons in comparison to the OB’s core encapsulated hydrophobic oil, due to the bound and associated water. The 1D T2 relaxation time spectra for LSE T-0 h and LSE 96 h present four small peaks that are assigned as the PUFA-rich oil molecules within the OB’s core and one peak of higher intensity that corresponds to the OB’s interfacial surface. The 2D T1-T2 relaxation time spectra of LSE T-0 h and LSE T-96 h show three small peaks assigned as the PUFA-rich oil molecules within the OB’s core and one peak of higher intensity that corresponds to the OB’s interfacial surface. It is interesting to note that the emulsion LSE before and after 96 h of oxidation have similar relaxation patterns. However, the T1 and T2 peaks values presented in the table in Figure 15, showed that the sample of LSE after T 96 h oxidation has somewhat lower relaxation times than the fresh LSE sample at T 0 h. This is most probably due to some thermal oxidation and resulting increase in internal viscosity. The degree of oxidation, however within the LSE emulsions extracted from the oil body has significantly less oxidations according to the changes in T values before and after oxidation, than LSO shown in Figure 12 and Figure 14.
Using other conventional analyses of physical and structural properties of non-heated (T-0) and heated (T-96) LSE well supports the explanation of results obtained by 1H LF NMR TD relaxation sensor. Testing of self-diffusion of LSE samples before and after thermal heating for 96 h shows a small decrease from 2.750 to 2.383 10−9 m*m/s, respectively, suggesting a small viscosity increase of the LSE emulsion. Dynamic light scattering (DLS) analysis shows an increase of OB size from 803.2 nm at T 0 h to 1363 nm after T 96 h of thermal heating. This increase in particle size can be correlated to the decrease in peak intensity for the major peak in the oxidized sample vs. that of the major peak in the non-oxidized initial sample, as these peaks are due to the interfacial 1H and thus total emulsion particle size. Furthermore, the results of zeta potential assay show values of −29.1 mV and −28.7 mV for T 0 h and T 96 h, respectively. Usually, it is accepted that emulsion preparations with values of zeta potential above −40 mV are considered as very stable and values of about −30 mV are considered to represent moderate stability [56].

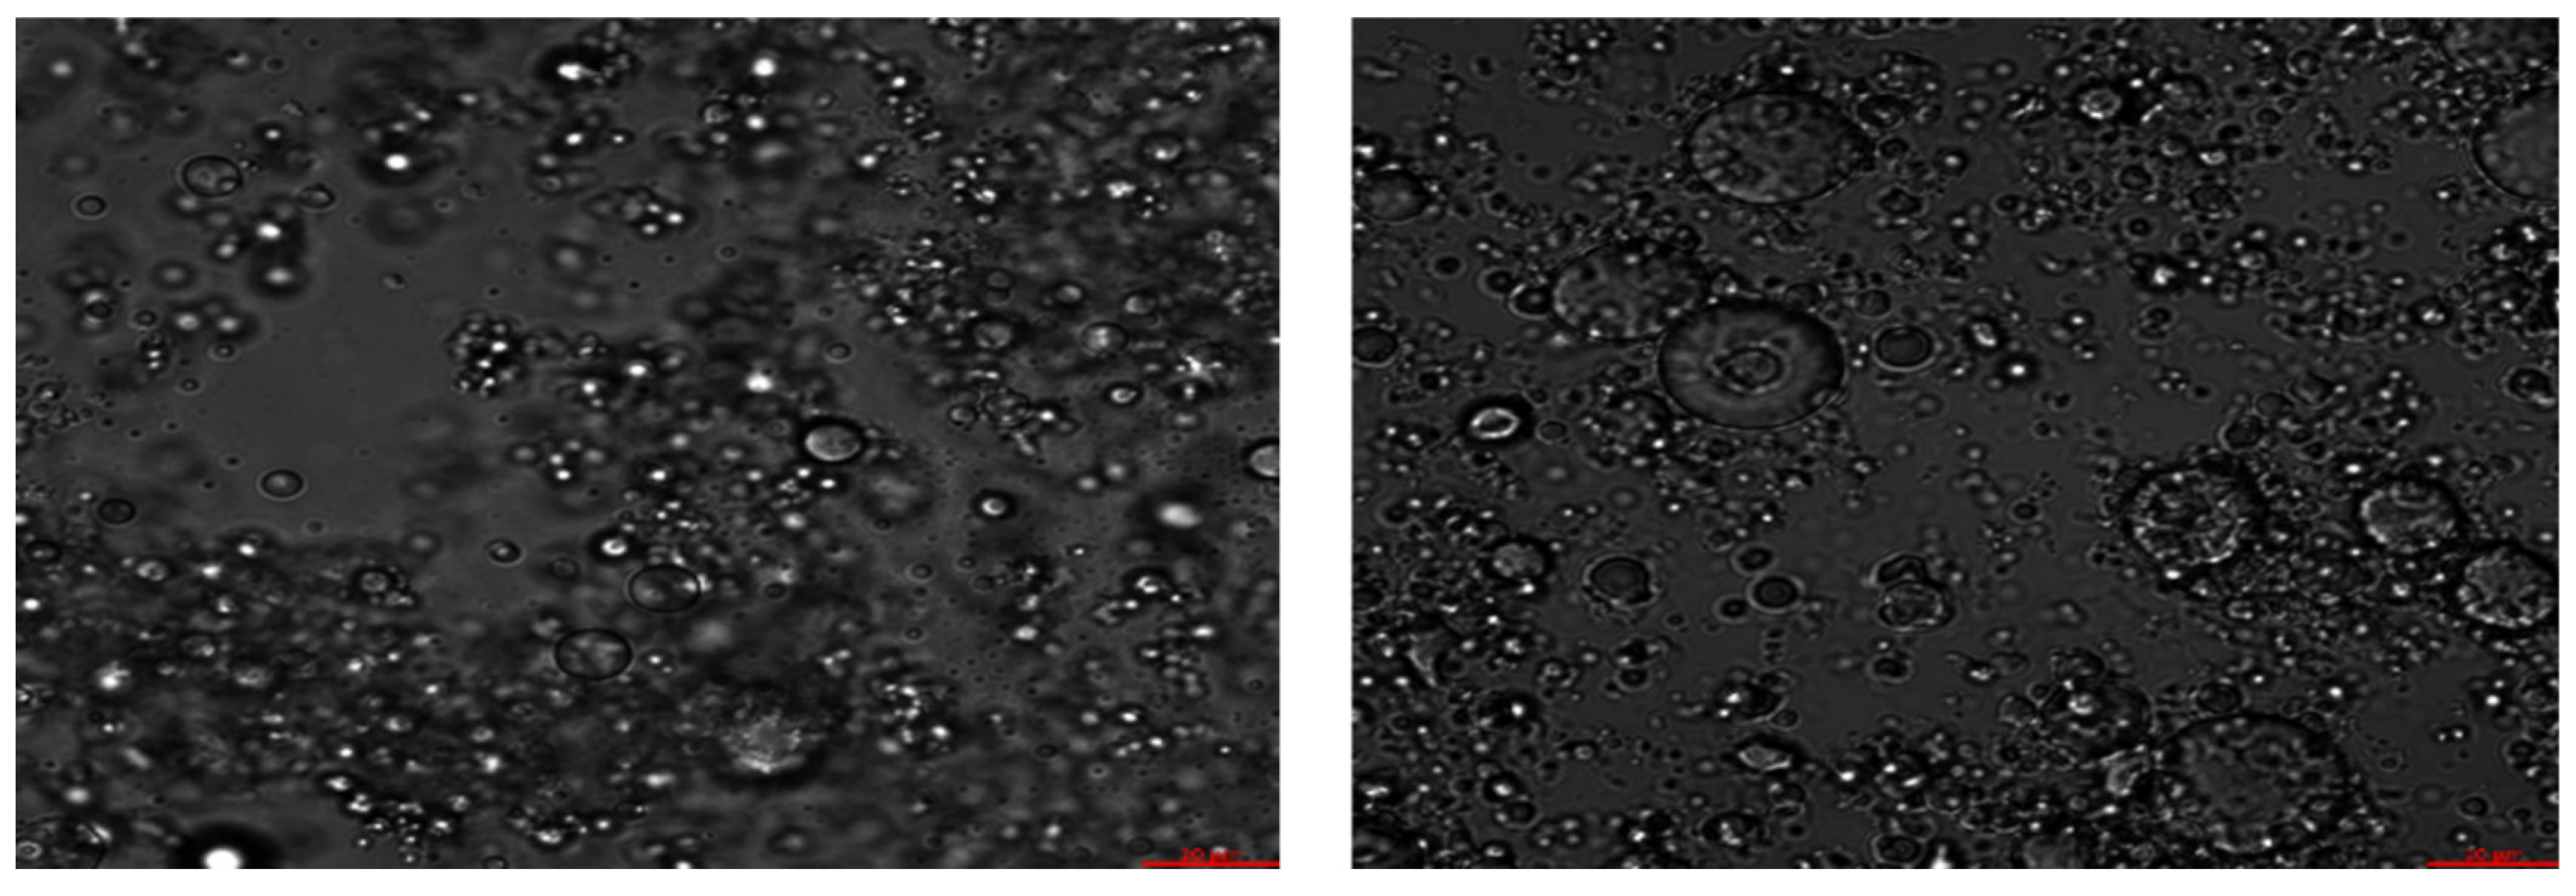
2.4. Demonstration of TD Sensor Fingerprint Mapping of Oleosome Oil Bodies Encapsulating of External Oils

There is increasing interest in using oil bodies as natural emulsions and novel carriers for the delivery of lipophilic bioactive molecules [56]. During the preparation of linseed oil body emulsions, and oil bodies of other seeds, the addition of external oils such as fish oil (FO) with omega-3 FA EPA and DHA, can be coencapsulated and coprotected with linseed oils against oxidation. In the present review paper, the chemical and morphological structures of the linseed emulsions (LSE) with coencapsulation of fish oil (LSFE) are described and characterized in terms of the OB’s vesicles chemical and morphological structures with a multicomponent amphiphilic surface and lipophilic core of PUFA-rich coencapsulated fish oil.
LSFE was prepared by the addition of FO, rich with long chain PUFAs, EPA and DHA. The chemical and morphological structure of LSFE is characterized by OB vesicles of linseed, with an amphiphilic interface surface and lipophilic core encapsulating PUFA-rich LSO and FO. The 1H LF NMR energy relaxation TD fingerprinting for LSFE before (T 0 h) and after thermal oxidation at 55 °C for 96 h (T 96 h) are shown in Figure 16.
It is interesting, that before and after thermal oxidation at 55 °C for 96 h only minimal phase separation could be visually observed in the LSFE samples. 1H LF NMR TD sensor analysis as seen in Figure 16 shows that LSFE T 0 h and LSFE T 96 h had similar T1 and T2 TD graphic pattern, as was obtained for LSE in Figure 15. The 2D T1-T2 relaxation TD fingerprint maps of LSFE T 0 h and LSFE T 96 h show small peaks assigned as the PUFA-rich oil molecules within the OB core and one peak of higher intensity related to the energy relaxation time on the OB’s vesicle surface.
The Table in Figure 16 of the T1 and T2 numerical TD values of LSFE T 0 h and LSFE T 96 h indicates that the values of T1 and T2 of the main peak assigned to the vesicle’s surface were somewhat lower for LSFE after the thermal oxidation of 96 h as were most of the other peaks that could be observed. This data had the same general pattern obtained for LSE (Table 4).
Microscopic images of LSFE OB emulsion before and after 96 h of thermal heating (Figure 17) shows some small increase of OB size upon heating. In both cases before and after heating only minimal phase separation could be observed in the LSFE samples. These results were similar to the microscopic images shown for LSE.
Similarly, to the pattern obtained for LSE without FO, the sample of LSFE shows some increase of droplet particle size distribution from 1374 to 1951 nm for fresh and heated sample (Table 5) respectively. Zeta potential values for LSFE were −27.3 and −25.1 mV for the two samples, suggesting a moderate stability of the emulsion samples. The rate of self-diffusion was slightly reduced from 2.902 to 2.734 10−9 m*m/s, respectively, suggesting again a moderate increase of vesicle size and/or internal viscosity. Furthermore, results of PV tests correlate well with all the previous data regarding LSE and LSFE samples, and only a small increase of PV strongly supports to the efficacy of a rapid non-destructive 1H LF NMR TD sensor application to monitor oxidation in complex materials as demonstrated in the present study. The relatively small increase in oxidation products within the samples can be seen by the T1/T2 ratio from 2.07 to 2.61. In addition, considering the reports of emulsion preparation and stability at low refrigerated conditions (4–7 °C) [57], the natural linseed OB emulsion encapsulation PUFA-rich components including FO appears to be relatively stable with high oxidant resistance even under relatively high thermal oxidizing conditions.

3. Summary and Conclusions

In addition to individual PUFA molecules having specific molecular structures, their material functionality and their response to oxidants are strongly dependent on their aggregate structures in food oils or within aqueous emulsions. As shown the chemical and morphological structures of complex aggregate materials can be efficiently monitored by 1H LF NMR and used to measure oxidation and assess antioxidants efficacy. In this review paper we describe the efficacy of the 1H LF NMR and data reconstruction programs in analyzing the chemical and morphological structure of PUFA-rich oils and O/W emulsions of PUFA-rich oleosome-oil bodies from seeds, with and without encapsulation of externally added oils, and their susceptibility to oxidant degradation as a function of their chemical and morphological structure. We demonstrate a facile 1H LF NMR energy relaxation time domain (TD) sensor technology for direct non-modified sample analysis. A prime dual convex objectives (PDCO) optimized solver was used for computational processing of 1H LF NMR energy relaxation curves into the energy relaxation time signals of spin-lattice T1 and spin-spin T2, for 1D or a 2D graphical fingerprinting maps of oils or oil in water emulsions. The individual T1 or T2 or T1 vs. T2 peaks correlated to structural or morphological domains within the material. With this material analysis the molecular configuration and aggregate structures of unsaturated FA oils or FAs within oil/water emulsions can be readily characterized with respect to their chemical and morphological domains, which influences oxidation, and can assess antioxidants efficacy of the components and system. For industrial on-line monitoring of food production with PUFA components, rapid analysis of the components’ oxidation status would be important. It was shown that the T2 values of the oil’s aliphatic chain tail oxidation could be rapidly monitored to measure the samples degree of thermal oxidation. LSO samples oxidized at low temperatures (25 and 40 °C) have a T2 vs. D curve with a negative slope, which can be rationalized by the slow LSO oxidation rate, and formation of low MW products, which decrease viscosity. LSO samples oxidized at higher temperatures (60 80, 100 and 120 °C) are characterized by a positive T2 vs. D slope, which can be explained by the rapid LSO oxidation rate and high MW products that increase viscosity. The temperature of 60 °C although also presents a positive slope, it was more moderated than the ones of higher temperatures. Therefore, 60 °C was considered the initial point for a rapid LSO oxidation.
1H LF NMR analysis of O/W emulsions of PUFA-rich oleosome-oil bodies from seeds show only minimal chemical and structural changes. This well explains linseed emulsion (LSE) without and with fish oil (LSFO) samples significant oxidative stability. These findings were supported by other conventional microscopic and spectral technologies.
The 1H LF NMR TD technology sensor proved to be an effective tool to characterize and monitor PUFA oxidation, and to potentially identify optimal formulations and preparative methods of PUFA aggregate structures. We also demonstrated the potential of characterizing food products such as seeds (sesame seeds) and paste products (e.g., humus paste) and red microalgae not only with respect to the oil contents but also their polysaccharides and protein content. Future direction of this work is to advance the application of this 1H LF NMR sensor for quality control with emphasis of monitoring oxidation process of food products.

Author Contributions

Z.W. and C.L. carried out the experimental design, discussion and conclusions. M.T.R. and T.O. conducted the performance experiment and all the technical aspects. All authors have read and agreed to the published version of the manuscript.

Funding

This research was funded by The Ministry of Science, Technology and Space.

Data Availability Statement

Not applicable.

Conflicts of Interest

The authors declare no conflict of interest.

References

  1. Patterson, E.; Wall, R.; Fitzgerald, G.F.; Ross, R.P.; Stanton, C. Health Implications of High Dietary Omega-6 Polyunsaturated Fatty Acids. J. Nutr. Metab. 2012, 2012. [Google Scholar] [CrossRef] [PubMed]
  2. Ruxton, C.H.; Reed, S.C.; Simpson, M.J.; Millington, K.J. The health benefits of omega-3 polyunsaturated fatty acids: A review of the evidence. J. Hum. Nutr. Diet. 2007, 20, 275–285. [Google Scholar] [CrossRef] [PubMed]
  3. Lacombe, R.S.; Chouinard-Watkins, R.; Bazinet, R.P. Brain docosahexaenoic acid uptake and metabolism. Mol. Asp. Med. 2018, 64, 109–134. [Google Scholar] [CrossRef] [PubMed]
  4. Williams, C.; Burdge, G. Long-chain n−3 PUFA: Plant v. marine sources. Proc. Nutr. Soc. 2006, 65, 42–50. [Google Scholar] [CrossRef] [Green Version]
  5. Yehuda, S.; Rabinovitz, S.; Mostofsky, D.I. Essential fatty acids are mediators of brain biochemistry and cognitive functions. J. Neurosci. Res. 1999, 56, 565–570. [Google Scholar] [CrossRef]
  6. Nikiforidis, C.V.; Matsakidou, A.; Kiosseoglou, V. Composition, properties and potential food applications of natural emulsions and cream materials based on oil bodies. RSC Adv. 2014, 4, 25067–25078. [Google Scholar] [CrossRef] [Green Version]
  7. Hwang, H.-S. Advances in NMR Spectroscopy for Lipid Oxidation Assessment, 1st ed.; Springer Briefs in Foods, Health and Nutrition: Cham, Switzerland, 2017. [Google Scholar]
  8. Wiesman, Z.; Linder, C.; Ayalon, N.; Resende, T.M.; Levi, O.; Bernardinelli, O.D.; Nascimento Mitre, C.I. 2D and 3D Spectrum graphics of the Chemical-Morphological Domains of Complex Biomass by Low Field Proton NMR Energy Relaxation Signal Analysis. Energy Fuels 2018, 32, 5090–5102. [Google Scholar] [CrossRef]
  9. Wiesman, Z.; Linder, C. Facile NMR Relaxation Sensor for Monitoring of Biomass Degradation Products during Conversion to Biogas. In Nuclear Magnetic Resonance, 1st ed.; Khaneja, N., Ed.; IntechOpen: Rijeka, Croatia, 2020; pp. 1–20. [Google Scholar] [CrossRef] [Green Version]
  10. Barbosa, L.L.; Kock, F.V.C.; Silva, R.C.; Freitas, J.C.C.; Lacerda, V., Jr.; Castro, E.V.R. Application of Low-Field NMR for the Determination of Physical Properties of Petroleum Fractions. Energy Fuels 2013, 27, 673–679. [Google Scholar] [CrossRef]
  11. Guo, J.-C.; Zhou, H.-Y.; Zeng, J.; Wang, K.-J.; Lai, J.; Liu, Y.-X. Advances in low-field nuclear magnetic resonance (NMR) technologies applied for characterization of pore space inside rocks: A critical review. Pet. Sci. 2020, 17, 1281–1297. [Google Scholar] [CrossRef]
  12. Berman, P.; Leshem, A.; Etziony, O.; Levi, O.; Parmat, Y.; Saunders, M.; Wiesman, Z. Novel 1H Low Resolution (LR)-NMR Applications for the Biodiesel Industry. Biotechnol. Biofuels 2013, 6, 55–75. [Google Scholar] [CrossRef] [Green Version]
  13. Song, Y.-Q.; Venkataramanan, L.; Hürlimann, M.; Flaum, M.; Frulla, P.; Straley, C. T1-T2 Correlation Spectra Obtained Using a Fast Two-Dimensional Laplace Inversion. J. Magn. Reson. 2002, 154, 261–268. [Google Scholar] [CrossRef]
  14. Kroeker, R.M.; Henkelman, R.M. Analysis of biological NMR relaxation data with continuous distributions of relaxation times. J. Magn. Reason. 1986, 69, 218–235. [Google Scholar] [CrossRef]
  15. Hahn, E.L. Spin Echoes. Phys. Rev. 1950, 80, 580–594. [Google Scholar] [CrossRef]
  16. Carr, H.Y.; Purcell, E.M. Effects of Diffusion on Free Precession in Nuclear Magnetic Resonance Experiments. Phys. Rev. 1954, 94, 630–638. [Google Scholar] [CrossRef]
  17. Meiboom, S.; Gill, D.R. Modified Spin-Echo Method for Measuring Nuclear Relaxation Times. Rev. Sci. Instrum. 1958, 29, 688–691. [Google Scholar] [CrossRef] [Green Version]
  18. Abragam, A. The Principles of Nuclear Magnetism; Oxford University Press: Oxford, UK, 1961. [Google Scholar]
  19. McDonald, P.; Korb, J.-P.; Mitchell, J.; Monteilhet, L. Surface relaxation and chemical exchange in hydrating cement pastes: A two-dimensional NMR relaxation study. Phys. Rev. E 2005, 72, 011409. [Google Scholar] [CrossRef] [Green Version]
  20. Callaghan, P.; Godefroy, S.; Ryland, B. Diffusion–relaxation correlation in simple pore structures. J. Magn. Reson. 2003, 162, 320–327. [Google Scholar] [CrossRef]
  21. Berman, P.; Levi, O.; Parmat, Y.; Saunders, M.; Wiesman, Z. Laplace Inversion of LR-NMR Relaxometry Data using Sparse Representation Methods. Concept. Magn. Reson. A 2013, 42, 72–88. [Google Scholar] [CrossRef] [Green Version]
  22. Campisi-Pinto, S.; Levi, O.; Benson, D.; Cohen, M.; Resende, M.T.; Saunders, M.; Linder, C.; Wiesman, Z. Analysis of the Regularization Parameters of Primal–Dual Interior Method for Convex Objectives Applied to 1H Low Field Nuclear Magnetic Resonance Data Processing. Appl. Magn. Reson. 2018, 49, 1129–1150. [Google Scholar] [CrossRef]
  23. Campisi-Pinto, S.; Resende, M.T.; Levi, O.; Benson, D.; Cohen, M.; Saunders, M.; Linder, C.; Wiesman, Z. Simula-tion-Based Sensitivity Analysis of Regularization Parameters for Robust Reconstruction of Complex Material’s T1-T2 1H LF-NMR Energy Relaxation Signals. Appl. NMR 2020, 51, 41–58. [Google Scholar]
  24. Resende, M.T.; Campisi-Pinto, S.; Linder, C.; Wiesman, Z. Multidimensional proton nuclear magnetic resonance relaxation morphological and chemical spectrum graphics for monitoring and characterization of polyunsaturated fatty acid oxidation. J. Am. Oil Chem. Soc. 2019, 96, 125–135. [Google Scholar] [CrossRef]
  25. Berman, P.; Meiri, N.; Colnago, L.A.; Moraes, T.B.; Linder, C.; Levi, O.; Parmet, Y.; Saunders, M.; Wiesman, Z. Study of liquid-phasemolecular packing interactions and morphology of fatty acid methyl esters (biodiesel). Biotechnol. Biofuels 2015, 8, 12. [Google Scholar] [CrossRef] [Green Version]
  26. Iwahashi, M.; Kasahara, Y. Dynamic molecular movements and aggregation structures of lipids in a liquid state. Curr. Opin. Colloid Interface Sci. 2011, 16, 359–366. [Google Scholar] [CrossRef]
  27. Resende, M.T.; Linder, C.; Wiesman, Z. 1H LF-NMR energy relaxation time characterization of the chemical and mor-phological structure of PUFA-rich linseed oil during oxidation with and without antioxidants. Eur. J. Lipid Sci. Technol. 2019, 121, 1800339–1800347. [Google Scholar] [CrossRef]
  28. Shi, C.; Zhang, L.; Xie, L.; Lu, X.; Liu, Q.; He, J.; Mantilla, C.A.; Berg, F.G.A.V.D.; Zeng, H. Surface Interaction of Water-in-Oil Emulsion Droplets with Interfacially Active Asphaltenes. Langmuir 2017, 33, 1265–1274. [Google Scholar] [CrossRef]
  29. Nilsen-Nygaard, J.; Sletmoen, M.; Draget, K.I. Stability and interaction forces of oil-in-water emulsions as observed by optical tweezers—A proof-of-concept study. RSC Adv. 2014, 4, 52220–52229. [Google Scholar] [CrossRef]
  30. Khalil, A.; Puel, F.; Chevalier, Y.; Galvan, J.-M.; Rivoire, A.; Klein, J.-P. Study of droplet size distribution during emulsi-fication process using in situ video probe coupled with an automatic image analysis. Chem. Eng. J. 2010, 165, 946–957. [Google Scholar] [CrossRef]
  31. McClements, D.J. Critical Review of Techniques and Methodologies for Characterization of Emulsion Stability. Crit. Rev. Food Sci. Nutr. 2007, 47, 611–649. [Google Scholar] [CrossRef]
  32. Chen, G.; Tao, D. An experimental study of stability of oil–water emulsion. Fuel Process. Technol. 2005, 86, 499–508. [Google Scholar] [CrossRef]
  33. Waschatko, G.; Junghans, A.; Vilgis, T.A. Soy milk oleosome behaviour at the air–water interface. Faraday Discuss. 2012, 158, 157–169. [Google Scholar] [CrossRef]
  34. Resende, M.; Linder, C.; Wiesman, Z. Alkyl Tail Segments Mobility as a Marker for Omega-3 PUFA-rich Linseed Oil Oxidative Aging. J. Am. Oil Chem. Soc. 2020, 97, 1283–1297. [Google Scholar] [CrossRef]
  35. Jacobsen, C. Some strategies for the stabilization of long chain n-3 PUFA-enriched foods: A review. Eur. J. Lipid Sci. Technol. 2015, 117, 1853–1866. [Google Scholar] [CrossRef]
  36. Choe, E.; Min, D.B. Chemistry of Deep-Fat Frying Oils. J. Food Sci. 2007, 72, R77–R86. [Google Scholar] [CrossRef] [PubMed]
  37. Barriuso, B.; Astiasarán, I.; Ansorena, D. A review of analytical methods measuring lipid oxidation status in foods: A challenging task. Eur. Food Res. Technol. 2013, 236, 1–15. [Google Scholar] [CrossRef]
  38. Berton-Carabin, C.; Ropers, M.-H.; Genot, C. Lipid Oxidation in Oil-in-Water Emulsions: Involvement of the Interfacial Layer. Compr. Rev. Food Sci. Food Saf. 2014, 13, 945–977. [Google Scholar] [CrossRef]
  39. Merkx, D.W.H.; Hong, G.T.S.; Ermacora, A.; Van Duynhoven, J.P.M. Rapid Quantitative Profiling of Lipid Oxidation Products in a Food Emulsion by 1H NMR. Anal. Chem. 2018, 90, 4863–4870. [Google Scholar] [CrossRef]
  40. Gromadzka, J.; Wardencki, W. Trends in edible vegetable oils analysis. Part A Determination of different components of edible oilS-a Review. Pol. J. Food Nutr. Sci. 2011, 61, 33–43. [Google Scholar] [CrossRef] [Green Version]
  41. Resende, M.T.; Linder, C.; Wiesman, Z. Low-Field Nuclear Magnetic Resonance Time Domain Characterization of Polyunsaturated Fatty Acid—Rich Linseed and Fish Oil Emulsions during Thermal Air Oxidation. J. Am. Oil Chem. Soc. 2021. [Google Scholar] [CrossRef]
  42. Colnago, L.A.; Wiesman, Z.; Pages, G.; Musse, M.; Monaretto, T.; Windt, C.W.; Rondeau-Mouro, C. Low field, time domain NMR in the agriculture and agrifood sectors: An overview of applications in plants, foods and biofuels. J. Magn. Reson. 2021, 323, 106899. [Google Scholar] [CrossRef]
  43. Hills, B.; Benamira, S.; Marigheto, N.; Wright, K. T1-T2 correlation analysis of complex foods. Appl. Magn. Reson. 2004, 26, 543–560. [Google Scholar] [CrossRef]
  44. Corrêa, C.C.; Forato, L.A.; Colnago, L.A. High-throughput non-destructive nuclear magnetic resonance method to measure intramuscular fat content in beef. Anal. Bioanal. Chem. 2008, 393, 1357–1360. [Google Scholar] [CrossRef]
  45. Bertram, H.C.; Dønstrup, S.; Karlsson, A.H.; Andersen, H.J. Continuous distribution analysis of T2 relaxation in meat—an approach in the determination of water-holding capacity. Meat Sci. 2002, 60, 279–285. [Google Scholar] [CrossRef]
  46. Rutledge, D.N. Characterization of water in agro-food products by time domain-NMR. Food Control 2001, 12, 437–445. [Google Scholar] [CrossRef]
  47. Choi, S.-G.; Kerr, W.L. 1H NMR studies of molecular mobility in wheat starch. Food Res. Int. 2003, 36, 341–348. [Google Scholar] [CrossRef]
  48. Goetz, J.; Koehler, P. Study of the thermal denaturation of selected proteins of whey and egg by low resolution NMR. LWT Food Sci. Technol. 2005, 38, 501–512. [Google Scholar] [CrossRef]
  49. Lucas, T.; Le Ray, D.; Barey, P.; Mariette, F. NMR assessment of ice cream: Effect of formulation on liquid and solid fat. Int. Dairy J. 2005, 15, 1225–1233. [Google Scholar] [CrossRef]
  50. Marigheto, N.; Duarte, S.; Hills, B.P. NMR relaxation study of avocado quality. Appl. Magn. Reson. 2005, 29, 687–701. [Google Scholar] [CrossRef]
  51. Hills, B. Applications of Low-Field NMR to Food Science. Annu. Rep. NMR Spectrosc. 2006, 58, 177–230. [Google Scholar] [CrossRef]
  52. Geresh, S.; Arad, M.S. The extracellular polysaccharide of the red microalgae: Chemistry and Rheology. Biores. Technol. 1991, 38, 195–201. [Google Scholar] [CrossRef]
  53. Besghini, D.; Mauri, M.; Simonutti, R. Time Domain NMR in Polymer Science: From the Laboratory to the Industry. Appl. Sci. 2019, 9, 1801. [Google Scholar] [CrossRef] [Green Version]
  54. Bonsegna, S.; Bettini, S.; Pagano, R.; Zacheo, A.; Vergaro, V.; Giovinazzo, G.; Caminati, G.; Leporatti, S.; Valli, L.; Santino, A. Plant Oil Bodies: Novel Carriers to Deliver Lipophilic Molecules. Appl. Biochem. Biotechnol. 2010, 163, 792–802. [Google Scholar] [CrossRef] [Green Version]
  55. Goyal, A.; Sharma, V.; Upadhyay, N.; Singh, A.K.; Arora, S.; Lal, D.; Sabikhi, L. Development of stable flaxseed oil emulsions as a potential delivery system of ω-3 fatty acids. J. Food Sci. Technol. 2014, 52, 4256–4265. [Google Scholar] [CrossRef] [Green Version]
  56. Nikovska, K. Study of olive oil-in-water emulsions with protein emulsifiers. Emir. J. Food Agric. 2012, 24, 17–24. [Google Scholar] [CrossRef] [Green Version]
  57. Fabre, J.-F.; Lacroux, E.; Cerny, M.; Mouloungui, Z. Barriers to the release of flaxseed oil bodies and ways of overcoming them. Oilseeds Fats Crop. Lipids 2015, 22, D607. [Google Scholar] [CrossRef] [Green Version]
Figure 1. Effect of dominating oil’s fatty acids on 1H LF NMR relaxation curve.
Foods 10 01385 g001
Figure 2. Comparison of 1D WinDXP T2 spectra (ad) (RED) vs. PDCO T2 (eh) (GREEN) data processing of rapeseed oil. Reprinted with permission from ref. [21]. Copyright 2013 Wiley.
Foods 10 01385 g002
Figure 3. Concept and main components of 1H LF NMR sensor for food application.
Foods 10 01385 g003
Figure 4. (a) α Linolenic acid dimers aggregate head-to-head to tail-to-tail quasi smectic liquid crystal and (b) microstructural morphology [25,26].
Foods 10 01385 g004
Figure 5. PUFA-rich TAG structure and segmental rigidity mobility [27].
Foods 10 01385 g005
Figure 6. Schematic demonstration of an oleosome vesicle structure [33].
Foods 10 01385 g006
Figure 7. Dimer structure and segmental rigidity-mobility characterization of PUFA. (a) Linoleic acid (18:2) and (b) linolenic acid (18:3). 1H LF NMR TD sensor 2D T1-T2 graphic mapping and peak assignment is presented in the lower Table 1 for each of the two PUFAs. Reprinted with permission from ref. [27]. Copyright 2019 Wiley.
Foods 10 01385 g007
Figure 8. One-dimensional T1 and T2 spectra of linseed oil (LSO) (a) and 2D T1-T2 spectra (b). Image of linseed oil (bottom right). Reprinted with permission from ref. [27]. Copyright 2019 Wiley.
Foods 10 01385 g008
Figure 9. One-dimensional T1 and T2 spectra of sesame seeds (Sesamum indicum) (a) and 2D T1-T2 spectra (b). Image of sesame seeds (bottom right).
Foods 10 01385 g009
Figure 10. One-dimensional T1 and T2 spectra of dry Porphyridium cruentum sp. (red microalgae) (a) and 2D T1-T2 spectra (b). Image of dry red microalgae (bottom right).
Foods 10 01385 g010
Figure 11. 1D T1 and T2 spectra of Cicer arietinum seeds paste (humus) (a) and 2D T1-T2 spectra (b). Image of humus paste (bottom right).
Foods 10 01385 g011
Figure 12. Two-dimensional T1-T2 fingerprint mapping of LSO before (T-0) and after 96 h of heating at 80 °C. Reprinted with permission from ref. [27]. Copyright 2019 Wiley.
Foods 10 01385 g012
Figure 13. (a) Omega-3 linolenic acid-rich LSO decomposition pattern and main released aldehydes as determined by GC–MS analysis, (b) selective exponents of LSO segments with emphasis of segment of tail T2 time domain relaxation determination (c) and graphic presentation of LSO tail T2 changes during heating at 25, 40, 60, 80, 100 and 120 °C together with air pumping for 168 h (25 and 40 °C designated as Group A and 60, 80, 100 and 120 °C designated as Group B). Mean ± SD is presented for each T2 time point. Reprinted with permission from ref. [24]. Copyright 2019 Wiley.
Foods 10 01385 g013
Figure 14. Correlation between LSO self-diffusion (D) and tail T2 at 25, 40, 60, 80, 100 and 120 °C during 168 h. The points of each applied temperature (different color) represent the distribution of D-T2 values in each time tested along the 168 h and the best straight line for each oxidation temperature is drawn. (25 and 40 °C designated as Slow Ox, and 60, 80, 100 and 120 °C designated as Rapid Ox). Reprinted with permission from ref. [34]. Copyright 2019 Wiley.
Foods 10 01385 g014
Figure 15. 1H LF NMR relaxation spectra of LSE fresh produced (T-0 h a,b) and after 96 h of thermal oxidation at 55 °C (T-96 h, c,d). Two-dimensional T1-T2 peaks values and proposed 1H TD assignment are shown in Table 3.
Foods 10 01385 g015aFoods 10 01385 g015bFoods 10 01385 g015c
Figure 16. 1H LF-NMR relaxation spectra of LSFE fresh produced (T-0 h, a,b) and after 96 h of thermal oxidation at 55 °C (T-96 h, c,d).
Foods 10 01385 g016aFoods 10 01385 g016b
Figure 17. Confocal microscopic images of LSFE OB emulsion of non-heated sample (left T-0, X63) and after 96 h of thermal heating (55 °C) (right T-96. X63).
Foods 10 01385 g017
Table 1. 1H LF NMR T1-T2 TD numerical values of linoleic (18:2) and linolenic acids (18:3).
PeakLinoleic AcidLinolenic Acid
T1 (ms)T2 (ms)T1 (ms)T2 (ms)
1320 ± 10292 ± 10309 ± 29302 ± 33
2845 ± 35512 ± 29442 ± 54444 ± 35
31111 ± 59852 ± 341099 ± 207927 ± 103
41267 ± 68950 ± 222288 ± 1921948 ± 113
Table 2. Numerical values of T1-T2 of LSO and peak assignment.
PeakT1 (ms)T2 (ms)Dictionary
19453Glycerol
2191135Double Bonds
3437344Aliphatic Chain
41003766Tail
Table 3. Numerical values of T1-T2 of LSE and proposed 1H TD assignment.
PeakT-0T-961H TD Assignment
T1 (ms)T2 (ms)T1 (ms)T2 (ms)
129411287--Surface (small OB)
2273212061756615Surface (medium OB)
3905577374307FA-Aliphatic chains
492558057FA-D. Bonds
559186425Glycerol
Table 4. Two-dimensional T1-T2 peaks values of LSFE and proposed 1H TD assignment.
PeakT-0 hT-96 h1H TD Assignment
T1 (ms)T2 (ms)T1 (ms)T2 (ms)
164295521Glycerol
2115849257FA D. Bonds
3726282583416FA Aliphatic chains
4394819022538971OB surface
Table 5. Physical–structural properties of non-heated and heated LSFE+SD.
T-0T-96
T1/T22.07 *2.61 *
Self-diffusion (10−9 m*m/s)2.902 ± 0.0202.7338 ± 0.025
DLS (nm)1374 ± 811951 ± 89
Z Potential (mV)−27.3 ± 6.6−25.1 ± 8.3
* SD was not obtained.
Publisher’s Note: MDPI stays neutral with regard to jurisdictional claims in published maps and institutional affiliations.

