
The Implications of COVID-19 on Chinese Consumer Preferences for Lamb Meat

 , ,
, ,  , ,
, ,
Abstract
:
1. Introduction
2. Materials and Methods
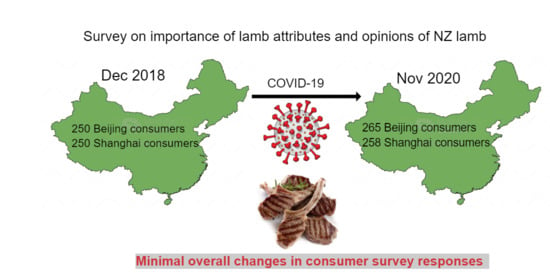
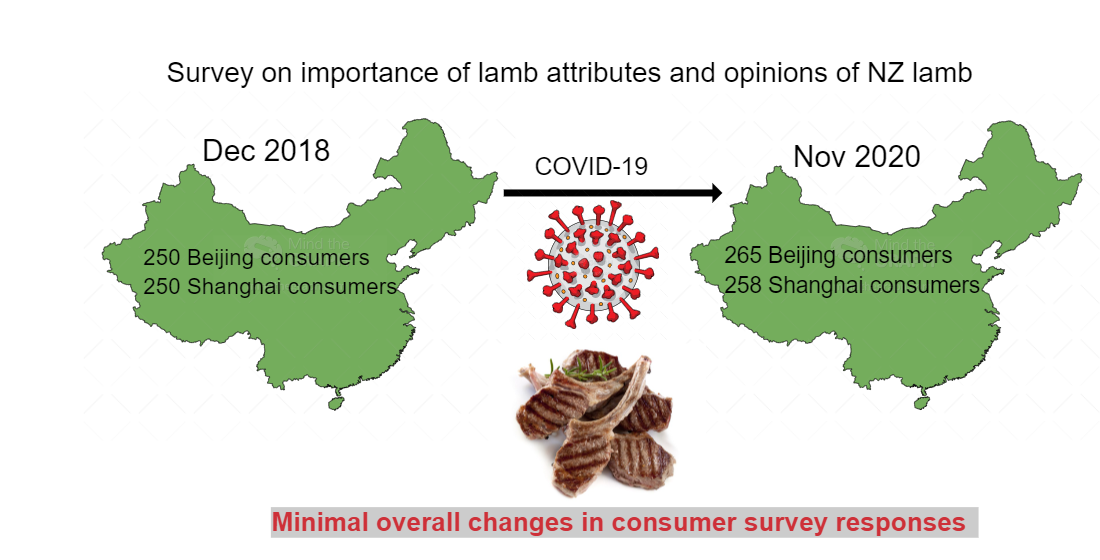
2.1. Data Collection and Sample Characteristics
2.2. Questionnaire
2.3. Data Analysis
3. Results
3.1. Diet and Consumption Patterns of Consumers
3.2. Preferred Level of Cooking, Meat Qualities of Interest, Purchase Location and Types of Lamb Products Typically Purchased
3.3. Importance of Lamb Attributes at the Point of Purchase (e.g., Origin, Food Safety, Appearance, Taste, Price)
3.4. Opinion on New Zealand Lamb
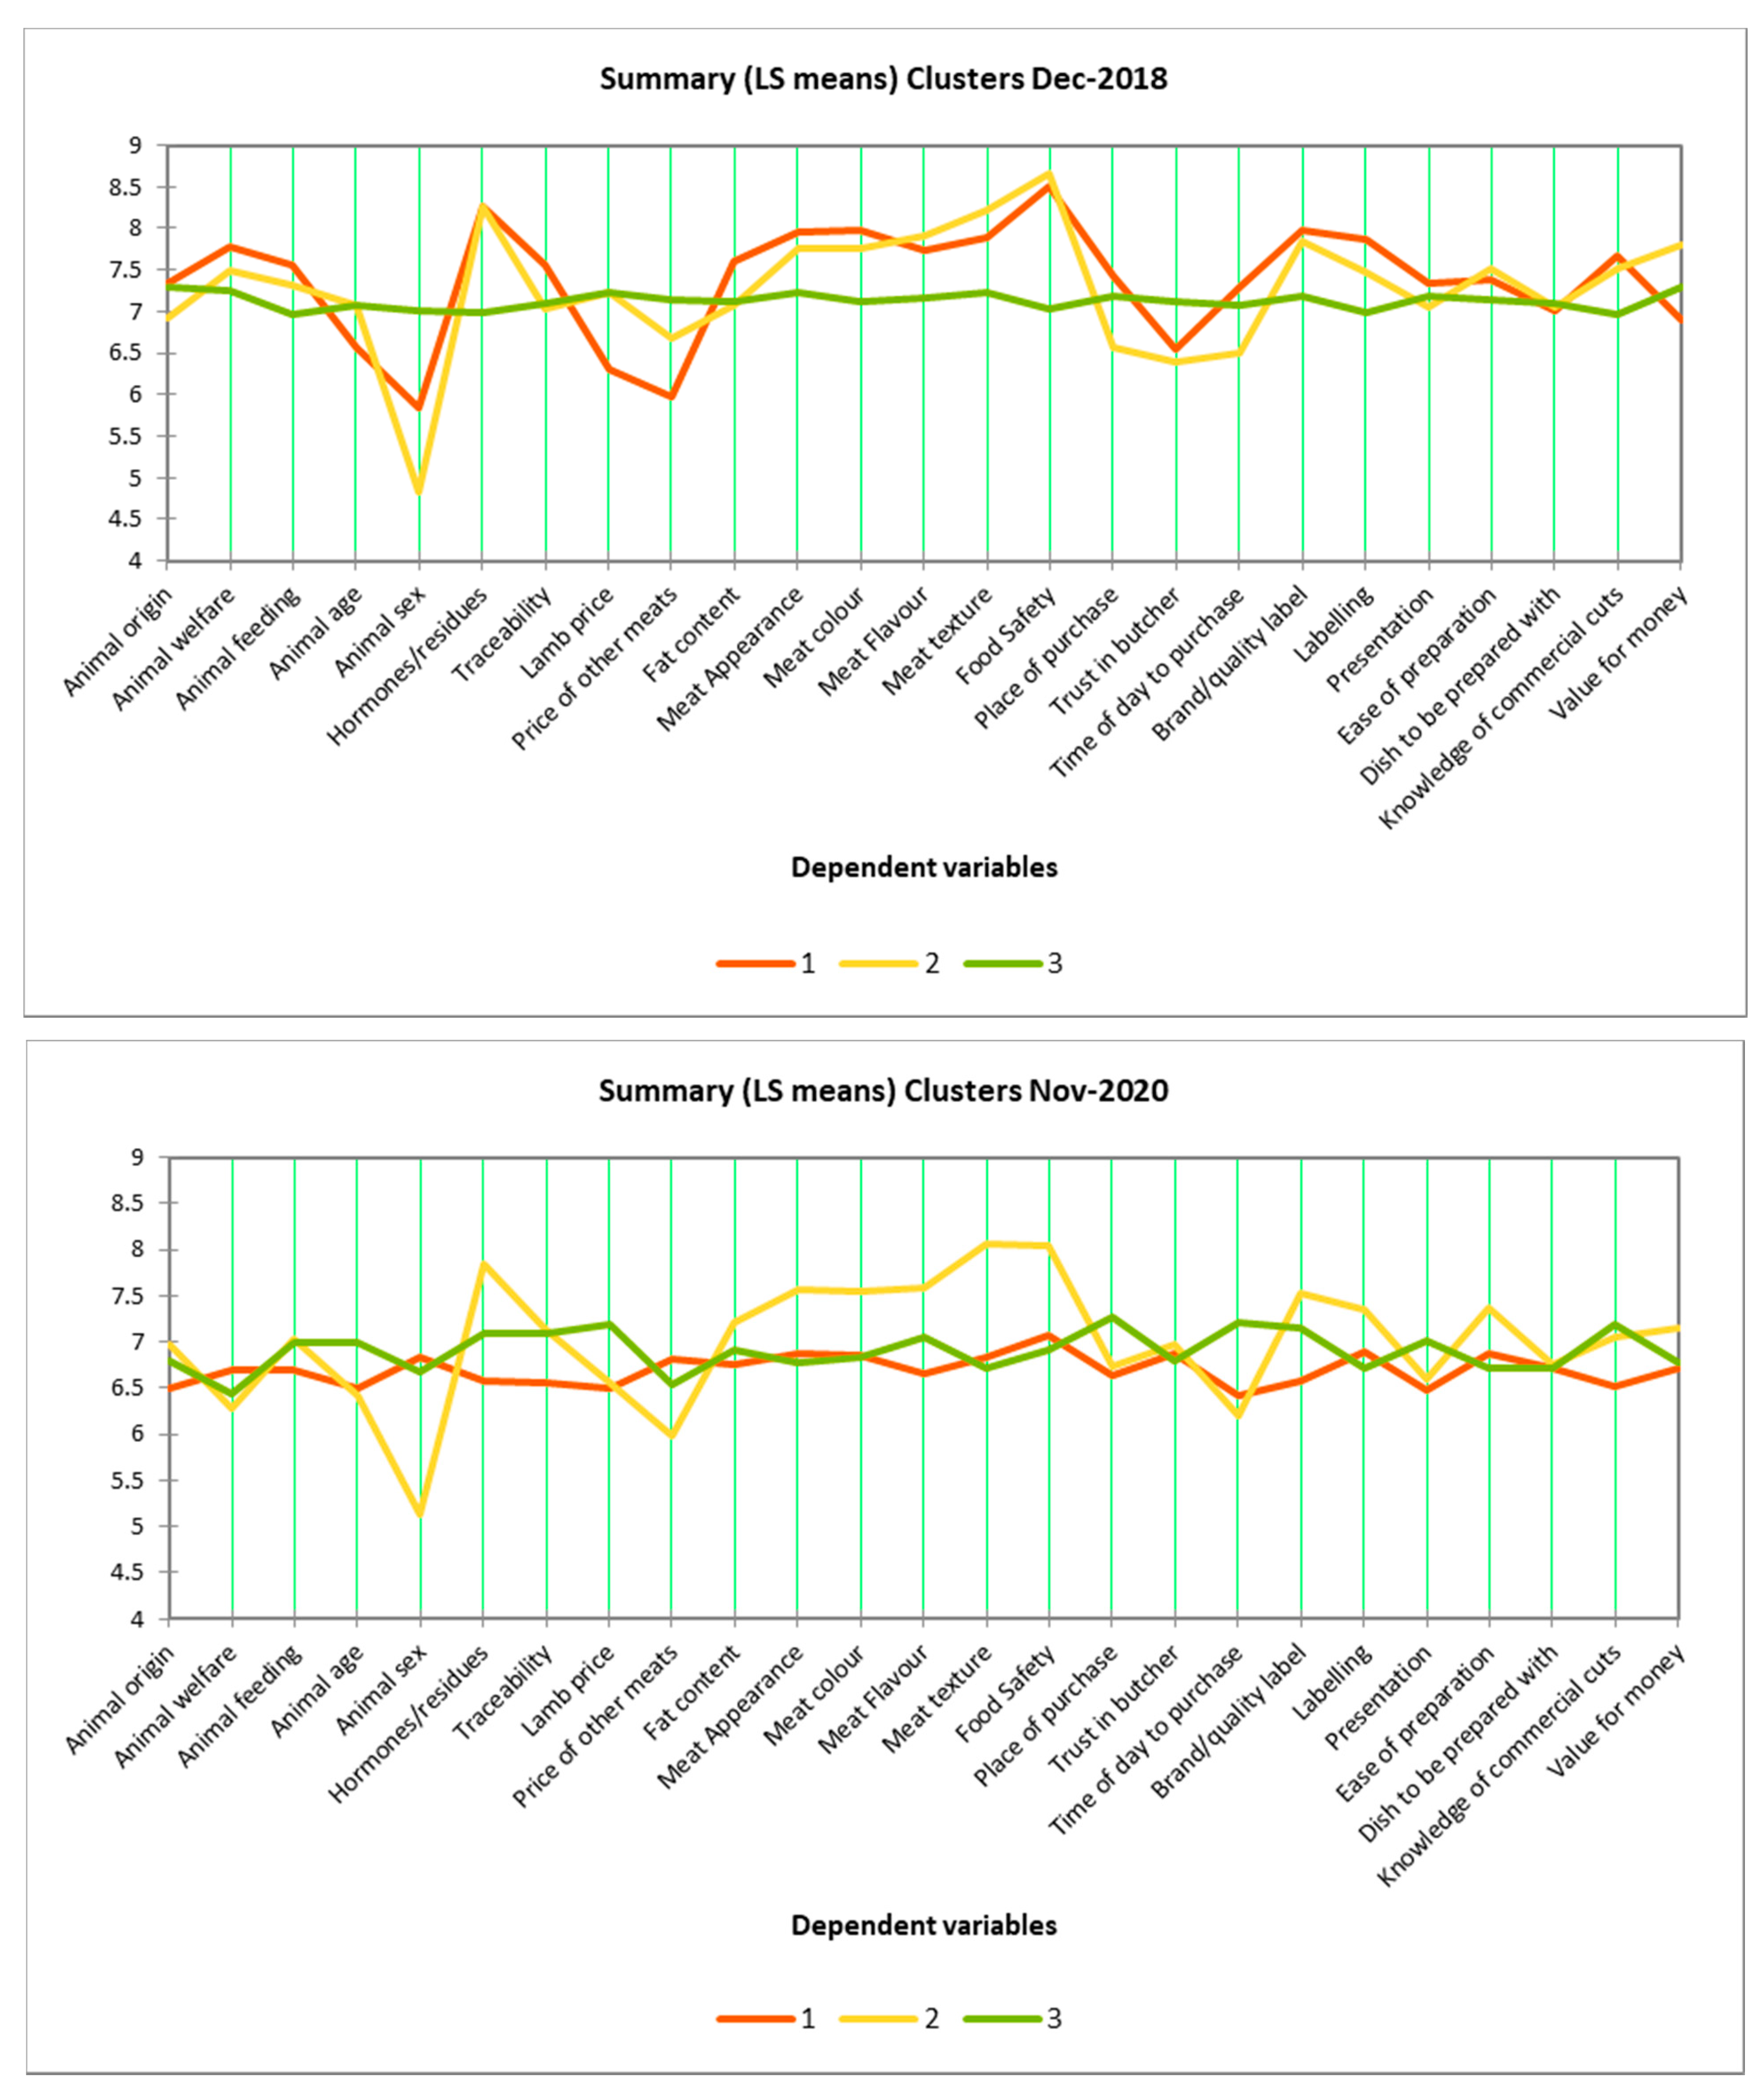
3.5. Cluster Analysis
4. Discussion
4.1. The Effect of COVID-19 on Chinese Consumers’ Purchase Methods and Preferred Level of Cooking
4.2. The Effect of COVID-19 on Chinese Consumer Responses towards the Importance of Lamb Attributes and Their Opinions of New Zealand Lamb
4.3. Consumer Clusters, Limitations of This Study and Practical Implications of This Research
5. Conclusions
Author Contributions
Funding
Institutional Review Board Statement
Informed Consent Statement
Data Availability Statement
Conflicts of Interest
Appendix A
- Gender
| ☐ Male | ☐ Female |
- 2.
- Age
| ☐ 18–25 |
| ☐ 26–35 |
| ☐ 36–45 |
| ☐ 46–60 |
| ☐ 61 and over |
- 3.
- Please provide the postcode for where you currently live:
- 4.
- Please provide the location of where you grew up (e.g. rural location or name of suburb, town or city):
- 5.
- What is your highest level of education?
| ☐ | None |
| ☐ | Primary school |
| ☐ | Middle School |
| ☐ | High School |
| ☐ | Trades certificate or vocational college |
| ☐ | Bachelor’s degree or higher |
- 6.
- What is your occupation?
| ☐ Trades | ☐ Home maker |
| ☐ Professional | ☐ Student |
| ☐ Administration/Office | ☐ Retired |
| ☐ Sales/Services | ☐ Unemployed |
| ☐ Technical | ☐ Other employment |
| ☐ Labourer |
- 7.
- Which of these income levels best represents your combine household income (or personal if single) per annum?
| ☐ Less than 50, 000 CNY |
| ☐ 50, 001 to 100, 000 CNY |
| ☐ 100, 001 to 150, 000 CNY |
| ☐ 150, 001 to 200, 000 CNY |
| ☐ 200, 001 to 300, 000 CNY |
| ☐ 300, 001 to 500, 000 CNY |
| ☐ More than 500, 000 CNY |
- 8.
- How many people live in your household (adults are aged 18 and over).
| 1 | 2 | 3 | 4 | 5 | 6 | 7 | 8 (or more) | |
| Adults | ☐ | ☐ | ☐ | ☐ | ☐ | ☐ | ☐ | ☐ |
| Children | ☐ | ☐ | ☐ | ☐ | ☐ | ☐ | ☐ | ☐ |
- 9.
- Please indicate if you follow any of these diets (you may select more than one option).
| ☐ Low salt |
| ☐ Low sugar |
| ☐ Low calories |
| ☐ Other—please specify______________ |
| ☐ I don’t follow any diets |
- 10.
- How often do you consume the following types of meat?
| Meat Type | Daily | 4–5 times a week | 2–3 times a week | Weekly | Fortnightly | Monthly | Never |
| Lamb | ☐ | ☐ | ☐ | ☐ | ☐ | ☐ | ☐ |
| Beef | ☐ | ☐ | ☐ | ☐ | ☐ | ☐ | ☐ |
| Pork | ☐ | ☐ | ☐ | ☐ | ☐ | ☐ | ☐ |
| Poultry | ☐ | ☐ | ☐ | ☐ | ☐ | ☐ | ☐ |
| Fish | ☐ | ☐ | ☐ | ☐ | ☐ | ☐ | ☐ |
- 11.
- When consuming grilled lamb, what level of cooking do you prefer?
| ☐ Blue ☐ Rare ☐ Medium/Rare |
| ☐ Medium ☐ Medium/Well Done ☐ Well Done |
- 12.
- Where do you usually purchase red meat for your household?
| ☐ Supermarket |
| ☐ Butcher shop ☐ Market |
| ☐ On-line |
| ☐ Other—please specify |
- 13.
- What qualities do you look for when purchasing red meat? (Select all applicable)
| ☐ Marbling |
| ☐ Leanness |
| ☐ Meat colour |
| ☐ Portion size |
| ☐ Price |
| ☐ Other- please specify _______________________ |
- 14.
- What lamb products do you typically purchase? (Select all applicable)
| ☐ Leg roast |
| ☐ Lamb chops |
| ☐ Lamb mince |
| ☐ Lamb rump |
| ☐ Lamb steaks |
| ☐ Lamb rack |
| ☐ Lamb sausages |
| ☐ Lamb shanks |
| ☐ Shoulder roast |
| ☐ Other—please specify _______________________ |
- 15.
- Please circle a number that indicates the level of importance each aspect is to you when purchasing lamb.
- 1.
- Animal origin
| 1 | 2 | 3 | 4 | 5 | 6 | 7 | 8 | 9 |
| Not Important | Very Important |
- 2.
- Animal welfare
| 1 | 2 | 3 | 4 | 5 | 6 | 7 | 8 | 9 |
| Not Important | Very Important |
- 3.
- Animal feeding
| 1 | 2 | 3 | 4 | 5 | 6 | 7 | 8 | 9 |
| Not Important | Very Important |
- 4.
- Animal age
| 1 | 2 | 3 | 4 | 5 | 6 | 7 | 8 | 9 |
| Not Important | Very Important |
- 5.
- Animal sex
| 1 | 2 | 3 | 4 | 5 | 6 | 7 | 8 | 9 |
| Not Important | Very Important |
- 6.
- Presence of hormones and other residues
| 1 | 2 | 3 | 4 | 5 | 6 | 7 | 8 | 9 |
| Not Important | Very Important |
- 7.
- Traceability (to know history of meat you purchase)
| 1 | 2 | 3 | 4 | 5 | 6 | 7 | 8 | 9 |
| Not Important | Very Important |
- 8.
- Lamb price
| 1 | 2 | 3 | 4 | 5 | 6 | 7 | 8 | 9 |
| Not Important | Very Important |
- 9.
- Price of other meats
| 1 | 2 | 3 | 4 | 5 | 6 | 7 | 8 | 9 |
| Not Important | Very Important |
- 10.
- Fat content of meat
| 1 | 2 | 3 | 4 | 5 | 6 | 7 | 8 | 9 |
| Not Important | Very Important |
- 11.
- General meat appearance (shiny, dry...etc.)
| 1 | 2 | 3 | 4 | 5 | 6 | 7 | 8 | 9 |
| Not Important | Very Important |
- 12.
- Meat colour
| 1 | 2 | 3 | 4 | 5 | 6 | 7 | 8 | 9 |
| Not Important | Very Important |
- 13.
- Meat flavour
| 1 | 2 | 3 | 4 | 5 | 6 | 7 | 8 | 9 |
| Not Important | Very Important |
- 14.
- Meat texture (tenderness)
| 1 | 2 | 3 | 4 | 5 | 6 | 7 | 8 | 9 |
| Not Important | Very Important |
- 15.
- Risk of catching a disease consuming lamb (food safety)
| 1 | 2 | 3 | 4 | 5 | 6 | 7 | 8 | 9 |
| Not Important | Very Important |
- 16.
- Place of purchase
| 1 | 2 | 3 | 4 | 5 | 6 | 7 | 8 | 9 |
| Not Important | Very Important |
- 17.
- Trust in butcher
| 1 | 2 | 3 | 4 | 5 | 6 | 7 | 8 | 9 |
| Not Important | Very Important |
- 18.
- Time of the day in which you can purchase lamb
| 1 | 2 | 3 | 4 | 5 | 6 | 7 | 8 | 9 |
| Not Important | Very Important |
- 19.
- Brand or quality label
| 1 | 2 | 3 | 4 | 5 | 6 | 7 | 8 | 9 |
| Not Important | Very Important |
- 20.
- Label information
| 1 | 2 | 3 | 4 | 5 | 6 | 7 | 8 | 9 |
| Not Important | Very Important |
- 21.
- Presentation (pieces, slices, trays...etc)
| 1 | 2 | 3 | 4 | 5 | 6 | 7 | 8 | 9 |
| Not Important | Very Important |
- 22.
- Easy to prepare/cook
| 1 | 2 | 3 | 4 | 5 | 6 | 7 | 8 | 9 |
| Not Important | Very Important |
- 23.
- Dish to be prepared with it
| 1 | 2 | 3 | 4 | 5 | 6 | 7 | 8 | 9 |
| Not Important | Very Important |
- 24.
- My knowledge of different commercial cuts
| 1 | 2 | 3 | 4 | 5 | 6 | 7 | 8 | 9 |
| Not Important | Very Important |
- 25.
- Value for money
| 1 | 2 | 3 | 4 | 5 | 6 | 7 | 8 | 9 |
| Not Important | Very Important |
- 26.
- Others (indicate) __________________________
| 1 | 2 | 3 | 4 | 5 | 6 | 7 | 8 | 9 |
| Not Important | Very Important |
- 16.
- In your opinion New Zealand lamb……
| 1 | 2 | 3 | 4 | 5 | 6 | 7 | |
| Strongly disagree | Neither disagree nor agree | Strongly Agree | |||||
| Is nutritious | ☐ | ☐ | ☐ | ☐ | ☐ | ☐ | ☐ |
| Is healthy | ☐ | ☐ | ☐ | ☐ | ☐ | ☐ | ☐ |
| Is well known | ☐ | ☐ | ☐ | ☐ | ☐ | ☐ | ☐ |
| Is unique | ☐ | ☐ | ☐ | ☐ | ☐ | ☐ | ☐ |
| Is safe | ☐ | ☐ | ☐ | ☐ | ☐ | ☐ | ☐ |
| Is good value for money | ☐ | ☐ | ☐ | ☐ | ☐ | ☐ | ☐ |
| Is boring | ☐ | ☐ | ☐ | ☐ | ☐ | ☐ | ☐ |
| Is a traditional product | ☐ | ☐ | ☐ | ☐ | ☐ | ☐ | ☐ |
| Is natural | ☐ | ☐ | ☐ | ☐ | ☐ | ☐ | ☐ |
| Is hard to digest | ☐ | ☐ | ☐ | ☐ | ☐ | ☐ | ☐ |
| Is produced sustainably | ☐ | ☐ | ☐ | ☐ | ☐ | ☐ | ☐ |
| Is convenient | ☐ | ☐ | ☐ | ☐ | ☐ | ☐ | ☐ |
| Is readily available | ☐ | ☐ | ☐ | ☐ | ☐ | ☐ | ☐ |
| Is high quality | ☐ | ☐ | ☐ | ☐ | ☐ | ☐ | ☐ |
| Contains no additive | ☐ | ☐ | ☐ | ☐ | ☐ | ☐ | ☐ |
| Makes people feel good | ☐ | ☐ | ☐ | ☐ | ☐ | ☐ | ☐ |
| Tastes good | ☐ | ☐ | ☐ | ☐ | ☐ | ☐ | ☐ |
References
- Parma, V.; Ohla, K.; Veldhuizen, M.G.; Niv, M.Y.; Kelly, C.E.; Bakke, A.J.; Cooper, K.W.; Bouysset, C.; Pirastu, N.; Dibattista, M.; et al. More Than Smell—COVID-19 is associated with severe impairment of smell, taste, and chemesthesis. Chem. Senses 2020, 45, 609–622. [Google Scholar] [CrossRef]
- Klein, H.; Asseo, K.; Karni, N.; Benjamini, Y.; Nir-Paz, R.; Muszkat, M.; Israel, S.; Niv, M.Y. Onset, duration, and persistence of taste and smell changes and other COVID-19 symptoms: Longitudinal study in Israeli patients. medRxiv 2020. [Google Scholar] [CrossRef]
- Laguna, L.; Fiszman, S.; Puerta, P.; Chaya, C.; Tárrega, A. The impact of COVID-19 lockdown on food priorities. Results from a preliminary study using social media and an online survey with Spanish consumers. Food Qual. Prefer. 2020, 86, 104028. [Google Scholar] [CrossRef]
- Li, J.; Hallsworth, A.G.; Coca-Stefaniak, J.A. Changing grocery shopping behaviours among chinese consumers at the outset Of The COVID-19 outbreak. Tijdschr. Econ. Soc. Geogr. 2020, 111, 574–583. [Google Scholar] [CrossRef] [PubMed]
- Mehta, S.; Saxena, T.; Purohit, N. The new consumer behaviour paradigm amid COVID-19: Permanent or transient? J. Health Manag. 2020, 22, 291–301. [Google Scholar] [CrossRef]
- Zwanka, R.J.; Buff, C. COVID-19 Generation: A conceptual framework of the consumer behavioral shifts to be caused by the COVID-19 Pandemic. J. Int. Consum. Mark. 2021, 33, 58–67. [Google Scholar] [CrossRef]
- Ben Hassen, T.; El Bilali, H.; Allahyari, M.S. Impact of COVID-19 on food behavior and consumption in Qatar. Sustainability 2020, 12, 6973. [Google Scholar] [CrossRef]
- Gao, X.; Shi, X.; Guo, H.; Liu, Y. To buy or not buy food online: The impact of the COVID-19 epidemic on the adoption of e-commerce in China. PLoS ONE 2020, 15, e0237900. [Google Scholar] [CrossRef] [PubMed]
- Chang, H.-H.; Meyerhoefer, C.D. COVID-19 and the demand for online food shopping services: Empirical evidence from Taiwan. Am. J. Agric. Econ. 2021, 103, 448–465. [Google Scholar] [CrossRef]
- Snuggs, S.; McGregor, S. Food & meal decision making in lockdown: How and who has Covid-19 affected? Food Qual. Prefer. 2021, 89, 104145. [Google Scholar] [CrossRef]
- Bernués, A.; Olaizola, A.; Corcoran, K. Extrinsic attributes of red meat as indicators of quality in Europe: An application for market segmentation. Food Qual. Prefer. 2003, 14, 265–276. [Google Scholar] [CrossRef]
- Attwood, S.; Hajat, C. How will the COVID-19 pandemic shape the future of meat consumption? Public Health Nutr. 2020, 23, 3116–3120. [Google Scholar] [CrossRef]
- Clemens, R.L.; Babcock, B.A. Country of origin as a brand: The case of New Zealand lamb. MATRIC Brief. Pap. 2004, 5, 1–25. [Google Scholar]
- Sofos, J. Microbial growth and its control in meat, poultry and fish. In Quality Attributes and Their Measurement in Meat, Poultry and Fish Products; Springer: Berlin/Heidelberg, Germany, 1994; pp. 359–403. [Google Scholar]
- Beef and Lamb New Zealand. Available online: https://beeflambnz.com/sites/default/files/New%20Season%20Outlook%Nov-202019-20%20-%20Report.pdf (accessed on 20 April 2021).
- Meat and Livestock Australia. Available online: https://www.mla.com.au/prices-markets/market-news/Nov-2020/new-zealands-red-meat-industry-remains-robust-despite-challenges/# (accessed on 20 April 2021).
- Food and Agriculture Organization of the United Nations. Countries by Commodity. Available online: http://www.fao.org/faostat/en/#rankings/countries_by_commodity_imports (accessed on 20 April 2021).
- Aschemann-Witzel, J.; Peschel, A.O. How circular will you eat? The sustainability challenge in food and consumer reaction to either waste-to-value or yet underused novel ingredients in food. Food Qual. Prefer. 2019, 77, 15–20. [Google Scholar] [CrossRef]
- Tan, H.S.G.; Verbaan, Y.T.; Stieger, M. How will better products improve the sensory-liking and willingness to buy insect-based foods? Food Res. Int. 2017, 92, 95–105. [Google Scholar] [CrossRef] [PubMed]
- Zhou, G.; Zhang, W.; Xu, X. China’s meat industry revolution: Challenges and opportunities for the future. Meat Sci. 2012, 92, 188–196. [Google Scholar] [CrossRef] [PubMed]
- Meixner, O.; Katt, F. Assessing the impact of COVID-19 on consumer food safety perceptions—A choice-based willingness to pay study. Sustainability 2020, 12, 7270. [Google Scholar] [CrossRef]
- Xie, X.; Huang, L.; Li, J.; Zhu, H. Generational differences in perceptions of food health/risk and attitudes toward organic food and game meat: The case of the COVID-19 crisis in China. Int. J. Environ. Res. Public Health 2020, 17, 3148. [Google Scholar] [CrossRef] [PubMed]
- Kim, H.-J.; Lee, M.-J.; Lee, S.-K.; Kim, D.-Y.; Seo, S.-J.; Kang, H.-E.; Nam, H.-M. African swine fever virus in pork brought into South Korea by travelers from China, August 2018. Emerg. Infect. Dis. 2019, 25, 1231. [Google Scholar] [CrossRef] [PubMed]
- Gale, F.; Hu, D.; Marti, D. China’s Volatile Pork Industry; United States Department of Agriculture: Washington, DC, USA, 2012. [Google Scholar]
- Qin, A. Coronavirus Fears in China Find a New Target: Salmon. Available online: https://www.nytimes.com/Nov-2020/06/18/world/asia/coronavirus-china-salmon.html (accessed on 30 April 2021).
- National Bureau of Statistics of China. Preliminary Accounting Results of GDP for the Fourth Quarter and the Whole Year of 2020. Available online: http://www.stats.gov.cn/english/PressRelease/202101/t20210120_1812680.html (accessed on 20 April 2021).
- Sheth, J. Impact of Covid-19 on consume behavior: Will the old habits return or die? J. Bus. Res. 2020, 117, 280–283. [Google Scholar] [CrossRef]
- Yeh, L.L.; Kim, K.O.; Chompreeda, P.; Rimkeeree, H.; Yau, N.J.N.; Lundahl, D.S. Comparison in Use of the 9-Point Hedonic Scale between Americans, Chinese, Koreans, and Thai. Food Qual. Prefer. 1998, 9, 413–419. [Google Scholar] [CrossRef]
- Johnson, T.P.; Shavitt, S.; Holbrook, A.L. Survey response styles across cultures. In Cross-Cultural Research Methods in Psychology; Cambridge University Press: New York, NY, USA, 2011; pp. 130–175. [Google Scholar]
- Ares, G.; Giménez, A.; Vidal, L.; Zhou, Y.; Krystallis, A.; Tsalis, G.; Symoneaux, R.; Cunha, L.M.; de Moura, A.P.; Claret, A.; et al. Do we all perceive food-related wellbeing in the same way? Results from an exploratory cross-cultural study. Food Qual. Prefer. 2016, 52, 62–73. [Google Scholar] [CrossRef]
- Sternquist, B.; Byun, S.-E.; Jin, B. The dimensionality of price perceptions: A cross-cultural comparison of Asian consumers. Int. Rev. Retail. Distrib. Consum. Res. 2004, 14, 83–100. [Google Scholar] [CrossRef]
- Liu, A.; Niyongira, R. Chinese consumers food purchasing behaviors and awareness of food safety. Food Control 2017, 79, 185–191. [Google Scholar] [CrossRef]

| Beijing December 2018 | Shanghai December 2018 | Beijing November 2020 | Shanghai November 2020 | ||
|---|---|---|---|---|---|
| Gender | Male | 50.0 | 50.0 | 51.7 | 50.4 |
| Female | 50.0 | 50.0 | 48.3 | 49.6 | |
| Age | 18–25 | 13.2 | 12.8 | 12.8 | 12.8 |
| 26–35 | 23.2 | 18.8 | 21.9 | 20.9 | |
| 36–45 | 13.6 | 18.4 | 15.5 | 16.3 | |
| 46–60 | 47.6 | 47.2 | 46.8 | 46.9 | |
| 61+ | 2.4 | 2.8 | 3.0 | 3.1 | |
| Education | none | 0 | 0 | 0 | 0.4 |
| China elementary school | 0 | 0 | 0 | 0.0 | |
| Chinese junior high graduate | 0.8 | 0.0 | 2.3 | 3.1 | |
| Chinese high school | 2.8 | 5.2 | 13.6 | 12.0 | |
| Trades certificate | 38.8 | 34.4 | 25.3 | 20.5 | |
| Tertiary qualification | 57.6 | 60.4 | 58.9 | 64.0 | |
| Labourer | 1.2 | 1.2 | 0.4 | 0.4 | |
| Income | Less than 50,000 CNY | 1.2 | 1.6 | 0.4 | 0.8 |
| 50,001 to 100,000 CNY | 5.2 | 3.6 | 2.3 | 0.8 | |
| 100,001 to 150,000 CNY | 17.2 | 13.2 | 10.6 | 7.0 | |
| 150,001 to 200,000 CNY | 23.2 | 22.4 | 32.5 | 27.1 | |
| 200,001 to 300,000 CNY | 32.0 | 39.2 | 24.2 | 33.7 | |
| 300,001 to 500,000 CNY | 14.8 | 15.2 | 20.0 | 22.5 | |
| More than 500,000 CNY | 6.4 | 4.8 | 10.2 | 8.1 |
| Beijing December 2018 | Shanghai December 2018 | Beijing November 2020 | Shanghai November 2020 | p(Chi2) (Year) | p(Chi2) (City) | ||
|---|---|---|---|---|---|---|---|
| Dietary restrictions | Low salt | 72.8 | 73.6 | 63.8 | 60.9 | <0.001 | 0.725 |
| Low sugar | 71.2 | 72.8 | 65.7 | 59.3 | 0.001 | 0.413 | |
| Low calories | 63.2 | 61.2 | 52.8 | 40.7 | <0.001 | 0.023 | |
| Do not follow a diet | 10.8 | 7.6 | 30.2 | 31.0 | <0.001 | 0.571 | |
| Lamb | Daily | 5.2 | 2.4 | 2.6 | 4.3 | <0.001 | 0.110 |
| 4–5 times a week | 13.2 | 8.8 | 24.2 | 20.5 | |||
| 2–3 times a week | 25.2 | 23.2 | 23.4 | 17.8 | |||
| Weekly | 35.6 | 40.4 | 32.1 | 37.6 | |||
| Fortnightly | 20.8 | 25.2 | 17.7 | 19.8 | |||
| Beef | Daily | 3.2 | 2.0 | 10.6 | 4.7 | <0.001 | <0.001 |
| 4–5 times a week | 12.4 | 8.8 | 15.1 | 12.4 | |||
| 2–3 times a week | 35.2 | 42.8 | 34.3 | 32.2 | |||
| Weekly | 32.4 | 38.0 | 24.9 | 29.8 | |||
| Fortnightly or less | 16.8 | 8.4 | 15.1 | 21.0 | |||
| Pork | Daily | 14.8 | 12.4 | 11.7 | 11.2 | <0.001 | 0.579 |
| 4–5 times a week | 26.0 | 26.4 | 25.3 | 19.0 | |||
| 2–3 times a week | 39.6 | 40.0 | 31.3 | 34.1 | |||
| Weekly | 15.2 | 11.6 | 24.2 | 29.8 | |||
| Fortnightly or less | 4.4 | 9.6 | 7.6 | 5.8 | |||
| Poultry | Daily | 8.0 | 4.4 | 6.0 | 2.7 | <0.001 | 0.145 |
| 4–5 times a week | 13.2 | 12.0 | 14.7 | 11.6 | |||
| 2–3 times a week | 37.2 | 40.8 | 39.2 | 35.7 | |||
| Weekly | 32.4 | 30.4 | 29.1 | 41.1 | |||
| Fortnightly or less | 9.2 | 12.4 | 10.9 | 8.9 | |||
| Fish | Daily | 6.4 | 9.6 | 4.2 | 3.1 | <0.001 | 0.774 |
| 4–5 times a week | 17.2 | 22.4 | 24.9 | 19.8 | |||
| 2–3 times a week | 38.0 | 40.4 | 33.6 | 27.9 | |||
| Weekly | 32.4 | 18.0 | 27.9 | 38.0 | |||
| Fortnightly or less | 6.0 | 9.6 | 9.5 | 11.3 |
| Beijing December 2018 | Shanghai December 2018 | Beijing November 2020 | Shanghai November 2020 | p(Chi2) (Year) | p(Chi2) (City) | ||
|---|---|---|---|---|---|---|---|
| Preferred level of cooking with lamb | Rare | 2.0 | 0.8 | 0.8 | 2.4 | <0.001 | 0.133 |
| Medium/Rare | 6.0 | 7.6 | 3.8 | 2.7 | |||
| Medium | 8.0 | 12.4 | 7.2 | 3.9 | |||
| Medium/Well Done | 53.2 | 58.8 | 35.1 | 39.1 | |||
| Well Done | 30.8 | 20.4 | 53.2 | 51.9 | |||
| Where do you purchase red meat? | Supermarket | 92.4 | 91.6 | 84.5 | 90.7 | 0.023 | 0.150 |
| Butcher shop | 66.4 | 66.8 | 80.0 | 75.6 | <0.001 | 0.485 | |
| Market | 32.0 | 33.6 | 39.2 | 33.3 | 0.238 | 0.470 | |
| On-line | 8.0 | 12.4 | 26.4 | 31.8 | <0.001 | 0.060 | |
| What qualities do you look for when purchasing red meat? | Marbling | 52.4 | 50.4 | 52.5 | 55.0 | 0.491 | 0.950 |
| Leanness | 87.6 | 85.2 | 85.7 | 86.0 | 0.857 | 0.718 | |
| Meat colour | 84.4 | 78.4 | 76.6 | 85.3 | 0.447 | 0.540 | |
| Portion size | 42.0 | 43.2 | 37.0 | 38.4 | 0.111 | 0.702 | |
| Price | 52.0 | 58.0 | 24.9 | 26.0 | <0.001 | 0.539 | |
| What lamb products do you typically purchase? | Leg roast | 68.4 | 64.0 | 56.6 | 60.5 | 0.012 | 0.967 |
| Lamb chops | 56.8 | 59.2 | 40.8 | 46.9 | <0.001 | 0.169 | |
| Lamb mince | 20.4 | 15.6 | 28.7 | 24.4 | <0.001 | 0.085 | |
| Lamb rump | 32.0 | 29.6 | 38.5 | 41.1 | 0.003 | 0.975 | |
| Lamb steaks | 61.6 | 56.8 | 56.2 | 70.2 | 0.223 | 0.124 | |
| Lamb rack | 27.6 | 20.0 | 49.1 | 47.3 | <0.001 | 0.119 | |
| Lamb sausages | 17.2 | 18.8 | 25.3 | 17.4 | 0.182 | 0.209 | |
| Lamb shanks | 51.2 | 57.6 | 44.2 | 45.3 | 0.002 | 0.235 | |
| Shoulder roast | 22.0 | 20.0 | 16.2 | 20.9 | 0.346 | 0.583 |
| Beijing December 2018 | Shanghai December 2018 | Beijing November 2020 | Shanghai November 2020 | p (ANOVA) (Year) | p (ANOVA)(City) | p(ANOVA) (City × Year) | |
|---|---|---|---|---|---|---|---|
| Animal origin | 7.12 ± 1.70 | 7.22 ± 1.47 | 6.80 ± 1.66 | 6.62 ± 1.64 | <0.001 | 0.694 | 0.168 |
| Animal welfare | 7.52 ± 1.58 | 7.56 ± 1.35 | 6.44 ± 1.80 | 6.56 ± 1.69 | <0.001 | 0.439 | 0.705 |
| Animal feeding | 7.23 ± 1.63 | 7.39 ± 1.49 | 6.88 ± 1.52 | 6.87 ± 1.48 | <0.001 | 0.414 | 0.394 |
| Animal age | 6.84 ± 1.85 | 6.94 ± 1.62 | 6.75 ± 1.65 | 6.48 ± 1.64 | 0.010 | 0.465 | 0.080 |
| Animal sex | 5.70 ± 2.28 | 5.84 ± 2.21 | 6.34 ± 1.96 | 6.29 ± 1.78 | <0.001 | 0.736 | 0.474 |
| Presence of hormones and other residues | 7.89 ± 1.47 | 7.98 ± 1.29 | 7.08 ± 1.71 | 7.09 ± 1.55 | <0.001 | 0.635 | 0.652 |
| Traceability (to know history of meat you purchase) | 7.16 ± 1.74 | 7.33 ± 1.54 | 6.99 ± 1.63 | 6.76 ± 1.67 | <0.001 | 0.782 | 0.052 |
| Lamb price | 6.85 ± 1.72 | 6.93 ± 1.70 | 6.73 ± 1.67 | 6.70 ± 1.59 | 0.094 | 0.813 | 0.597 |
| Price of other meats | 6.59 ± 1.83 | 6.48 ± 1.91 | 6.56 ± 1.77 | 6.44 ± 1.70 | 0.737 | 0.319 | 0.969 |
| Fat content of meat | 7.22 ± 1.52 | 7.35 ± 1.45 | 7.02 ± 1.48 | 6.83 ± 1.62 | <0.001 | 0.747 | 0.095 |
| General meat appearance (shiny, dry...etc.) | 7.65 ± 1.36 | 7.75 ± 1.32 | 6.99 ± 1.57 | 7.09 ± 1.58 | <0.001 | 0.274 | 0.998 |
| Meat colour | 7.60 ± 1.55 | 7.72 ± 1.29 | 7.06 ± 1.54 | 7.02 ± 1.63 | <0.001 | 0.646 | 0.417 |
| Meat flavour | 7.57 ± 1.45 | 7.72 ± 1.21 | 7.06 ± 1.47 | 7.00 ± 1.53 | <0.001 | 0.591 | 0.241 |
| Meat texture (tenderness) | 7.78 ± 1.47 | 7.91 ± 1.15 | 7.19 ± 1.53 | 7.09 ± 1.62 | <0.001 | 0.875 | 0.197 |
| Risk of catching a disease consuming lamb (food safety) | 8.19 ± 1.37 | 8.17 ± 1.28 | 7.28 ± 1.53 | 7.31 ± 1.49 | <0.001 | 0.952 | 0.776 |
| Place of purchase | 7.07 ± 1.56 | 7.01 ± 1.74 | 6.85 ± 1.63 | 6.86 ± 1.49 | 0.063 | 0.809 | 0.752 |
| Trust in butcher | 6.61 ± 1.69 | 6.66 ± 1.79 | 6.86 ± 1.62 | 6.90 ± 1.65 | 0.022 | 0.668 | 0.950 |
| Time of the day in which you can purchase lamb | 6.86 ± 1.94 | 7.03 ± 1.82 | 6.59 ± 1.71 | 6.58 ± 1.70 | 0.001 | 0.485 | 0.445 |
| Brand or quality label | 7.72 ± 1.37 | 7.72 ± 1.43 | 6.94 ± 1.65 | 7.08 ± 1.50 | <0.001 | 0.474 | 0.423 |
| Label information | 7.42 ± 1.44 | 7.56 ± 1.47 | 6.96 ± 1.62 | 6.98 ± 1.53 | <0.001 | 0.392 | 0.482 |
| Presentation (pieces, slices, trays, etc.) | 7.13 ± 1.58 | 7.25 ± 1.43 | 6.67 ± 1.70 | 6.67 ± 1.56 | <0.001 | 0.533 | 0.551 |
| Easy to prepare/cook | 7.34 ± 1.43 | 7.39 ± 1.33 | 6.97 ± 1.60 | 6.97 ± 1.47 | <0.001 | 0.814 | 0.806 |
| Dish to be prepared with it | 6.98 ± 1.72 | 7.10 ± 1.51 | 6.75 ± 1.56 | 6.71 ± 1.56 | 0.002 | 0.722 | 0.394 |
| My knowledge of different commercial cuts | 7.47 ± 1.46 | 7.40 ± 1.52 | 6.88 ± 1.55 | 6.84 ± 1.41 | <0.001 | 0.581 | 0.823 |
| Value for money | 7.28 ± 1.57 | 7.40 ± 1.55 | 6.99 ± 1.61 | 6.72 ± 1.65 | <0.001 | 0.448 | 0.050 |
| Beijing December 2018 | Shanghai December 2018 | Beijing November 2020 | Shanghai November 2020 | p (ANOVA) (Year) | p (ANOVA)(City) | p(ANOVA) (City × Year) | |
|---|---|---|---|---|---|---|---|
| Is nutritious | 6.01 ± 0.99 | 6.13 ± 0.96 | 5.54 ± 1.03 | 5.58 ± 1.03 | <0.001 | 0.208 | 0.474 |
| Is healthy | 5.92 ± 1.09 | 6.12 ± 0.95 | 5.68 ± 1.05 | 5.59 ± 1.00 | <0.001 | 0.391 | 0.024 |
| Is well known | 5.52 ± 1.34 | 5.72 ± 1.25 | 5.59 ± 1.01 | 5.48 ± 1.07 | 0.214 | 0.549 | 0.034 |
| Is unique | 5.20 ± 1.40 | 5.43 ± 1.30 | 5.32 ± 1.22 | 5.38 ± 1.06 | 0.643 | 0.066 | 0.303 |
| Is safe | 5.89 ± 1.10 | 6.03 ± 0.99 | 5.57 ± 1.04 | 5.55 ± 1.06 | <0.001 | 0.313 | 0.235 |
| Is good value for money | 5.59 ± 1.24 | 5.78 ± 1.02 | 5.51 ± 1.13 | 5.51 ± 1.06 | 0.015 | 0.182 | 0.175 |
| Is boring | 2.95 ± 1.83 | 3.11 ± 1.91 | 3.80 ± 1.95 | 3.59 ± 2.07 | <0.001 | 0.834 | 0.136 |
| Is a traditional product | 5.22 ± 1.25 | 5.38 ± 1.18 | 5.18 ± 1.32 | 5.08 ± 1.36 | 0.036 | 0.707 | 0.105 |
| Is natural | 5.72 ± 1.23 | 5.98 ± 1.08 | 5.58 ± 1.00 | 5.60 ± 1.04 | <0.001 | 0.047 | 0.070 |
| Is hard to digest | 3.40 ± 1.81 | 3.43 ± 1.94 | 4.25 ± 1.93 | 3.88 ± 1.99 | <0.001 | 0.156 | 0.092 |
| Is produced sustainably | 5.66 ± 1.11 | 5.76 ± 1.12 | 5.48 ± 1.04 | 5.56 ± 1.04 | 0.005 | 0.184 | 0.830 |
| Is convenient | 5.33 ± 1.22 | 5.54 ± 1.15 | 5.49 ± 1.06 | 5.40 ± 1.08 | 0.857 | 0.408 | 0.034 |
| Is readily available | 5.08 ± 1.31 | 5.25 ± 1.14 | 5.36 ± 1.07 | 5.37 ± 1.20 | 0.007 | 0.210 | 0.285 |
| Is high quality | 6.02 ± 1.01 | 6.07 ± 1.01 | 5.65 ± 1.09 | 5.59 ± 1.05 | <0.001 | 0.952 | 0.391 |
| Contains no additives | 5.58 ± 1.16 | 5.82 ± 1.06 | 5.53 ± 1.07 | 5.56 ± 0.99 | 0.022 | 0.044 | 0.131 |
| Makes people feel good | 5.92 ± 1.17 | 6.00 ± 0.96 | 5.53 ± 1.05 | 5.47 ± 1.11 | <0.001 | 0.854 | 0.288 |
| Tastes good | 6.01 ± 0.93 | 6.05 ± 1.17 | 5.57 ± 1.07 | 5.67 ± 1.01 | <0.001 | 0.269 | 0.664 |
Publisher’s Note: MDPI stays neutral with regard to jurisdictional claims in published maps and institutional affiliations. |
© 2021 by the authors. Licensee MDPI, Basel, Switzerland. This article is an open access article distributed under the terms and conditions of the Creative Commons Attribution (CC BY) license (https://creativecommons.org/licenses/by/4.0/).
Share and Cite
Hutchings, S.C.; Guerrero, L.; Mirosa, M.; Bremer, P.; Mather, D.; Pavan, E.; Hicks, T.M.; Day, L.; Realini, C.E. The Implications of COVID-19 on Chinese Consumer Preferences for Lamb Meat. Foods 2021, 10, 1324. https://doi.org/10.3390/foods10061324
Hutchings SC, Guerrero L, Mirosa M, Bremer P, Mather D, Pavan E, Hicks TM, Day L, Realini CE. The Implications of COVID-19 on Chinese Consumer Preferences for Lamb Meat. Foods. 2021; 10(6):1324. https://doi.org/10.3390/foods10061324
Chicago/Turabian StyleHutchings, Scott C., Luis Guerrero, Miranda Mirosa, Phil Bremer, Damien Mather, Enrique Pavan, Talia M. Hicks, Li Day, and Carolina E. Realini. 2021. "The Implications of COVID-19 on Chinese Consumer Preferences for Lamb Meat" Foods 10, no. 6: 1324. https://doi.org/10.3390/foods10061324
APA StyleHutchings, S. C., Guerrero, L., Mirosa, M., Bremer, P., Mather, D., Pavan, E., Hicks, T. M., Day, L., & Realini, C. E. (2021). The Implications of COVID-19 on Chinese Consumer Preferences for Lamb Meat. Foods, 10(6), 1324. https://doi.org/10.3390/foods10061324