
Heavy-Metal Contents and the Impact of Roasting on Polyphenols, Caffeine, and Acrylamide in Specialty Coffee Beans


 ,
, 
 and
and
Abstract

1. Introduction
2. Materials and Methods
2.1. Coffee Samples
2.2. Roasting
2.3. Analysis of PPH
2.4. Ultra-High-Resolution Mass Spectrometry (UHRMS)
2.5. Analysis of CAF
2.6. Analysis of AA
2.7. Analysis of Heavy Metals
2.8. Statistical Analysis
3. Results
3.1. Bioactive Compounds of the Coffee Beans
3.2. Effect of Coffee Type and Roasting on CGA Content
3.3. Effects of Coffee Type and Roasting on the Contents of Total PPH, CAF, and AA
3.4. Heavy Metal Contents in the Green Coffee Beans
4. Discussion
5. Conclusions
Author Contributions
Funding
Data Availability Statement
Acknowledgments
Conflicts of Interest
References
- Dziki, D.; Gawlik-Dziki, U.; Pecio, Ł.; Rózyło, R.; Swieca, M.; Krzykowski, A.; Rudy, S. Ground green coffee beans as a functional food supplement—preliminary study. LWT Food Sci. Technol. 2015, 63, 691–699. [Google Scholar] [CrossRef]
- Jeszka-Skowron, M.; Sentkowska, A.; Pyrzyńska, K.; De Peña, M.P. Chlorogenic acids, caffeine content and antioxidant properties of green coffee extracts: Influence of green coffee bean preparation. Eur. Food Res. Technol. 2016, 242, 1403–1409. [Google Scholar] [CrossRef]
- Tajik, N.; Tajik, M.; Mack, I.; Enck, P. The potential effects of chlorogenic acid, the main phenolic components in coffee, on health: A comprehensive review of the literature. Eur. J. Nutr. 2017, 56, 2215–2244. [Google Scholar] [CrossRef] [PubMed]
- Poltronieri, P.; Rossi, F. Challenges in specialty coffee processing and quality assurance. Challenges 2016, 7, 19. [Google Scholar] [CrossRef]
- Bolka, M.; Emire, S. Effects of coffee roasting technologies on cup quality and bioactive compounds of specialty coffee beans. Food Sci. Nutr. 2020, 8, 6120–6130. [Google Scholar] [CrossRef]
- Soares, C.M.D.; Alves, R.C.; Oliveira, M.B.P.P. Chapter 24—Factors affecting acrylamide levels in coffee beverages. In Coffee in Health and Disease Prevention; Preedy, V.R., Ed.; Academic Press: Waltham, MA, USA, 2015; pp. 217–224. [Google Scholar] [CrossRef]
- Rannou, C.; Laroque, D.; Renault, E.; Prost, C.; Sérot, T. Mitigation strategies of acrylamide, furans, heterocyclic amines and browning during the Maillard reaction in foods. Food Res. Int. 2016, 90, 154–176. [Google Scholar] [CrossRef]
- Cagliero, C.; Ho, T.D.; Zhang, C.; Bicchi, C.; Anderson, J.L. Determination of acrylamide in brewed coffee and coffee powder using polymeric ionic liquid-based sorbent coatings in solid-phase microextraction coupled to gas chromatography-mass spectrometry. J. Chromatogr. A. 2016, 1449, 2–7. [Google Scholar] [CrossRef]
- Alves, R.C.; Soares, C.; Casal, S.; Fernandes, J.O.; Oliveira, M.B.P.P. Acrylamide in espresso coffee: Influence of species, roast degree and brew length. Food Chem. 2010, 119, 929–934. [Google Scholar] [CrossRef]
- Bertuzzi, T.; Martinelli, E.; Mulazzi, A.; Rastelli, S. Acrylamide determination during an industrial roasting process of coffee and the influence of asparagine and low molecular weight sugars. Food Chem. 2020, 303, 125372. [Google Scholar] [CrossRef]
- De Mejia, E.G.; Ramirez-Mares, M.V. Impact of caffeine and coffee on our health. Trends Endocrinol. Metab. 2014, 25, 489–492. [Google Scholar] [CrossRef]
- Król, K.; Gantner, M.; Tatarak, A.; Hallmann, E. The content of polyphenols in coffee beans as roasting, origin and storage effect. Eur. Food Res. Technol. 2020, 246, 33–39. [Google Scholar] [CrossRef]
- Hecimovic, I.; Belscak-Cvitanovic, A.; Horzic, D.; Komes, D. Comparative study of polyphenols and caffeine in different coffee varieties affected by the degree of roasting. Food Chem. 2011, 129, 991–1000. [Google Scholar] [CrossRef]
- Singh, S.; Zacharias, M.; Kalpana, S.; Mishra, S. Heavy metals accumulation and distribution pattern in different vegetable crops. J. Environ. Chem. Ecotoxicol. 2012, 4, 75–81. [Google Scholar] [CrossRef]
- Da Silva, S.A.; Mendes, F.Q.; Reis, M.R.; Passos, F.R.; de Carvalho, A.M.X.; de Oliveira Rocha, K.R.; Pinto, F.G. Determination of heavy metals in the roasted and ground coffee beans and brew. Afr. J. Agric. Res. 2017, 12, 221–228. [Google Scholar] [CrossRef]
- Jung, M.C. Heavy metal concentrations in soils and factors affecting metal uptake by plants in the vicinity of a Korean Cu-W Mine. Sensors 2008, 8, 2413–2423. [Google Scholar] [CrossRef] [PubMed]
- Vignoli, J.A.; Bassoli, D.G.; Benassi, M.T. Antioxidant activity, polyphenols, caffeine and melanoidins in soluble coffee: The influence of processing conditions and raw material. Food Chem. 2011, 124, 863–868. [Google Scholar] [CrossRef]
- Vignoli, J.A.; Viegas, M.C.; Bassoli, D.G.; Benassi, M.T. Roasting process affects differently the bioactive compounds and the antioxidant activity of Arabica and Robusta coffees. Food Res. Int. 2014, 61, 279–285. [Google Scholar] [CrossRef]
- Dybkowska, E.; Sadowska, A.; Rakowska, R.; Dębowska, M.; Świderski, F.; Świąder, K. Assessing polyphenols content and antioxidant activity in coffee beans according to origin and the degree of roasting. Rocz. Państw. Zakł. Hig. 2017, 68, 347–353. [Google Scholar]
- Wanyika, H.N.; Gatebe, E.G.; Gitu, L.M.; Ngumba, E.K.; Maritim, C.W. Determination of caffeine content of tea and instant coffee brands found in the Kenyan market. Afr. J. Food Sci. 2010, 4, 353–358. [Google Scholar]
- Wenzl, T.; Beatriz de la Calle, M.; Anklam, E. Analytical methods for the determination of acrylamide in food products: A review. Food Addit. Contam. 2003, 20, 885–902. [Google Scholar] [CrossRef]
- Ono, H.; Chuda, Y.; Ohnishi-Kameyama, M.; Yada, H.; Ishizaka, M.; Kobayashi, H.; Yoshida, M. Analysis of acrylamide by LC-MS/MS and GC-MS in processed Japanese foods. Food Addit. Contam. 2003, 20, 215–220. [Google Scholar] [CrossRef]
- Pham, Y.; Reardon-Smith, K.; Mushtaq, S.; Cockfield, G. The impact of climate change and variability on coffee production: A systematic review. Clim. Chang. 2019, 156, 609–630. [Google Scholar] [CrossRef]
- Farah, A.; Donangelo, C.M. Phenolic compounds in coffee. Braz. J. Plant Physiol. 2006, 18, 23–36. [Google Scholar] [CrossRef]
- Mussatto, S.I.; Machado, E.M.S.; Martins, S.; Teixeira, J.A. Production, composition, and application of coffee and its industrial residues. Food Bioprocess Technol. 2011, 4, 661–672. [Google Scholar] [CrossRef]
- Smrke, S.; Opitz, S.E.; Vovk, I.; Yeretzian, C. How does roasting affect the antioxidants of a coffee brew? Exploring the antioxidant capacity of coffee via on-line antioxidant assays coupled with size exclusion chromatography. Food Funct. 2013, 4, 1082–1092. [Google Scholar] [CrossRef]
- Budryn, G.; Nebesny, E.; Oracz, J. Correlation between the stability of chlorogenic acids, antioxidant activity and acrylamide content in coffee beans roasted in different conditions. Int. J. Food Prop. 2015, 18, 290–302. [Google Scholar] [CrossRef]
- Haile, M.; Kang, W.H. Antioxidant Activity, Total Polyphenol, Flavonoid and Tannin Contents of Fermented Green Coffee Beans with Selected Yeasts. Fermentation 2019, 5, 29. [Google Scholar] [CrossRef]
- Wianowska, D.; Gil, M. Recent advances in extraction and analysis procedures of natural chlorogenic acids. Phytochem. Rev. 2019, 18, 273–302. [Google Scholar] [CrossRef]
- Farah, A.; Monteiro, M.C.; Calado, V.; Franca, A.S.; Trugo, L.C. Correlation between cup quality and chemical attributes of Brazilian coffee. Food Chem. 2006, 98, 373–380. [Google Scholar] [CrossRef]
- Trugo, L.C.; Macrae, R. A study of the effect of roasting on the chlorogenic acid composition of coffee using HPLC. Food Chem. 1984, 15, 219–227. [Google Scholar] [CrossRef]
- Bertrand, B.; Villarreal, D.; Laffargue, A.; Posada, H.; Lashermes, P.; Dussert, S. Comparison of the effectiveness of fatty acids, chlorogenic acids, and elements for the chemometric discrimination of coffee (Coffea arabica L.) varieties and growing origins. J. Agric. Food Chem. 2008, 56, 2273–2280. [Google Scholar] [CrossRef]
- Gichimu, B.M.; Gichuru, E.K.; Mamati, G.E.; Nyende, A.B. Biochemical composition within Coffea arabica cv. Ruiru 11 and its relationship with cup quality. J. Food Res. 2014, 3, 31–44. [Google Scholar] [CrossRef]
- Veberic, R. The Impact of Production Technology on Plant Phenolics. Horticulturae 2016, 2, 8. [Google Scholar] [CrossRef]
- Barański, M.; Srednicka-Tober, D.; Volakakis, N.; Seal, C.; Sanderson, R.; Stewart, G.B.; Benbrook, C.; Biavati, B.; Markellou, E.; Giotis, C.; et al. Higher antioxidant and lower cadmium concentrations and lower incidence of pesticide residues in organically grown crops: A systematic literature review and meta-analyses. Br. J. Nutr. 2014, 112, 794–811. [Google Scholar] [CrossRef]
- Mills, C.E.; Oruna-Concha, M.J.; Mottram, D.S.; Gibson, G.R.; Spencer, J.P.E. The effect of processing on chlorogenic acid content of commercially available coffee. Food Chem. 2013, 141, 3335–3340. [Google Scholar] [CrossRef]
- Várady, M.; Hrušková, T.; Popelka, P. Effect of preparation method and roasting temperature on total polyphenol content in coffee beverages. Czech J. Food Sci. 2020, 38, 417–421. [Google Scholar] [CrossRef]
- Kitzberger, C.; Scholz, M.; Benassi, M. Bioactive compounds content in roasted coffee from traditional and modern Coffea arabica cultivars grown under the same edapho-climatic conditions. Food Res. Int. 2014, 61–66. [Google Scholar] [CrossRef]
- Silvarolla, B.; Mazzafera, P.; Alves de Lima, M.M. Caffeine content of Ethiopian Coffea arabica beans. Genet. Mol. Biol. 2000, 23, 213–215. [Google Scholar] [CrossRef]
- Panusa, A.; Petrucci, R.; Lavecchia, R.; Zuorro, A. UHPLC-PDA-ESI-TOF/MS metabolic profiling and antioxidant capacity of arabica and robusta coffee silverskin: Antioxidants vs phytotoxins. Food Res Int. 2017, 99, 155–165. [Google Scholar] [CrossRef]
- Górecki, M.; Hallmann, E. The antioxidant content of coffee and its in vitro activity as an effect of its production method and roasting and brewing time. Antioxidants 2020, 9, 308. [Google Scholar] [CrossRef]
- Endeshaw, H.; Belay, A. Optimization of the roasting conditions to lower acrylamide content and improve the nutrient composition and antioxidant properties of Coffea arabica. PLoS ONE 2020, 15, e0237265. [Google Scholar] [CrossRef] [PubMed]
- Commission Regulation (EU); Publications Office of the EU. Establishing Mitigation Measures and Benchmark Levels for the Reduction of the Presence of Acrylamide in Food. 2017/2158 of 20 November 2017. Available online: https://op.europa.eu/en/publication-detail/-/publication/1f3b45fb-ce6b-11e7-a5d5-01aa75ed71a1/language-en (accessed on 21 November 2017).
- Jeszka-Skowron, M.; Stanisz, E.; De Peña, M.P. Relationship between antioxidant capacity, chlorogenic acids and elemental composition of green coffee. LWT 2016, 73, 243–250. [Google Scholar] [CrossRef]
- Şemen, S.; Mercan, S.; Yayla, M.; Açıkkol, M. Elemental composition of green coffee and its contribution to dietary intake. Food Chem. 2017, 215, 92–100. [Google Scholar] [CrossRef] [PubMed]
- Endaye, M.; Atlabachew, M.; Mehari, B.; Alemayehu, M.; Mengistu, D.A.; Kerisew, B. Combining multi-element analysis with statistical modeling for tracing the origin of green coffee beans from Amhara region, Ethiopia. Biol. Trace Elem. Res. 2020, 195, 669–678. [Google Scholar] [CrossRef]
- Adler, G.; Nędzarek, A.; Tórz, A. Concentrations of selected metals (Na, K, Ca, Mg, Fe, Cu, Zn, Al, Ni, Pb, Cd) in coffee. Zdr. Varst. 2019, 58, 187–193. [Google Scholar] [CrossRef]
- Zhou, Q.; Yang, N.; Li, Y.; Ren, B.; Ding, X.; Bian, H.; Yao, X. Total concentrations and sources of heavy metal pollution in global river and lake water bodies from 1972 to 2017. Glob. Ecol. Conserv. 2020, 22, e00925. [Google Scholar] [CrossRef]
- Genchi, G.; Sinicropi, M.S.; Lauria, G.; Carocci, A.; Catalano, A. The effects of cadmium toxicity. Int. J. Environ. Res. Public Health 2020, 17, 3782. [Google Scholar] [CrossRef]
- Magri, E.; Valduga, A.T.; Gonçalves, I.L.; Barbosa, J.Z.; de Oliveira Rabel, D.; Menezes, I.M.N.R.; de Andrade Nascimento, P.; Oliveira, A.; Corrêa, R.S.; Motta, A.C.V. Cadmium and lead concentrations in yerba mate leaves from agroforestry and plantation systems: An international survey in South America. J. Food Compost. Anal. 2021, 96, 103702. [Google Scholar] [CrossRef]
- Lavecchia, R.; Medici, F.; Patterer, S.; Zuorro, A. Lead removal from water by adsorption on spent coffee grounds. Chem. Eng. Trans. 2016, 47, 295–300. [Google Scholar] [CrossRef]
- Patterer, S.; Bavasso, I.; Sambeth, J.; Medici, F. Cadmium removal from aqueous solution by adsorption on spent coffee grounds. Chem. Eng. Trans. 2017, 60, 157–162. [Google Scholar] [CrossRef]


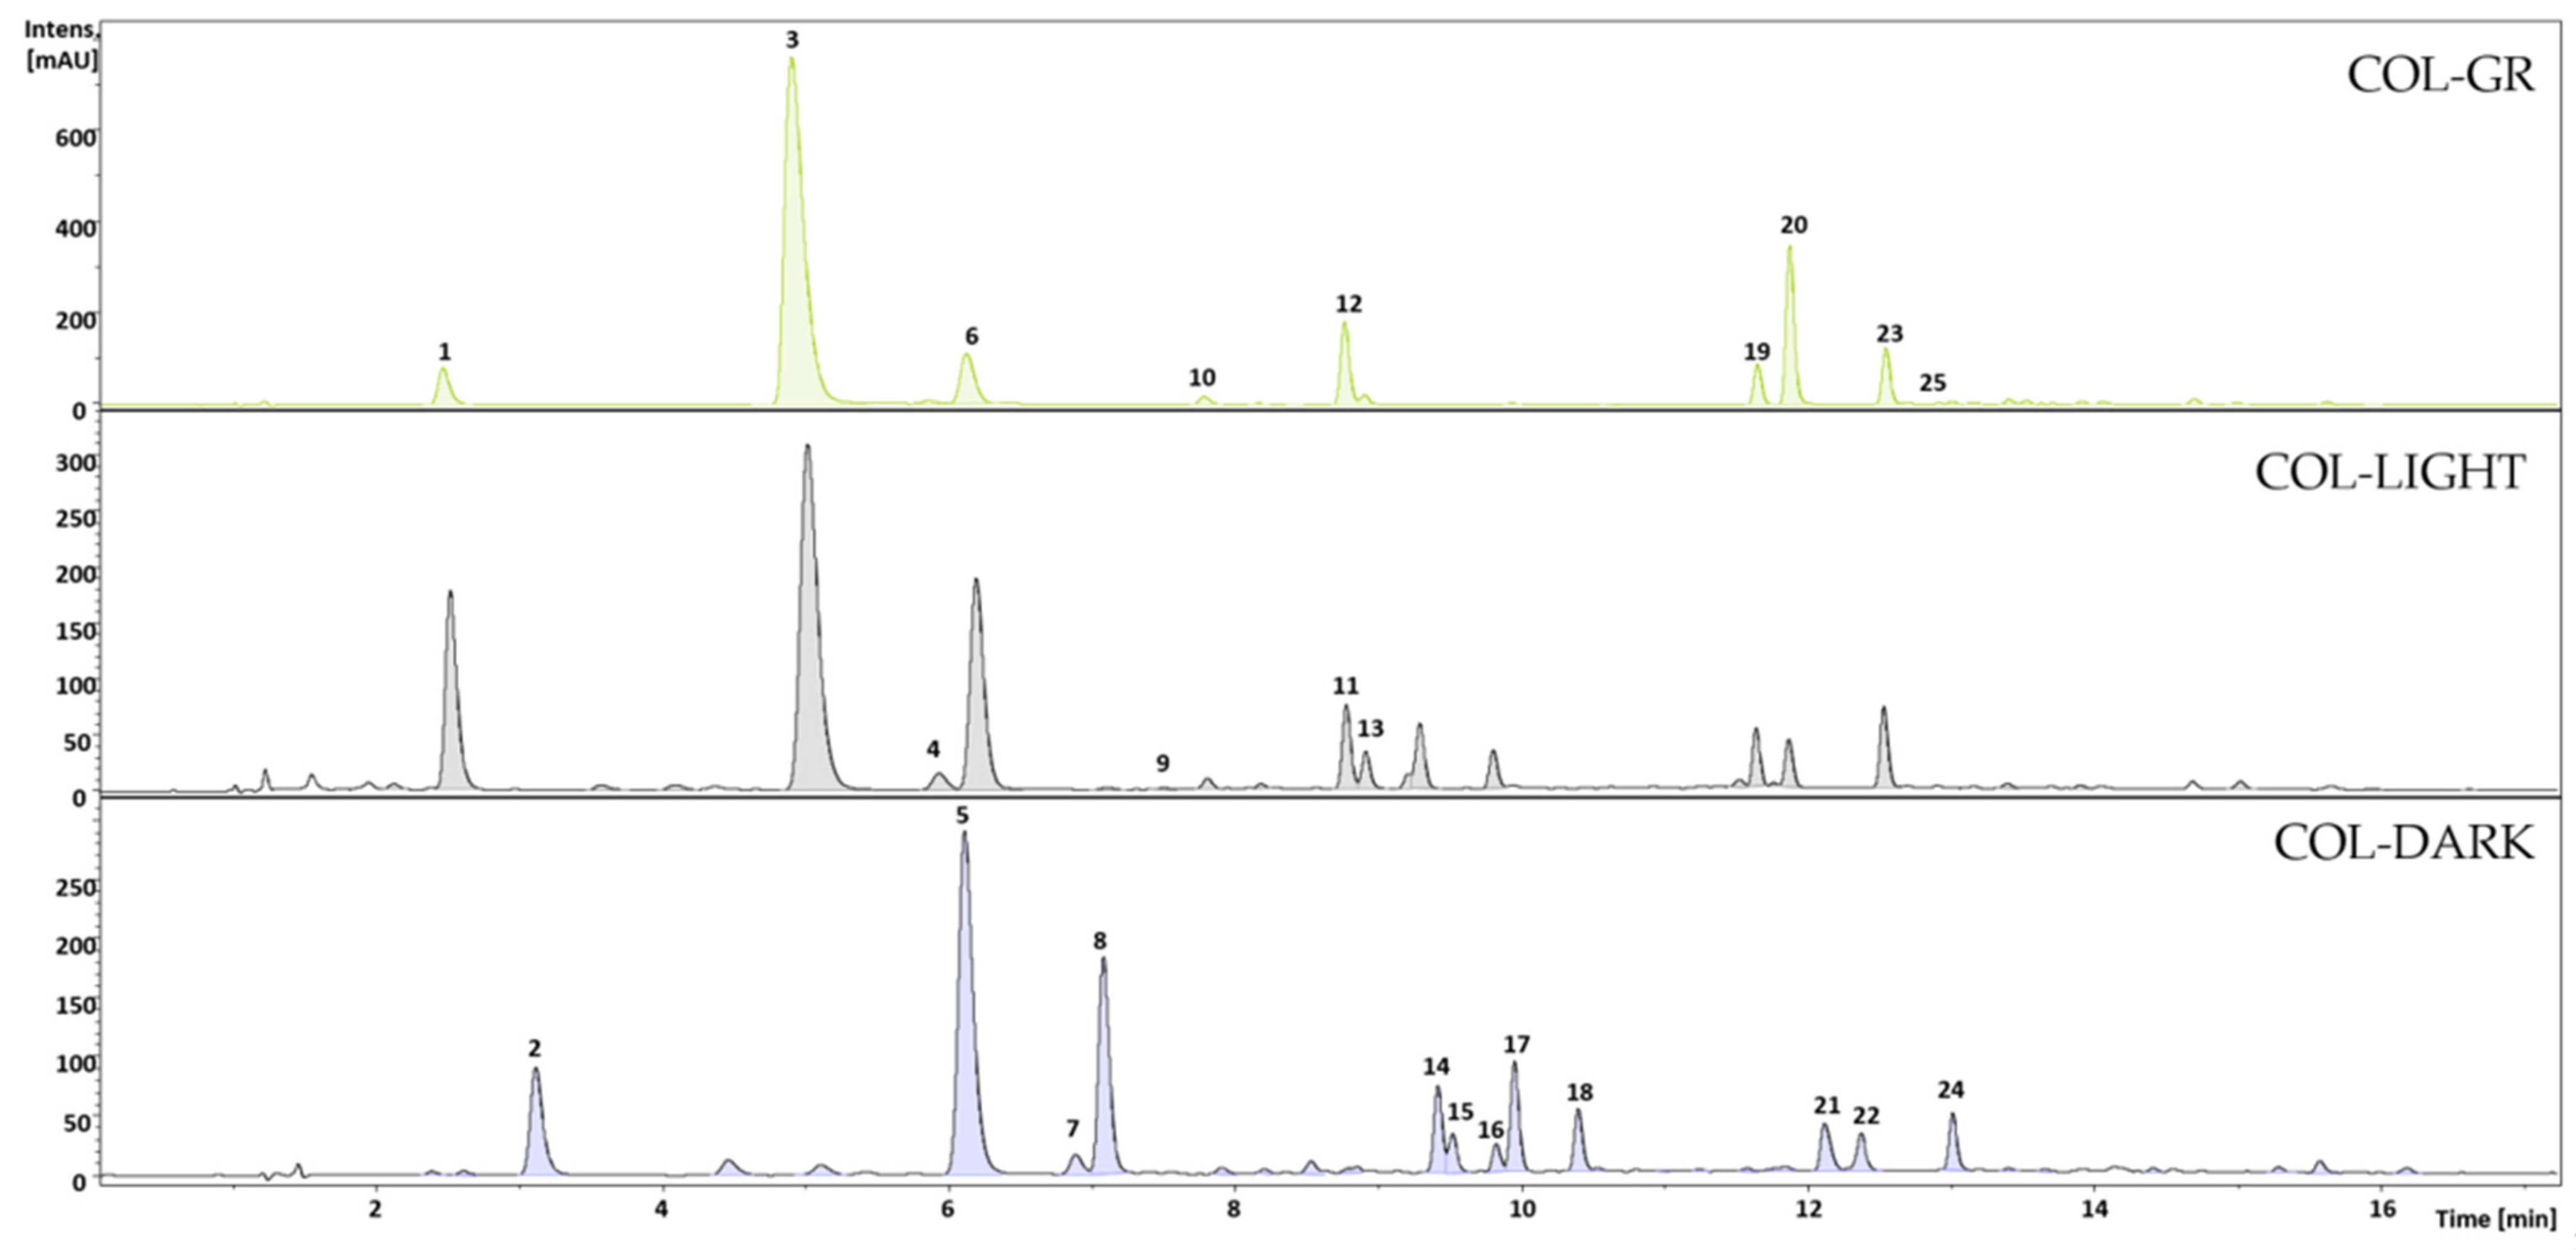
| No. | RT (min) | UV (nm) | m/z[M-H]− | MS2 Main Ion | MS2 Fragments | Formula | Compound | COL-GR | COL-LIGHT | COL-DARK |
|---|---|---|---|---|---|---|---|---|---|---|
| 1 | 2.5 | 215,325 | 353.0874 | 191.0548 | 179,161,135 | C16H18O9 | 3-O-CQA | 2.35 ± 0.08 | 5.05 ± 0.74 | |
| 2 | 3.1 | 215,325 | 353.0871 | 191.0556 | 179,161,135 | C16H18O9 | trans 3-O-CQA | 2.92 ± 0.41 | ||
| 3 | 5.2 | 215,325 | 353.0881 | 191.0548 | 179,135,161 | C16H18O9 | 5-O-CQA | 36.3 ± 2.04 | 14.0 ± 1.02 | |
| 4 | 5.9 | 215,325 | 367.103 | 193.0493 | 134,149,173 | C17H20O9 | 3-O-FQA | 0.24 ± 0.02 | 0.55 ± 0.02 | |
| 5 | 6.1 | 215,325 | 353.0877 | 191.0553 | C16H18O9 | trans 5-O-CQA | 10.8 ± 0.86 | |||
| 6 | 6.2 | 215,325 | 353.0877 | 191.0553 | 179,173 | C16H18O9 | 4-O-CQA | 3.93 ± 0.06 | 6.55 ± 0.21 | |
| 7 | 6.8 | 215,325 | 367.1033 | 193.0493 | 134,149,173 | C17H20O9 | trans 3-O-FQA | 0.51 ± 0.02 | ||
| 8 | 7.1 | 215,325 | 353.0882 | 173.0439 | 179,191,134,155 | C16H18O9 | trans 4-O-CQA | 5.05 ± 0.08 | ||
| 9 | 7.5 | 215,325 | 367.1034 | 161.0224 | 133 | C17H20O9 | 4-O-FQA | 0.05 ± 0.01 | ||
| 10 | 7.8 | 215,325 | 337.0919 | 191.0545 | 173,163 | C16H18O8 | 5-O-p-CoQA 1 | 0.43 ± 0.01 | ||
| 11 | 8.8 | 215,325 | 335.0777 | 161.0228 | 135 | C16H16O9 | 5-CSKA | 1.60 ± 0.04 | ||
| 12 | 8.9 | 215,325 | 367.1036 | 173.0438 | 193,134 | C17H20O9 | 5-O-FQA | 3.89 ± 0.09 | 0.72 ± 0.02 | |
| 13 | 9.3 | 215,325 | 335.0778 | 161.0227 | 135 | C16H16O9 | trans 4-CSKA | 1.35 ± 0.07 | ||
| 14 | 9.4 | 215,325 | 367.104 | 191.0548 | 173,155,134 | C17H20O9 | trans 5-O-FQA | 1.53 ± 0.02 | ||
| 15 | 9.5 | 215,325 | 367.1044 | 173.0439 | 191,156,134 | C17H20O9 | trans 4-O-FQA | 0.72 ± 0.02 | ||
| 16 | 9.8 | 215,325 | 335.0774 | 161.0224 | 179,135 | C16H16O8 | 3-CSKA | 0.45 ± 0.01 | ||
| 17 | 9.9 | 215,325 | 335.0777 | 161.0228 | 135 | C16H16O9 | 5-CSKA | 1.86 ± 0.07 | ||
| 18 | 10.4 | 215,325 | 335.0778 | 161.0227 | C16H16O9 | 4-CSKA | 1.06 ± 0.03 | |||
| 19 | 11.7 | 215,325 | 515.1199 | 353.0869 | 173,179,191,161 | C25H24O12 | 3,4-DiCQA | 0.05 ± 0.001 | 0.96 ± 0.07 | |
| 20 | 11.9 | 215,325 | 515.1195 | 191.0547 | 353,179 | C25H24O12 | 4,5-DiCQA | 1.69 ± 0.02 | 0.81 ± 0.02 | |
| 21 | 12.1 | 215,325 | 515.1196 | 353.0869 | 173,179,191,161 | C25H24O12 | trans 3,4-DiCQA | 0.95 ± 0.01 | ||
| 22 | 12.4 | 215,325 | 515.1195 | 191.0547 | 353,179 | C25H24O12 | trans 4,5-DiCQA | 0.77 ± 0.01 | ||
| 23 | 12.5 | 215,325 | 515.1204 | 353.0874 | 173,179,191 | C25H24O13 | 3,5-DiCQA | 7.06 ± 0.74 | 1.45 ± 0.02 | |
| 24 | 13 | 215,325 | 515.1197 | 353.0874 | 173,179,191 | C25H24O13 | trans 3,5-DiCQA | 0.97 ± 0.01 | ||
| 25 | 13 | 215 | 499.1246 | 337.0928 | 163 | C25H24O11 | 3-O-p-CoQA-Gluc 2 | 2.47 ± 0.04 |
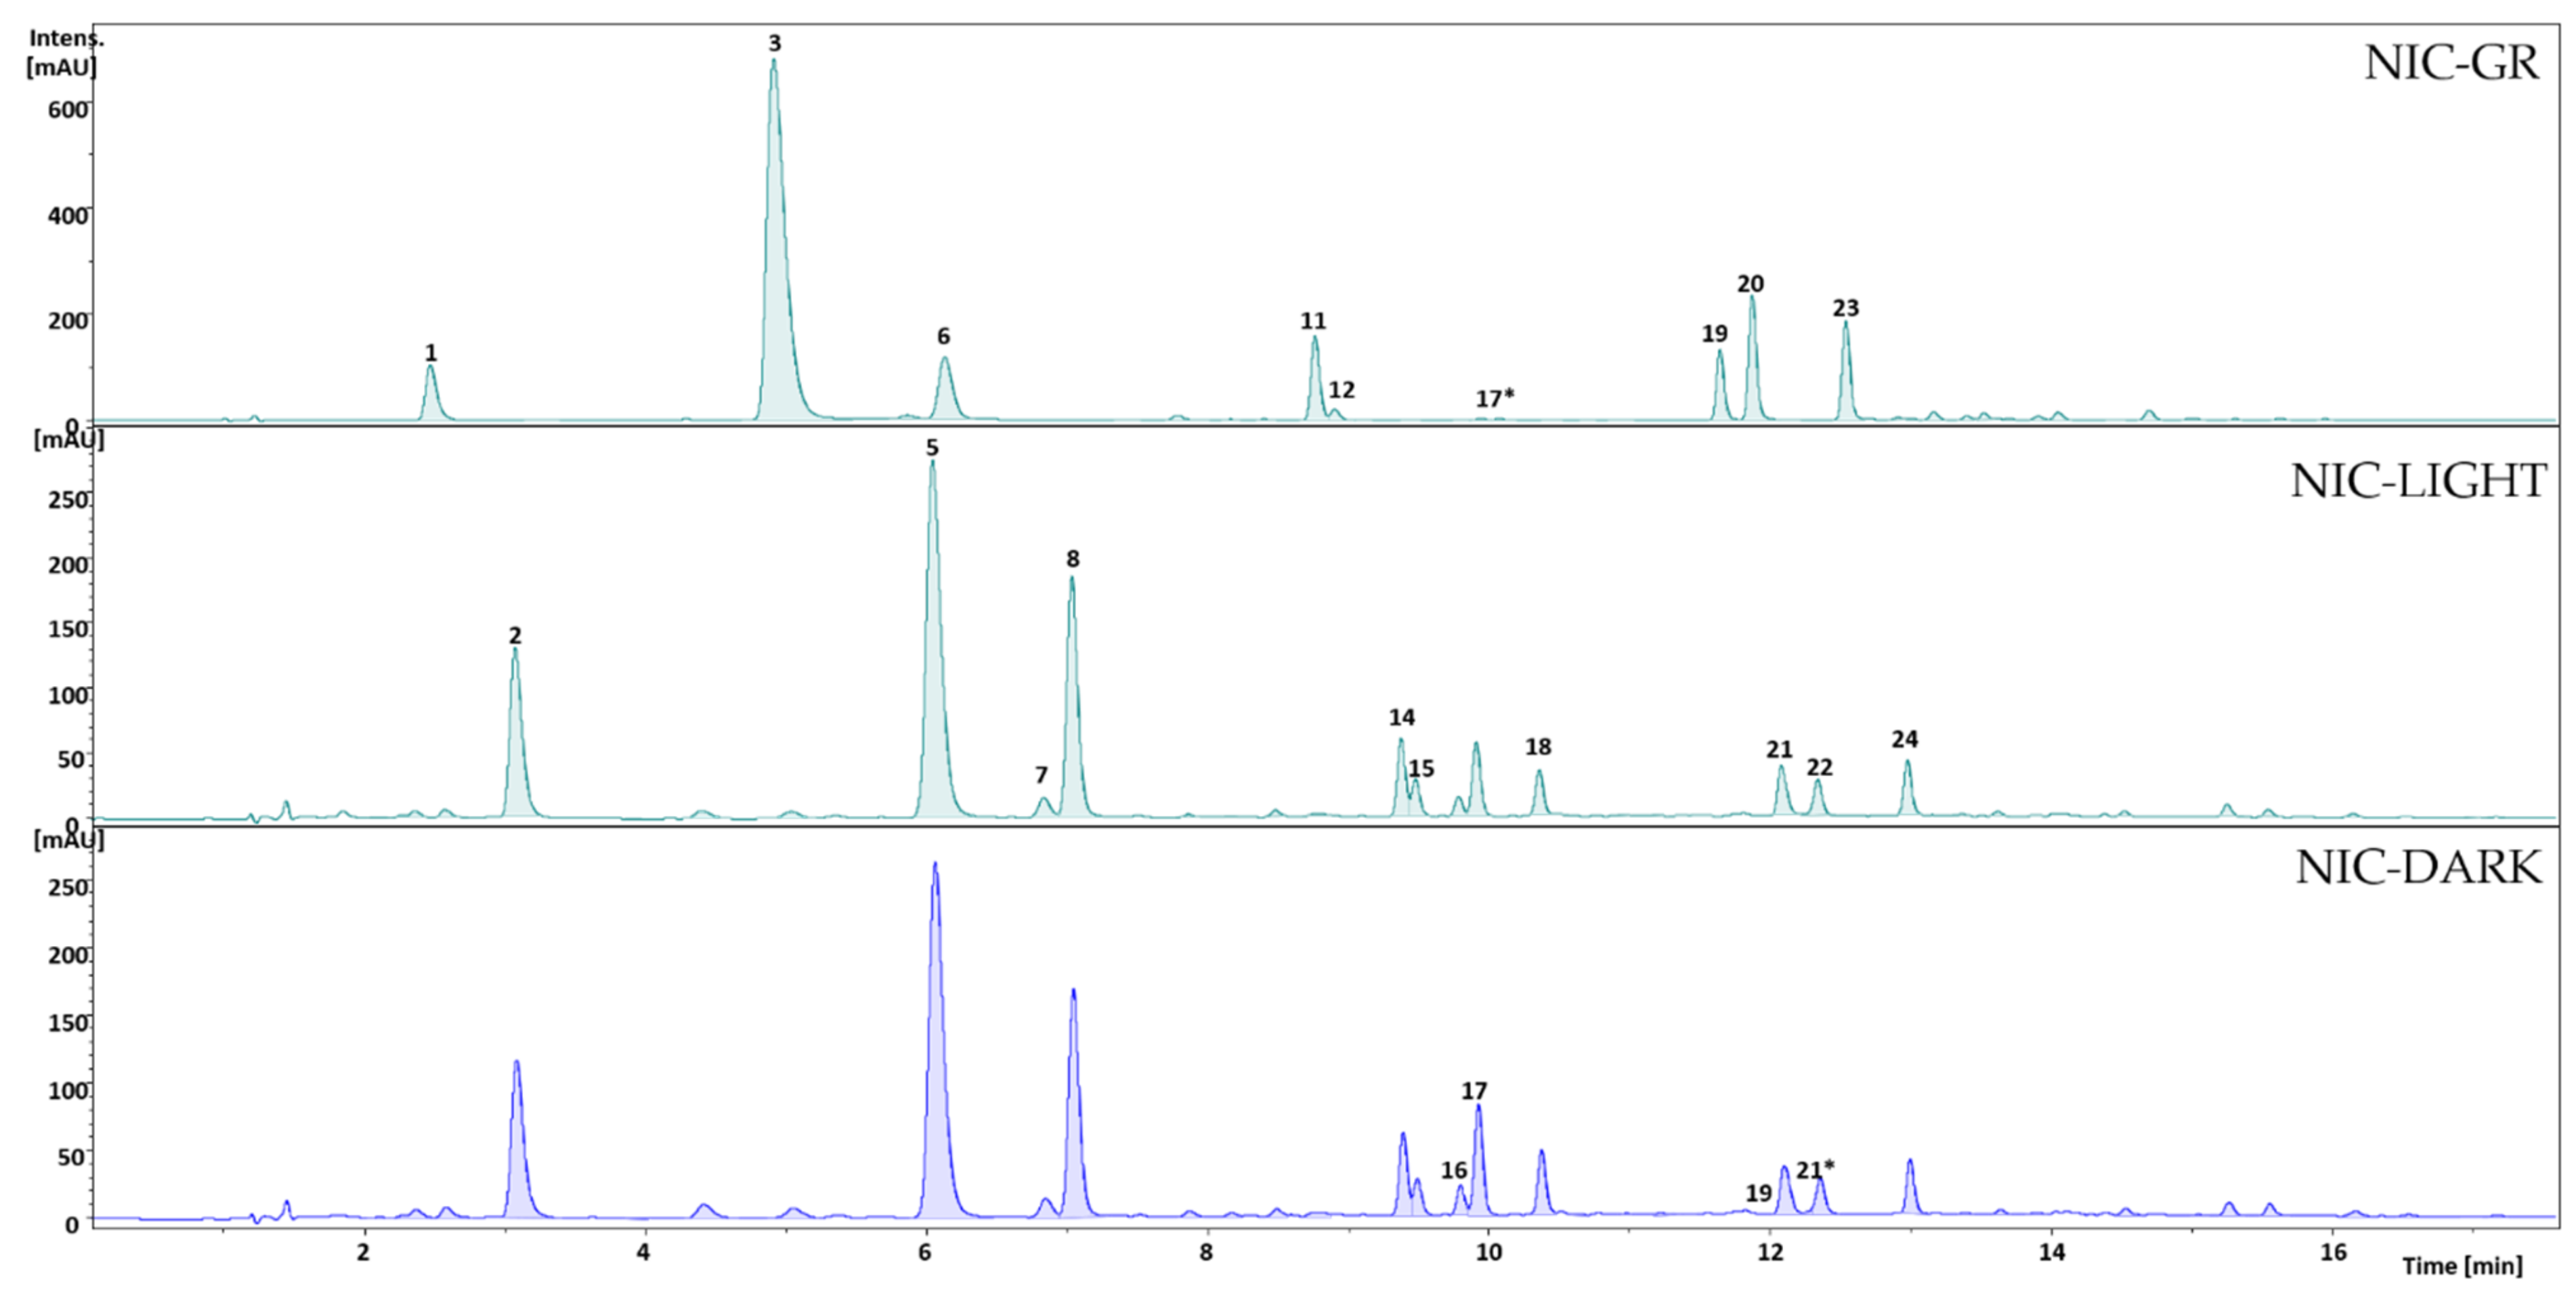
| No. | RT (min) | UV (nm) | m/z[M-H]− | MS2 Main Ion | MS2 Fragments | Formula | Compound | NIC-GR | NIC-LIGHT | NIC-DARK |
|---|---|---|---|---|---|---|---|---|---|---|
| 1 | 2.4 | 205,289 | 353.0874 | 191.0546 | 179,155,135 | C16H18O9 | 3-O-CQA | 2.22 ± 0.60 | ||
| 2 | 3.1 | 215,325 | 353.0871 | 191.0556 | 179,161,135 | C16H18O9 | trans 3-O-CQA | 4.40 ± 0.21 | 3.84 ± 0.07 | |
| 3 | 4.9 | 215,325 | 353.0872 | 191.0556 | C16H18O9 | 5-O-CQA | 24.2 ± 2.11 | |||
| 5 | 6.1 | 215,325 | 353.0877 | 191.0553 | C16H18O9 | trans 5-O-CQA | 12.3 ± 1.22 | 10.1 ± 1.01 | ||
| 6 | 6.2 | 215,325 | 353.0884 | 173.044 | 179,191,135,155 | C16H18O9 | 4-O-CQA | 2.97 ± 0.08 | ||
| 7 | 6.8 | 215,325 | 367.1033 | 193.0493 | 134,149,173 | C17H20O9 | trans 3-O-FQA | 0.53 ± 0.04 | 0.40 ± 0.02 | |
| 8 | 7.1 | 215,325 | 353.0882 | 173.0439 | 179,191,134,155 | C16H18O9 | trans 4-O-CQA | 5.99 ± 0.65 | 4.67 ± 0.08 | |
| 11 | 8.8 | 215,325 | 367.1044 | 191.0552 | 173 | C17H20O9 | 5-O-FQA | 2.58 ± 0.04 | ||
| 12 | 8.9 | 215,325 | 367.1041 | 191.0548 | 173,155,134 | C17H20O9 | 3-O-FQA | 0.31 ± 0.01 | ||
| 14 | 9.4 | 215,325 | 367.104 | 191.0548 | 173,155,134 | C17H20O9 | trans 5-O-FQA | 1.53 ± 0.07 | 1.41 ± 0.06 | |
| 15 | 9.5 | 215,325 | 367.1044 | 173.0439 | 191,156,134 | C17H20O9 | trans 4-O-FQA | 0.71 ± 0.01 | 0.58 ± 0.02 | |
| 16 | 9.8 | 215,325 | 335.0774 | 161.0224 | 179,135 | C16H16O8 | 3-CSKA | 0.39 ± 0.01 | 0.48 ± 0.01 | |
| 17 | 9.9 | 215,325 | 335.0777 | 161.0228 | 135 | C16H16O9 | 5-CSKA | 1.57 ± 0.02 | 1.89 ± 0.04 | |
| 17 * | 9.9 | 215,325 | 367.1038 | 179.033 | 161,135 | C17H20O9 | 4-O-FQA | 0.05 ± 0.01 | ||
| 18 | 10.4 | 215,325 | 335.0778 | 161.0227 | C16H16O9 | 4-CSKA | 0.84 ± 0.01 | |||
| 19 | 11.7 | 215,325 | 515.1199 | 353.0869 | 173,179,191,161 | C25H24O12 | 3,4-DiCQA | 3.52 ± 0.06 | ||
| 20 | 11.9 | 215,325 | 515.1195 | 191.0547 | 353,179 | C25H24O12 | 4,5-DiCQA | 1.90 ± 0.02 | ||
| 21 | 12.1 | 215,325 | 515.1196 | 353.0869 | 173,179,191,161 | C25H24O12 | trans 3,4-DiCQA | 1.05 ± 0.01 | 0.94 ± 0.02 | |
| 21 * | 12.2 | 215 | 349.0927 | 175.0382 | 160,193 | C17H18O8 | 3-F-1,5-Quinolac | 0.68 ± 0.01 | ||
| 22 | 12.4 | 215,325 | 515.1195 | 191.0547 | 353,179 | C25H24O12 | trans 4,5-DiCQA | 0.66 ±0.02 | 0.66 ± 0.01 | |
| 23 | 12.5 | 215,325 | 515.1204 | 353.0874 | 173,179,191 | C25H24O13 | 3,5-DiCQA | 2.68 ± 0.11 | ||
| 24 | 13 | 215,325 | 515.1197 | 353.0874 | 173,179,191 | C25H24O13 | trans 3,5-DiCQA | 1.00 ± 0.01 | 0.91 ± 0.01 |
| C | R | CQA (Cis and Trans) | FQA (Cis and Trans) | diCQA (Cis and Trans) | ||||||
|---|---|---|---|---|---|---|---|---|---|---|
| 3-O-CQA | 5-O-CQA | 4-O-CQA | 3-O-FQA | 5-O-FQA | 4-O-FQA | 3,4-diCQA | 4,5-diCQA | 3,5-diCQA | ||
| COL | GR | 2.35 ± 0.08 a | 36.3 ± 2.04 b | 3.93 ± 0.06 b | 0.24 ± 0.02 a | 3.89 ± 0.09 d | 0.0 ± 0.00 a | 0.05 ± 0.01 a | 1.69 ± 0.02 d | 7.06 ± 0.74 d |
| LIGHT | 5.05 ± 0.74 b | 14.0 ± 1.02 a | 6.55 ± 0.21 e | 0.55 ± 0.02 b | 0.72 ± 0.01 a | 0.05 ± 0.02 b | 0.96 ± 0.07 b | 0.81 ± 0.02 c | 1.45 ± 0.02 b | |
| DARK | 2.92 ± 0.41 b | 10.8 ± 0.86 a | 5.0 ± 0.09 c | 0.51 ± 0.02 b | 1.53 ± 0.02 b | 0.72 ± 0.02 c | 0.95 ± 0.01 b | 0.77 ± 0.01 c | 0.97 ± 0.01 a | |
| NIC | GR | 2.22 ± 0.60 a | 24.2 ± 2.11 b | 2.97 ± 0.08 a | 0.31 ± 0.01 a | 2.58 ± 0.04 c | 0.05 ± 0.01 a | 3.52 ± 0.06 d | 1.90 ± 0.02 e | 2.68 ± 0.11 c |
| LIGHT | 4.40 ± 0.21 b | 12.3 ± 1.22 a | 5.99 ± 0.65 d | 0.53 ± 0.04 b | 1.53 ± 0.07 b | 0.71 ± 0.01 c | 1.05 ± 0.01 c | 0.66 ± 0.02 b | 1.00 ± 0.01 a | |
| DARK | 3.84 ± 0.07 b | 10.1 ± 1.01 a | 4.67 ± 0.08 c | 0.40 ± 0.02 b | 1.41 ± 0.06 a | 0.58 ± 0.02 d | 0.94 ± 0.02 b | 0.66 ± 0.01 a | 0.91 ± 0.01 a | |
| Significance of effects | ||||||||||
| Coffee type (C) | 0.148 | 0.001 | 0.001 | 0.492 | 0.001 | 0.001 | 0.001 | 0.001 | 0.001 | |
| Roasting (R) | 0.001 | 0.001 | 0.001 | 0.001 | 0.001 | 0.001 | 0.001 | 0.001 | 0.001 | |
| C × R | 0.001 | 0.001 | 0.053 | 0.068 | 0.001 | 0.001 | 0.001 | 0.001 | 0.001 | |
| Coffee | Roasting | Total Polyphenols (mg/g DM) | Caffeine (mg/kg) | Acrylamide (µg/kg) |
|---|---|---|---|---|
| Colombian | Green | 59.8 ± 8.94 b | 11,104 ± 777 | Nd |
| Light | 35.5 ± 3.64 a | 12,660 ± 886 | 457 ± 82.3 b | |
| Darker | 30.1 ± 4.56 a | 12,329 ± 863 | 192 ± 34.6 a | |
| Nicaraguan | Green | 41.9 ± 6.44 a | 11,127 ± 779 | Nd |
| Light | 32.8 ± 4.15 a | 12,822 ± 898 | 413 ± 74.3 b | |
| Darker | 30.0 ± 2.56 a | 12,868 ± 901 | 277 ± 49.9 a | |
| Significance of effects | ||||
| Coffee (C) | 0.002 | 0.559 | 0.590 | |
| Roasting (R) | 0.001 | 0.011 | 0.001 | |
| C × R | 0.054 | 0.865 | 0.115 | |
| Heavy Metal | Colombian | Nicaraguan | p |
|---|---|---|---|
| Mercury | 0.0007 ± 0.00003 | 0.0007 ± 0.00001 | 0.626 |
| Copper | 10.9 ± 2.33 | 14.1 ± 3.16 | 0.225 |
| Lead | 0.13 ± 0.02 | 0.10 ± 0.04 | 0.341 |
| Chrome | 0.06 ± 0.01 | 0.06 ± 0.01 | 0.124 |
| Cadmium | 0.15 ± 0.02 | 0.01 ± 0.01 | 0.001 |
| Nickel | 0.63 ± 0.07 | 0.48 ± 0.03 | 0.03 |
| Aluminum | 4.27 ± 0.53 | 3.28 ± 0.34 | 0.054 |
Publisher’s Note: MDPI stays neutral with regard to jurisdictional claims in published maps and institutional affiliations. |
© 2021 by the authors. Licensee MDPI, Basel, Switzerland. This article is an open access article distributed under the terms and conditions of the Creative Commons Attribution (CC BY) license (https://creativecommons.org/licenses/by/4.0/).
Share and Cite
Várady, M.; Ślusarczyk, S.; Boržíkova, J.; Hanková, K.; Vieriková, M.; Marcinčák, S.; Popelka, P. Heavy-Metal Contents and the Impact of Roasting on Polyphenols, Caffeine, and Acrylamide in Specialty Coffee Beans. Foods 2021, 10, 1310. https://doi.org/10.3390/foods10061310
Várady M, Ślusarczyk S, Boržíkova J, Hanková K, Vieriková M, Marcinčák S, Popelka P. Heavy-Metal Contents and the Impact of Roasting on Polyphenols, Caffeine, and Acrylamide in Specialty Coffee Beans. Foods. 2021; 10(6):1310. https://doi.org/10.3390/foods10061310
Chicago/Turabian StyleVárady, Matúš, Sylwester Ślusarczyk, Jana Boržíkova, Katarína Hanková, Michaela Vieriková, Slavomír Marcinčák, and Peter Popelka. 2021. "Heavy-Metal Contents and the Impact of Roasting on Polyphenols, Caffeine, and Acrylamide in Specialty Coffee Beans" Foods 10, no. 6: 1310. https://doi.org/10.3390/foods10061310
APA StyleVárady, M., Ślusarczyk, S., Boržíkova, J., Hanková, K., Vieriková, M., Marcinčák, S., & Popelka, P. (2021). Heavy-Metal Contents and the Impact of Roasting on Polyphenols, Caffeine, and Acrylamide in Specialty Coffee Beans. Foods, 10(6), 1310. https://doi.org/10.3390/foods10061310