
Nutritional, Physico-Chemical and Mechanical Characterization of Vegetable Fibers to Develop Fiber-Based Gel Foods


Abstract
1. Introduction
2. Materials and Methods
2.1. Raw Materials
2.2. Physico-Chemical Analysis
2.3. Hydration Properties
2.4. Antioxidant Capacity and Phenolic Compounds
2.5. Ash and Mineral Analysis
2.6. Gel Preparation
2.7. Gel Analysis: Water Content, pH, Color, Texture and Rheology
2.8. Statistical Analysis
3. Results and Discussion
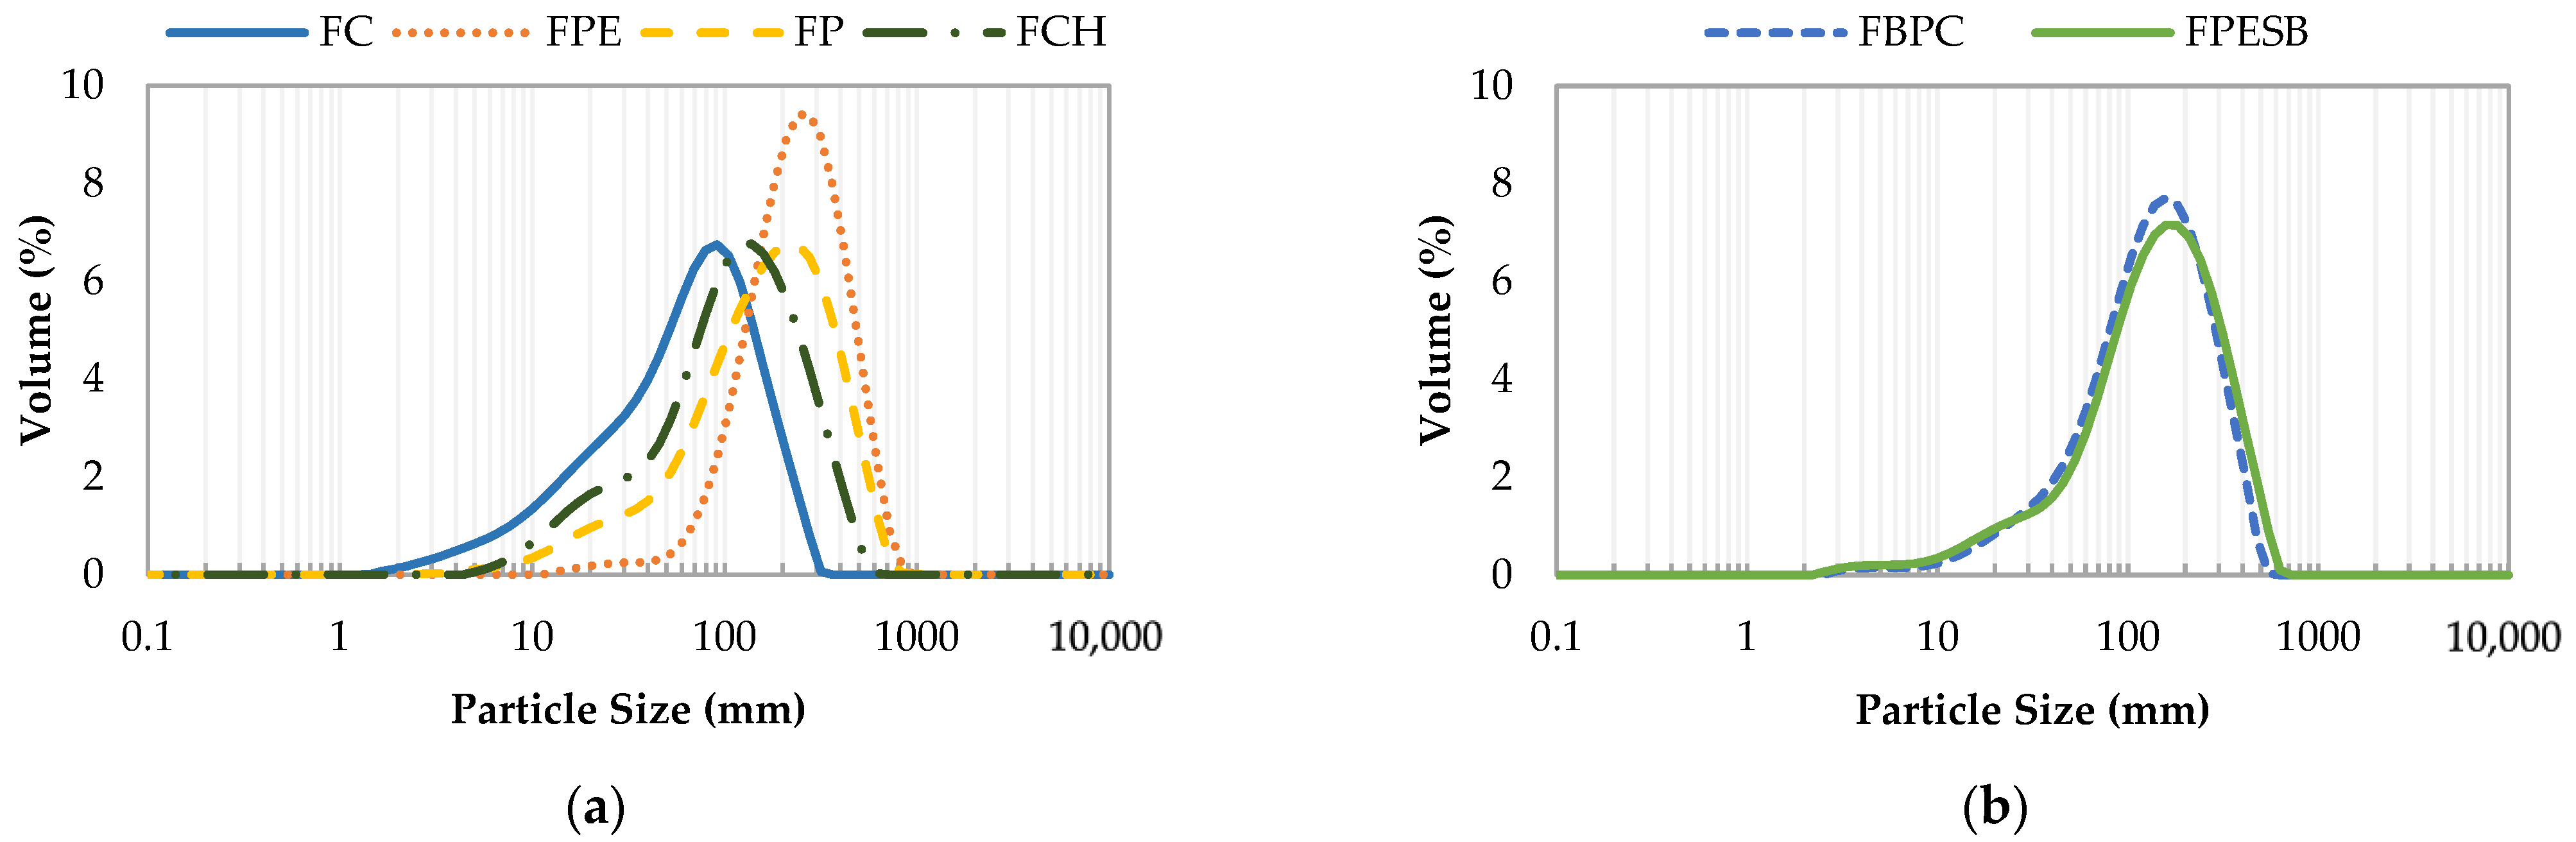
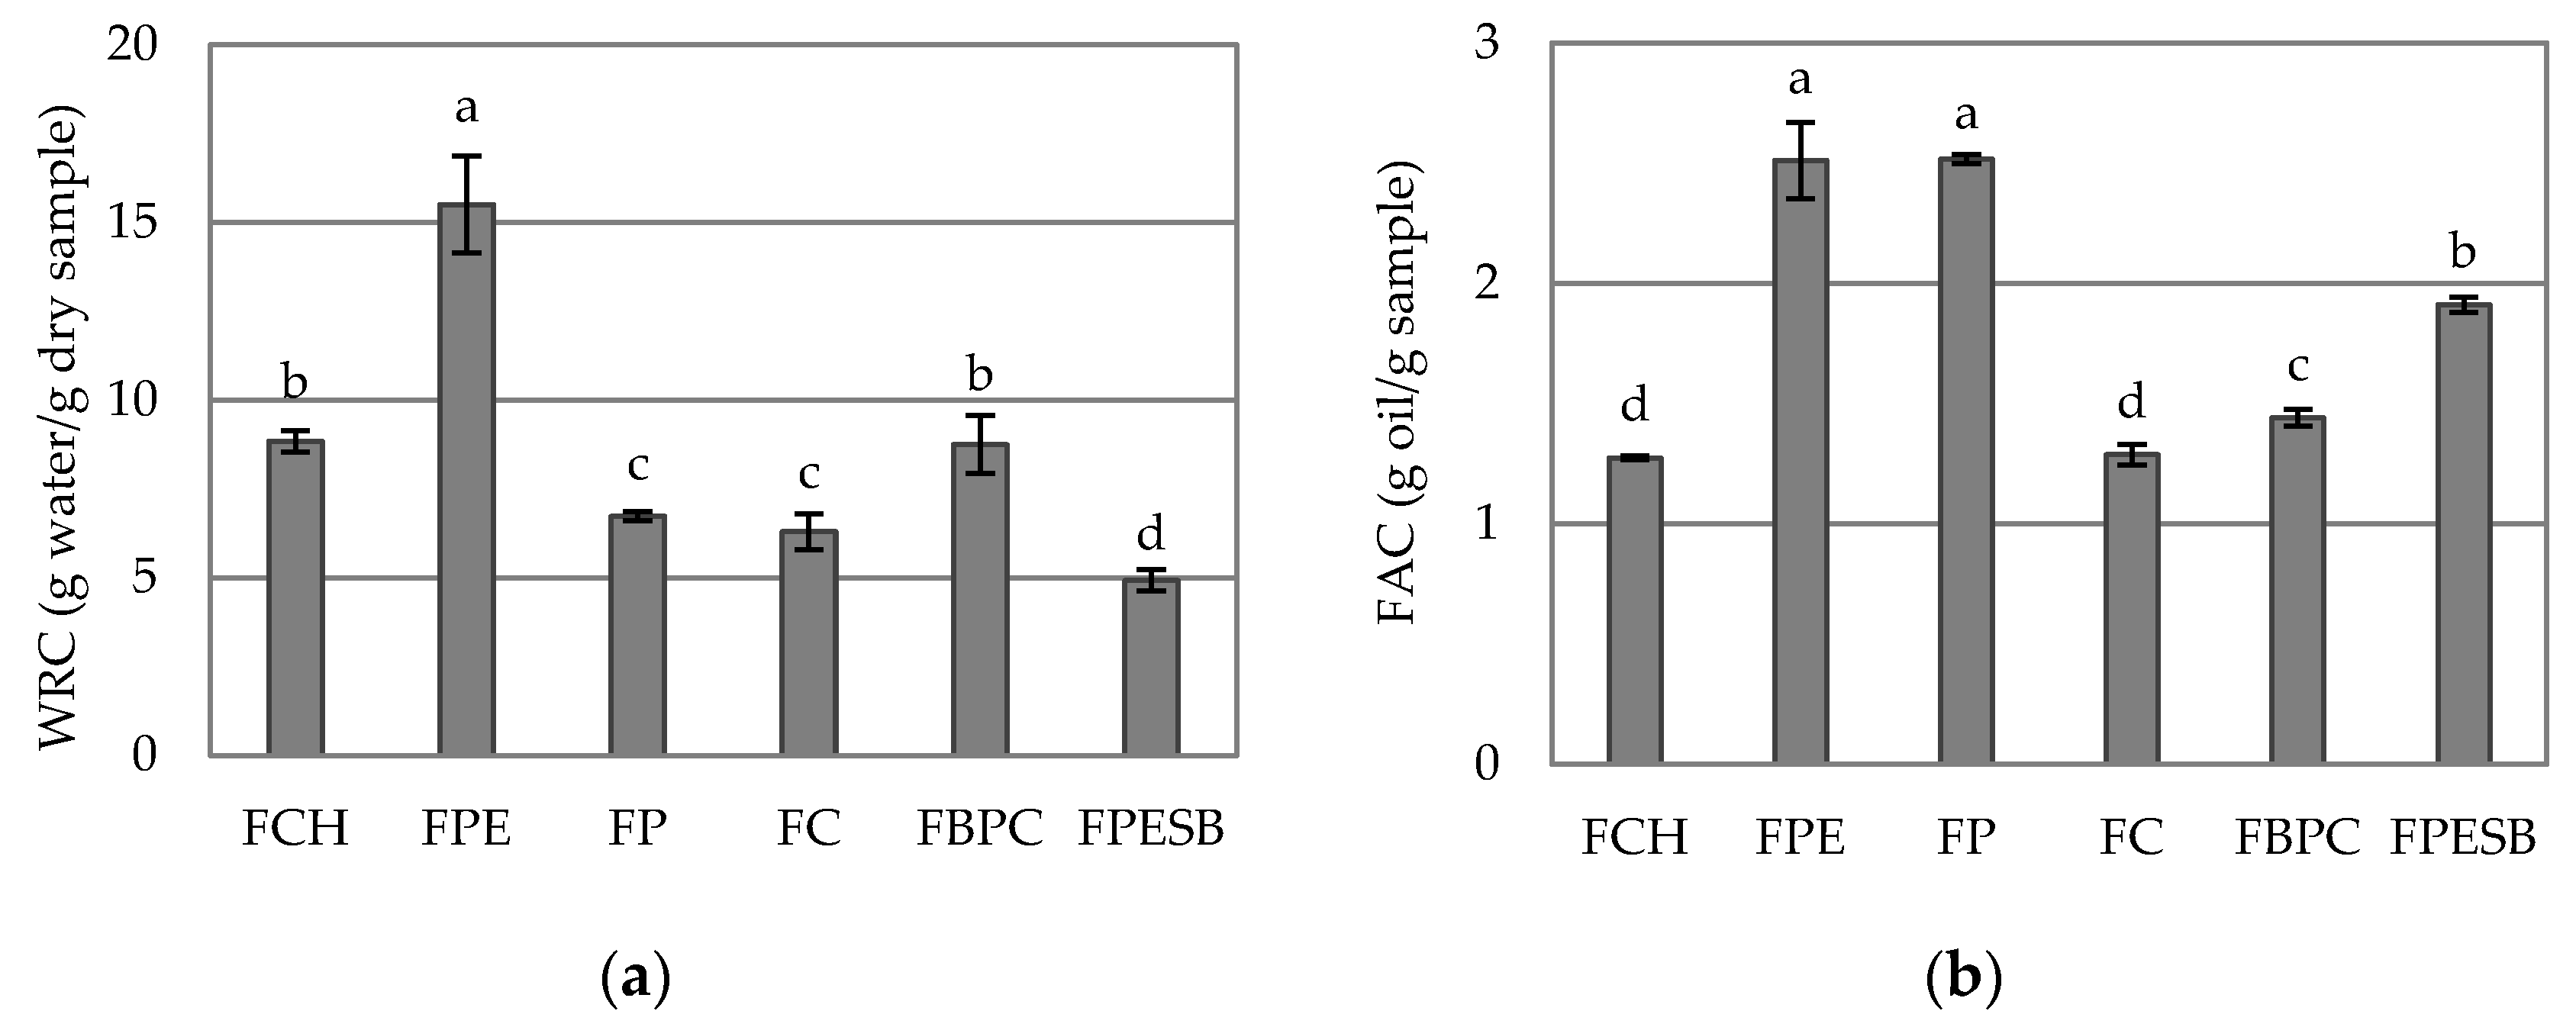
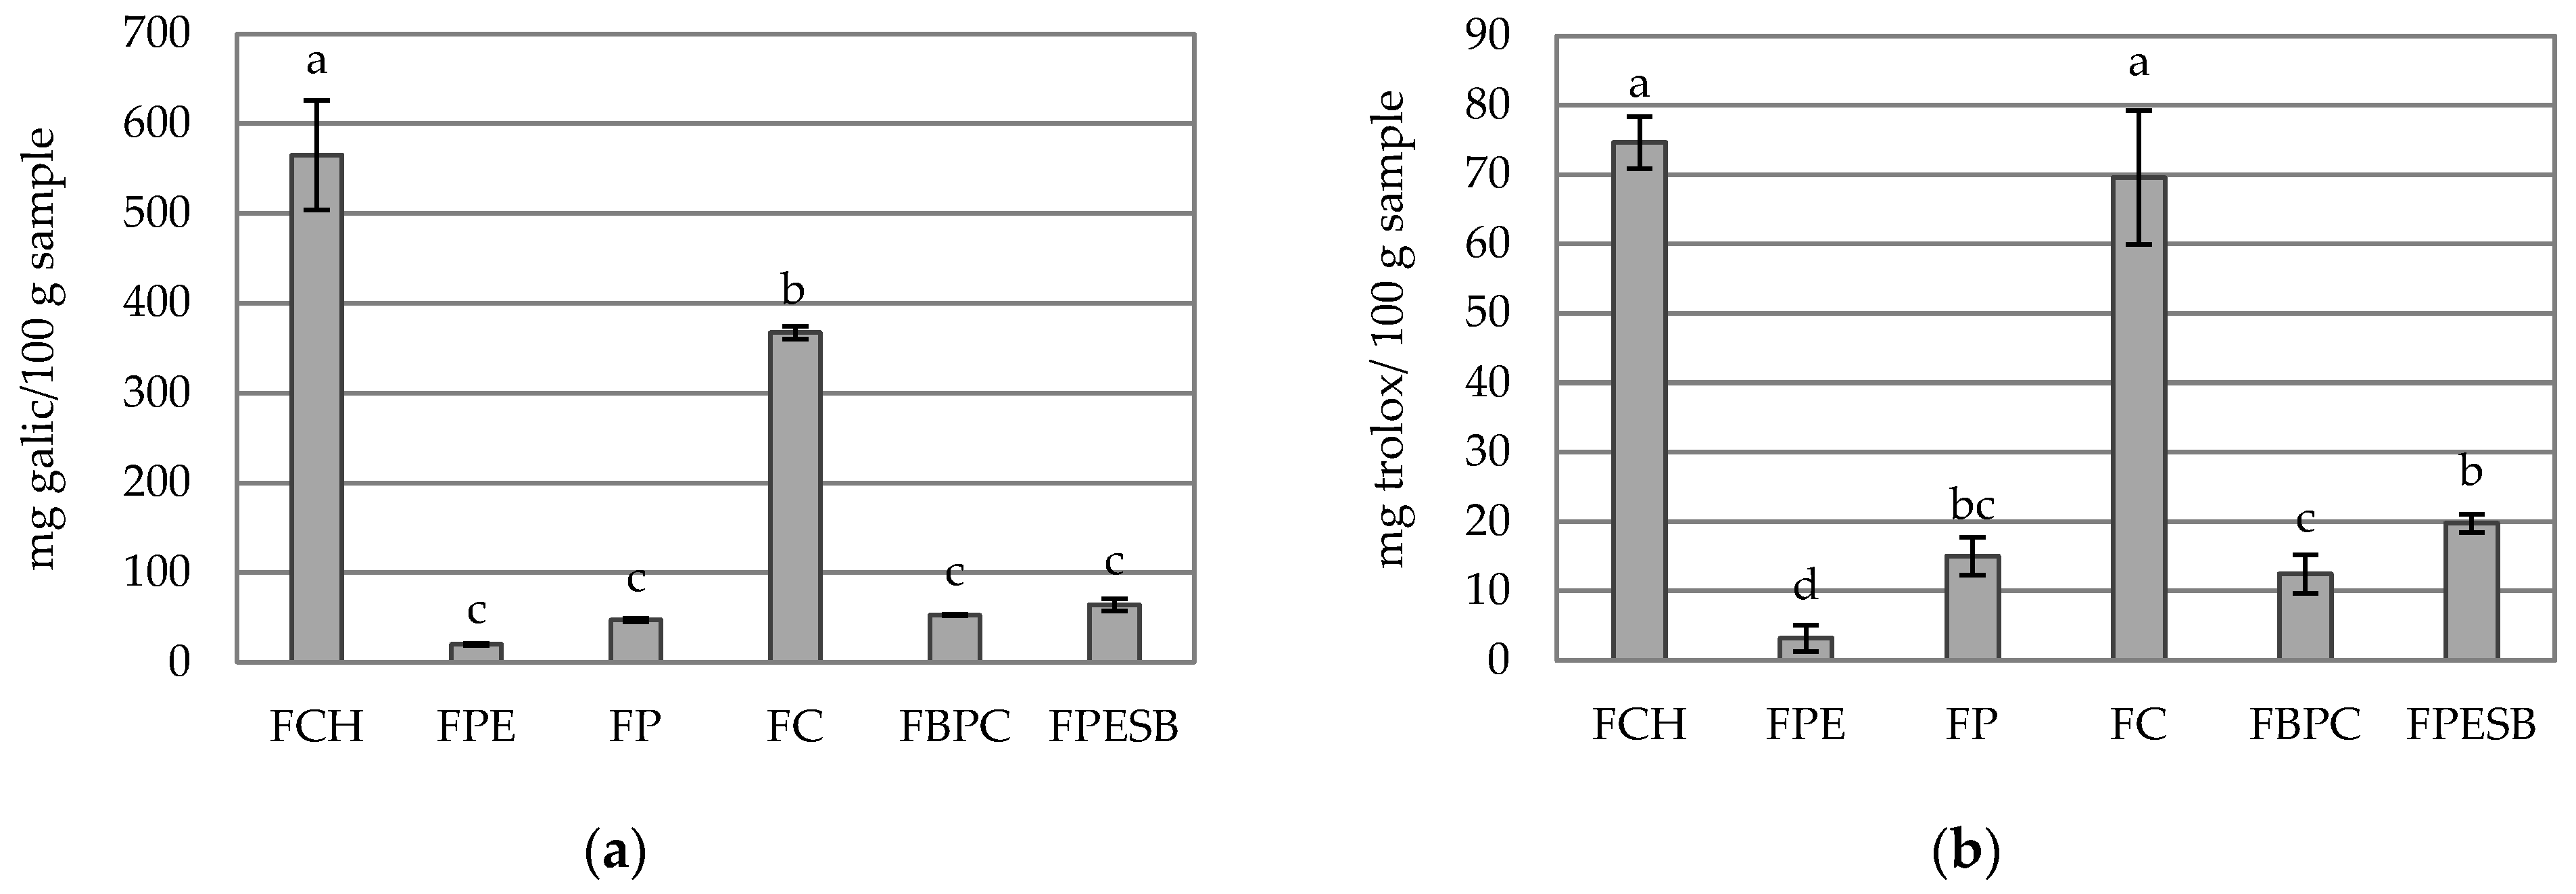
3.1. DF Analysis
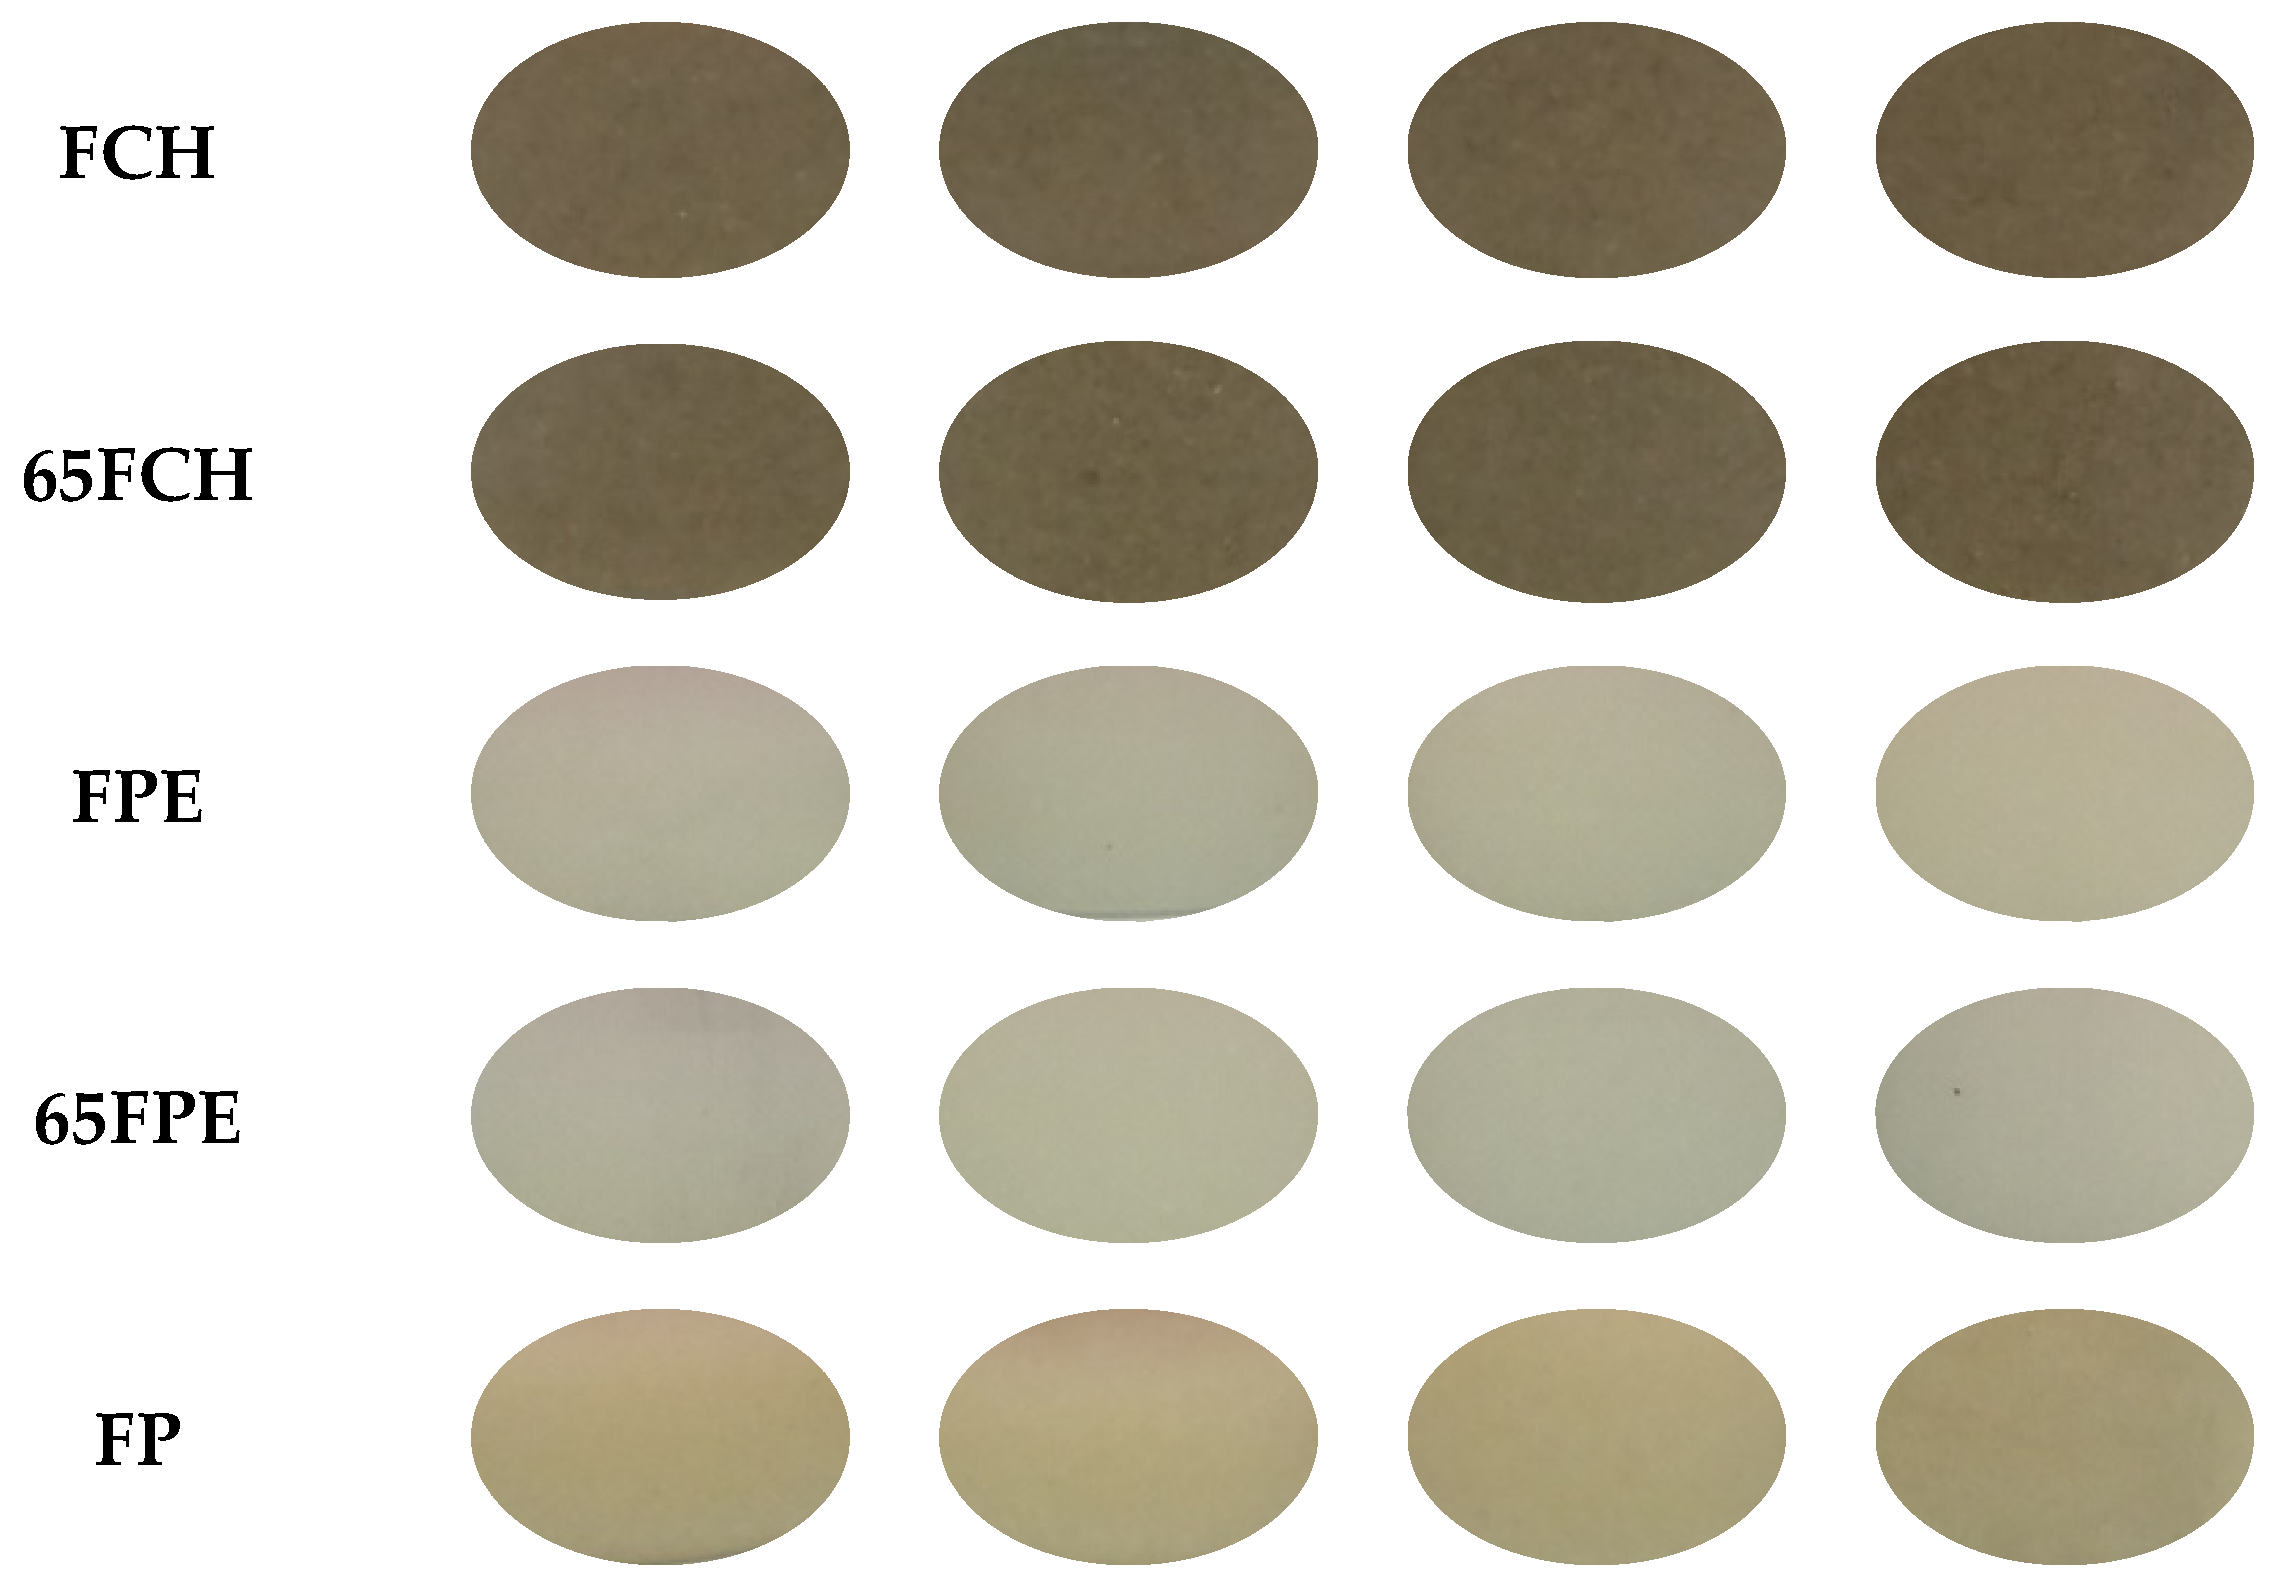
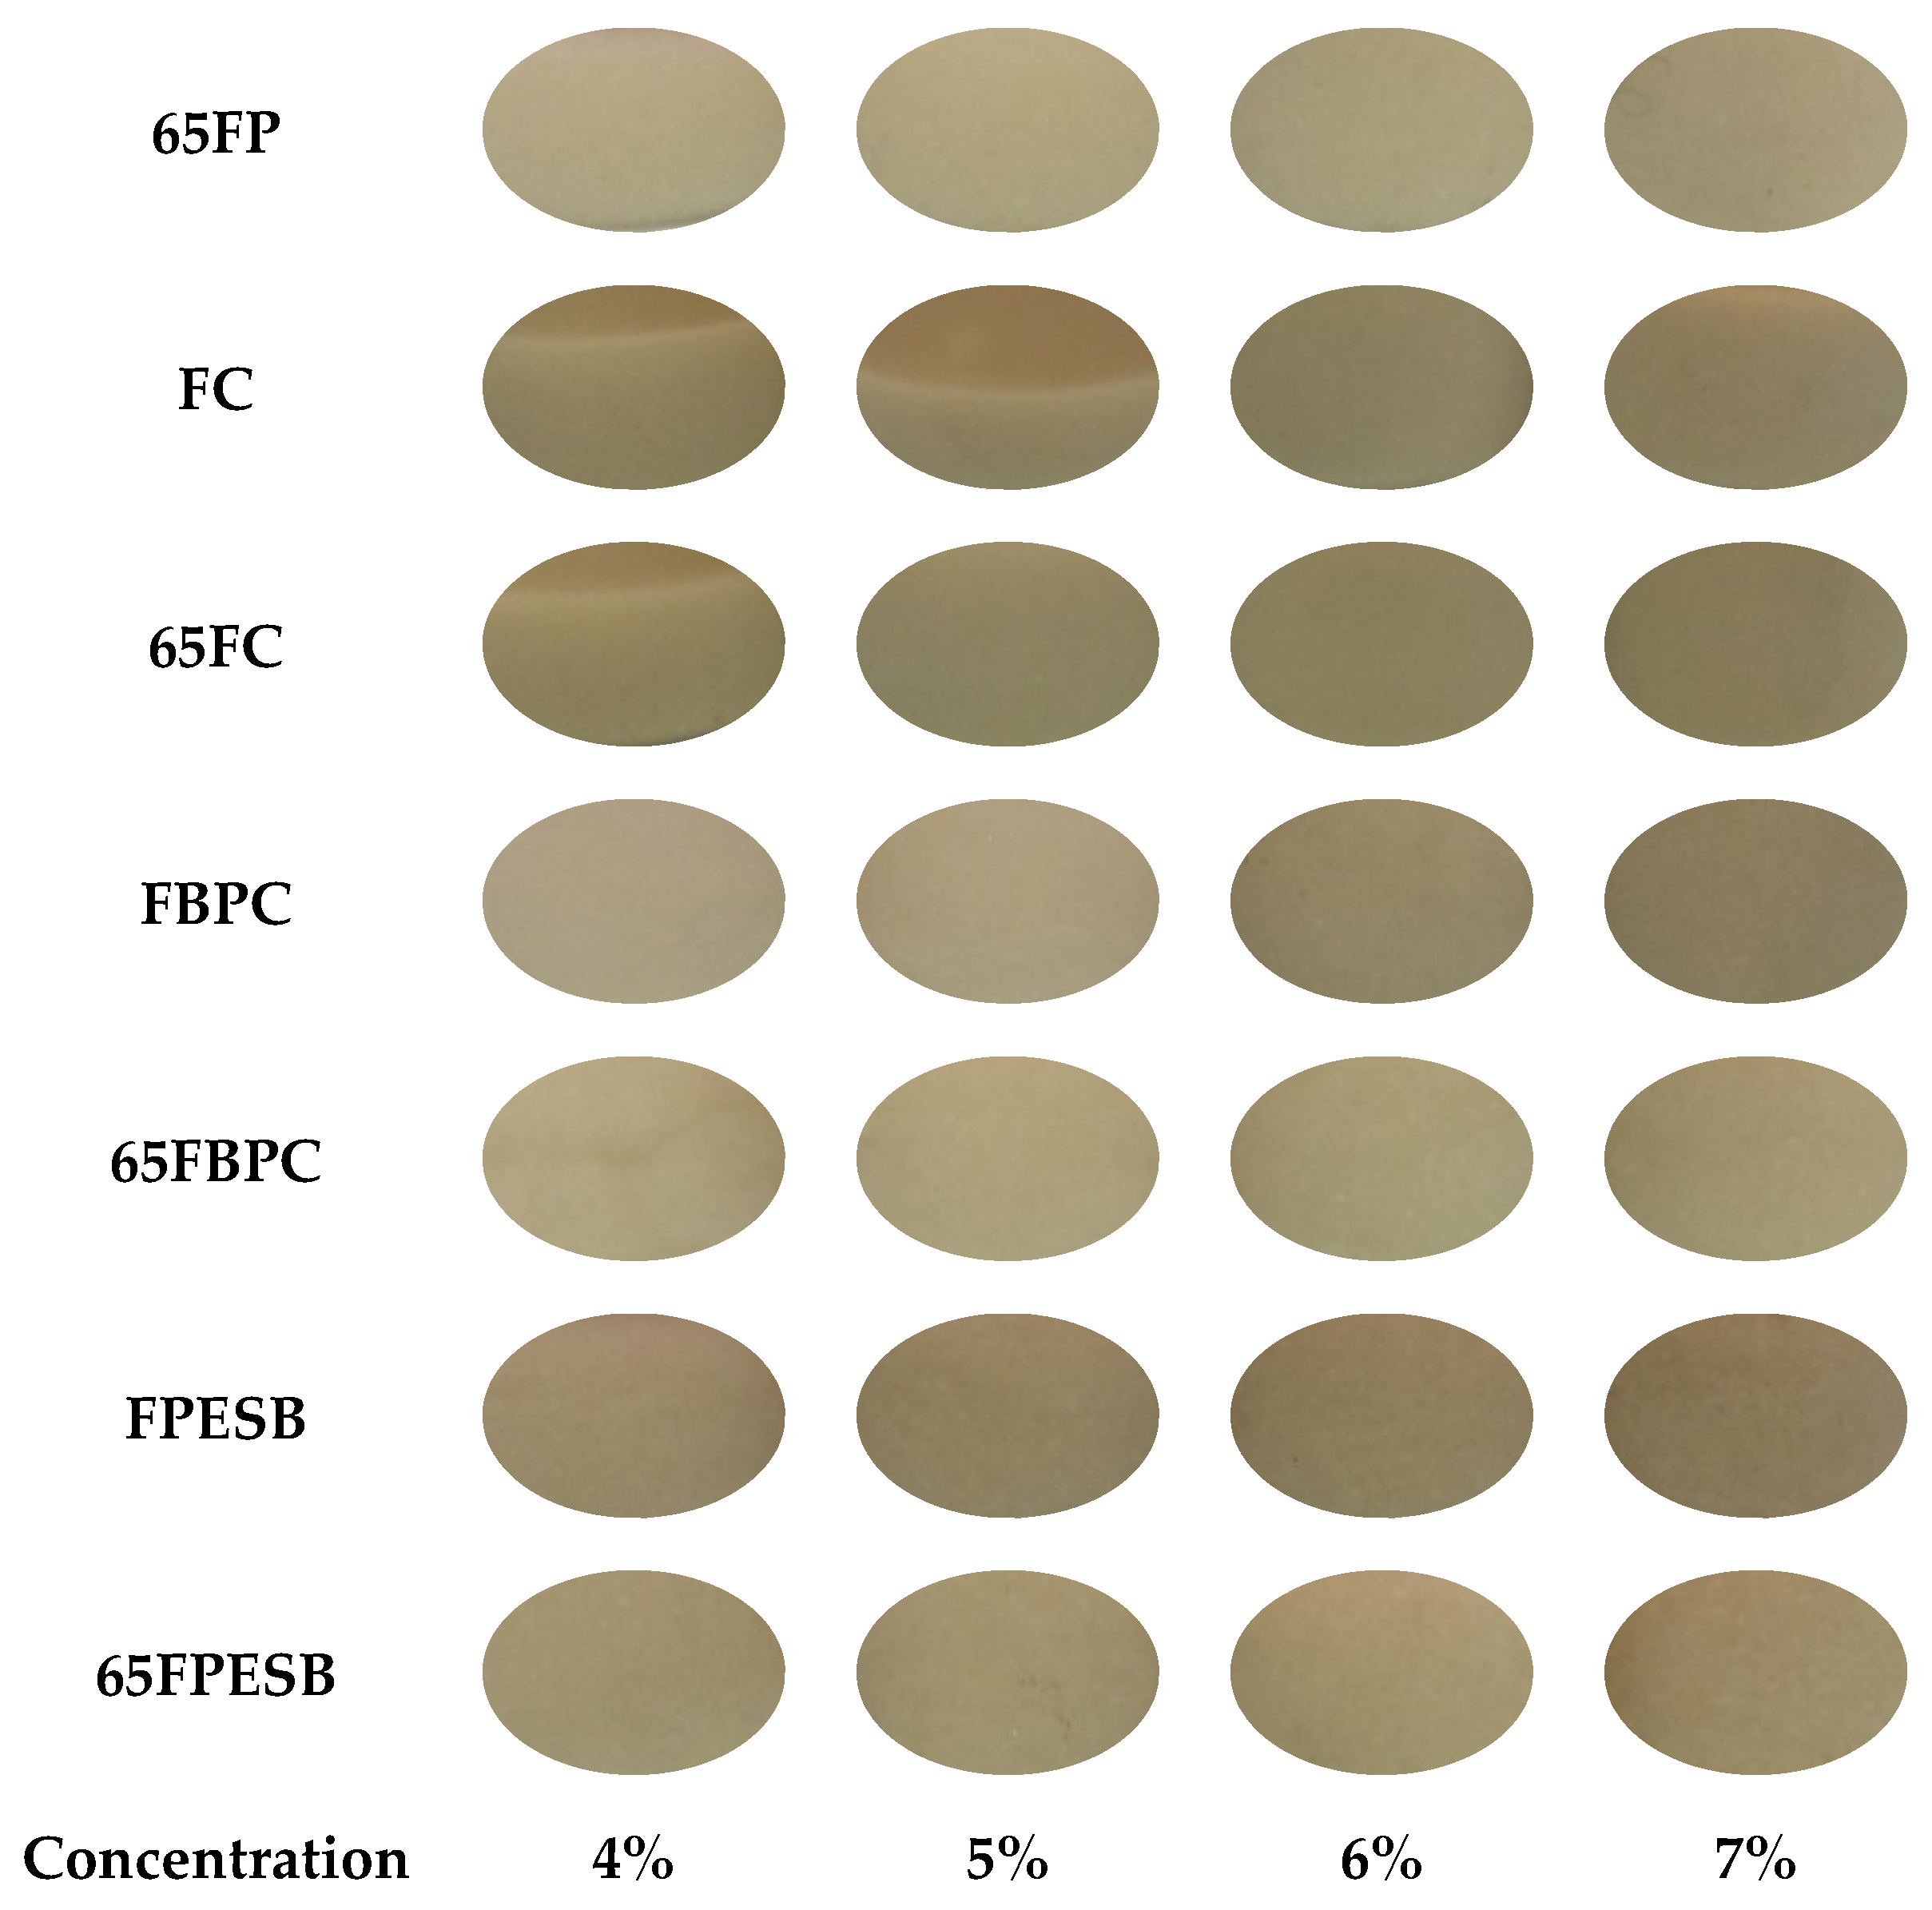
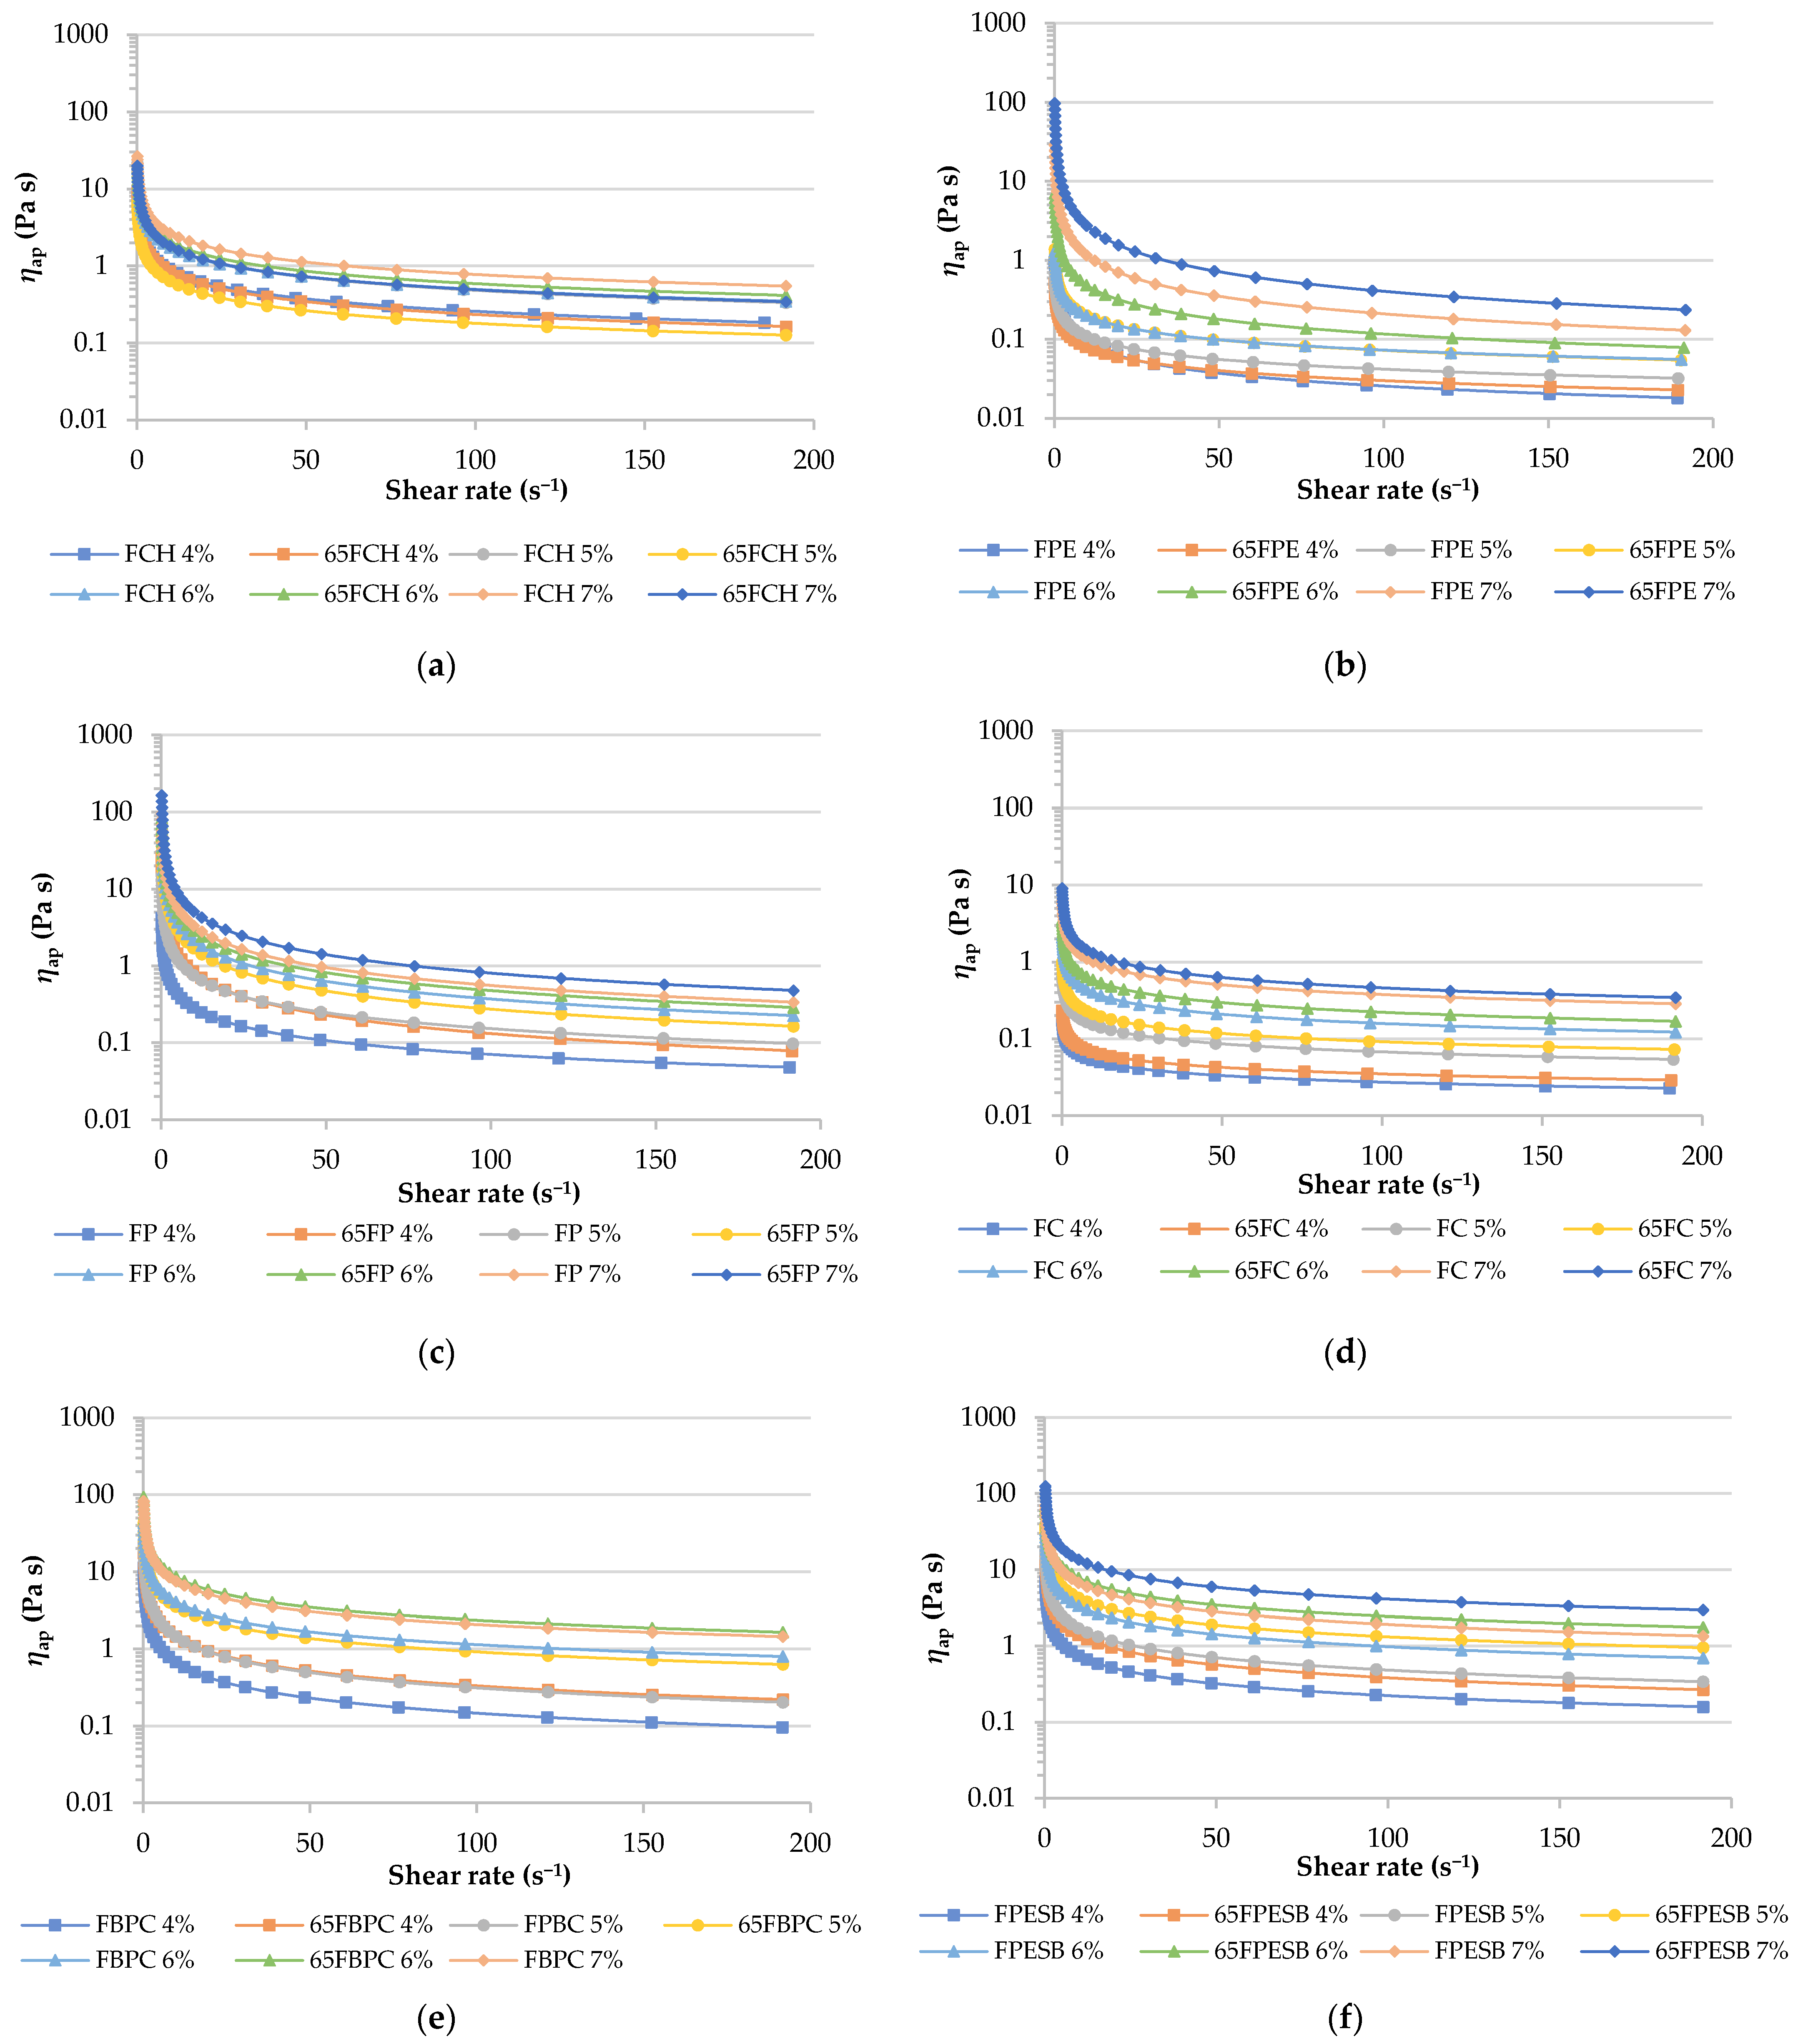
3.2. Gel Analysis
4. Conclusions
Author Contributions
Funding
Data Availability Statement
Acknowledgments
Conflicts of Interest
References
- Aschemann-Witzel, J.; Varela, P.; Peschel, A.O. Consumers’ categorization of food ingredients: Do consumers perceive them as ‘clean label’ producers expect? An exploration with projective mapping. Food Qual. Prefer. 2019, 71, 117–128. [Google Scholar] [CrossRef]
- Kyriakopoulou, K.; Keppler, J.; van der Goot, A. Functionality of Ingredients and Additives in Plant-Based Meat Analogues. Foods 2021, 10, 600. [Google Scholar] [CrossRef]
- Varela, P.; Fiszman, S. Exploring consumers’ knowledge and perceptions of hydrocolloids used as food additives and ingredients. Food Hydrocoll. 2013, 30, 477–484. [Google Scholar] [CrossRef]
- Li, J.-M.; Nie, S.-P. The functional and nutritional aspects of hydrocolloids in foods. Food Hydrocoll. 2016, 53, 46–61. [Google Scholar] [CrossRef]
- Mao, L.; Lu, Y.; Cui, M.; Miao, S.; Gao, Y. Design of gel structures in water and oil phases for improved delivery of bioactive food ingredients. Crit. Rev. Food Sci. Nutr. 2020, 60, 1651–1666. [Google Scholar] [CrossRef]
- Crizel, T.D.M.; Jablonski, A.; Rios, A.D.O.; Rech, R.; Flôres, S.H. Dietary fiber from orange byproducts as a potential fat replacer. LWT Food Sci. Technol. 2013, 53, 9–14. [Google Scholar] [CrossRef]
- Zhu, K.; Huang, S.; Peng, W.; Qian, H.; Zhou, H. Effect of ultrafine grinding on hydration and antioxidant properties of wheat bran dietary fibre. Food Res. Int. 2010, 43, 943–948. [Google Scholar] [CrossRef]
- Ma, M.-M.; Mu, T.-H. Effects of extraction methods and particle size distribution on the structural, physicochemical, and functional properties of dietary fiber from deoiled cumin. Food Chem. 2016, 194, 237–246. [Google Scholar] [CrossRef] [PubMed]
- Lu, W.; Nishinari, K.; Matsukawa, S.; Fang, Y. The future trends of food hydrocolloids. Food Hydrocoll. 2020, 103, 105713. [Google Scholar] [CrossRef]
- Cai, Y.Z.; Corke, H. Production and Properties of Spray-dried Amaranthus Betacyanin Pigments. J. Food Sci. 2000, 65, 1248–1252. [Google Scholar] [CrossRef]
- Bender, A.B.B.; Speroni, C.S.; Moro, K.I.B.; Morisso, F.D.P.; dos Santos, D.R.; da Silva, L.P.; Penna, N.G. Effects of micronization on dietary fiber composition, physicochemical properties, phenolic compounds, and antioxidant capacity of grape pomace and its dietary fiber concentrate. LWT 2020, 117, 108652. [Google Scholar] [CrossRef]
- Agudelo, C.; Igual, M.; Camacho, M.; Martínez-Navarrete, N.; Camacho, M.D.M. Effect of process technology on the nutritional, functional, and physical quality of grapefruit powder. Food Sci. Technol. Int. 2016, 23, 61–74. [Google Scholar] [CrossRef] [PubMed]
- Raghavendra, S.N.; Rastogi, N.K.; Raghavarao, K.S.M.S.; Tharanathan, R.N. Dietary fiber from coconut residue: Effects of different treatments and particle size on the hydration properties. Eur. Food Res. Technol. 2004, 218, 563–567. [Google Scholar] [CrossRef]
- Chantaro, P.; Devahastin, S.; Chiewchan, N. Production of antioxidant high dietary fiber powder from carrot peels. LWT 2008, 41, 1987–1994. [Google Scholar] [CrossRef]
- Navarro-González, I.; García-Valverde, V.; García-Alonso, J.; Periago, M.J. Chemical profile, functional and antioxidant properties of tomato peel fiber. Food Res. Int. 2011, 44, 1528–1535. [Google Scholar] [CrossRef]
- Mahdavi, S.A.; Jafari, S.M.; Assadpour, E.; Ghorbani, M. Storage stability of encapsulated barberry’s anthocyanin and its application in jelly formulation. J. Food Eng. 2016, 181, 59–66. [Google Scholar] [CrossRef]
- Igual, M.; García-Martínez, E.; Camacho, M.; Martínez-Navarrete, N.; Camacho, M.D.M. Stability of micronutrients and phytochemicals of grapefruit jam as affected by the obtention process. Food Sci. Technol. Int. 2015, 22, 203–212. [Google Scholar] [CrossRef] [PubMed]
- Horwith, W.; Latimer, G.W. AOAC International, 18th ed.; Biblioteca CEU: San Pablo, CA, USA, 2005. [Google Scholar]
- García-Segovia, P.; Igual, M.; Noguerol, A.T.; Martínez-Monzó, J. Use of insects and pea powder as alternative protein and mineral sources in extruded snacks. Eur. Food Res. Technol. 2020, 246, 703–712. [Google Scholar] [CrossRef]
- Cevoli, C.; Balestra, F.; Ragni, L.; Fabbri, A. Rheological characterisation of selected food hydrocolloids by traditional and simplified techniques. Food Hydrocoll. 2013, 33, 142–150. [Google Scholar] [CrossRef]
- Ribes, S.; Peña, N.; Fuentes, A.; Talens, P.; Barat, J.M. Chia (Salvia hispanica L.) seed mucilage as a fat replacer in yogurts: Effect on their nutritional, technological, and sensory properties. J. Dairy Sci. 2021, 104, 2822–2833. [Google Scholar] [CrossRef]
- Ağar, B.; Gençcelep, H.; Saricaoğlu, F.T.; Turhan, S. Effect of sugar beet fiber concentrations on rheological properties of meat emulsions and their correlation with texture profile analysis. Food Bioprod. Process. 2016, 100, 118–131. [Google Scholar] [CrossRef]
- Moghbeli, S.; Jafari, S.M.; Maghsoudlou, Y.; Dehnad, D. A Taguchi approach optimization of date powder production by spray drying with the aid of whey protein-pectin complexes. Powder Technol. 2020, 359, 85–93. [Google Scholar] [CrossRef]
- Huber, E.; Francio, D.L.; Biasi, V.; Mezzomo, N.; Ferreira, S.R.S. Characterization of vegetable fiber and its use in chicken burger formulation. J. Food Sci. Technol. 2016, 53, 3043–3052. [Google Scholar] [CrossRef] [PubMed]
- Rosell, C.M.; Santos, E.; Collar, C. Physico-chemical properties of commercial fibres from different sources: A comparative approach. Food Res. Int. 2009, 42, 176–184. [Google Scholar] [CrossRef]
- Guillon, F.; Champ, M. Structural and physical properties of dietary fibres, and consequences of processing on human physiology. Food Res. Int. 2000, 33, 233–245. [Google Scholar] [CrossRef]
- Kaack, K.; Pedersen, L.; Laerke, H.N.; Meyer, A. New potato fibre for improvement of texture and colour of wheat bread. Eur. Food Res. Technol. 2006, 224, 199–207. [Google Scholar] [CrossRef]
- Wang, L.; Xu, H.; Yuan, F.; Pan, Q.; Fan, R.; Gao, Y. Physicochemical characterization of five types of citrus dietary fibers. Biocatal. Agric. Biotechnol. 2015, 4, 250–258. [Google Scholar] [CrossRef]
- Mancebo, C.M.; Rodríguez, P.; Martínez, M.M.; Gómez, M. Effect of the addition of soluble (nutriose, inulin and polydextrose) and insoluble (bamboo, potato and pea) fibres on the quality of sugar-snap cookies. Int. J. Food Sci. Technol. 2018, 53, 129–136. [Google Scholar] [CrossRef]
- Belorio, M.; Marcondes, G.; Gómez, M. Influence of psyllium versus xanthan gum in starch properties. Food Hydrocoll. 2020, 105, 105843. [Google Scholar] [CrossRef]
- Lan, G.; Chen, H.; Chen, S.; Tian, J. Chemical composition and physicochemical properties of dietary fiber from Polygonatum odoratum as affected by different processing methods. Food Res. Int. 2012, 49, 406–410. [Google Scholar] [CrossRef]
- Alfredo, V.-O.; Gabriel, R.-R.; Luis, C.-G.; David, B.-A. Physicochemical properties of a fibrous fraction from chia (Salvia hispanica L.). LWT 2009, 42, 168–173. [Google Scholar] [CrossRef]
- Grigelmo-Miguel, N.; Martín-Belloso, O. Comparison of Dietary Fibre from By-products of Processing Fruits and Greens and from Cereals. LWT 1999, 32, 503–508. [Google Scholar] [CrossRef]
- Elleuch, M.; Bedigian, D.; Roiseux, O.; Besbes, S.; Blecker, C.; Attia, H. Dietary fibre and fibre-rich by-products of food processing: Characterisation, technological functionality and commercial applications: A review. Food Chem. 2011, 124, 411–421. [Google Scholar] [CrossRef]
- Tejada-Ortigoza, V.; Garcia-Amezquita, L.E.; Serna-Saldívar, S.O.; Welti-Chanes, J. Advances in the Functional Characterization and Extraction Processes of Dietary Fiber. Food Eng. Rev. 2016, 8, 251–271. [Google Scholar] [CrossRef]
- Silva-Espinoza, M.A.; Camacho, M.D.M.; Martínez-Navarrete, N. Effect of storage temperature on the crispness, colour and bioactive compounds of an orange snack obtained by freeze-drying. Br. Food J. 2021, in press. [Google Scholar] [CrossRef]
- Xie, F.; Zhang, W.; Lan, X.; Gong, S.; Wu, J.; Wang, Z. Physicochemical properties and structural characteristics of soluble dietary fibers from yellow and purple fleshed potatoes by-product. Int. J. Food Prop. 2017, 20, S2939–S2949. [Google Scholar] [CrossRef]
- Igual, M.; Ramires, S.; Mosquera, L.; Martínez-Navarrete, N. Optimization of spray drying conditions for lulo (Solanum quitoense L.) pulp. Powder Technol. 2014, 256, 233–238. [Google Scholar] [CrossRef]
- Igual, M.; Cebadera, L.; Cámara, R.M.; Agudelo, C.; Martínez-Navarrete, N.; Cámara, M. Novel Ingredients Based on Grapefruit Freeze-Dried Formulations: Nutritional and Bioactive Value. Foods 2019, 8, 506. [Google Scholar] [CrossRef]
- Chong, R.W.W.; Ball, M.; McRae, C.; Packer, N.H. Comparing the chemical composition of dietary fibres prepared from sugarcane, psyllium husk and wheat dextrin. Food Chem. 2019, 298, 125032. [Google Scholar] [CrossRef]
- Llorent-Martínez, E.; Córdova, M.F.-D.; Ortega-Barrales, P.; Ruiz-Medina, A. Characterization and comparison of the chemical composition of exotic superfoods. Microchem. J. 2013, 110, 444–451. [Google Scholar] [CrossRef]
- Rousseau, S.; Kyomugasho, C.; Celus, M.; Hendrickx, M.E.G.; Grauwet, T. Barriers impairing mineral bioaccessibility and bioavailability in plant-based foods and the perspectives for food processing. Crit. Rev. Food Sci. Nutr. 2019, 60, 826–843. [Google Scholar] [CrossRef]
- Baye, K.; Guyot, J.-P.; Mouquet-Rivier, C. The unresolved role of dietary fibers on mineral absorption. Crit. Rev. Food Sci. Nutr. 2016, 57, 949–957. [Google Scholar] [CrossRef] [PubMed]
- Wang, Y.; Sun, P.; Li, H.; Adhikari, B.P.; Li, N. Rheological Behavior of Tomato Fiber Suspensions Produced by High Shear and High Pressure Homogenization and Their Application in Tomato Products. Int. J. Anal. Chem. 2018, 2018, 1–12. [Google Scholar] [CrossRef] [PubMed]
- Bodart, M.; De Peñaranda, R.; Deneyer, A.; Flamant, G. Photometry and colorimetry characterisation of materials in daylighting evaluation tools. Build. Environ. 2008, 43, 2046–2058. [Google Scholar] [CrossRef]
- Angioloni, A.; Collar, C. Small and large deformation viscoelastic behaviour of selected fibre blends with gelling properties. Food Hydrocoll. 2009, 23, 742–748. [Google Scholar] [CrossRef]
- Igual, M.; García-Martínez, E.; Camacho, M.D.M.; Martínez-Navarrete, N. Physicochemical and Sensorial Properties of Grapefruit Jams as Affected by Processing. Food Bioprocess Technol. 2011, 6, 177–185. [Google Scholar] [CrossRef]
- Igual, M.; Contreras, C.; Martínez-Navarrete, N. Colour and rheological properties of non-conventional grapefruit jams: Instrumental and sensory measurement. LWT 2014, 56, 200–206. [Google Scholar] [CrossRef]
- Su, D.; Zhu, X.; Adhikari, B.; Li, D.; Wang, L. Effect of high-pressure homogenization on the rheology, microstructure and fractal dimension of citrus fiber-oil dispersions. J. Food Eng. 2020, 277, 109899. [Google Scholar] [CrossRef]
- Aguayo-Mendoza, M.G.; Ketel, E.C.; van der Linden, E.; Forde, C.G.; Piqueras-Fiszman, B.; Stieger, M. Oral processing behavior of drinkable, spoonable and chewable foods is primarily determined by rheological and mechanical food properties. Food Qual. Prefer. 2019, 71, 87–95. [Google Scholar] [CrossRef]
- Domingo, C.S.; Rojas, A.M.; Fissore, E.N.; Gerschenson, L.N. Rheological behavior of soluble dietary fiber fractions isolated from artichoke residues. Eur. Food Res. Technol. 2019, 245, 1239–1249. [Google Scholar] [CrossRef]
- Agarwal, D.; Hewson, L.; Foster, T.J. A comparison of the sensory and rheological properties of different cellulosic fibres for food. Food Funct. 2017, 9, 1144–1151. [Google Scholar] [CrossRef] [PubMed]
- Sharma, M.; Kristo, E.; Corredig, M.; Duizer, L. Effect of hydrocolloid type on texture of pureed carrots: Rheological and sensory measures. Food Hydrocoll. 2017, 63, 478–487. [Google Scholar] [CrossRef]
- Velasco, V.A. Análisis de las propiedades de textura durante el almacenamiento de salchichas elaboradas a partir de tilapia roja (oreochromis sp.). Biotecnol. Sector Agropecu. Agroind. 2010, 8, 46–56. [Google Scholar]
- Torres, M.D.; Chenlo, F.; Moreira, R. Rheological Effect of Gelatinisation Using Different Temperature-Time Conditions on Potato Starch Dispersions: Mechanical Characterisation of the Obtained Gels. Food Bioprocess Technol. 2017, 11, 132–140. [Google Scholar] [CrossRef]


| Sample | Name | Ingredients | Proteins | Lipids | Carbohydrates | TDF | IDF | SDF |
|---|---|---|---|---|---|---|---|---|
| FCH | Chia Flour | Salvia hispanica Seed Powder | 30.95 | 12 | 49.04 | 45.5 | 43.1 | 3.5 |
| FPE | Pea Fiber | Yellow pea fiber | 5.19 | 0.3 | 93.41 | 43.8 | 36.7 | 7.1 |
| FP | Potato Fiber | Synergetic combination of potato pure fiber | 2.17 | 3.1 | 92.37 | >60.0 | >60.0 | <1.0 |
| FC | Citrus Fiber | Citrus Fiber | 5.89 | 1.02 | 81.34 | 71.1 | 37.6 | 33.3 |
| FBPC | Bamboo, Psyllium and Citric Fiber | Combination of bamboo, psyllium and citric fibers | 0.613 | 0.5 | 98.287 | 45.6 | 42.1 | 3.5 |
| FPESB | Pea, cane Sugar and Bamboo Fiber | Vegetable fibers: pea, cane sugar and bamboo | 4.7 | 0.9 | 92.11 | >60.0 | >60.0 | <1.0 |
| Vegetable Fiber Samples | ||||||
|---|---|---|---|---|---|---|
| FCH | FPE | FP | FC | FBPC | FPESB | |
| xw | 3.47 ± 0.06 d | 6.62 ± 0.03 a | 6.13 ± 0.12 b | 2.686 ± 0.118 e | 6.676 ± 0.104 a | 5.7 ± 0.3 c |
| aw | 0.372 ± 0.003 c | 0.5200 ± 0.0012 a | 0.4857 ± 0.0012 b | 0.1230 ± 0.0012 f | 0.3590 ± 0.0012 d | 0.342 ± 0.002 e |
| pH | 6.063 ± 0.015 a | 5.25 ± 0.06 d | 4.65 ± 0.04 e | 4.06 ± 0.02 f | 5.45 ± 0.02 c | 5.6633 ± 0.0115 b |
| Hg | 13.9 ± 0.3 d | 19.1 ± 0.6 c | 19.2 ± 0.8 c | 29.3 ± 0.3 a | 26.7 ± 0.7 b | 27.3 ± 0.2 b |
| ρb | 424 ± 30 b | 348 ± 19 c | 211 ± 8 d | 410 ± 27 b | 489 ± 17 a | 354 ± 10 c |
| ε | 70.7 ± 1.3 d | 76.9 ± 0.5 b | 86.63 ± 0.16 a | 73.22 ± 0.15 c | 69.22 ± 0.95 d | 77.51 ± 0.12 b |
| D [4, 3] | 126.9 ± 1.3 e | 249 ± 14 a | 184 ± 4 b | 71.8 ± 0.6 f | 142.6 ± 0.3 d | 156 ± 2 c |
| d (0.1) | 23.0 ± 0.3 d | 99 ± 3 a | 36 ± 4 b | 11.92 ± 0.07 e | 36.1 ± 0.3 b | 33.0 ± 0.4 c |
| d (0.5) | 104.3 ± 0.7 e | 224 ± 12 a | 155 ± 3 b | 60.2 ± 0.4 f | 124.4 ± 0.3 d | 132.9 ± 1.3 c |
| d (0.9) | 263 ± 3 d | 438 ± 29 a | 375 ± 6 b | 150 ± 2 e | 276.2 ± 0.9 d | 313 ± 6 c |
| Vegetable Fiber Samples | ||||||
|---|---|---|---|---|---|---|
| FCH | FPE | FP | FC | FBPC | FPESB | |
| Ash (%) | 8.01 ± 0.04 a | 1.1 ± 0.2 d | 2.36 ± 0.03 c | 2.9 ± 0.5 b | 0.60 ± 0.03 e | 2.29 ± 0.04 c |
| Total minerals | 2460 ± 22 a | 453 ± 79 d | 510 ± 42 d | 1227 ± 34 b | 316 ± 18 e | 746 ± 29 c |
| P | 582 ± 33 a | 29 ± 10 c | 26 ± 2 c | 60 ± 5 b | 7.9 ± 0.7 c | 32.9 ± 1.4 c |
| K | 639 ± 6 a | 42 ± 8 f | 101 ± 10 e | 241 ± 16 b | 167 ± 14 c | 141 ± 7 d |
| Ca | 672 ± 25 b | 71 ± 24 e | 181 ± 13 d | 784 ± 26 a | 96 ± 3 e | 340 ± 16 c |
| Na | 170 ± 12 b | 275 ± 39 a | 116 ± 12 c | 73 ± 2 d | 40 ± 4 e | 60 ± 3 d,e |
| Mg | 380 ± 23 a | 33 ± 12 d | 81 ± 7 c | 66 ± 5 c | 3.706 ± 1.002 e | 107 ± 4 b |
| Zn | 6.4 ± 0.9 a | 0.6 ± 0.3 b | 0,22 ± 0.05 b | - b | - b | 0.58 ± 0.03 b |
| Fe | 6.4 ± 0.6 a | 1.6 ± 0.9 c | 4.7 ± 0.3 b | 2.1 ± 0.2 c | 1.6 ± 0.3 c | 4.2 ± 0.5 b |
| Mn | 2.74 ± 0.14 a | - c | - c | - c | - c | 0.75 ± 0.06 b |
| Cu | 1.29 ± 0.07 a | - b | - b | - b | - b | - b |
| Se | - d | 0.046 ± 0.003 b | 0.0278 ± 0.0009 c | 0.058 ± 0.013 a | - d | - d |
| Sample | C | xw | pH | L* | a* | b* | ∆E |
|---|---|---|---|---|---|---|---|
| FCH | 4 | 96.35 ± 0.04 a,b,A | 6.44 ± 0.02 a,C,D | 26.0 ± 0.2 k,C | 2.51 ± 0.09 d,D | 9.5 ± 0.7 d,E | |
| 5 | 95.48 ± 0.03 d,B | 6.38 ± 0.13 b,c,E,F | 27.3 ± 0.3 h,i,j,B | 3.07 ± 0.06 c,C | 11.2 ± 0.4 b,C,D | ||
| 6 | 95.37 ± 0.04 d,B | 6.41 ± 0.05 b,D,E | 29.4 ± 0.5 g,A | 3.58 ± 0.14 a,A | 12.0 ± 0.6 a,B,C | ||
| 7 | 93.52 ± 1.06 f,C | 6.4 ± 0.2 c,F | 29.0 ± 0.5 g,A | 3.19 ± 0.13 b,C | 11.12 ± 0.12 b,C,D | ||
| 65FCH | 4 | 96.21 ± 0.09 y,x,A | 6.56 ± 0.02 z,A | 26.6 ± 0.4 r,B,C | 2.66 ± 0.12 w,D | 10.7 ± 0.6 y,D | 1.4 (0.7) e,f,g,h |
| 5 | 95.519 ± 0.116 v,u,B | 6.50 ± 0.19 y,B | 28.8 ± 1.5 s,A | 3.7 ± 0.4 z,A | 13.1100 ± 1.0012 z,A | 1.7 (0.9) d,e,f,g | |
| 6 | 94.94 ± 0.16 s,r,q,B | 6.452 ± 0.009 x,C | 29.2 ± 0.6 t,s,A | 3.51 ± 0.19 y,A,B | 12.8 ± 0.8 z,A,B | 1.3 (0.2) e,f,g,h,i | |
| 7 | 95.26 ± 0.06 u,t,s,B | 6.4 ± 0.3 x,C,D | 29.1 ± 0.5 t,s,A | 3.25 ± 0.19 x,B,C | 11.2 ± 0.9 y,C,D | 1.0 (0.4) f,g,h,i,j | |
| FPE | 4 | 96.7 ± 0.3 a,A | 5.88 ± 0.03 g,A | 33.2 ± 0.6 e,D | 0.10 ± 0.03 l,D | 2.1 ± 0.3 m,C | |
| 5 | 96.1 ± 0.3 b,c,B | 5.76 ± 0.13 h,B | 39.1 ± 0.3 c,B | 0.14 ± 0.03 l,D | 3.186 ± 0.113 j,k,A | ||
| 6 | 95.57 ± 0.07 d,C | 5.64 ± 0.06 i,C | 35.5 ± 1.9 d,C | 0.11 ± 0.04 l,D | 2.6 ± 0.5 l,B | ||
| 7 | 94.4 ± 0.5 e,D | 5.482 ± 0.108 j,D | 41.31 ± 1.05 a,b,A | 0.16 ± 0.05 l,C | 3.4 ± 0.2 j,A | ||
| 65FPE | 4 | 96.77 ± 0.13 z,A | 5.85 ± 0.04 s,A | 33.1 ± 1.7 v,D | −0.060 ± 0.012 p,o,B,C | 0.65 ± 0.08 n,D | 2.1 (0.5) b,c,d,e |
| 5 | 96.3845 ± 0.1103 z,y,A,B | 5.61 ± 0.09 p,C | 34.6 ± 0.7 w,v,C,D | −0.052 ± 0.009 p,o,A,B | 0.74 ± 0.04 n,D | 5.5 (0.4) a | |
| 6 | 96.0 ± 0.4 x,w,B,C | 5.49 ± 0.06 o,D | 30.7± 1.3 u,E | −0.08 ± 0.03 o,B | 0.63 ± 0.08 n,D | 6.5 (0.4) a | |
| 7 | 94.686 ± 0.112 q,p,o,D | 5.448 ± 0.118 n,D | 39 ± 2 y,x,B | 0.05 ± 0.03 q,p,o,A | 2.3 ± 0.4 p,B,C | 3.7 (0.7) b,c | |
| FP | 4 | 96.3 ± 0.2 a,b,A | 5.04 ± 0.05 k,A | 28.12 ± 1.18 h,E | 0.514 ± 0.102 j,C | 4.4 ± 0.4 i,D | |
| 5 | 95.39 ± 0.14 d,B | 4.944 ± 0.018 l,C | 33.9 ± 0.9 e,D | 0.912 ± 0.109 f,A,B | 7.6 ± 0.2 f,B | ||
| 6 | 94.9 ± 0.4 e,B,C | 4.91 ± 0.03 l,D | 38.35 ± 1.08 c,C | 0.87 ± 0.12 f,g,h,A,B | 7.9 ± 0.6 f,A,B | ||
| 7 | 94.6 ± 0.3 e,C | 4.9 ± 0.9 m,E | 41.6 ± 0.6 a,A | 1.08 ± 0.16 e,A | 8.7 ± 0.7 e,A | ||
| 65FP | 4 | 96.5 ± 0.8 z,y,A | 5.00 ± 0.03 m,B | 30.25 ± 1.06 u,t,E | 0.6 ± 0.3 t,s,C | 6.0 ± 0.9 t,C | 2.9 (0.5) b |
| 5 | 95.36 ± 0.09 v,u,t,B | 4.930 ± 0.014 l,C,D | 33 ± 2 v,D | 0.5 ± 0.2 s,C | 6.1 ± 0.6 t,C | 1.6 (0.6) c,d,e,f | |
| 6 | 94.86 ± 0.15 r,q,p,B,C | 4.882 ± 0.013 k,E | 38 ± 2 x,C | 0.7 ± 0.2 u,t,s,B,C | 7.6 ± 0.9 v,u,B | 1.3 (0.9) e,f,g,h,i | |
| 7 | 94.2 ± 0.6 n,m,C | 4.9 ± 0.9 j,E | 39.5 ± 1.6 y,B | 0.7 ± 0.2 v,u,t,B,C | 8.1 ± 0.9 v,A,B | 2.8 (0.9) b | |
| FC | 4 | 96.40 ± 0.06 a,b,A | 4.26 ± 0.02 n,A | 35.31 ± 0.13 d,G | −0.12 ± 0.06 m,F | 7.49 ± 0.16 f,G | |
| 5 | 95.52 ± 0.04 d,B | 4.184 ± 0.009 o,D | 38.85 ± 0.12 c,E | 0.32 ± 0.03 k,D | 9.62 ± 0.19 d,E | ||
| 6 | 94.50 ± 0.05 e,D | 4.180 ± 0.009 o,D | 40.5 ± 0.2 b,C | 0.41 ± 0.07 j,k,C | 10.7 ± 0.3 c,C | ||
| 7 | 93.80 ± 0.03 f,E | 4.14 ± 1.04 p,E | 42.1 ± 0.4 a,A | 0.79 ± 0.07 h,A | 12.09 ± 0.19 a,A | ||
| 65FC | 4 | 96.32 ± 0.17 y,x,A | 4.226 ± 0.015 i,B | 35.2 ± 0.3 w,G | −0.06 ± 0.02 p,o,F | 7.20 ± 0.14 u,H | 0.43 (0.15) i,j |
| 5 | 95.09 ± 0.06 t,s,r,C | 4.200 ± 0.002 i,h,C | 38.2 ± 0.4 y,x,F | 0.1940 ± 0.1108 r,q,E | 9.0380 ± 0.1114 w,F | 0.9 (0.4) g,h,i,j | |
| 6 | 94.50 ± 0.03 p,o,n,D | 4.180 ± 0.007 h,g,D | 39.4 ± 0.4 y,D | 0.54 ± 0.03 s,B | 9.9 ± 0.4 x,D | 1.4 (0.5) e,f,g,h | |
| 7 | 93.72 ± 0.03 l,E | 4.15 ± 1.05 g,E | 41.06 ± 0.13 z,B | 0.74 ± 0.06 v,u,t,A | 11.28 ± 0.09 y,B | 1.3 (0.4) e,f,g,h,i | |
| FBPC | 4 | 96.50 ± 0.08 a,b,A | 6.09 ± 0.06 d,A | 17.0 ± 0.2 n,G | −0.21 ± 0.03 n,D | 0.43 ± 0.08 n,G | |
| 5 | 95.63 ± 0.03 c,d,B | 5.98 ± 0.02 e,C | 20.3 ± 0.4 m,F | −0.118 ± 0.009 m,n,C | 0.77 ± 0.12 n,F | ||
| 6 | 94.68 ± 0.03 e,D | 5.99 ± 0.07 e,C | 26.7 ± 0.5 j,k,B | 0.10 ± 0.05 l,B | 2.78 ± 0.13 k,l,C | ||
| 7 | 93.72 ± 0.05 f,F | 5.9 ± 0.5 g,D | 28.0 ± 0.4 h,i,A | 0.19 ± 0.03 l,A | 3.43 ± 0.15 j,A | ||
| 65FBPC | 4 | 96.44 ± 0.06 z,y,A | 6.05 ± 0.05 w,B | 21.51 ± 1.18 o,E | −0.11 ± 0.04 o,C | 1.6 ± 0.4 o,E | 5.6 (0.3) a |
| 5 | 95.46 ± 0.09 v,u,t,C | 5.97 ± 0.02 v,C | 23.0 ± 0.7 p,D | −0.08 ± 0.07 p,o,C | 2.2 ± 0.3 p,o,D | 3.1 (0.8) b | |
| 6 | 94.47 ± 0.05 o,n,E | 5.97 ± 0.06 v,C | 25.3 ± 0.2 q,C | 0.06 ± 0.02 q,p,o,B | 3.14 ± 0.18 q,B | 1.5 (0.6) d,e,f,g | |
| 7 | 93.78 ± 0.16 l,F | 5.9 ± 0.5 u,D | 28.1 ± 0.3 s,A | 0.1060 ± 0.0114 q,p,B | 3.53 ± 0.13 q,A | 0.4 (0.3) j | |
| FPESB | 4 | 96.15 ± 0.06 b,A | 5.93 ± 0.02 f,A | 22.1 ± 0.8 l,E | 0.45 ± 0.04 j,E | 3.23 ± 0.08 j,D | |
| 5 | 95.51 ± 0.09 d,C | 5.76 ± 0.02 h,C | 27.2 ± 0.4 i,j,D | 0.67 ± 0.07 i,C | 4.6 ± 0.3 h,i,C | ||
| 6 | 94.77 ± 0.13 e,D | 5.67 ± 0.02 i,E | 29.2 ± 0.5 g,C | 0.81 ± 0.09 g,h,B | 5.0 ± 0.3 g,h,B | ||
| 7 | 93.93 ± 0.06 f,E | 5.65 ± 0.02 i,E | 30.6 ± 0.2 f,B | 0.89 ± 0.03 f,g,A | 5.2 ± 0.3 g,B | ||
| 65FPESB | 4 | 96.23 ± 0.09 y,x,A | 5.93 ± 0.03 v,A | 20.2 ± 0.7 o,F | 0.33 ± 0.05 r,F | 2.5 ± 0.3 p,E | 2.5 (0.9) b,c,d |
| 5 | 95.69 ± 0.07 w,v,B | 5.85 ± 0.04 u,t,B | 26.7 ± 0.4 r,D | 0.60 ± 0.03 t,s,D | 4.28 ± 0.07 r,C | 0.4 (0.2) i,j | |
| 6 | 94.63 ± 0.09 q,p,o,n,D | 5.77 ± 0.02 r,C | 29.1 ± 0.4 t,s,C | 0.81 ± 0.05 v,u,B | 5.0 ± 0.2 s,B | 0.71 (0.15) h,i,j | |
| 7 | 93.95 ± 0.16 m,l,E | 5.72 ± 0.02 q,D | 31.6 ± 0.5 u,A | 0.88 ± 0.06 v,A | 5.8 ± 0.2 t,A | 1.3 (0.3) e,f,g,h,i |
| Sample | C | Consistency (N s) | Firmness (N) | Viscosity (N s) | Cohesiveness (N) |
|---|---|---|---|---|---|
| FCH | 4 | 5.4 ± 0.5 h,i,j,C | 0.92 ± 0.04 h,i,E | 0.66 ± 0.05 f,g,D | 0.63 ± 0.06 g,h,i,D |
| 5 | 6 ± 2 h,i,j,C | 1.0 ± 0.4 h,i,D,E | 0.74 ± 0.18 f,D | 0.80 ± 0.15 f,g,h,C,D | |
| 6 | 16 ± 3 e,f,A | 3.1 ± 0.7 d,A,B | 1.46 ± 0.17 d,A | 1.9 ± 0.3 e,A | |
| 7 | 16 ± 4 d,e,A | 3.3 ± 0.8 d,A | 1.4 ± 0.2 d,A | 1.8 ± 0.4 e,A,B | |
| 65FCH | 4 | 6.4 ± 0.9 q,p,o,n,C | 1.16 ± 0.17 o,n,D,E | 0.81 ± 0.05 s,r,C,D | 0.78 ± 0.15 q,p,C,D |
| 5 | 10.1 ± 0.6 r,q,p,o,B | 1.74 ± 0.06 p,o,n,C,D | 0.98 ± 0.03 t,s,C | 1.09 ± 0.09 r,q,C | |
| 6 | 12.85 ± 1.19 s,r,q,A,B | 2.3 ± 0.3 q,p,o,B,C | 1.23 ± 0.09 u,t,B | 1.47 ± 0.09 s,r,B | |
| 7 | 15 ± 5 t,s,r,A | 3.1 ± 1.3 r,q,p,A,B | 1.3 ± 0.2 u,t,A,B | 1.6 ± 0.5 s,r,A,B | |
| FPE | 4 | 1.04 ± 0.06 k,D | 0.20 ± 0.03 i,C | 0.065 ± 0.009 j,k,C | 0.146 ± 0.016 j,k,C |
| 5 | 2.0 ± 0.4 j,k,D | 0.68 ± 0.19 h,i,C | 0.07 ± 0.02 k,C | 0.150 ± 0.015 j,k,C | |
| 6 | 5 ± 3 h,i,j,B,C,D | 2.0 ± 1.3 f,g,B,C | 0.15 ± 0.09 i,j,k,B,C | 0.3 ± 0.2 i,j,k,B,C | |
| 7 | 10 ± 3 g,B,C | 3.3 ± 0.7 d,A,B | 0.31 ± 0.06 h,i,j,B | 0.61 ± 0.06 g,h,i,B,C | |
| 65FPE | 4 | 1.6 ± 0. 3 o,n,D | 0.56 ± 0.14 o,n,C | 0.062 ± 0.003 p,C | 0.157 ± 0.009 o,C |
| 5 | 4.1 ± 0.9 p,o,n,C,D | 1.6 ± 0.4 p,o,n,B,C | 0.13 ± 0.04 p,B,C | 0.25 ± 0.08 p,o,C | |
| 6 | 21 ± 6 s,r,q,p,A,B | 5.4 ± 1.3 s,r,q,p,A,B | 0.45 ± 0.09 q,p,B | 1.2 ± 0.3 q,p,o,A,B | |
| 7 | 24 ± 5 u,t,s,A | 6.25 ± 1.13 t,s,A | 0.66 ± 0.18 r,q,A | 1.5 ± 0.3 r,q,A | |
| FP | 4 | 1.07 ± 0.04 k,D | 0.28 ± 0.06 i,G | 0.054 ± 0.002 k,E | 0.145 ± 0.013 j,k,E |
| 5 | 2.84 ± 1.07 j,k,D | 1.4 ± 0.7 g,h,F | 0.14 ± 0.08 i,j,k,E | 0.52 ± 0.18 h,i,D,E | |
| 6 | 10.3966 ± 1.0114 h,i,j,C | 3.0 ± 0.4 d,e,D,E | 0.66 ± 0.04 f,g,D | 1.8 ± 0.2 e,C | |
| 7 | 19.5 ± 1.7 g,B | 4.6 ± 0.4 c,C | 1.11 ± 0.13 e,C | 3.0 ± 0.3 d,B | |
| 65FP | 4 | 3.90 ± 1.08 p,o,n,D | 2.2 ± 0.5 q,p,o,E,F | 0.29 ± 0.18 q,p,E | 0.73 ± 0.08 q,p,o,D |
| 5 | 11.1 ± 1.4 s,r,q,p,C | 3.9 ± 0.3 t,s,r,q,C,D | 0.76 ± 0.15 s,r,D | 1.9 ± 0.4 t,s,C | |
| 6 | 22 ± 5 u,t,B | 5.5 ± 0.9 u,t,B | 1.5 ± 0.3 u,A | 3.2 ± 0.5 u,B | |
| 7 | 41 ± 6 v,A | 9.7 ± 1.4 w,A | 2.7 ± 0.6 w,B | 5.5 ± 0.8 v,A | |
| FC | 4 | 1.004 ± 0.013 k,C | 0.177 ± 0.008 i,B,C | 0.0720 ± 0.0014 j,k,E | 0.153 ± 0.008 j,k,D |
| 5 | 1.058 ± 0.014 k,C | 0.1860 ± 0.0104 i,C | 0.100 ± 0.003 j,k,E | 0.170 ± 0.008 k,D | |
| 6 | 1.285 ± 0.009 k,B | 0.214 ± 0.006 i,B | 0.257 ± 0.004 h,i,j,k,C | 0.306 ± 0.013 i,j,k,C | |
| 7 | 1.68 ± 0.09 k,A | 0.26 ± 0.02 i,A | 0.37 ± 0.02 h,i,B | 0.47 ± 0.08 i,j,B | |
| 65FC | 4 | 0.970 ± 0.009 n,C | 0.178 ± 0.008 n,B,C | 0.0756 ± 0.0017 p,E | 0.152 ± 0.008 o,D |
| 5 | 1.05 ± 0.03 n,C | 0.182 ± 0.002 n,B,C | 0.124 ± 0.009 p,D | 0.2050 ± 0.0113 p,o,D | |
| 6 | 1.28 ± 0.03 n,B | 0.209 ± 0.014 n,B | 0.246 ± 0.007 q,p,C | 0.33 ± 0.04 p,o,C | |
| 7 | 1.89 ± 0.06 o,n,A | 0.29580 ± 0.01006 n,A | 0.45 ± 0,03 r,q,p,A | 0.662 ± 0.119 q,p,o,A | |
| FBPC | 4 | 6.5 ± 0.5 h,G | 1.267 ± 0.106 g,h,E | 0.71 ± 0.05 f,g,F | 1.05 ± 0.04 f,F |
| 5 | 12.4 ± 1.5 f,g,F,G | 2.2 ± 0.3 e,f,g,E | 1.33 ± 0.07 d,e,E | 1.91 ± 0.10 e,E | |
| 6 | 27 ± 3 c,D,E | 4.7 ± 0.4 c,D | 2.26 ± 0.15 c,D | 3.22 ± 0.13 d,D | |
| 7 | 42 ± 8 a,C | 8 ± 2 a,C | 3.6 ± 0.5 b,C | 5.5 ± 0.7 b,C | |
| 65FBPC | 4 | 24 ± 2 u,E,F | 4.5 ± 0.6 t,s,r,D | 1.3 ± 0.2 u,t,E | 2.21 ± 0.16 t,E |
| 5 | 39 ± 6 v,C,D | 7 ± 2 v,C | 2.20 ± 0.17 v,D | 4.0 ± 0.4 v,D | |
| 6 | 75 ± 13 x,B | 14 ± 2 y,B | 4.3 ± 0.5 x,B | 8.0 ± 0.9 y,B | |
| 7 | 107 ± 21 z,A | 20 ± 4 z,A | 6.0 ± 0.6 y,A | 10.4 ± 1.3 z,A | |
| FPESB | 4 | 5.7 ± 0.7 h,i,E | 1.274 ± 0.103 g,h,E | 0.49 ± 0.06 g,h,E | 0.92 ± 0.19 f,g,E |
| 5 | 14 ± 6 e,f,g,D | 2.5 ± 0.8 d,e,f,D,E | 1.3 ± 0.2 d,e,D | 2.1 ± 0.4 e,D | |
| 6 | 16.9 ± 0.7 c,D | 3.204 ± 0.115 d,D | 2.4 ± 0.2 c,C | 3.73 ± 0.14 c,C | |
| 7 | 36 ± 6 a,C | 6.6 ± 1.5 b,C | 4.2 ± 0.6 a,B | 6.2 ± 0.6 a,B | |
| 65FPESB | 4 | 18 ± 2 u,t,s,r,D | 3.7 ± 0.4 t,s,r,q,D | 1.24 ± 0.18 u,t,D | 1.8 ± 0.3 t,s,D |
| 5 | 38 ± 5 v,C | 7.01 ± 1.04 v,u,C | 2.4 ± 0.3 w,v,C | 3.8 ± 0.4 v,C | |
| 6 | 63 ± 3 w,B | 12.08 ± 1.12 x,B | 4.5 ± 0.9 x,B | 6.4 ± 0.3 x,B | |
| 7 | 94 ± 9 y,A | 19 ± 2 z,A | 7.3 ± 0.4 z,A | 10.1 ± 0.4 z,A |
| Ostwald-De Waele Model | |||||
|---|---|---|---|---|---|
| Sample | C | k (Pa sn) | n | ηap (Pa s) | R2 |
| FCH | 4 | 1.74 ± 0.05 g,h,i,j,D,E | 0.519 ± 0.008 d,A | 0.265 ± 0.009 g,h,D | 0.99 |
| 5 | 3.1 ± 0.8 f,g,C | 0.4991 ± 0.0103 d,e,B | 0.440530 ± 0.101015 e,f,C | 0.99 | |
| 6 | 3.61 ± 0.09 f,B,C | 0.502 ± 0.006 d,e,f,B | 0.515 ± 0.012 e,B | 0.99 | |
| 7 | 5.8 ± 0.6 e,A | 0.485 ± 0.005 e,f,g,h,C | 0.77 ± 0.06 d,A | 0.99 | |
| 65FCH | 4 | 1.55 ± 0.02 o,n,E | 0.519 ± 0.003 u,A | 0.2360 ± 0.0018 n,m,D | 0.99 |
| 5 | 2.199 ± 0.116 p,o,D | 0.456 ± 0.006 t,s,r,q,D | 0.2618 ± 0.0104 o,n,m,D | 0.99 | |
| 6 | 3.93 ± 0.05 s,r,q,B | 0.507 ± 0.002 u,B | 0.570 ± 0.005 r,q,B | 0.99 | |
| 7 | 6.40 ± 0.04 u,t,A | 0.442 ± 0.002 r,q,E | 0.723 ± 0.008 t,s,A | 0.99 | |
| FPE | 4 | 0.31 ± 0.06 j,k,C | 0.46 ± 0.04 i,B | 0.037 ± 0.009 k,C | 0.94 |
| 5 | 0.28 ± 0.03 j,k,C | 0.5870 ± 0.0106 c,A | 0.056 ± 0.003 k,C | 0.96 | |
| 6 | 0.54 ± 0.17 i,j,k,B,C | 0.57 ± 0.05 c,A | 0.098 ± 0.017 j,k,B,C | 0.98 | |
| 7 | 6 ± 2 e,A | 0.264 ± 0.007 n,D | 0.35 ± 0.12 f,g,A | 0.95 | |
| 65FPE | 4 | 0.21 ± 0.03 n,C | 0.58 ± 0.03 x,A | 0.040 ± 0.003 k,C | 0.97 |
| 5 | 0.55 ± 0.16 n,m,B,C | 0.56 ± 0.03 x,w,A | 0.098 ± 0.019 l,k,B,C | 0.98 | |
| 6 | 2.0 ± 0.6 p,o,B | 0.39 ± 0.05 p,C | 0.18 ± 0.03 m,l,B | 0.98 | |
| 7 | 5.16 ± 1.04 t,s,A | 0.3019 ± 0.0004 o,D | 0.34 ± 0.07 p,o,A | 0.97 | |
| FP | 4 | 1.5 ± 0.3 h,i,j,k,D | 0.34 ± 0.03 k,l,A,B | 0.1117 ± 0.0106 i,j,k,D | 0.98 |
| 5 | 2.8 ± 0.3 f,g,h,D | 0.34 ± 0.03 k,A | 0.216 ± 0.019 h,i,j,D | 0.97 | |
| 6 | 6.8 ± 0.9 e,C | 0.3115 ± 0.0115 l,m,A,B,C | 0.46 ± 0.04 e,f,C | 0.97 | |
| 7 | 13 ± 3 d,B | 0.30 ± 0.02 m,B,C,D | 0.81 ± 0.09 d,B | 0.98 | |
| 65FP | 4 | 3.052 ± 0.105 q,p,D | 0.277 ± 0.005 o,C,D | 0.180 ± 0.003 m,l,D | 0.99 |
| 5 | 6.6 ± 0.3 u,C | 0.29 ± 0.02 o,n,C,D | 0.41 ± 0.04 p,C | 0.98 | |
| 6 | 12.3 ± 1.5 w,v,B | 0.302 ± 0.013 o,B,C,D | 0.80 ± 0.07 t,B | 0.98 | |
| 7 | 22 ± 2 x,A | 0.275 ± 0.005 n,D | 1.27 ± 0.13 u,A | 0.98 | |
| FC | 4 | 0.1017 ± 0.0009 k,F | 0.7151 ± 0.0014 a,A | 0.03338 ± 0.00018 k,F | 0.99 |
| 5 | 0.338 ± 0.009 j,k,E,F | 0.651 ± 0.002 b,B | 0.086 ± 0.002 j,k,E | 0.99 | |
| 6 | 0.99 ± 0.04 i,j,k,D | 0.602 ± 0.006 c,C | 0.209 ± 0.005 h,i,j,D | 0.99 | |
| 7 | 2.631 ± 0.019 f,g,h,B | 0.578 ± 0.013 c,D | 0.51 ± 0.03 e,B | 0.99 | |
| 65FC | 4 | 0.130 ± 0.005 m,F | 0.716 ± 0.005 z,A | 0.0427 ± 0.0008 k,F | 0.99 |
| 5 | 0.48 ± 0.03 n,m,E | 0.642 ± 0.008 y,B | 0.118 ± 0.003 l,k,E | 0.99 | |
| 6 | 1.51 ± 0.06 o,n,C | 0.585 ± 0.005 x,D | 0.297 ± 0.006 o,n,C | 0.99 | |
| 7 | 3.6 ± 0.4 r,q,A | 0.55393 ± 0.01019 w,E | 0.63 ± 0.04 r,q,A | 0.99 | |
| FBPC | 4 | 1.98 ± 0.04 g,h,i,F | 0.458 ± 0.013 h,i,A | 0.2385 ± 0.0115 g,h,i,F | 0.99 |
| 5 | 5.9 ± 0.6 e,E | 0.4682 ± 0.0015 g,h,i,A | 0.74 ± 0.08 d,E | 0.99 | |
| 6 | 17.2 ± 1.6 c,C | 0.462 ± 0.002 h,i,A | 2.10 ± 0.18 b,C | 0.99 | |
| 7 | 26.5 ± 1.5 a,A | 0.424 ± 0.009 j,B | 2.8 ± 0.2 a,A | 0.99 | |
| 65FBPC | 4 | 5.2 ± 0.2 t,s,E | 0.467 ± 0.013 t,s,A | 0.64 ± 0.06 s,r,E | 0.99 |
| 5 | 12.0 ± 0.8 v,D | 0.46360 ± 0.01013 t,s,r,A | 1.47 ± 0.06 v,D | 0.99 | |
| 6 | 22.9 ± 1.9 y,B | 0.432 ± 0.005 q,B | 2.48 ± 0.17 x,B | 0.99 | |
| FPESB | 4 | 2.09 ± 0.09 f,g,h,i,F | 0.496 ± 0.004 d,e,f,g,A | 0.290 ± 0.009 g,h,G | 0.99 |
| 5 | 5.4 ± 0.4 e,E | 0.487 ± 0.006 e,f,g,h,A,B | 0.72 ± 0.04 d,E | 0.99 | |
| 6 | 11.1 ± 1.3 d,D | 0.473 ± 0.014 f,g,h,i,C,D | 1.41 ± 0.09 c,D | 0.99 | |
| 7 | 22.87 ± 1.13 b,B | 0.462 ± 0.006 h,i,D,E,F | 2.78 ± 0.09 a,B | 0.99 | |
| 65FPESB | 4 | 4.68 ± 0.16 s,r,E | 0.450 ± 0.005 s,r,q,F | 0.54384 ± 0.01009 q,F | 0.99 |
| 5 | 13.5 ± 0.3 w,C | 0.459 ± 0.006 t,s,r,E,F | 1.629 ± 0.016 w,C | 0.99 | |
| 6 | 21.8 ± 0.5 y,x,B | 0.476 ± 0.003 t,s,r,B,C | 2.81 ± 0.06 y,B | 0.99 | |
| 7 | 36.7 ± 0.7 z,A | 0.466 ± 0.003 t,C,D,E | 4.55 ± 0.04 z,A | 0.99 | |
Publisher’s Note: MDPI stays neutral with regard to jurisdictional claims in published maps and institutional affiliations. |
© 2021 by the authors. Licensee MDPI, Basel, Switzerland. This article is an open access article distributed under the terms and conditions of the Creative Commons Attribution (CC BY) license (https://creativecommons.org/licenses/by/4.0/).
Share and Cite
Noguerol, A.T.; Igual, M.; Pagán-Moreno, M.J. Nutritional, Physico-Chemical and Mechanical Characterization of Vegetable Fibers to Develop Fiber-Based Gel Foods. Foods 2021, 10, 1017. https://doi.org/10.3390/foods10051017
Noguerol AT, Igual M, Pagán-Moreno MJ. Nutritional, Physico-Chemical and Mechanical Characterization of Vegetable Fibers to Develop Fiber-Based Gel Foods. Foods. 2021; 10(5):1017. https://doi.org/10.3390/foods10051017
Chicago/Turabian StyleNoguerol, Ana Teresa, Marta Igual, and M. Jesús Pagán-Moreno. 2021. "Nutritional, Physico-Chemical and Mechanical Characterization of Vegetable Fibers to Develop Fiber-Based Gel Foods" Foods 10, no. 5: 1017. https://doi.org/10.3390/foods10051017
APA StyleNoguerol, A. T., Igual, M., & Pagán-Moreno, M. J. (2021). Nutritional, Physico-Chemical and Mechanical Characterization of Vegetable Fibers to Develop Fiber-Based Gel Foods. Foods, 10(5), 1017. https://doi.org/10.3390/foods10051017