
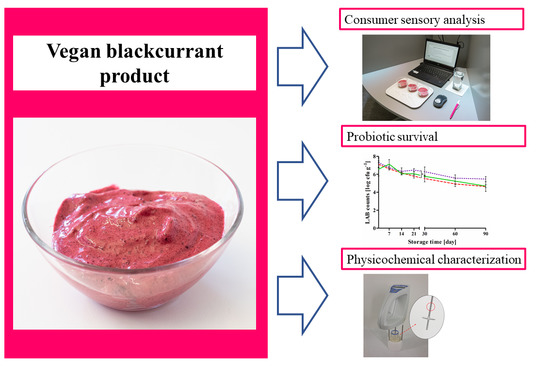
Potential of Probiotic Frozen Blackcurrant Products: Consumer Preference, Physicochemical Characterization, and Cell Viability


 ,
,  ,
,  ,
, 
Abstract
1. Introduction
2. Materials and Methods
2.1. Bacterial Strains and Culture Conditions
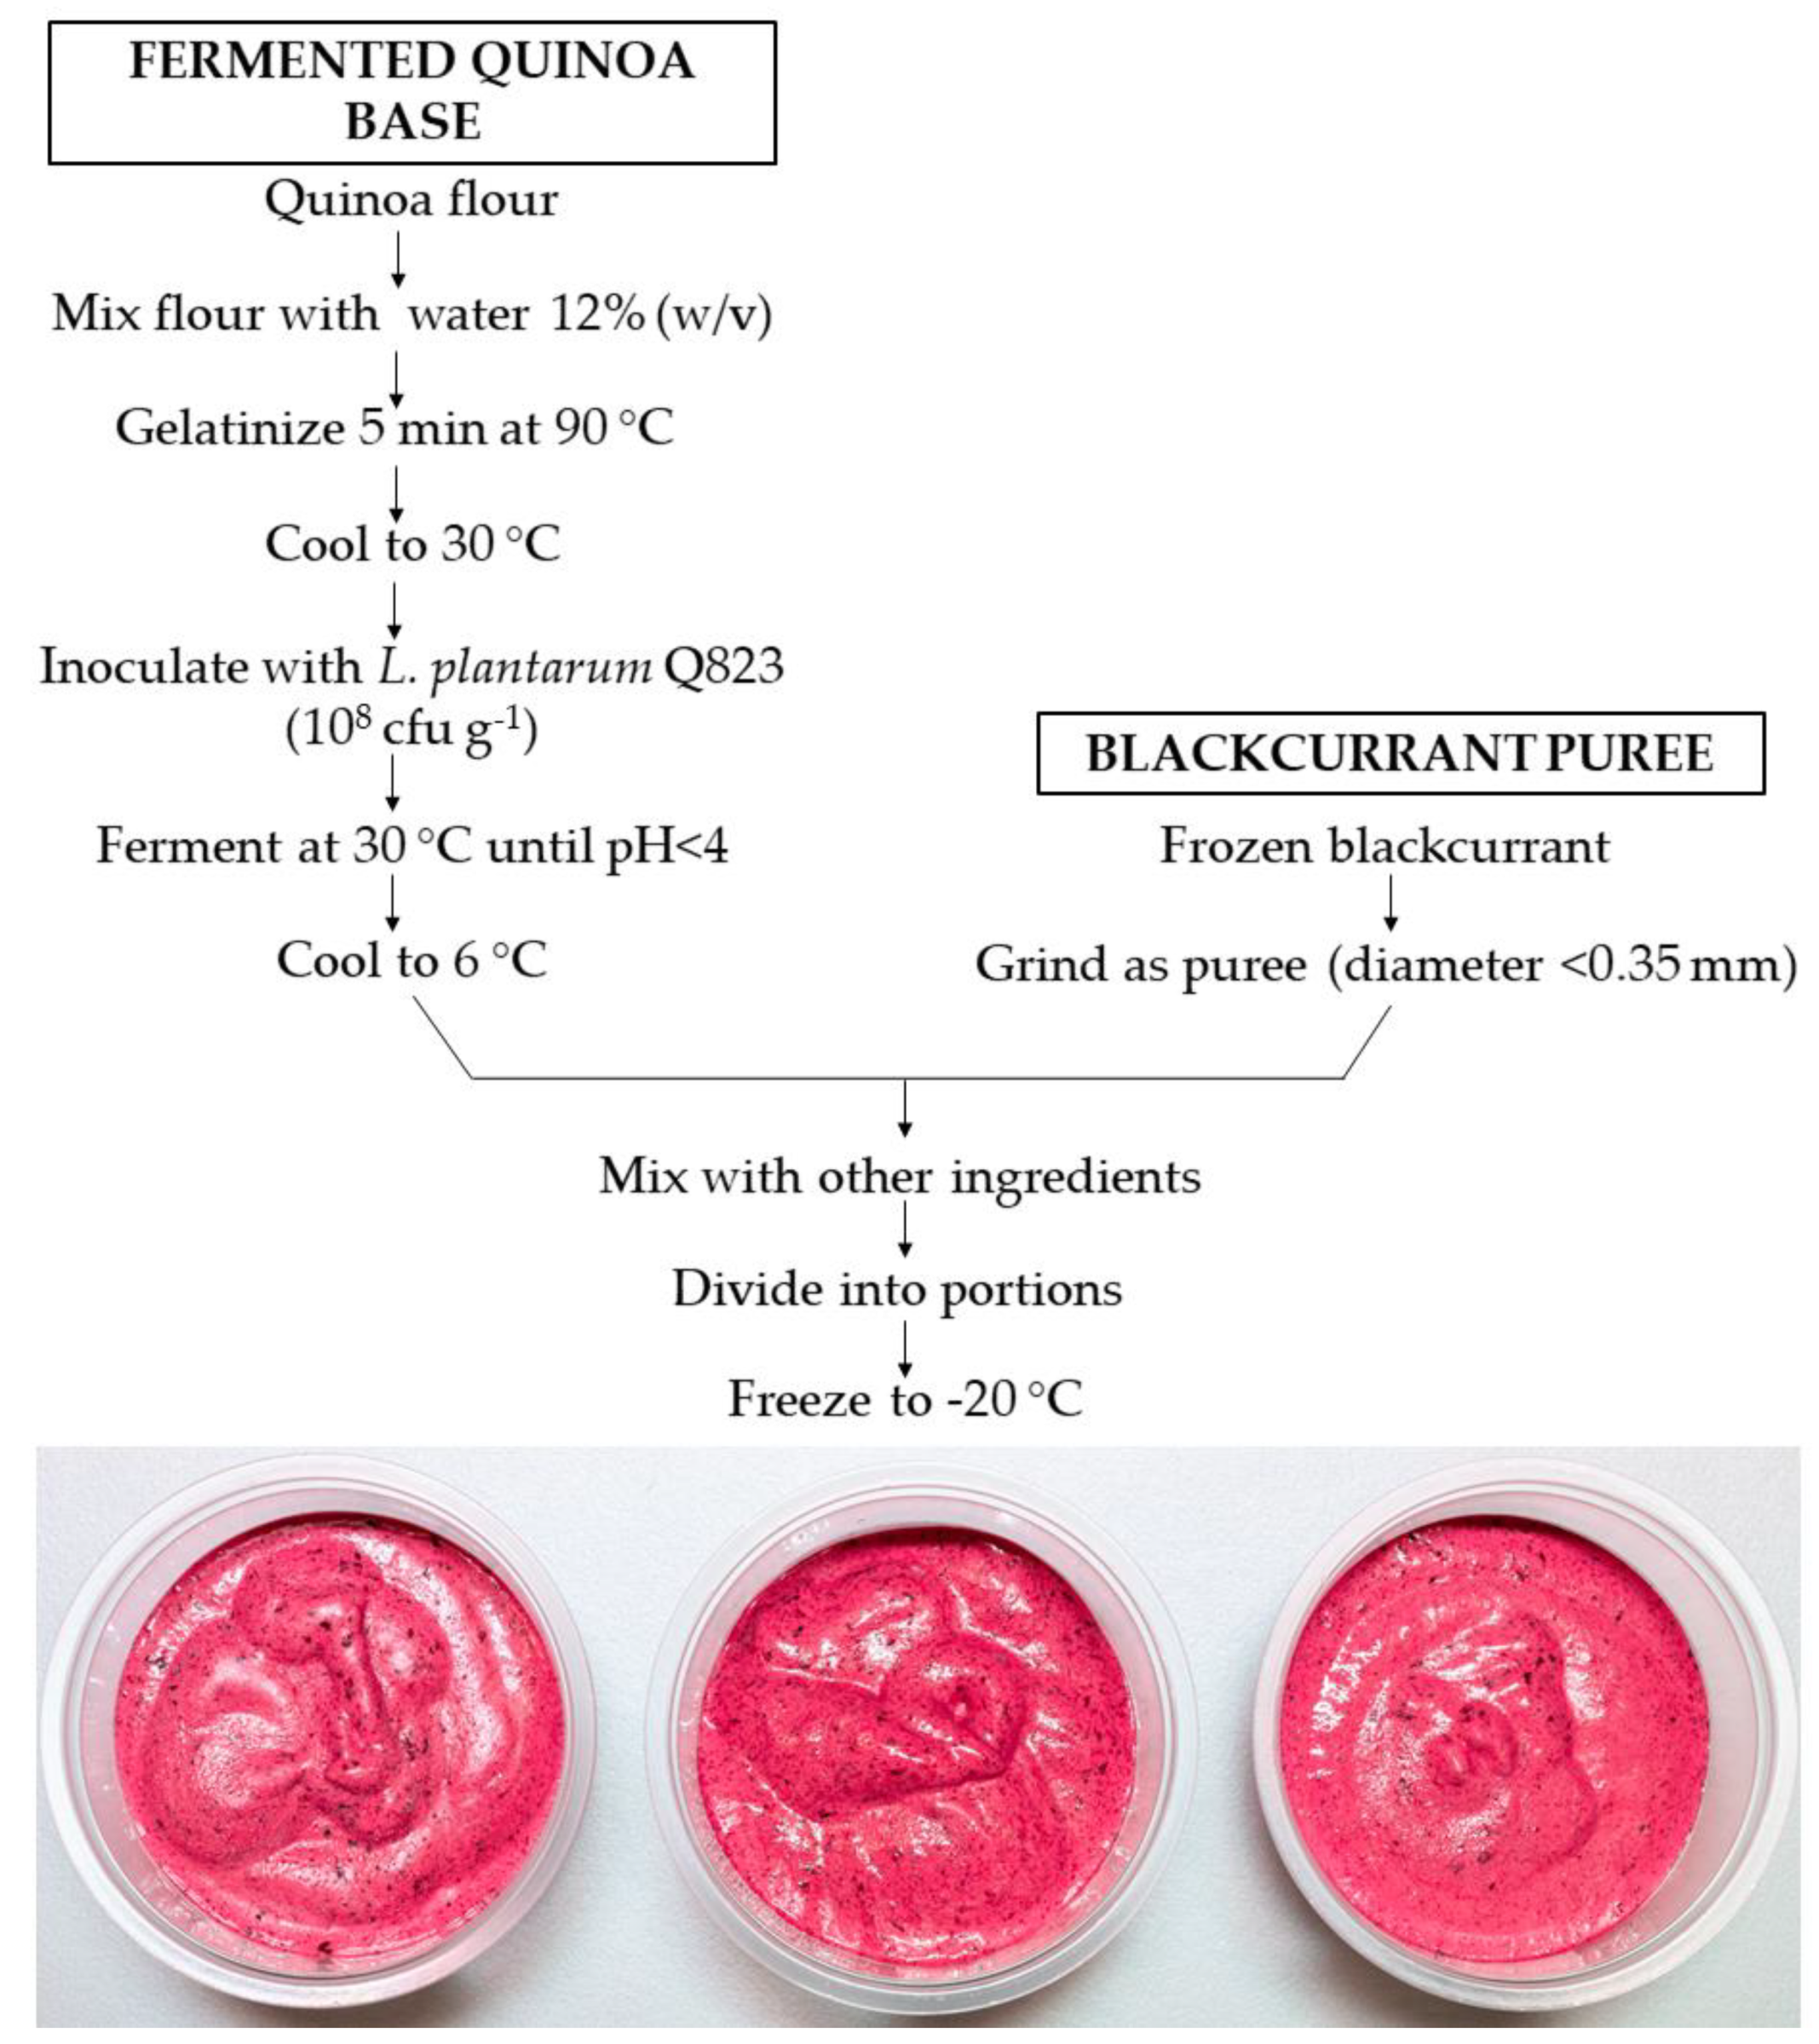
2.2. Manufacturing Process
2.3. Physicochemical Analysis
2.4. Consumer Sensory Evaluation
2.5. Viable Cell Counts during the 90-Day Storage
2.6. In Vitro Survival of L. plantarum Q823
2.7. Statistical Analysis
3. Results
3.1. Physicochemical Analysis
3.2. Consumer Sensory Evaluation
3.3. Viable Cell Counts during the 90-Day Storage
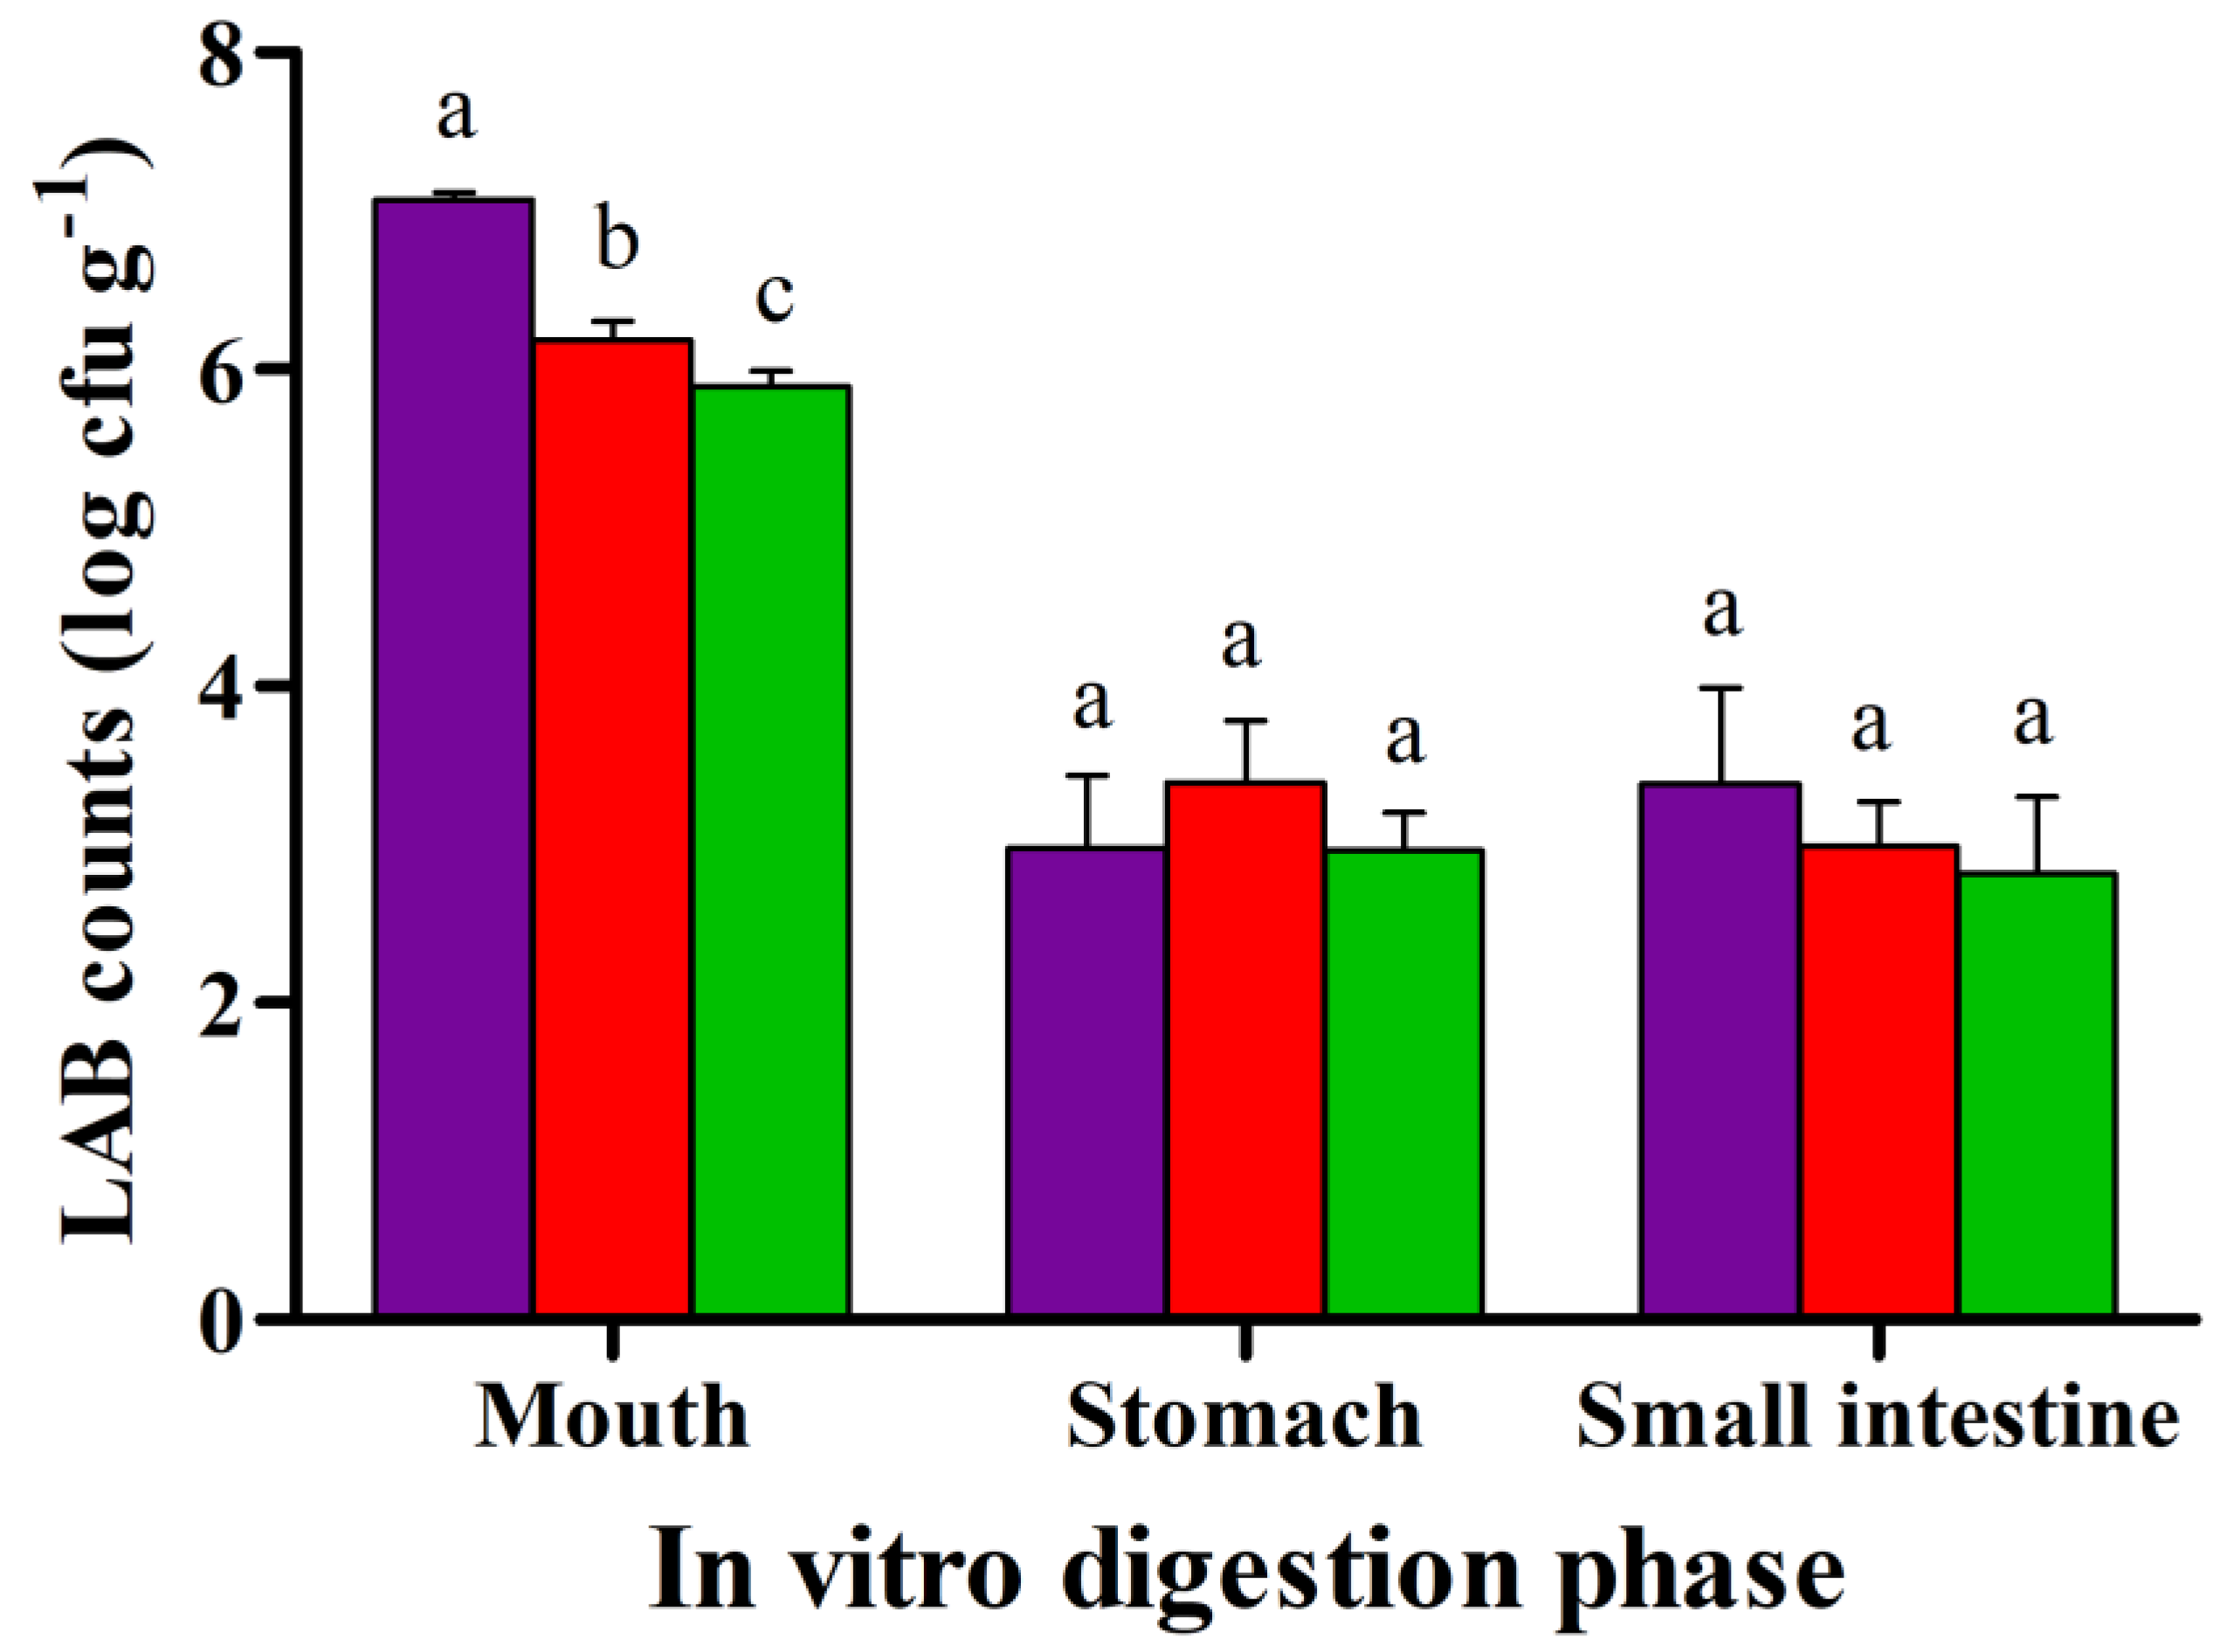
3.4. In Vitro Survival of L. plantarum Q823
4. Discussion
5. Conclusions
Author Contributions
Funding
Data Availability Statement
Acknowledgments
Conflicts of Interest
Appendix A

| Background Information | n = 71 | % |
|---|---|---|
| Gender | ||
| Male | 10 | 14.1 |
| Female | 60 | 84.5 |
| Other | 1 | 1.4 |
| Age | ||
| 18–24 | 22 | 31.0 |
| 25–30 | 14 | 19.7 |
| 31–40 | 14 | 19.7 |
| 41–50 | 8 | 11.3 |
| 51–65 | 13 | 18.3 |
| Job description | ||
| Working | 38 | 53.5 |
| Student | 31 | 43.7 |
| Other | 2 | 2.8 |
| Consumption of berries | ||
| Daily | 19 | 26.8 |
| Few times a week | 25 | 35.2 |
| Once a week | 9 | 12.7 |
| Few times a month | 16 | 19.7 |
| Rarely | 2 | 2.8 |
| Never | 0 | 0 |
| Do you look at a product’s nutritional information before buying it? | ||
| Yes | 14 | 19.7 |
| Yes, sometimes | 52 | 73.2 |
| No | 5 | 7.0 |
| Most important choosing factors when buying a product 1 | ||
| Package | 2 | 2.7 |
| Healthiness | 47 | 66.2 |
| Habit | 21 | 29.6 |
| Price | 48 | 67.6 |
| Organic or local product | 7 | 9.9 |
| Origin | 47 | 66.2 |
| Brand | 1 | 1.4 |
| Ecological aspect/Sustainability | 13 | 18.3 |
| Quality | 24 | 33.8 |
| Other | 1 | 1.4 |
Appendix B

Appendix C
| Unstandardized Coefficients | Standardized Coefficients | |||||
|---|---|---|---|---|---|---|
| Model | Variables in Model | β | Standard Error | β | t | Significance |
| 1 | (Constant) | 3.302 | 0.343 | 9.632 | 0.000 | |
| Sweetness | 0.563 | 0.045 | 0.652 | 12.476 | 0.000 | |
| 2 | (Constant) | 1.839 | 0.319 | 5.758 | 0.000 | |
| Sweetness | 0.414 | 0.040 | 0.479 | 10.307 | 0.000 | |
| Texture | 0.354 | 0.036 | 0.462 | 9.937 | 0.000 | |
| 3 | (Constant) | 1.578 | 0.305 | 5.173 | 0.000 | |
| Sweetness | 0.291 | 0.045 | 0.336 | 6.504 | 0.000 | |
| Texture | 0.309 | 0.035 | 0.403 | 8.914 | 0.000 | |
| Sourness | 0.210 | 0.040 | 0.275 | 5.232 | 0.000 | |
| 4 | (Constant) | 7.168 | 2.543 | 2.819 | 0.005 | |
| Sweetness | 0.292 | 0.044 | 0.338 | 6.601 | 0.000 | |
| Texture | 0.312 | 0.034 | 0.407 | 9.062 | 0.000 | |
| Sourness | 0.201 | 0.040 | 0.264 | 5.037 | 0.000 | |
| Protein | −7.360 | 3.324 | −0.090 | −2.214 | 0.028 | |
| 5 | (Constant) | 7.696 | 2.521 | 3.053 | 0.003 | |
| Sweetness | 0.274 | 0.044 | 0.317 | 6.169 | 0.000 | |
| Texture | 0.282 | 0.036 | 0.367 | 7.801 | 0.000 | |
| Sourness | 0.153 | 0.044 | 0.201 | 3.490 | 0.001 | |
| Protein | −8.405 | 3.311 | −0.103 | −2.539 | 0.012 | |
| Berryness | 0.126 | 0.051 | 0.141 | 2.483 | 0.014 |
References
- de Medeiros, A.C.; Filho, E.R.T.; Bolini, H.M.A. Impact of Natural and Artificial Sweeteners Compounds in the Sensory Profile and Preference Drivers Applied to Traditional, Lactose-Free, and Vegan Frozen Desserts of Chocolate Flavor. J. Food Sci. 2019, 84, 2973–2982. [Google Scholar] [CrossRef] [PubMed]
- Radnitz, C.; Beezhold, B.; DiMatteo, J. Investigation of lifestyle choices of individuals following a vegan diet for health and ethical reasons. Appetite 2015, 90, 31–36. [Google Scholar] [CrossRef] [PubMed]
- Román, S.; Sánchez-Siles, L.M.; Siegrist, M. The importance of food naturalness for consumers: Results of a systematic review. Trends Food Sci. Technol. 2017, 67, 44–57. [Google Scholar] [CrossRef]
- Jeske, S.; Zannini, E.; Arendt, E.K. Past, present and future: The strength of plant-based dairy substitutes based on gluten-free raw materials. Food Res. Int. 2018, 110, 42–51. [Google Scholar] [CrossRef]
- Zeiger, R.S.; Sampson, H.A.; Bock, S.; Burks, A.; Harden, K.; Noone, S.; Martin, D.; Leung, S.; Wilson, G. Soy allergy in infants and children with IgE-associated cow’s milk allergy. J. Pediatr. 1999, 134, 614–622. [Google Scholar] [CrossRef]
- Annunziata, A.; Vecchio, R. European consumers acceptance of healthy food products: A review of functional foods. In Functional Foods: Sources, Biotechnology Applications, and Health Challenges; Emerson, D., Robinson, A., Eds.; Nova Science Publishers, Inc.: New York, NY, USA; Hauppauge: New York, NY, USA, 2013; pp. 121–141. [Google Scholar]
- Erkaya, T.; Daǧdemir, E.; Sengül, M. Influence of Cape gooseberry (Physalis peruviana L.) addition on the chemical and sensory characteristics and mineral concentrations of ice cream. Food Res. Int. 2012, 45, 331–335. [Google Scholar] [CrossRef]
- Öztürk, H.İ.; Demirci, T.; Akın, N. Production of functional probiotic ice creams with white and dark blue fruits of Myrtus communis: The comparison of the prebiotic potentials on Lactobacillus casei 431 and functional characteristics. LWT 2018, 90, 339–345. [Google Scholar] [CrossRef]
- da Silva, J.M.; Klososki, S.J.; Silva, R.; Raices, R.S.L.; Silva, M.C.; Freitas, M.Q.; Barão, C.E.; Pimentel, T.C. Passion fruit-flavored ice cream processed with water-soluble extract of rice by-product: What is the impact of the addition of different prebiotic components? LWT 2020, 128, 109472. [Google Scholar] [CrossRef]
- Lankinen, M.; Uusitupa, M.; Schwab, U. Nordic Diet and Inflammation—A Review of Observational and Intervention Studies. Nutrients 2019, 11, 1369. [Google Scholar] [CrossRef]
- Ovaskainen, M.-L.; Törrönen, R.; Koponen, J.M.; Sinkko, H.; Hellström, J.; Reinivuo, H.; Mattila, P. Dietary Intake and Major Food Sources of Polyphenols in Finnish Adults. J. Nutr. 2008, 138, 562–566. [Google Scholar] [CrossRef] [PubMed]
- Castro-Acosta, M.L.; Lenihan-Geels, G.N.; Corpe, C.P.; Hall, W.L. Berries, and anthocyanins: Promising functional food ingredients with postprandial glycaemia-lowering effects. Proc. Nutr. Soc. 2016, 75, 342–355. [Google Scholar] [CrossRef]
- Hanhineva, K.; Törrönen, R.; Bondia-Pons, I.; Pekkinen, J.; Kolehmainen, M.; Mykkänen, H.; Poutanen, K. Impact of Dietary Polyphenols on Carbohydrate Metabolism. Int. J. Mol. Sci. 2010, 11, 1365–1402. [Google Scholar] [CrossRef]
- Lappi, J.; Raninen, K.; Väkeväinen, K.; Kårlund, A.; Törrönen, R.; Kolehmainen, M. Blackcurrant (Ribes nigrum) lowers sugar-induced postprandial glycaemia independently and in a product with fermented quinoa: A randomised crossover trial. Br. J. Nutr. 2020, 1–12. [Google Scholar] [CrossRef]
- del Bo’, C.; Martini, D.; Porrini, M.; Klimis-Zacas, D.; Riso, P. Berries and oxidative stress markers: An overview of human intervention studies. Food Funct. 2015, 6, 2890–2917. [Google Scholar] [CrossRef]
- Joseph, S.V.; Edirisinghe, I.; Burton-Freeman, B.M. Berries: Anti-inflammatory Effects in Humans. J. Agric. Food Chem. 2014, 62, 3886–3903. [Google Scholar] [CrossRef] [PubMed]
- Koponen, J.M.; Happonen, A.M.; Mattila, P.H.; Törrönen, A.R. Contents of Anthocyanins and Ellagitannins in Selected Foods Consumed in Finland. J. Agric. Food Chem. 2007, 55, 1612–1619. [Google Scholar] [CrossRef]
- Natural Resources Institute Finland (LuKe). Statistics Database. Available online: http://statdb.luke.fi (accessed on 14 May 2020).
- Laaksonen, O.; Mäkilä, L.; Tahvonen, R.; Kallio, H.; Yang, B. Sensory quality and compositional characteristics of blackcurrant juices produced by different processes. Food Chem. 2013, 138, 2421–2429. [Google Scholar] [CrossRef] [PubMed]
- Ng, S.W.; Slining, M.M.; Popkin, B.M. Use of Caloric and Noncaloric Sweeteners in US Consumer Packaged Foods, 2005–2009. J Acad. Nutr. Diet. 2012, 112, 1828–1834. [Google Scholar] [CrossRef] [PubMed]
- Arancibia-Avila, P.; Namiesnik, J.; Toledo, F.; Werner, E.; Martinez-Ayala, A.L.; Rocha-Guzmán, N.E.; Gallegos-Infante, J.A.; Gorinstein, S. The influence of different time durations of thermal processing on berries quality. Food Control 2012, 26, 587–593. [Google Scholar] [CrossRef]
- Brownmiller, C.; Howard, L.R.; Prior, R.L. Processing and Storage Effects on Monomeric Anthocyanins, Percent Polymeric Color, and Antioxidant Capacity of Processed Blueberry Products. J. Food Sci. 2008, 73, H72–H79. [Google Scholar] [CrossRef]
- Blandino, A.; Al-Aseeri, M.E.; Pandiella, S.S.; Cantero, D.; Webb, C. Cereal-based fermented foods and beverages. Food Res. Int. 2003, 36, 527–543. [Google Scholar] [CrossRef]
- Cruz, A.G.; Antunes, A.E.C.; Sousa, A.L.O.P.; Faria, J.A.F.; Saad, S.M.I. Ice-cream as a probiotic food carrier. Food Res. Int. 2009, 42, 1233–1239. [Google Scholar] [CrossRef]
- Vasiljevic, T.; Shah, N.P. Probiotics-From Metchnikoff to bioactives. Int. Dairy J. 2008, 18, 714–728. [Google Scholar] [CrossRef]
- Behera, S.S.; Ray, R.C.; Zdolec, N. Lactobacillus plantarum with Functional Properties: An Approach to Increase Safety and Shelf-Life of Fermented Foods. BioMed Res. 2018. [Google Scholar] [CrossRef]
- Karimi, R.; Mortazavia, A.M.; Da Cruz, A.G. Viability of probiotic microorganisms in cheese during production and storage: A review. Dairy Sci. Technol. 2011, 91, 283–308. [Google Scholar] [CrossRef]
- Akalın, A.S.; Kesenkas, H.; Dinkci, N.; Unal, G.; Ozer, E.; Kınık, O. Enrichment of probiotic ice cream with different dietary fibers: Structural characteristics and culture viability. J. Dairy Sci. 2018, 101, 37–46. [Google Scholar] [CrossRef] [PubMed]
- Vera-Pingitore, E.; Jimenez, M.E.; Dallagnol, A.; Belfiore, C.; Fontana, C.; Fontana, P.; von Wright, A.; Vignolo, G.; Plumed-Ferrer, C. Screening and characterization of potential probiotic and starter bacteria for plant fermentations. LWT 2016, 71, 288–294. [Google Scholar] [CrossRef]
- Urquizo, F.E.; García Torres, S.M.; Tolonen, T.; Jaakkola, M.; Pena-Niebuhr, M.G.; Von Wright, A.; Repo-Carrasco-Valencia, R.; Korhonen, H.; Plumed-Ferrer, C. Development of a fermented quinoa- based beverage. Food Sci. Nutr. 2016, 5, 602–608. [Google Scholar] [CrossRef]
- Väkeväinen, K.; Ludena-Urquizo, F.; Korkala, E.; Lapveteläinen, A.; Peräniemi, S.; von Wright, A.; Plumed-Ferrer, C. Potential of quinoa in the development of fermented spoonable vegan products. LWT 2020, 120, 108912. [Google Scholar] [CrossRef]
- Rogeauz, M. Improving team tasting in the food industry. In Rapid Sensory Profiling Techniques and Related Methods—Applications in New Product Development and Consumer Research, 1st ed.; Delarue, J., Lawlor, J., Rogeaux, M., Eds.; Woodhead: Cambridge, UK, 2015; pp. 345–362. [Google Scholar]
- Rolon, L.M.; Bakke, A.J.; Coupland, J.N.; Hayes, J.E.; Roberts, R.F. Effect of fat content on the physical properties and consumer acceptability of vanilla ice cream. J. Dairy Sci. 2017, 100, 5217–5227. [Google Scholar] [CrossRef] [PubMed]
- AOAC. Official Methods of Analysis, 18th ed.; AOAC International: Washington, DC, USA, 2005. [Google Scholar]
- ISO. ISO 8589:2007 (E). In Sensory Analysis—General Guidance for the Design of Test Rooms; The International Organization of Standardization: Geneva, Switzerland, 2007. [Google Scholar]
- Lawless, H.T.; Heymann, H. Sensory Evaluation of Foods—Principles and Practices, 2nd ed.; Springer: New York, NY, USA, 2010. [Google Scholar]
- dos Santos Cruxen, C.E.; Hoffmann, J.F.; Zandoná, G.P.; Fiorentini, Â.M.; Rombaldi, C.V.; Chaves, F.C. Probiotic butiá (Butia odorata) ice cream: Development, characterization, stability of bioactive compounds, and viability of Bifidobacterium lactis during storage. LWT 2017, 75, 379–385. [Google Scholar] [CrossRef]
- Mäkilä, L.; Laaksonen, O.; Kallio, H.; Yang, B. Effect of processing technologies and storage conditions on stability of black currant juices with special focus on phenolic compounds and sensory properties. Food Chem. 2017, 221, 422–430. [Google Scholar] [CrossRef] [PubMed]
- Brodkorb, A.; Egger, L.; Alminger, M.; Alvito, P.; Assunção, R.; Ballance, S.; Bohn, T.; Bourlieu-Lacanal, C.; Boutrou, R.; Carrière, F.; et al. INFOGEST static in vitro simulation of gastrointestinal food digestion. Nat Prot 2019, 14, 991–1014. [Google Scholar] [CrossRef]
- Torriani, S.; Felis, G.E.; Dellaglio, F. Differentiation of Lactobacillus plantarum, L. pentosus, and L. paraplantarum by recA Gene Sequence Analysis and Multiplex PCR Assay with recA Gene-Derived Primers Downloaded from. Appl. Environ. Microbiol. 2001, 67, 3450–3454. [Google Scholar] [CrossRef]
- Tabachnick, B.G.; Fidell, L.S. Using Multivariate Statistics, 6th ed.; Pearson new international edition; Pearson: Harlow, UK, 2014. [Google Scholar]
- Sofjan, R.P.; Hartel, R.W. Effects of overrun on structural and physical characteristics of ice cream. Int. Dairy J. 2004, 14, 255–262. [Google Scholar] [CrossRef]
- Camire, M.E.; Dougherty, M.P.; Teh, Y.-H. Frozen Wild Blueberry-Tofu-Soymilk Desserts. J. Food Sci. 2006, 71, S119–S123. [Google Scholar] [CrossRef]
- Sun-Waterhouse, D.; Edmonds, L.; Wadhwa, S.S.; Wibisono, R. Producing ice cream using a substantial amount of juice from kiwifruit with green, gold or red flesh. Food Res. Int. 2013, 50, 647–656. [Google Scholar] [CrossRef]
- National Institute for Health and Welfare. Fineli—National Food Composition Database. Available online: https://fineli.fi/fineli/en/index (accessed on 5 December 2019).
- Faye, T.; Tamburello, A.; Vegarud, G.E.; Skeie, S. Survival of lactic acid bacteria from fermented milks in an in vitro digestion model exploiting sequential incubation in human gastric and duodenum juice. J. Dairy Sci 2012, 95, 558–566. [Google Scholar] [CrossRef]
- Ferraz, J.L.; Cruz, A.G.; Cadena, R.S.; Freitas, M.Q.; Pinto, U.M.; Carvalho, C.C.; Faria, J.A.; Bolini, H.M. Sensory Acceptance and Survival of Probiotic Bacteria in Ice Cream Produced with Different Overrun Levels. J. Food Sci. 2012, 77, S24–S28. [Google Scholar] [CrossRef] [PubMed]
- Calligaris, S.; Marino, M.; Maifreni, M.; Innocente, N. Potential application of monoglyceride structured emulsions as delivery systems of probiotic bacteria in reduced saturated fat ice cream. LWT 2018, 96, 329–334. [Google Scholar] [CrossRef]
- Ahmadi, A.; Milani, E.; Madadlou, A.; Mortazavi, S.A.; Mokarram, R.R.; Salarbashi, D. Synbiotic yogurt-ice cream produced via incorporation of microencapsulated Lactobacillus acidophilus (la-5) and fructooligosaccharide. J. Food Sci. Technol. 2014, 51, 1568–1574. [Google Scholar] [CrossRef] [PubMed]
- Balthazar, C.; Silva, H.; Cavalcanti, R.; Esmerino, E.; Cappato, L.; Abud, Y.; Moraes, J.; Andrade, M.; Freitas, M.; Sant’Anna, C.; et al. Prebiotics addition in sheep milk ice cream: A rheological, microstructural and sensory study. J. Funct. Foods 2017, 35, 564–573. [Google Scholar] [CrossRef]

 ), product flavored with sugar and vanilla (
 ), and product flavored with sugar, vanilla, and lemon (
 ). The sugar-only flavored blackcurrant product was significantly different from that of the product flavored with sugar and vanilla at an individual time point: * p < 0.05 (Tukey test). Results are means of triplicates.
), product flavored with sugar and vanilla (), and product flavored with sugar, vanilla, and lemon (). The sugar-only flavored blackcurrant product was significantly different from that of the product flavored with sugar and vanilla at an individual time point: * p < 0.05 (Tukey test). Results are means of triplicates.
). The sugar-only flavored blackcurrant product was significantly different from that of the product flavored with sugar and vanilla at an individual time point: * p < 0.05 (Tukey test). Results are means of triplicates.
), product flavored with sugar and vanilla (), and product flavored with sugar, vanilla, and lemon (). The sugar-only flavored blackcurrant product was significantly different from that of the product flavored with sugar and vanilla at an individual time point: * p < 0.05 (Tukey test). Results are means of triplicates.
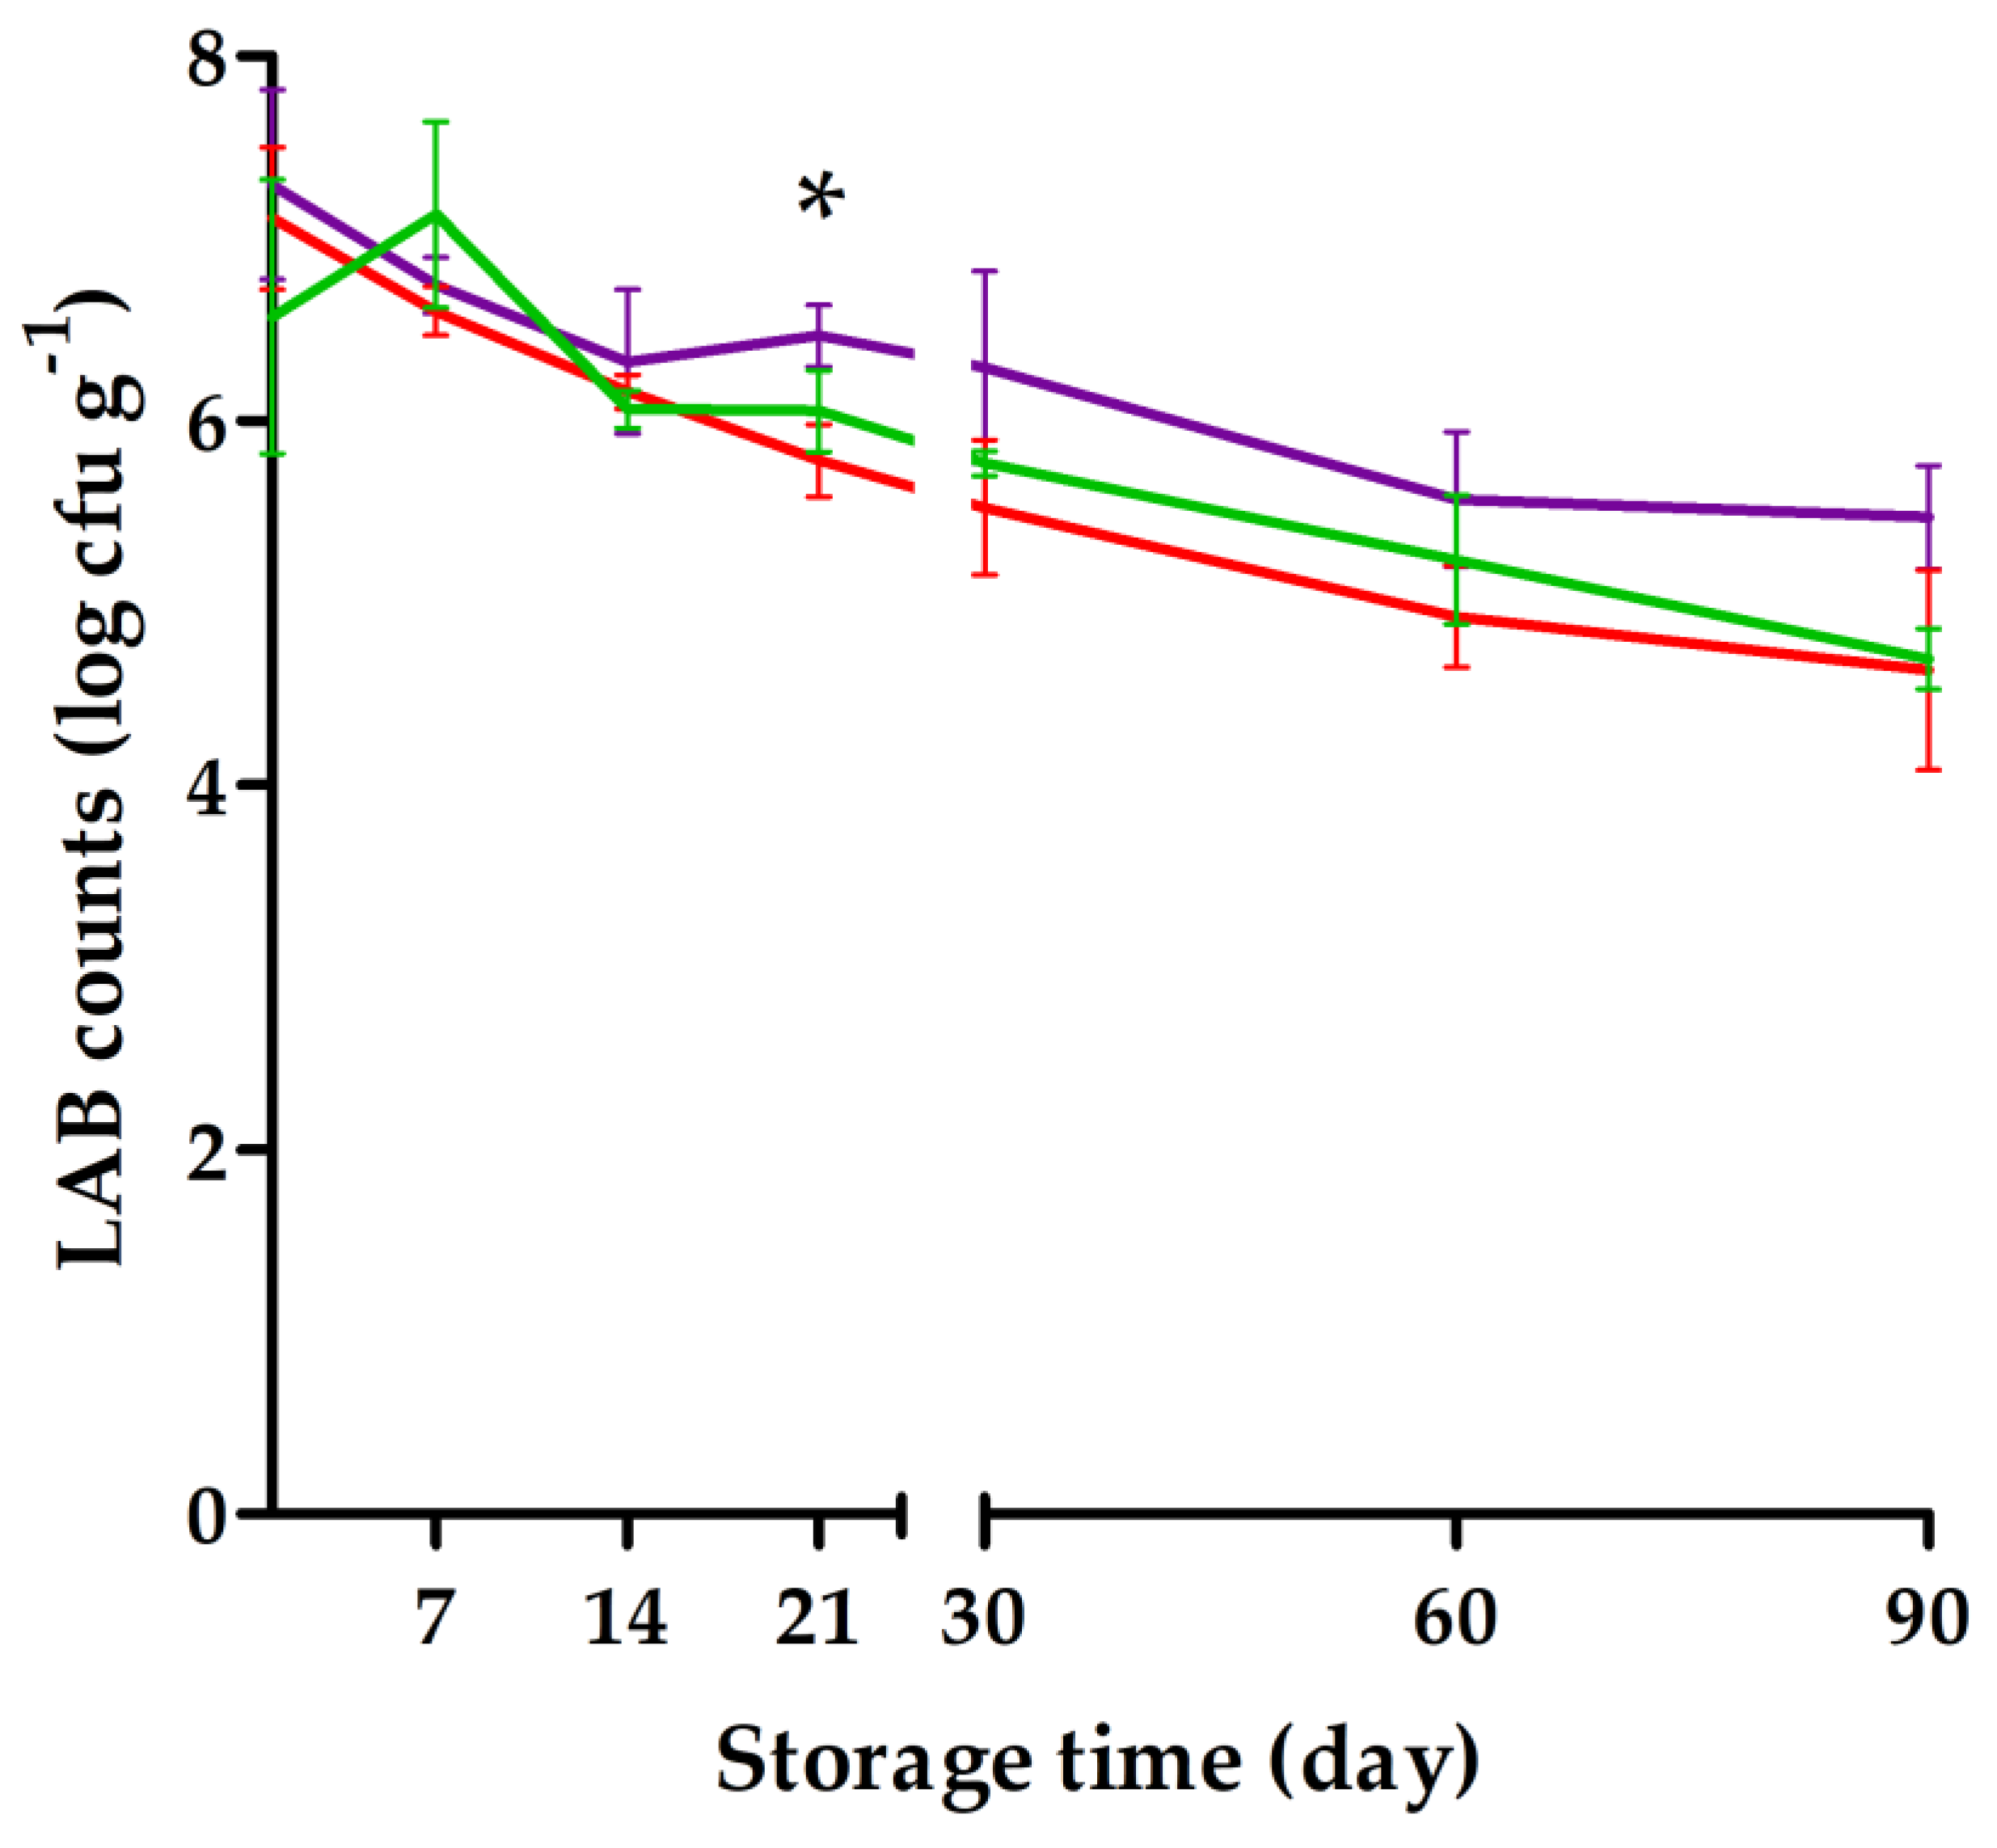
 ), 14 (
 ), and 21 (
 ) days of storage at −20 °C. The viable counts with different letters are significantly different according to Tukey’s test (p < 0.05). Results are means of triplicates.
), 14 (), and 21 () days of storage at −20 °C. The viable counts with different letters are significantly different according to Tukey’s test (p < 0.05). Results are means of triplicates.
) days of storage at −20 °C. The viable counts with different letters are significantly different according to Tukey’s test (p < 0.05). Results are means of triplicates.
), 14 (), and 21 () days of storage at −20 °C. The viable counts with different letters are significantly different according to Tukey’s test (p < 0.05). Results are means of triplicates.
| Product | SBP | VBP | VLBP |
|---|---|---|---|
| pH | 3.09 ± 0.01 a | 3.07 ± 0.01 ab | 3.03 ± 0.03 b |
| TTA (mL of NaOH) | 25.5 ± 0.87 a | 25.6 ± 0.21 ab | 27.0 ± 0.21 b |
| Viscosity (Pas) | 79.9 ± 3.59 a | 75.4 ± 5.43 a | 74.2 ± 3.45 a |
| Overrun (%) | 116.9 ± 1.54 a | 137.9 ± 6.4 b | 118.4 ± 0.75 a |
| Moisture | 61.9 ± 0.04 a | 61.6 ± 0.03 c | 61.0 ± 0.01 b |
| Ash | 0.35 ± 0.05 a | 0.37 ± 0.02 a | 0.35 ± 0.02 a |
| Protein | 0.78 ± 0.04 a | 0.74 ± 0.00 a | 0.75 ± 0.07 a |
| Fat 1 | 6.8 a | 6.8 a | 6.8 a |
| Carbohydrates 2 | 30.1 ± 0.06 a | 30.4 ± 0.03 c | 31.1 ± 0.05 b |
| Total fiber 3 | 7.2 | 7.2 | 7.2 |
| SBP | VBP | VLBP | |
|---|---|---|---|
| Overall liking | 7.2 ± 1.45 | 7.6 ± 1.19 | 7.6 ± 1.11 |
| Sweetness | 7.3 ± 1.61 | 7.4 ± 1.58 | 7.7 ± 1.17 |
| Sourness | 6.9 ± 1.83 | 7.2 ± 1.63 | 7.4 ± 1.48 |
| Berryness | 7.7 ± 1.46 | 7.5 ± 1.56 | 7.8 ± 1.23 |
| Texture | 7.2 ± 1.79 | 7.3 ± 1.63 | 7.3 ± 1.56 |
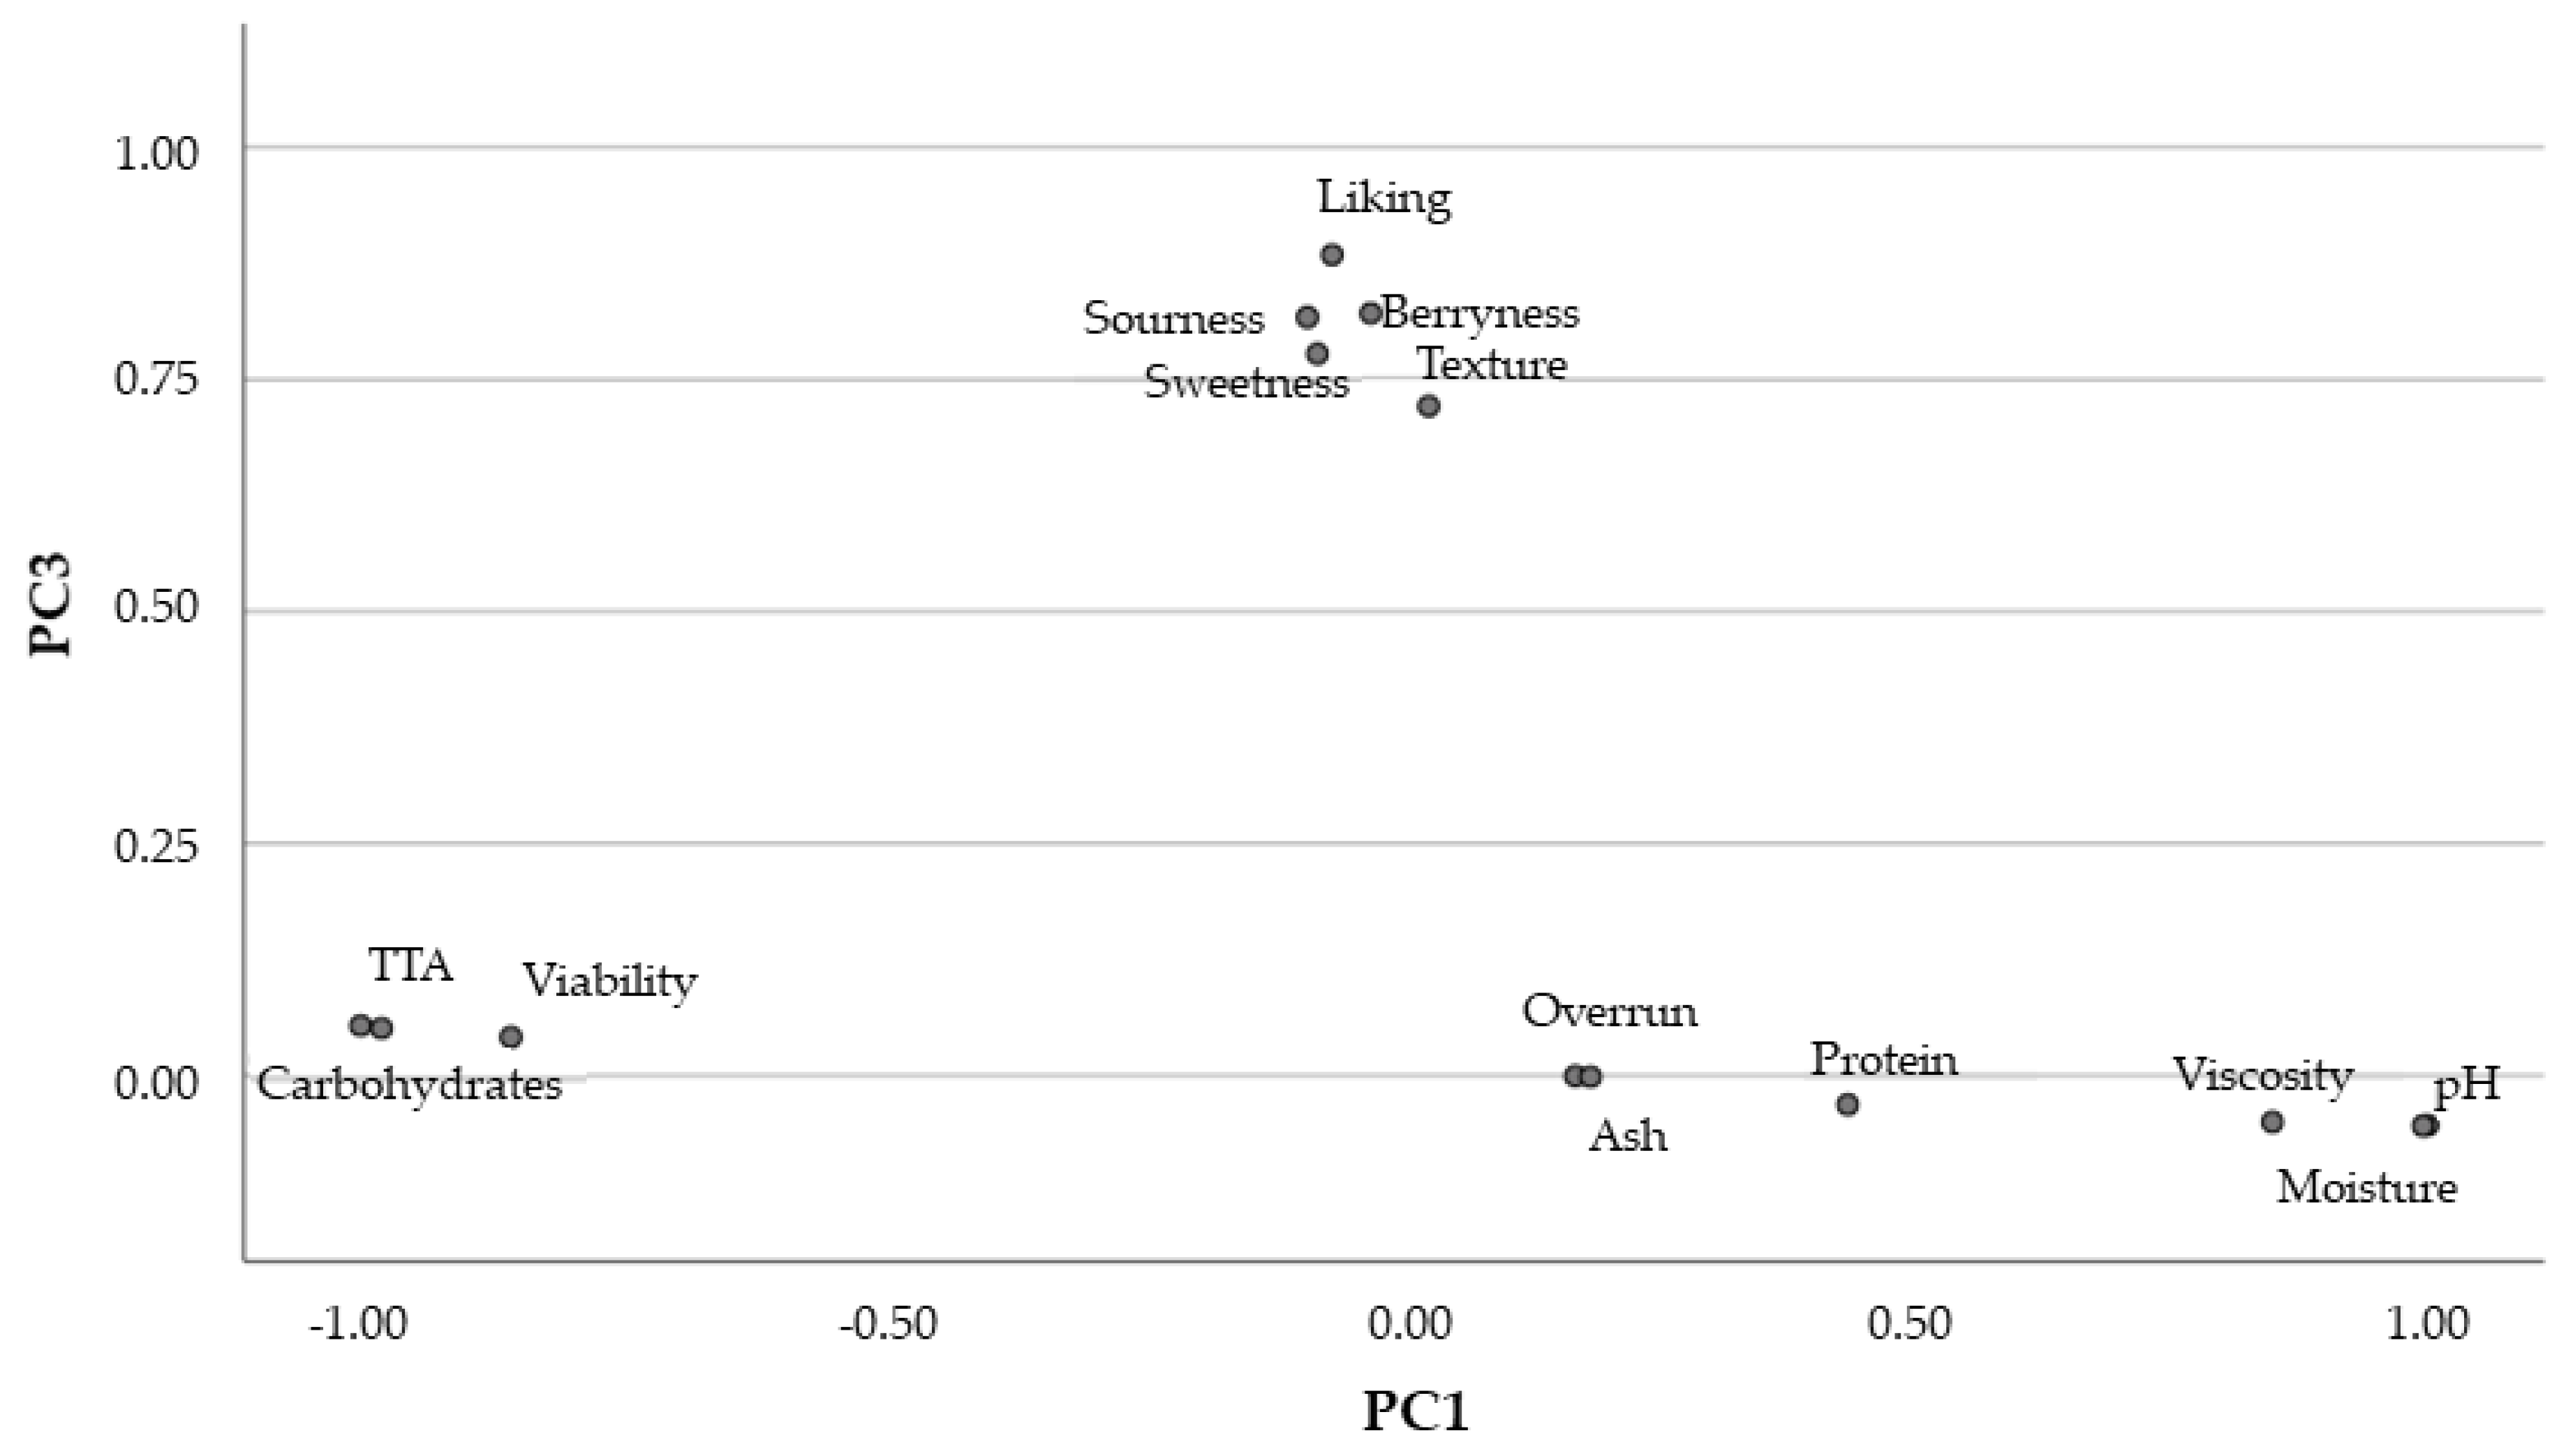
| Component | |||
|---|---|---|---|
| 1 | 2 | 3 | |
| Explained variance % | 40.5 | 24.0 | 23.3 |
| Carbohydrates | −0.998 | ||
| Moisture | 0.998 | ||
| pH | 0.994 | ||
| TTA | −0.978 | 0.200 | |
| Viability | −0.853 | 0.520 | |
| Viscosity | 0.848 | 0.527 | |
| Overrun | −0.984 | ||
| Ash | −0.982 | ||
| Protein | 0.438 | 0.898 | |
| Liking | 0.884 | ||
| Berryness | 0.821 | ||
| Sourness | 0.817 | ||
| Sweetness | 0.777 | ||
| Texture | 0.721 |
Publisher’s Note: MDPI stays neutral with regard to jurisdictional claims in published maps and institutional affiliations. |
© 2021 by the authors. Licensee MDPI, Basel, Switzerland. This article is an open access article distributed under the terms and conditions of the Creative Commons Attribution (CC BY) license (https://creativecommons.org/licenses/by/4.0/).
Share and Cite
Väkeväinen, K.; Rinkinen, N.; Willman, R.-M.; Lappi, J.; Raninen, K.; Kårlund, A.; Mikkonen, S.; Plumed-Ferrer, C.; Kolehmainen, M. Potential of Probiotic Frozen Blackcurrant Products: Consumer Preference, Physicochemical Characterization, and Cell Viability. Foods 2021, 10, 792. https://doi.org/10.3390/foods10040792
Väkeväinen K, Rinkinen N, Willman R-M, Lappi J, Raninen K, Kårlund A, Mikkonen S, Plumed-Ferrer C, Kolehmainen M. Potential of Probiotic Frozen Blackcurrant Products: Consumer Preference, Physicochemical Characterization, and Cell Viability. Foods. 2021; 10(4):792. https://doi.org/10.3390/foods10040792
Chicago/Turabian StyleVäkeväinen, Kati, Noora Rinkinen, Roosa-Maria Willman, Jenni Lappi, Kaisa Raninen, Anna Kårlund, Santtu Mikkonen, Carme Plumed-Ferrer, and Marjukka Kolehmainen. 2021. "Potential of Probiotic Frozen Blackcurrant Products: Consumer Preference, Physicochemical Characterization, and Cell Viability" Foods 10, no. 4: 792. https://doi.org/10.3390/foods10040792
APA StyleVäkeväinen, K., Rinkinen, N., Willman, R.-M., Lappi, J., Raninen, K., Kårlund, A., Mikkonen, S., Plumed-Ferrer, C., & Kolehmainen, M. (2021). Potential of Probiotic Frozen Blackcurrant Products: Consumer Preference, Physicochemical Characterization, and Cell Viability. Foods, 10(4), 792. https://doi.org/10.3390/foods10040792