Article

Evaluation of the Changes in Optical Properties of Peaches with Different Maturity Levels during Bruising

1
College of Engineering, Nanjing Agricultural University, Nanjing 210031, China
2
College of Mechanical and Electronic Engineering, Nanjing Forestry University, Nanjing 210037, China
3
College of Food Science and Technology, Nanjing Agricultural University, Nanjing 210095, China
*
Author to whom correspondence should be addressed.
Foods 2021, 10(2), 388; https://doi.org/10.3390/foods10020388
Submission received: 4 January 2021 / Revised: 30 January 2021 / Accepted: 6 February 2021 / Published: 10 February 2021
(This article belongs to the Special Issue Advances in NIR Spectroscopy Analytical Technology in Food Industries)

Abstract

:
The main objective was to measure the optical coefficients of peaches after bruising at different maturity levels and detect bruises. A spatially resolved method was used to acquire absorption coefficient (μa) and the reduced scattering coefficient (µs’) spectra from 550 to 1000 nm, and a total of 12 groups (3 maturity levels * 4 detection times) were used to assess changes in µa and µs’ resulting from bruising. Maturation and bruising both caused a decrease in µs’ and an increase in µa, and the optical properties of immature peaches changed more after bruising than the optical properties of ripe peaches. Four hours after bruising, the optical properties of most samples were significantly different from those of intact peaches (p < 0.05), and the optical properties showed damage to tissue earlier than the appearance symptoms observed with the naked eye. The classification results of the Support Vector Machine model for bruised peaches showed that μa had the best classification accuracy compared to μs′ and their combinations (µa × µs’, µeff). Overall, based on μa, the average detection accuracies for peaches after bruising of 0 h, 4 h, and 24 h were increased.

1. Introduction

Peaches are popular due to their tender texture, appealing flavor, and abundant nutrients [1]. However, due to their thin skin and soft flesh, peaches are easily bruised during postharvest processes, such as harvesting, handling, transporting, and sorting, which have been identified as a major source of reduced fruit quality [2]. The presence of bruising accelerates physiological processes that lead to senescence and spoilage, resulting in a loss of profits for the entire fruit industry [3]. Depending on the extent of damage, it may take up to 12 h for the presence of bruises to become visible, which means that affected produce may not be detected until it reaches the retail store or consumer [4]. In addition, the peel of a peach is composed of multiple colors, part of the skin is dark red, and the pulp that causes internal bruises cannot be detected by the naked eye. Therefore, in the processes of sorting, grading, and sales, the ability to effectively distinguish intact from bruised peaches is of great significance for reducing economic losses.
To date, optical techniques (i.e., multichannel hyperspectral/multispectral imaging, near-infrared spectroscopy) and some other non-destructive technology have been extensively reported and used for the detection of fruit quality [5,6]. Preliminary studies have also demonstrated that these optical technologies can identify underneath bruising in apple [7], blueberry [8,9], avocado [10], and peach [11]. These optical techniques rely on measuring reflected or transmitted light, which is dependent on the system constitute, probe design, lighting setup, and other factors [6]. In optics, fruit is a turbid medium; when the fruit is completely exposed to a light source, the outer surface reflects approximately 4% of the incident light, and the remaining incident energy is transmitted through the surface into the cell structure, and then scattered by small tissue interfaces or absorbed by cellular constituents [2,12,13]. The attenuation of light in turbid tissue is the result of absorption and scattering by the tissue and is represented by the absorption (μa) and reduced scattering (μs′) coefficients [14]. The researcher reported that the absorption and scattering parameters of fruit tissues are related to the material composition and cellular microstructure [15]. However, no studies have been conducted on the effects of peach bruising on optical properties; and it has not been well understood the relationship between the optical properties and the various quality parameters of peaches during bruising.
In the last decade, some studies have been conducted to investigate the effect of bruises on the optical properties of the fruit. Gao et al. [13] investigated the absorption coefficient (μa) and the reduced scattering coefficient (μs′) of kiwifruit flesh by using an integrating sphere system at 950–1650 nm 16 days after bruising. The results showed that μs′ first decreased and then increased, while μa showed no significant difference resulting from bruising. Lu, Cen, Huang, and Ariana [16] reported that the reduced scattering coefficient of normal apples was much higher than that for bruised apples as shown by spatially resolved hyperspectral scattering images, and it decreased consistently with time after bruising. He et al. [17] developed a spatial frequency domain imaging system (SFDI) to measure the optical parameters of bruised pear, and this method showed perfect results for detecting bruised pears. It can be seen that the changes in optical parameters observed due to bruising in those studies are not the same because the studies use different fruits, detection systems, and sampling methods. However, researchers have not been explored how the optical properties of peaches would change following different periods after bruising. In addition, studies have shown that the maturity of the fruit has a strong influence on the severity of bruise damage [18]. It is important to assess the impact of maturity and the time after bruising on optical properties. Such a report will allow the researcher to understand the complex relationships between quality parameters and optical properties of peach during damage and thus help us improve detection equipment and recognition algorithms.
The aims of this research were therefore to (1) evaluate the effects of maturity stages and detection time points on the optical performance of bruised peach; (2) measure and calculate the reduced scattering and absorption properties of bruised peach; (3) quantify the changes in peach quality parameters (cell structure and color) over time after bruising; and (4) discriminate the bruised peaches with three maturity levels based on the measured μa and μs′.

2. Materials and Methods

2.1. Sample Collection

The peaches (cultivar of "Redstar") were hand-picked from the orchard of Southwest Research and Extension Center of Michigan State University (Benton Harbor, MI, USA). The pulp of this cultivar was light yellow, while the peel had mixed yellow-red colors unevenly distributed over the surface [19]. After picking, the peaches were transported to the laboratory immediately and placed in the freezer for further research. The sample-set included 330 peaches from three maturity stages assigned based on fruit firmness by an acoustic firmness sensor (AWETA, Nootdorp, The Netherlands), with 110 fruits for each stage (S1: stage 1, acoustic firmness >30, relatively immature; S2: stage 2, acoustic firmness 20–30, commercially ripe; S3: stage 3, acoustic firmness <20, over-ripeness). Among each set, 100 peaches were used for the detection of their optical properties and the remaining 10 peaches were used for the destructive detection of their microstructures. Before the bruising test, peaches from each stage were analyzed as the intact group. After bruising, the samples were analyzed again at three times to monitor the process of bruising: 0 h after bruising, 4 h after bruising, and 24 h after bruising. The bruising tests of peach were manually performed using a wooden ball weighing 161 g with a 74 mm diameter, and the impact energy is changed by adjusting the drop height of the wooden ball. The ball hit the peaches at the equatorial area, as shown in Figure 1. In this research, the impact energy was 0.4 J with a fixed falling height of about 22 mm, which could not clearly observe the damage immediately after bruising. A detailed description of the impact test is given in Zhu et al. [20]. Therefore, there were a total of 12 groups in this research (3 maturity levels × 4 detection times), and the samples were defined as shown in Table 1, each group contained 100 samples.

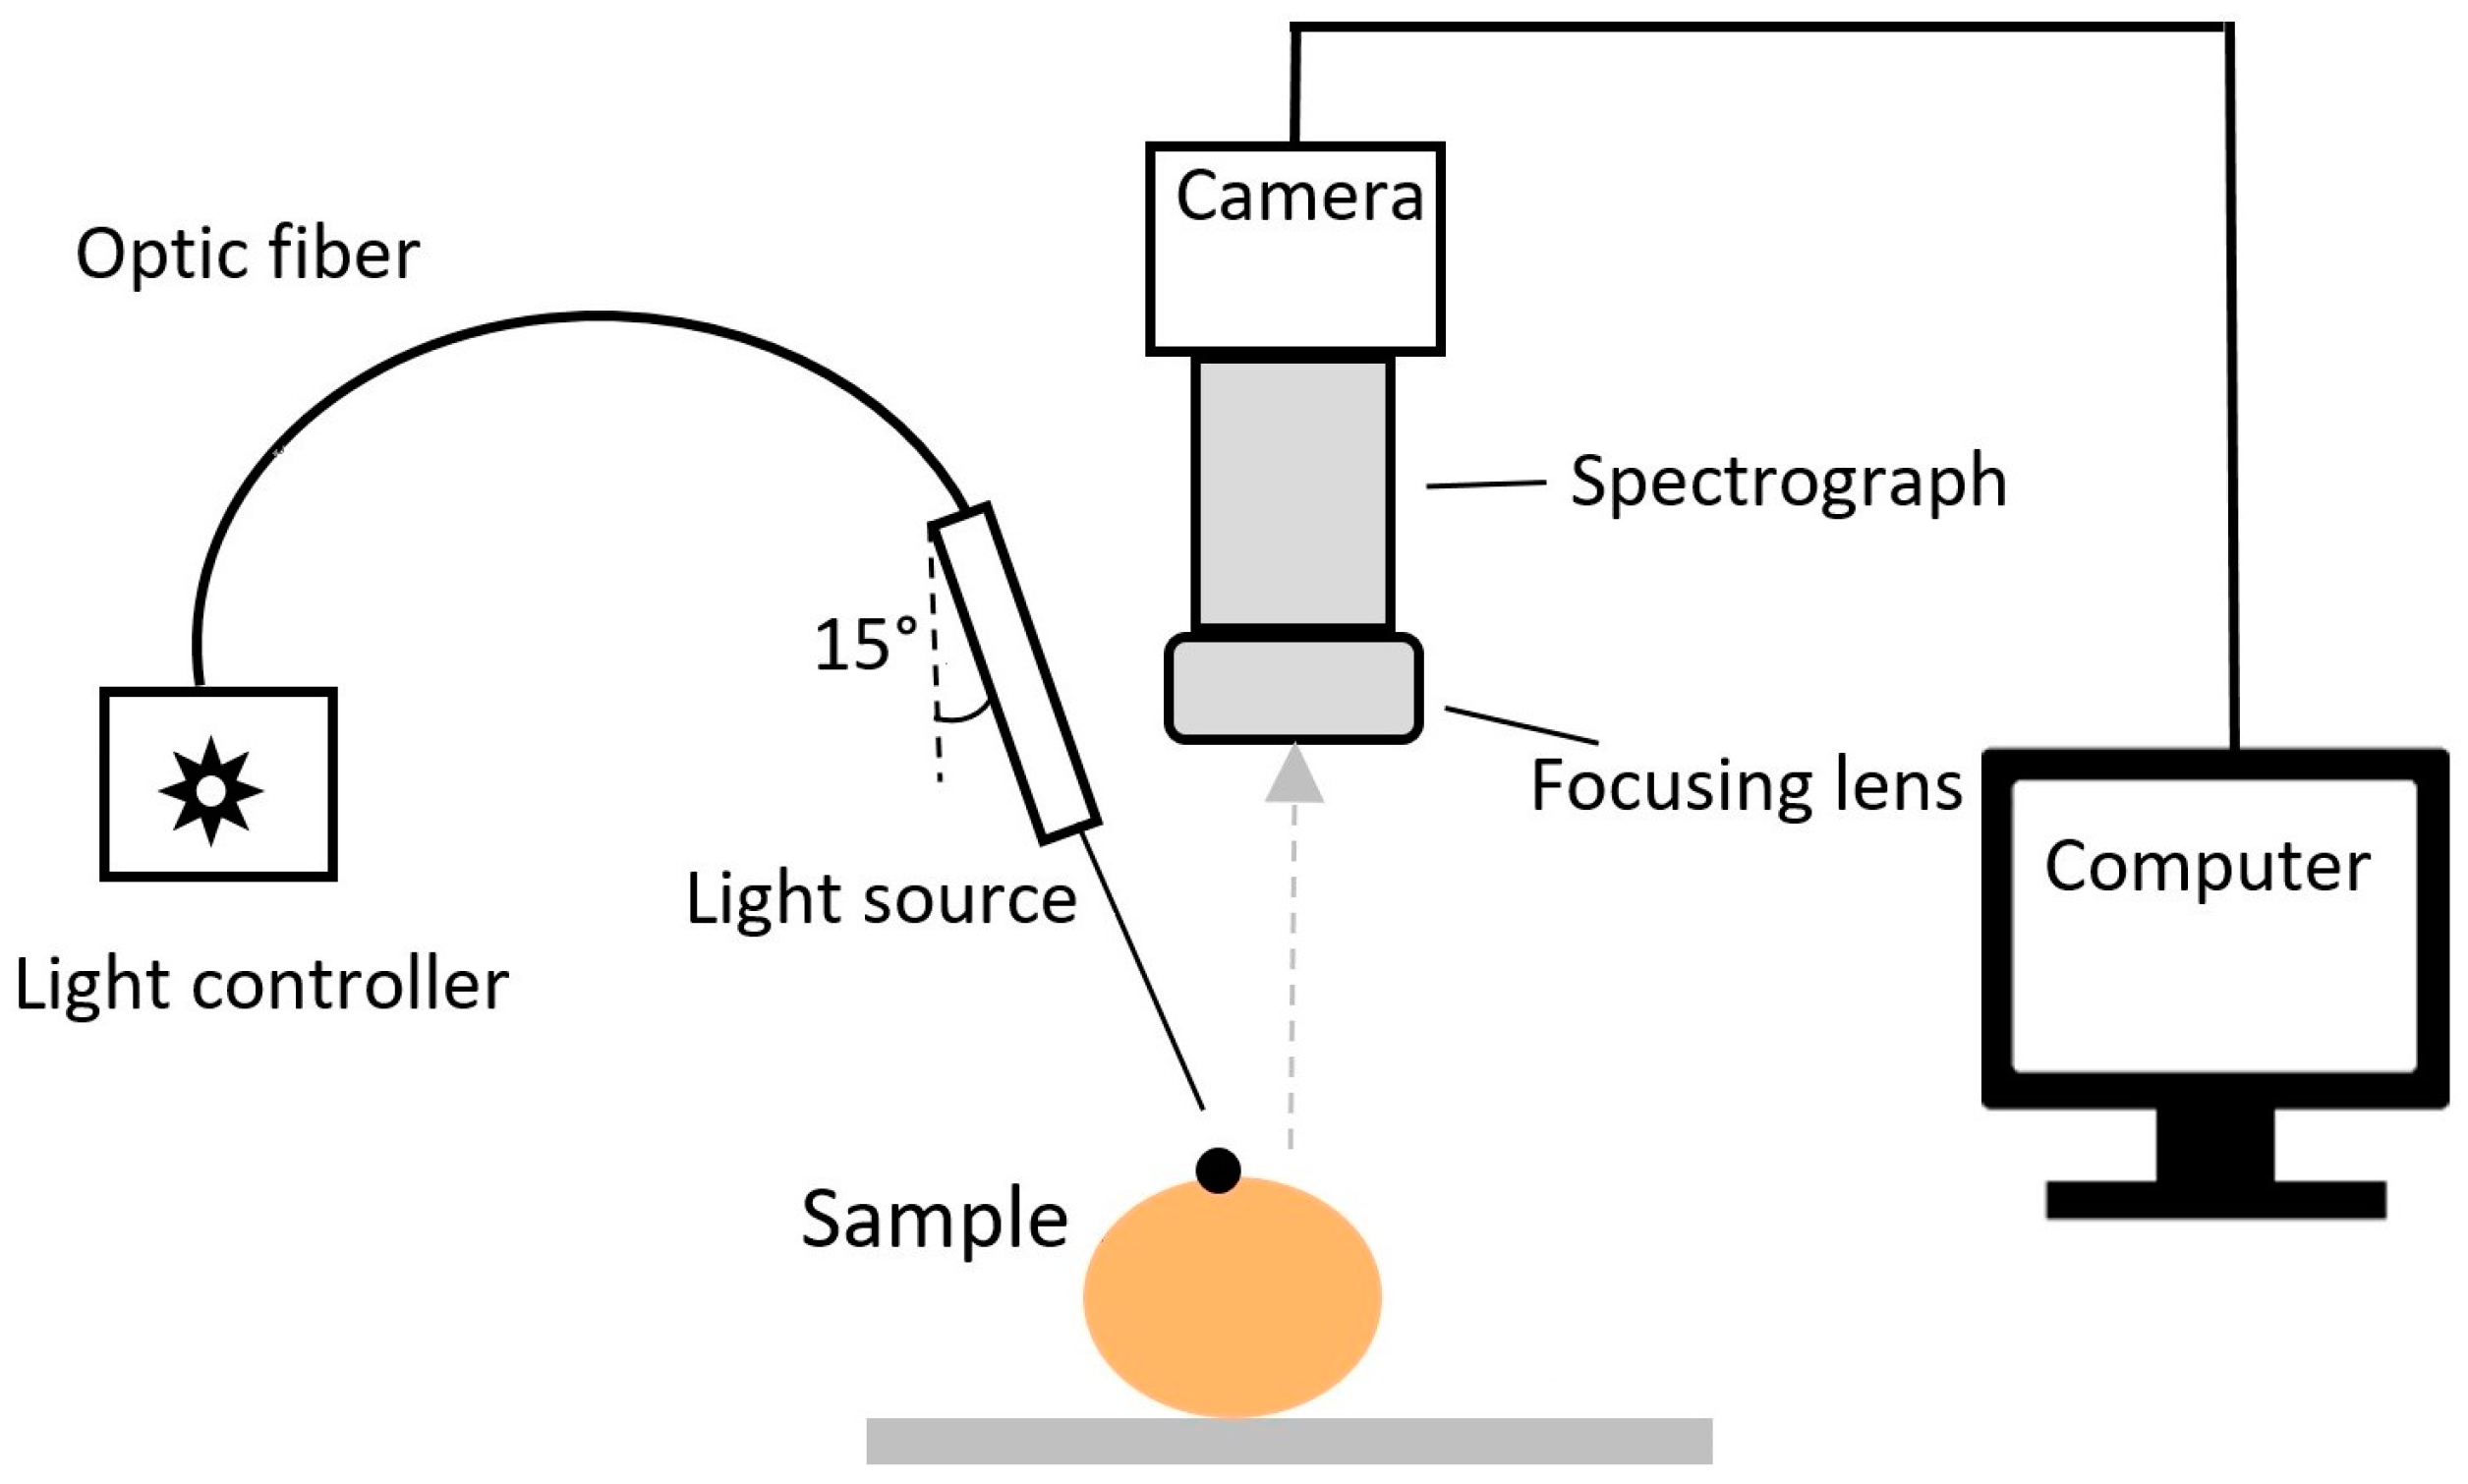
2.2. Image Acquisition and Pre-Processing

The optical properties of the fruit samples were measured based on the principle of spatially resolved spectroscopy. A detailed description of the principle and parameters of the instrument is given in Cen and Lu [21] and Sun et al. [6]. Figure 2 shows the scheme of a bench-top optical property measurement prototype that was developed in-house based on the spatially resolved spectroscopic principle and coupled with a hyperspectral imaging technique in line-scanning mode to measure the optical properties of the fruit [15,19]. Peaches from each group were measured using this system (Figure 2).

2.3. Color Measurement

There is no significant change in the appearance of early bruises, therefore, it is difficult to distinguish the early bruised peach by the naked eye. Hence, a digital colorimeter (CR-400, Konica Minolta Sensing, Inc., Tokyo, Japan) was used for color measurements of pulp and peel of peaches by Lab color model. L, a, b represents Luminosity (value ranges from 0 to 100), the range from magenta to green (value ranges from +127 to −128), the range from yellow to blue (value ranges from +127 to −128), respectively. For the same maturity stage, changes in the peel color reflect the external changes during bruise, and the flesh color reflects the real internal bruise information. After the optical property measurements, the surface color was measured in the bruised area by the digital colorimeter. The diameter of the measurement area and the illumination area of CR-400 were Φ8 mm and Φ11 mm, respectively, and the sample was tested at a standard observation angle of 2°. After calibration, the superficial bruised area of each fruit was measured 3 times, and the averaged values of three measurements were collected for further analysis. Twenty-four hours after bruising, the pulp color was measured after removing a layer of the peel of approximately 5 mm thickness, and the diameter of the bruised area was measured using a Vernier caliper.

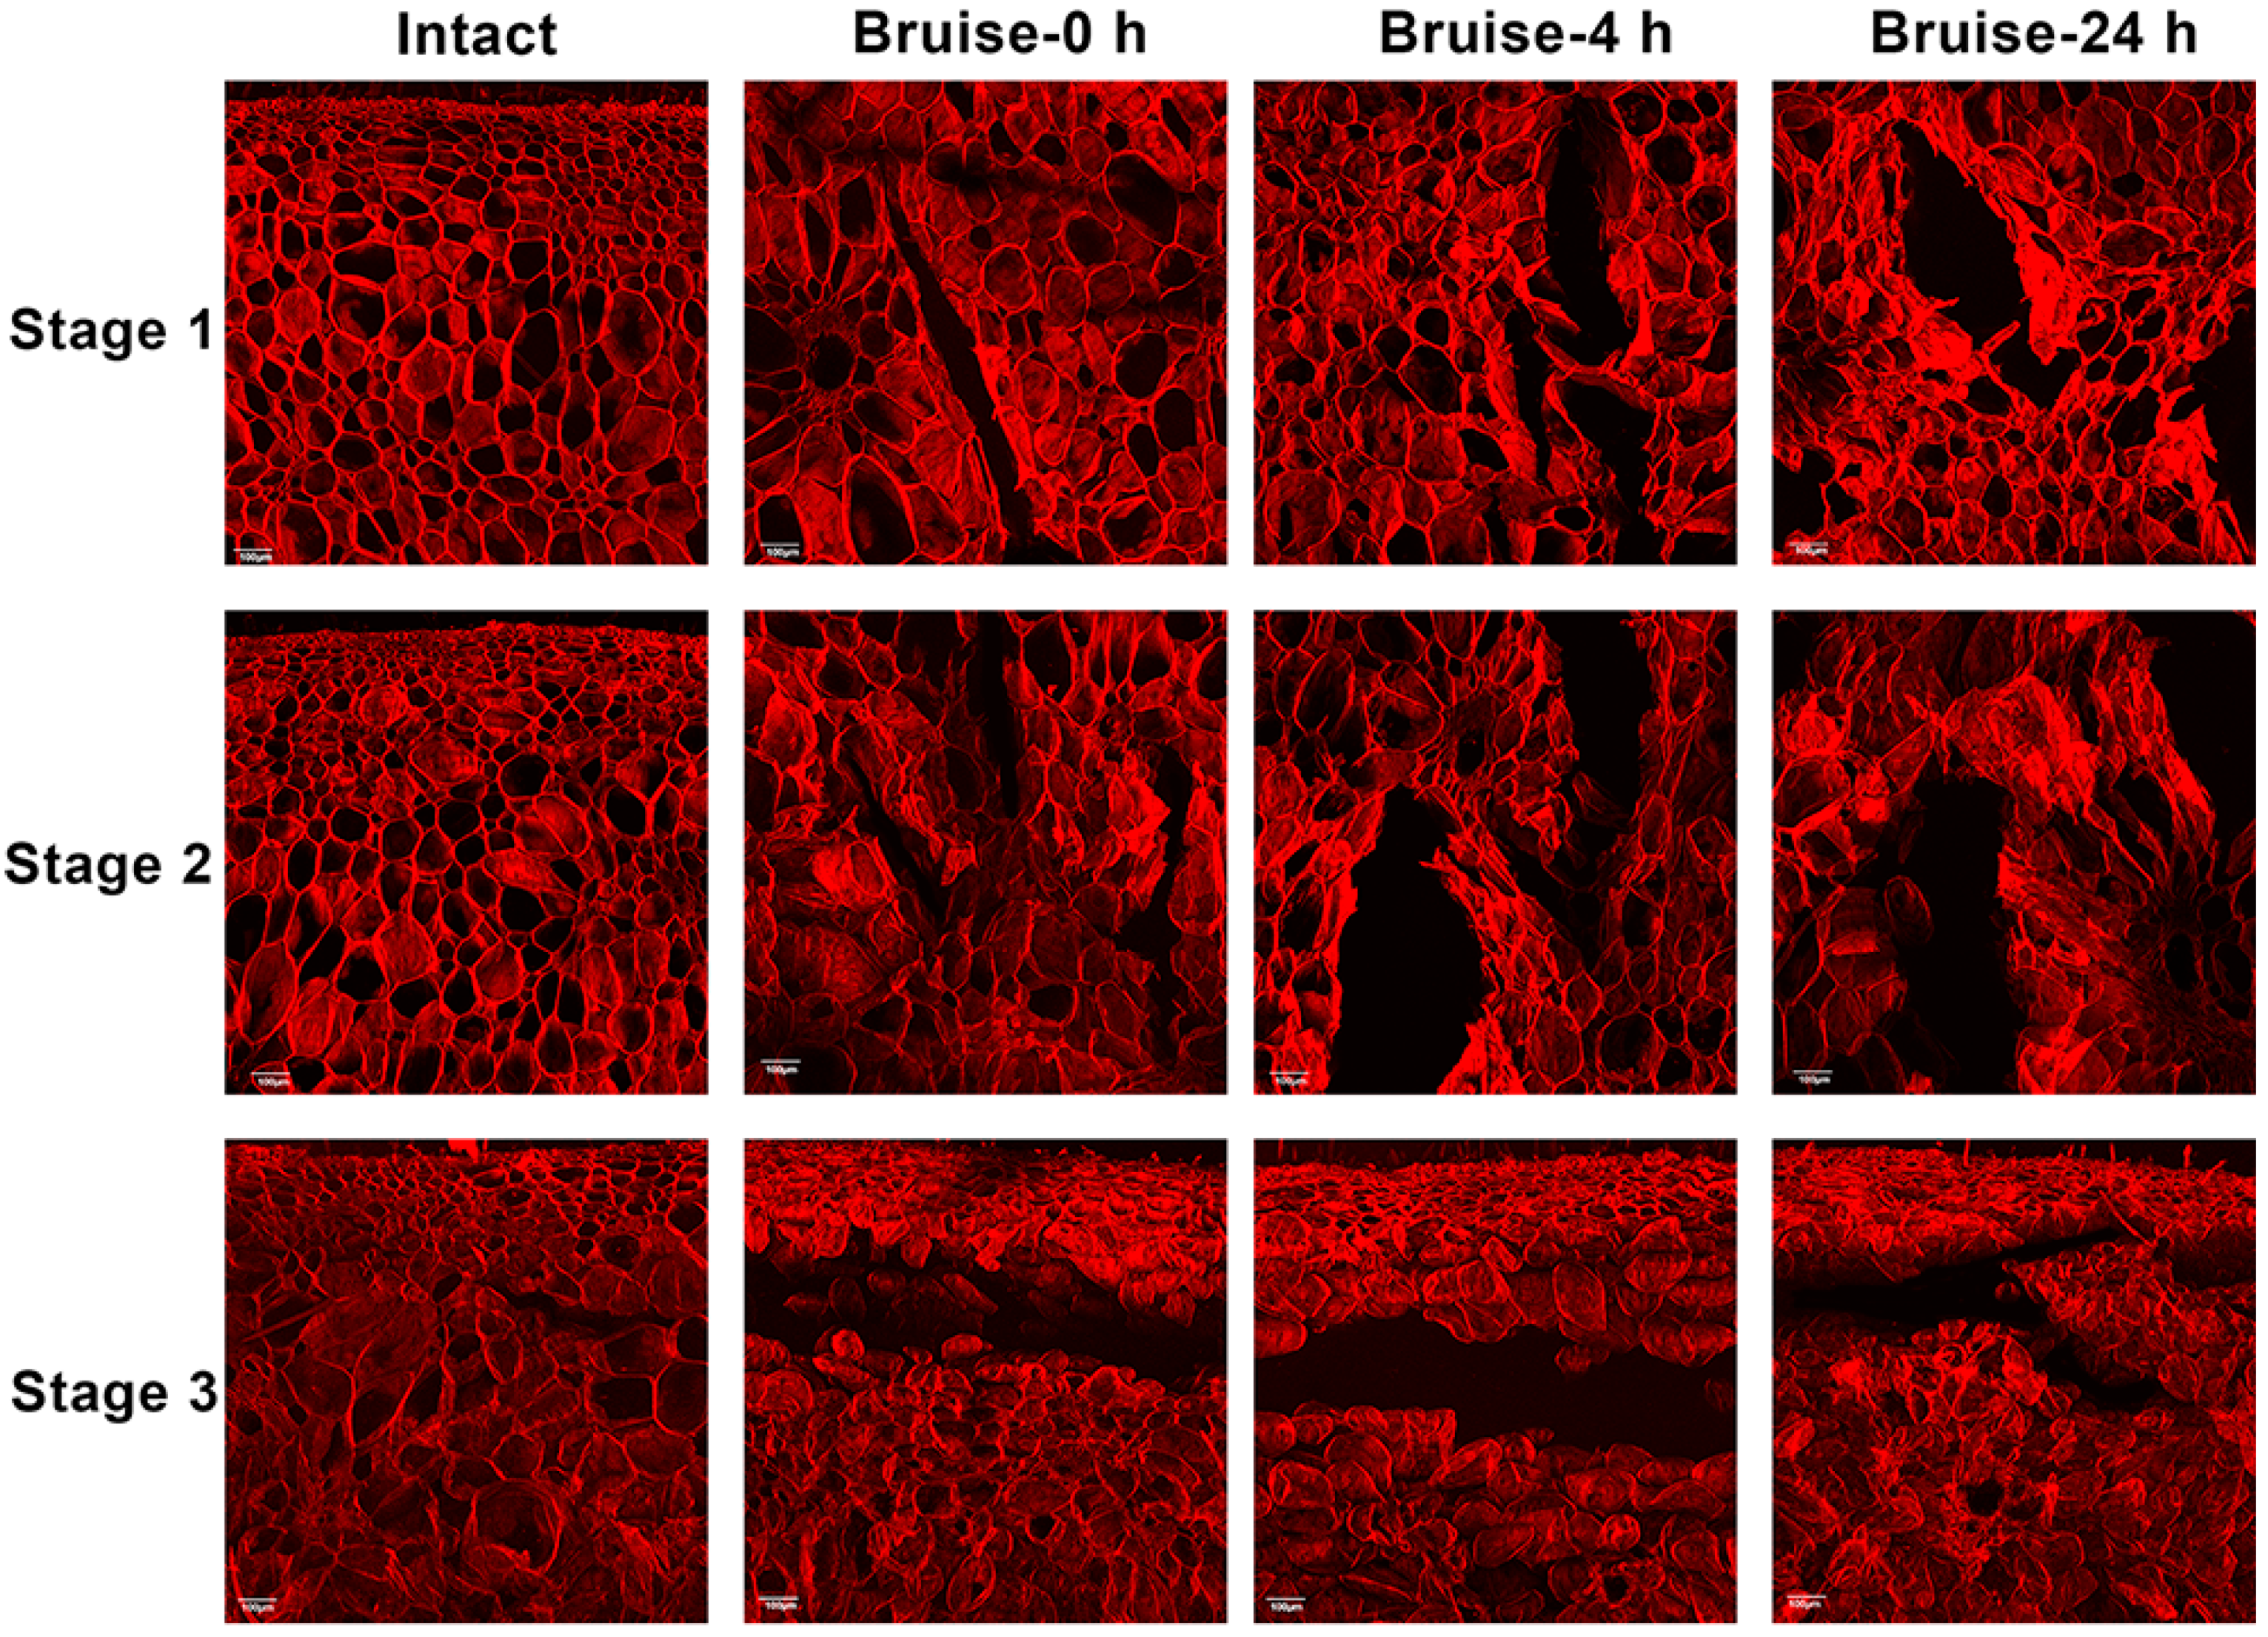
2.4. Microstructural Analysis

Three fruits from each detection time point of each maturity level were randomly selected for microstructural analysis. Microscopy analysis was conducted on the pulp specimens to observe the microstructural damages of bruises at different maturity levels and detection time stages by Confocal laser scanning microscopy (CLSM, Olympus Fluo View 1000 LSM, Olympus America Inc., Center Valley, PA, USA). CLSM enables us to view a single layer of tissue cells and reduces noise from adjacent layers of cells. Tissue specimens for CLSM were cut from the outer cortex of peaches approximately 10 mm away from the skin.

2.5. Data Processing and Analysis

Analysis of variance (ANOVA) and least significant difference (LSD) test was performed on the quality parameters (bruise area, surface color, and pulp color) and optical properties (μs′ & μa) of the peaches at different maturity levels and detection times using SPSS 18.0 Statistics software, which allowed the evaluation of the parameters changes during the bruising. The level of p < 0.05 was found significant in all analyses. Bruised fruit were classified by a support vector machine (SVM) and partial least squares discriminant analysis (PLSDA) model using MATLAB 2017a software (The MathWorks, Inc., Natick, MA, USA) based on the optical properties (μs′ and μa) as well as their combinations (i.e., µa, µs’, µa × µs’, & µeff = [3µaa + µs’)]1/2). The autoscale were applied for data preprocessing of optical properties before modeling. In this research, the type of C-Support Vector Classification (C-SVC) algorithm were adopted, and the radial basis function was selected for kernel type. The calibration was conducted using two-thirds of the samples in a group, and the remaining samples were used for validation.

3. Results and Discussion

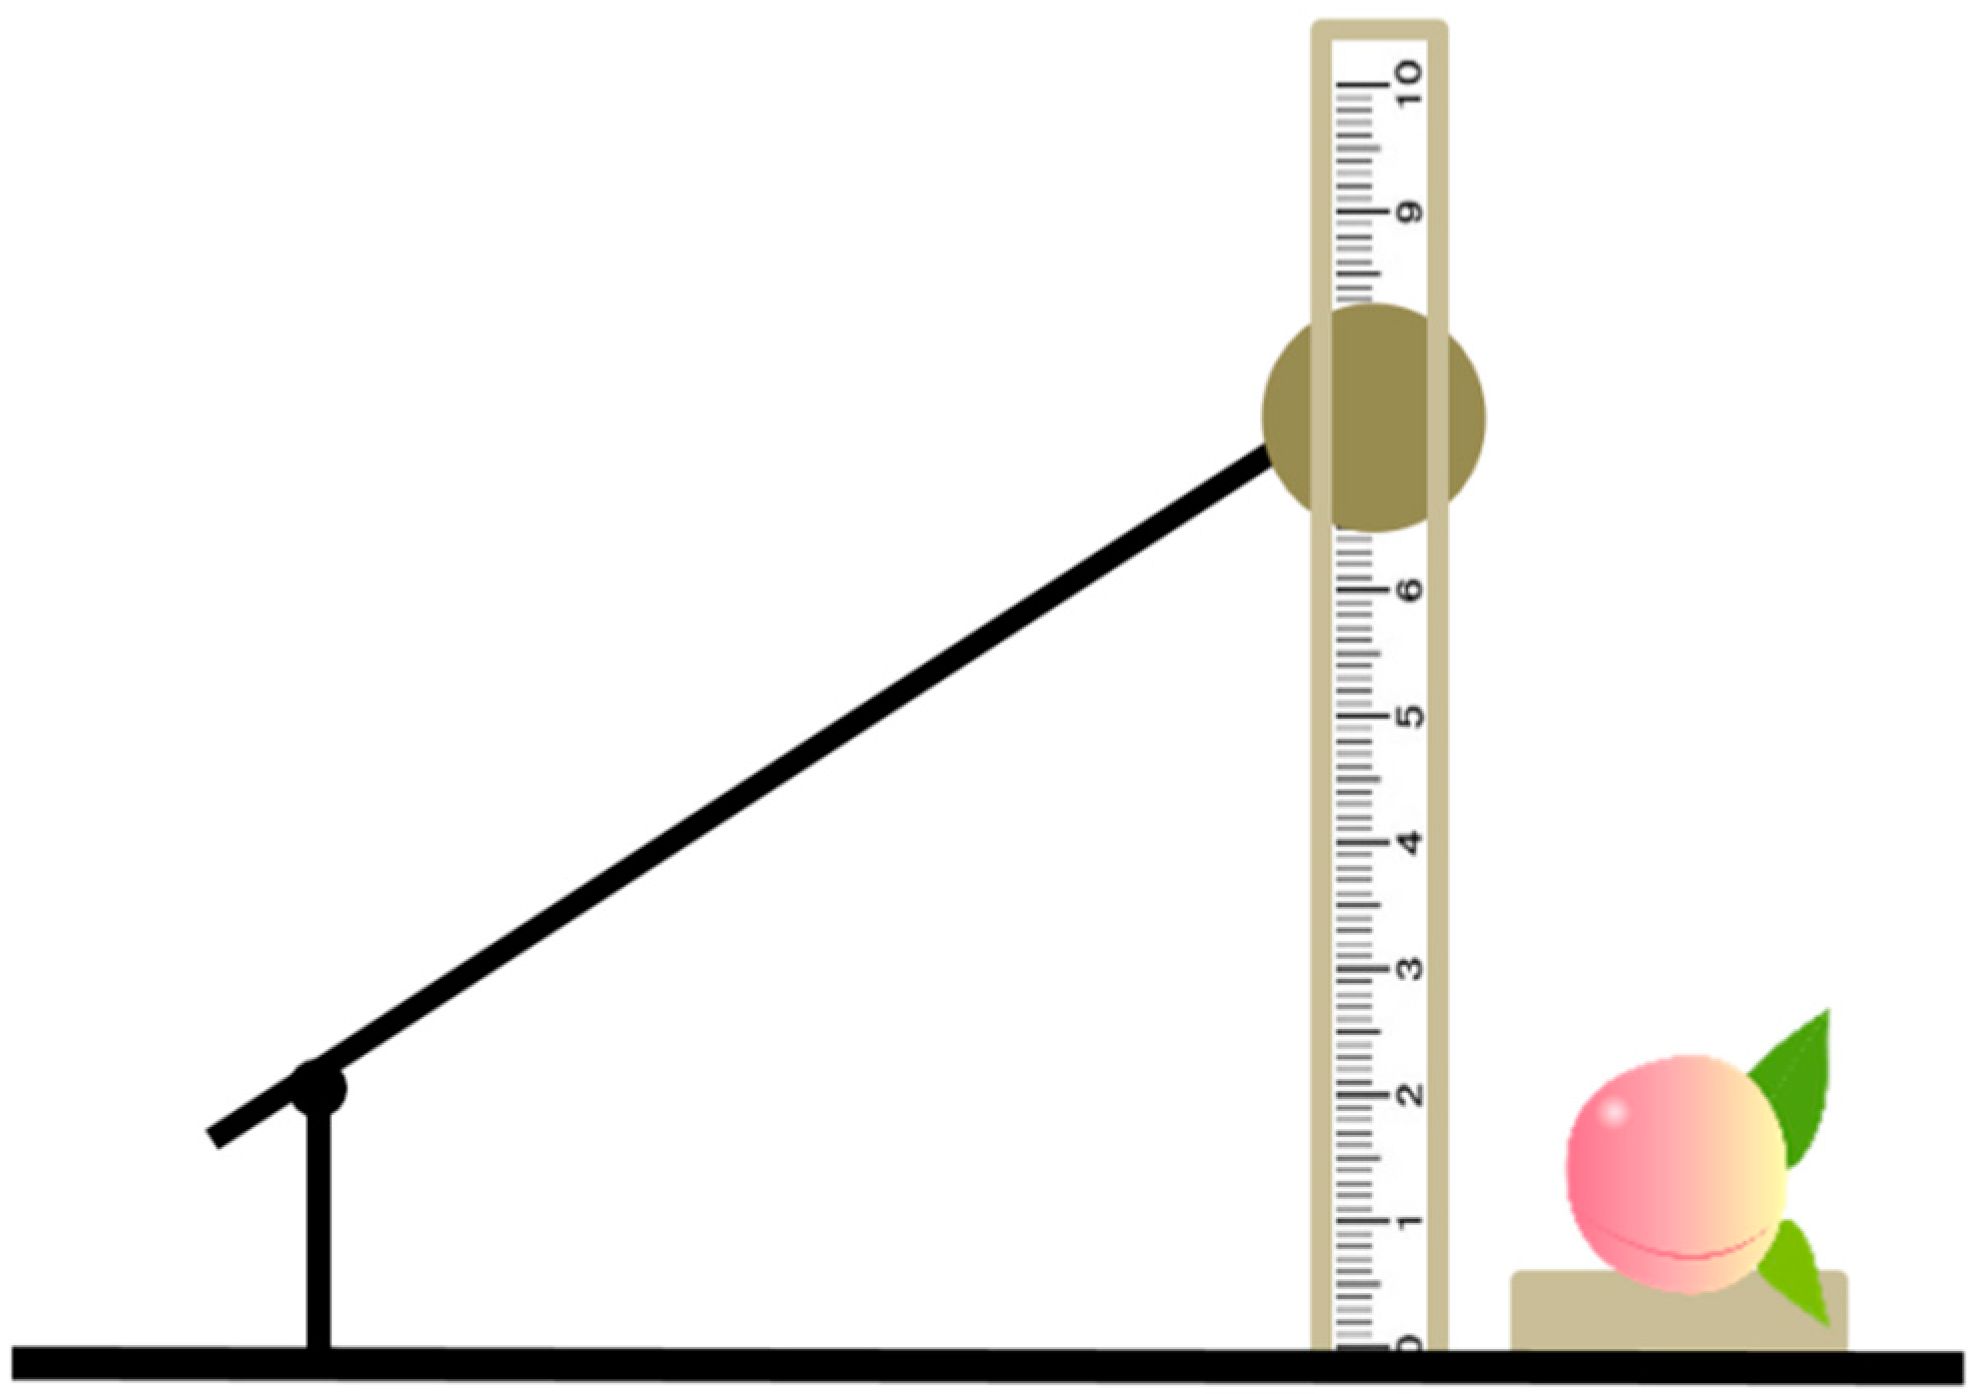
3.1. Quality Parameter of Bruised Peaches

Changes in the color values of the peel and pulp for different groups of peaches are shown in Table 2. As bruises on peaches are mainly a brown discoloration, the lightness value of L* in the Lab color space is used to represent the color change caused by bruising. Groups 1–3 represent the intact sample at three maturity levels, the peel lightness slightly decreased with the peaches matured, but the only significant difference was found between group 1 and group 3. The peel colors of groups 4–6, 7–9, and 10–12 represent the colors of three maturity stages at each of three time periods (0, 4, and 24 h) after bruising. The lightness decreased over time following bruising as shown in Table 2. But the decrease in lightness not only comes from the browning after bruising but also from the ripening of the fruit. There was no significant difference between immature-S1 and commercially ripe-S2 ones both for intact and early bruised peaches between the following groups: 1 and 2, 4 and 7, 5 and 8, 6 and 9. In other words, for the immature and commercially ripe peaches, it is difficult to distinguish the bruising area from the appearance. For the S3 overripe peaches, the surface skin color was significantly different between the intact group and the corresponding bruised group after 24 h, and the lightness decreased greatly, indicating serious browning. In the early stage after bruising (0, 4 h), most of the skin color was only slightly different from that of intact samples, which means that it is difficult to detect the difference in appearance at the early stage of bruising. Compared with the peel color, pulp had higher L* values for all maturity levels, and the color of the pulp can better express the degree of bruising because the color of pulp is generally milky white and there are fewer interference factors. The color of pulp varied greatly, which means that peaches of different maturity levels suffer different damage when subjected to the same impact energy. The same conclusion can be drawn for the bruised area: the more mature the peach, the larger the bruise diameter (from 10.50 ± 42 mm to 20.37 ± 4.88 mm). The same results were reported in apple, tomato, and loquat; as ripening progresses, tissues lose their cohesion and membrane integrity and, consequently, stress due to impact damage overcomes the cell wall strength, causing bruising [3,22].
At an early bruised stage, it is difficult to directly observe bruising by the naked eye, but the damage to the cell microstructure is still significant. Therefore, the effects of maturity and detection time on peach bruising were observed by CLSM, and the images of peach pulp tissues from the twelve groups are shown in Figure 3. In intact tissue of peaches at maturity stages 1 and 2, the cells were arranged neatly and the cell membrane was smooth and intact. For intact tissue of overripe peaches at stage 3, the cell membrane was slightly shrunken, and loose connections were observed between cells. For the S1 samples, the cracks were neat, and the cells around the cracks were evenly distributed; as the time after bruising increased, the size of the cracks increased and the cell membrane shrank. In comparison, the S2 samples had larger cracks and more obvious shrinkage of the cell membrane. S3 samples were significantly different from the S1 and S2 samples, as shown in Figure 3. The cracks ran through the entire image, and the cells were severely shrunken. Moreover, due to the pectin degradation and water redistribution, the cell structure changed, indicating that the cells had aged. These results confirmed that bruising is a result of cell breakage, which is caused by stress and distortion of individual cells [3,23].

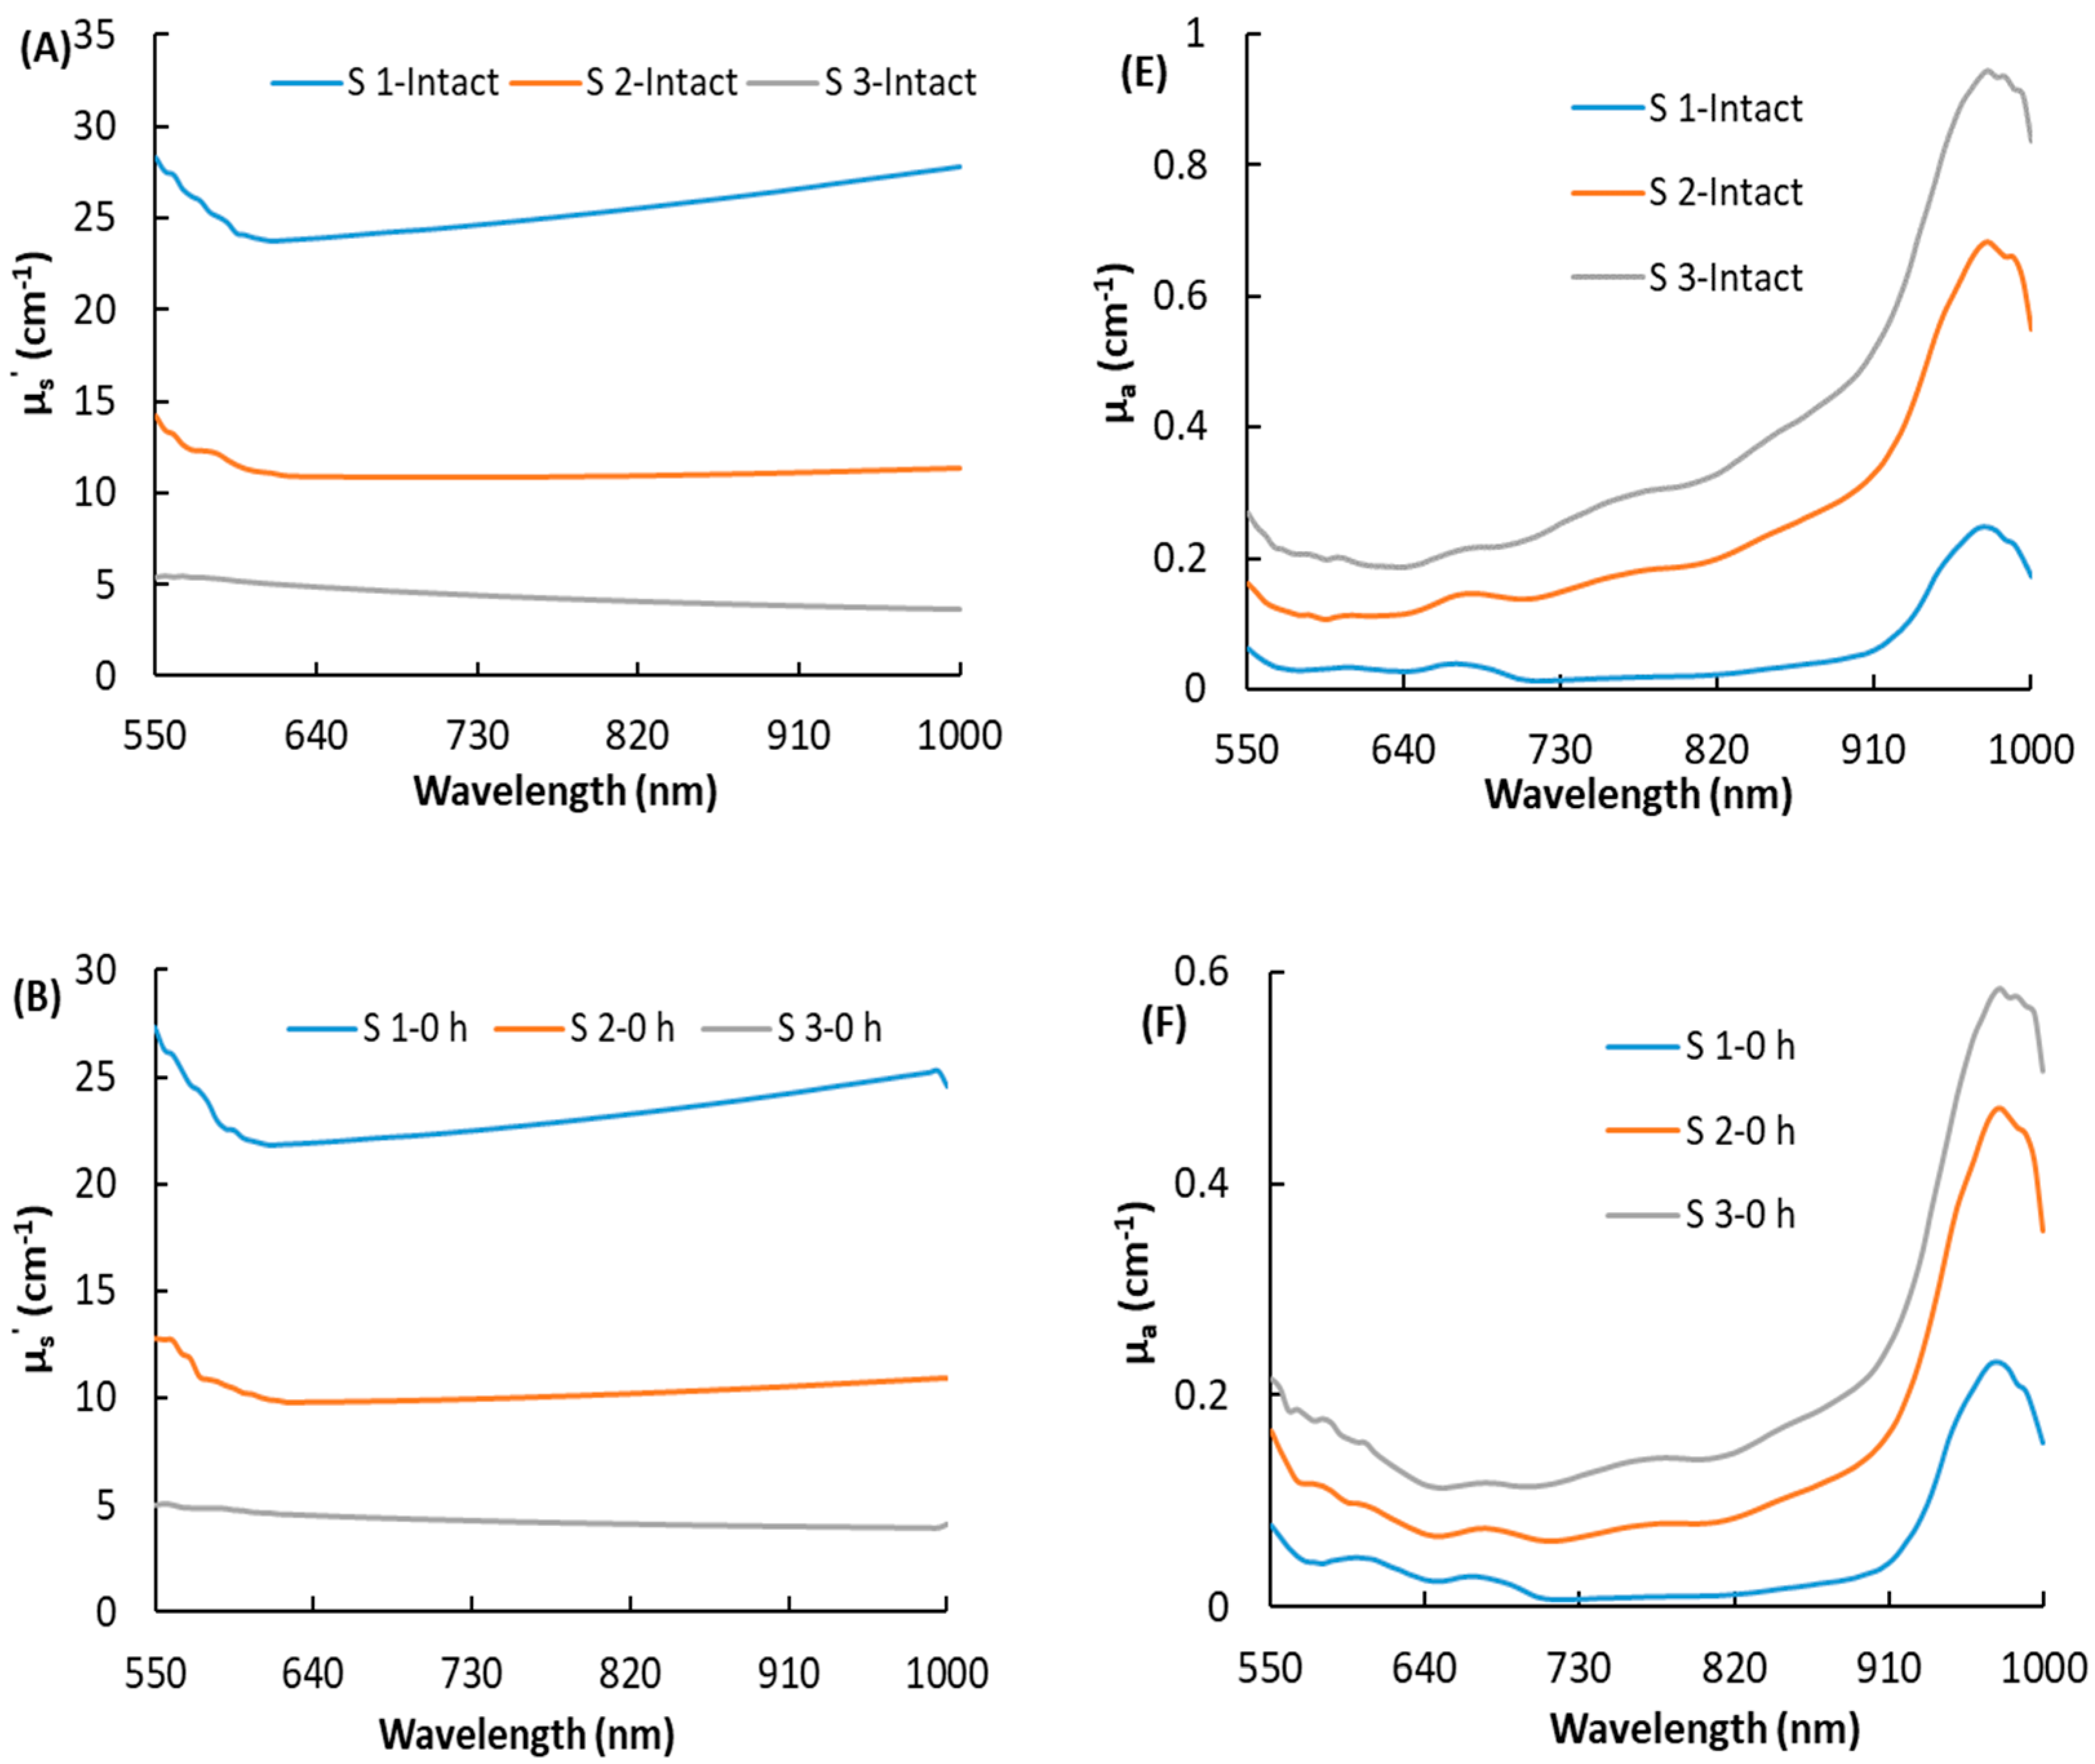
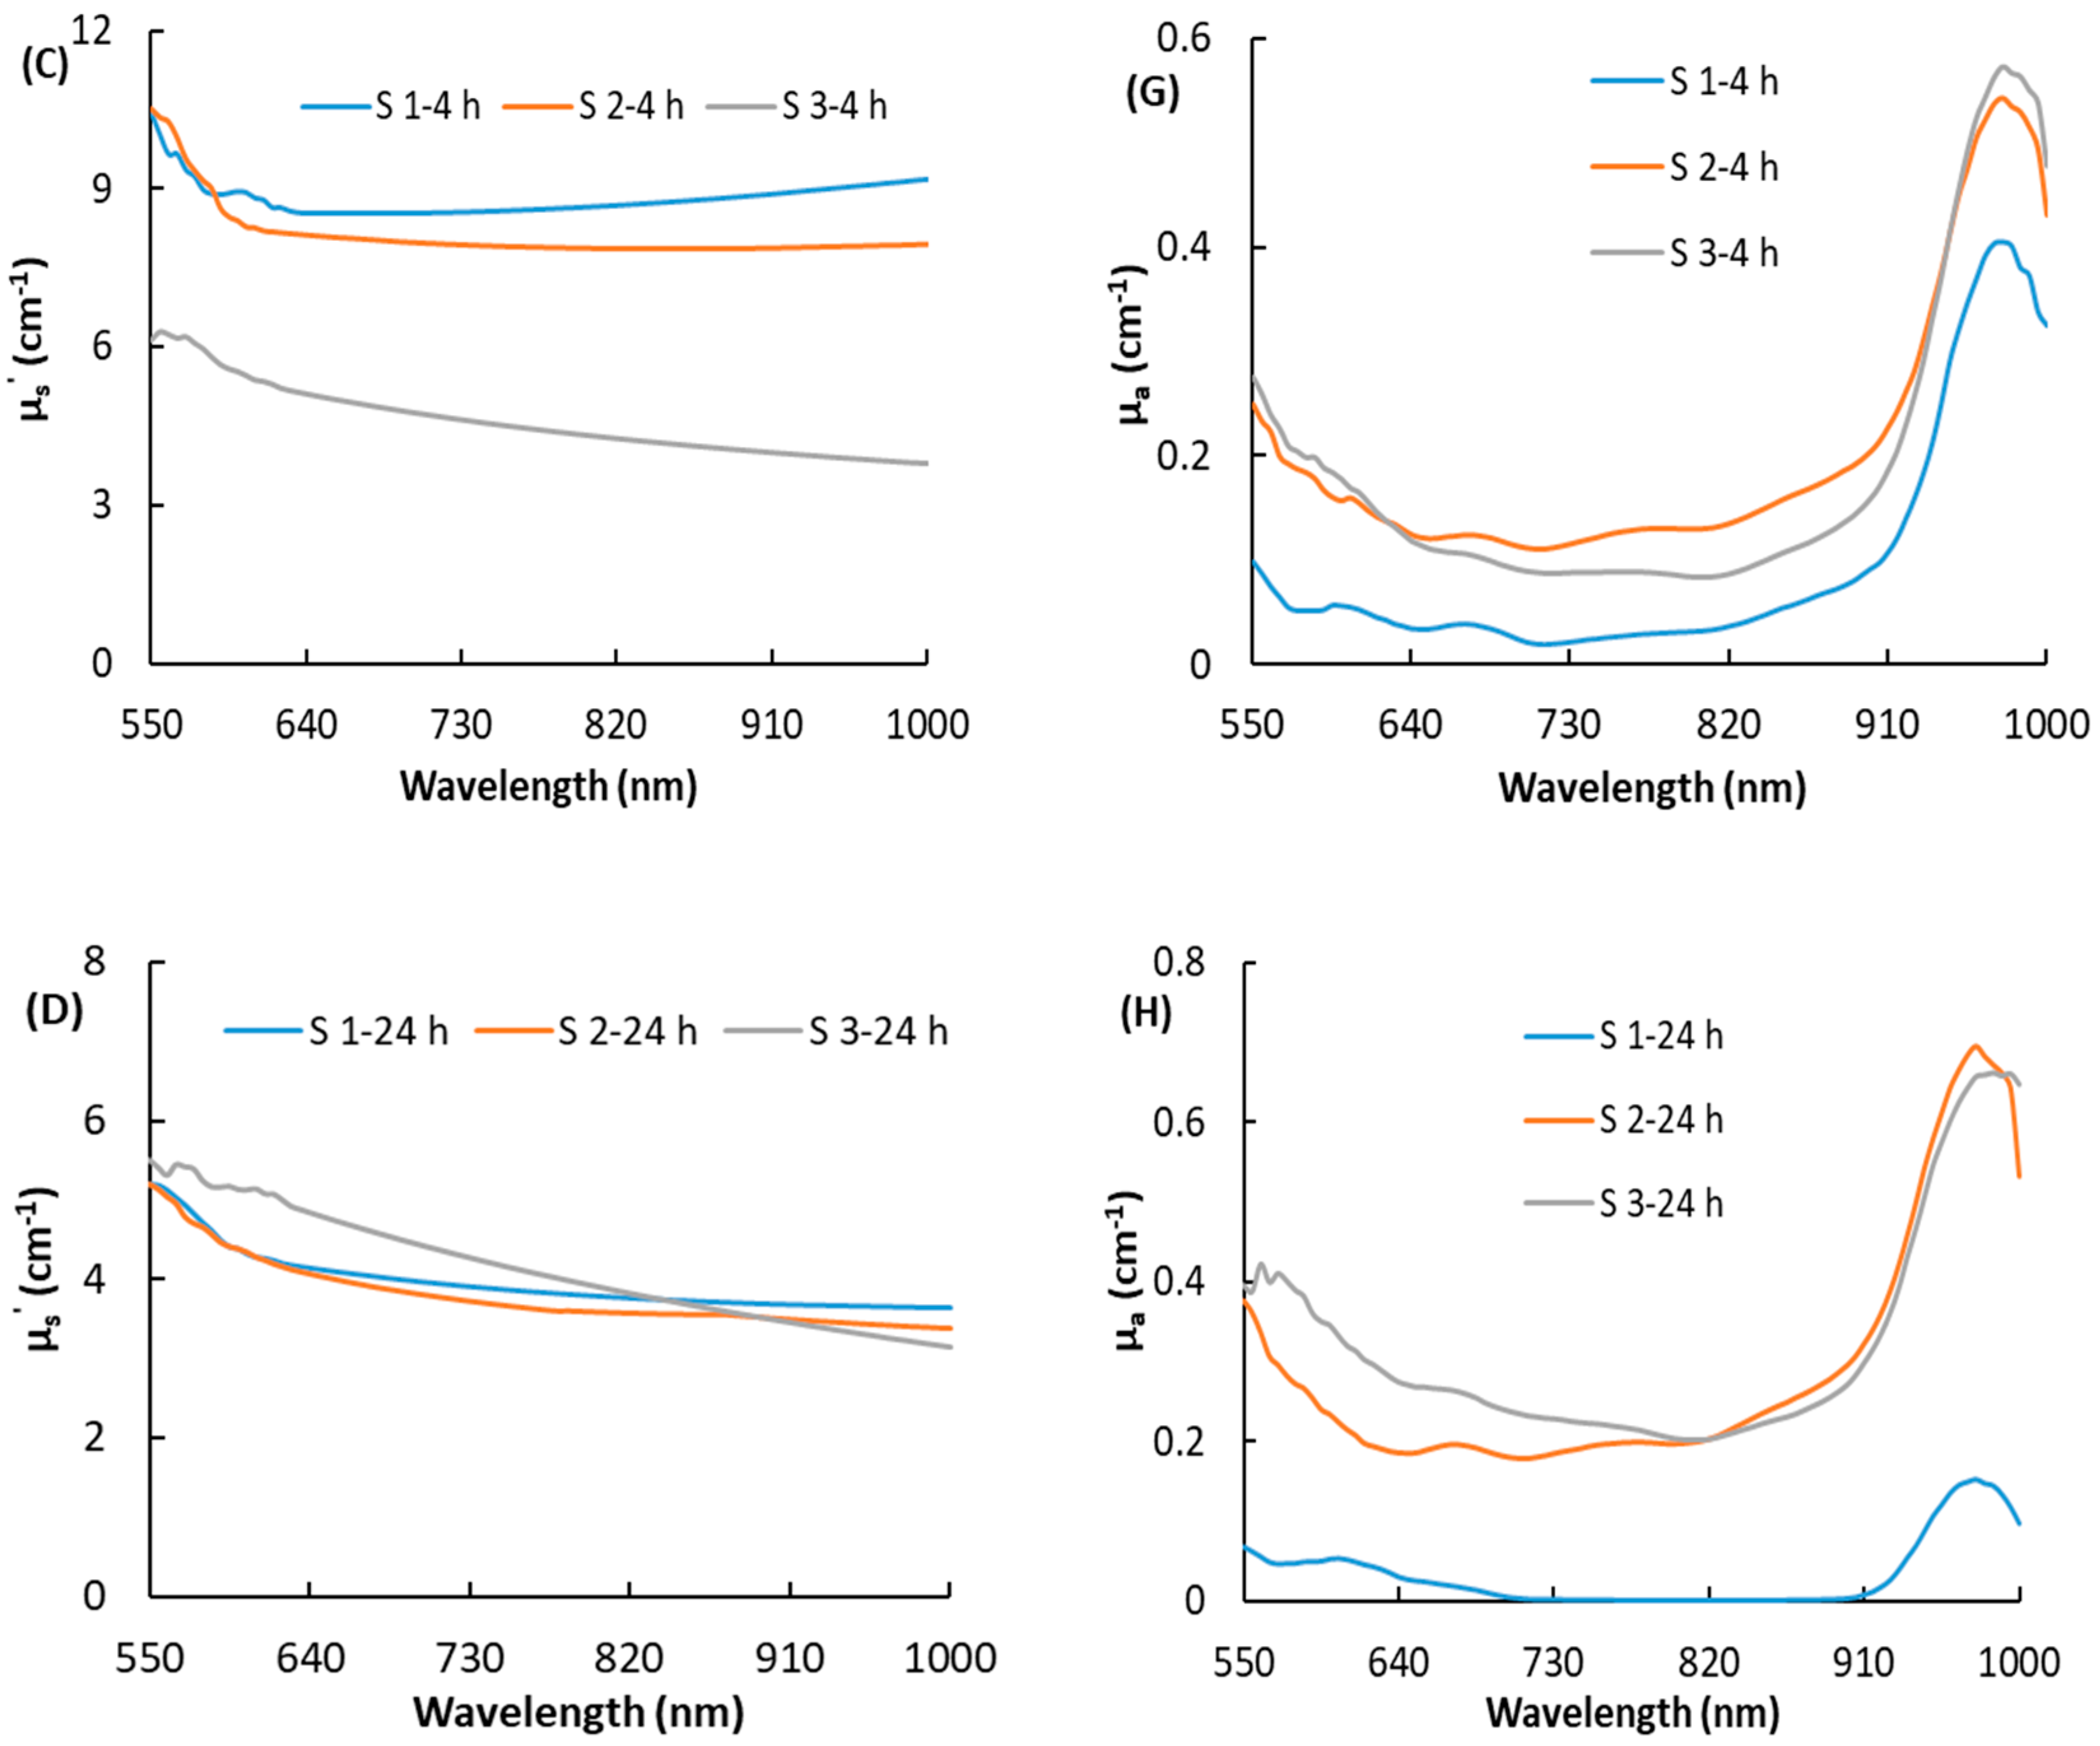
3.2. Optical Properties of Bruised Peaches

Figure 4 shows the effect of maturity on optical properties following different times after bruising. The μs′ curve decreased first and then flattened over 550–1000 nm with no characteristic peaks. For the immature peaches (S1), the μs′ value increased over 550–1000 nm, while for the overripe peaches (S3), the μs′ value decreased over 550–1000 nm. However, the changes in μs′ among the different maturity stages were still quite large; μs′ decreased as the peach matured. Different from μs′, the μa varies greatly with wavelength, and two absorption peaks were observed around 675 and 970 nm. The prominent peak at approximately 970 nm was ascribed to the second overtone O-H stretching from water [24]. However, the absorption peak at 675 nm, which was reported as the absorption of chlorophyll-a [19], was not obvious in this research. A possible explanation is that this ‘Redstar’ peach has a low chlorophyll-a content in the red skin. The changes in μa among the different maturity stages were opposite to the changes in μs′, in that μa gradually increased as the peach matured. It can be seen from Figure 4A, E that for the S1 samples, the values of μs′ were much larger than the values of μa, which means that the diffusion approximation equation is satisfied (μs′ >> μa). As peach overripeness or bruising occurs, they both cause tissue softening, leading to cell wall depolymerization, increased solubility of the gelatin layer, and separation of the cytoplasmic wall. At this time, μs′ rapidly decreased, and the assumption of scattering domination for the diffusion approximation equation may no longer be valid, which means that the calculated values of μa and μs′ may not accurately reflect the true values of the sample, the same results also reported in Cen et al. [14] and Sun et al. [6]. This is also a possible reason why the spectral curves of μa in Figure 4G,H were abnormal.
The means and standard errors for the optical properties of two characteristic wavelengths of 675 and 970 nm for the twelve groups of peaches as shown in Table 3. The chlorophyll is reported as an important index to evaluate fruit quality, when peach suffered from environmental adversity such as senescence, impact, or pathogen infection, the chlorophyll content declined [12,25]. In addition, with maturity, there is usually a gradual decrease in the strong absorption peak at 970 nm which is mainly due to water. Table 3 shows the changes in the optical characteristics of peaches during the bruising process, with S1 represented by groups 1, 4, 5, and 6; S2 by groups 2, 7, 8, and 9; and S3 by groups 3, 10, 11, and 12. For the S1 samples, in the first 0 h after bruising, there was a slight change in optical properties, and there was no significant difference between groups 1 and 4, except for μs′ at 970 nm. Four hours after bruising, there were significant differences in the optical parameters between bruised samples (group 5) and intact samples (group 1), but there were no significant differences in the peel color at this time, which show that optical properties can reflect tissue changes from bruising earlier than appearance symptoms can. Therefore, the optical properties have the potential to distinguish bruised peaches at the early stage. A similar conclusion was found for the S2 samples, in that the optical properties of intact samples (group 2) were significantly different from the optical properties of bruised samples 4 h and 24 h after bruising (groups 8 and 9). For the S3 samples, the μs′ of the intact samples (group 4) was reduced to a small value, and the changes in optical parameters were relatively small during the process of bruising, resulting in an insignificant difference between the groups. This may be due to the decreasing density of the scattering particles for an overripe peach, and the particle size may change due to the dissolution of pectin. According to the empirical formula (μs′ = aλ − b), the physical properties of these scattering particles are related to the scattering ability of fruit tissue, where the parameter "a" is proportional to the density of the scattering particles and "b" depends on the particle size [6]. Therefore, due to the decreasing of the density of the scattering particles and the increase of the size of scattering particles in the postharvest stage of ripening, softening, and bruising, μs′ would be expected to decrease.

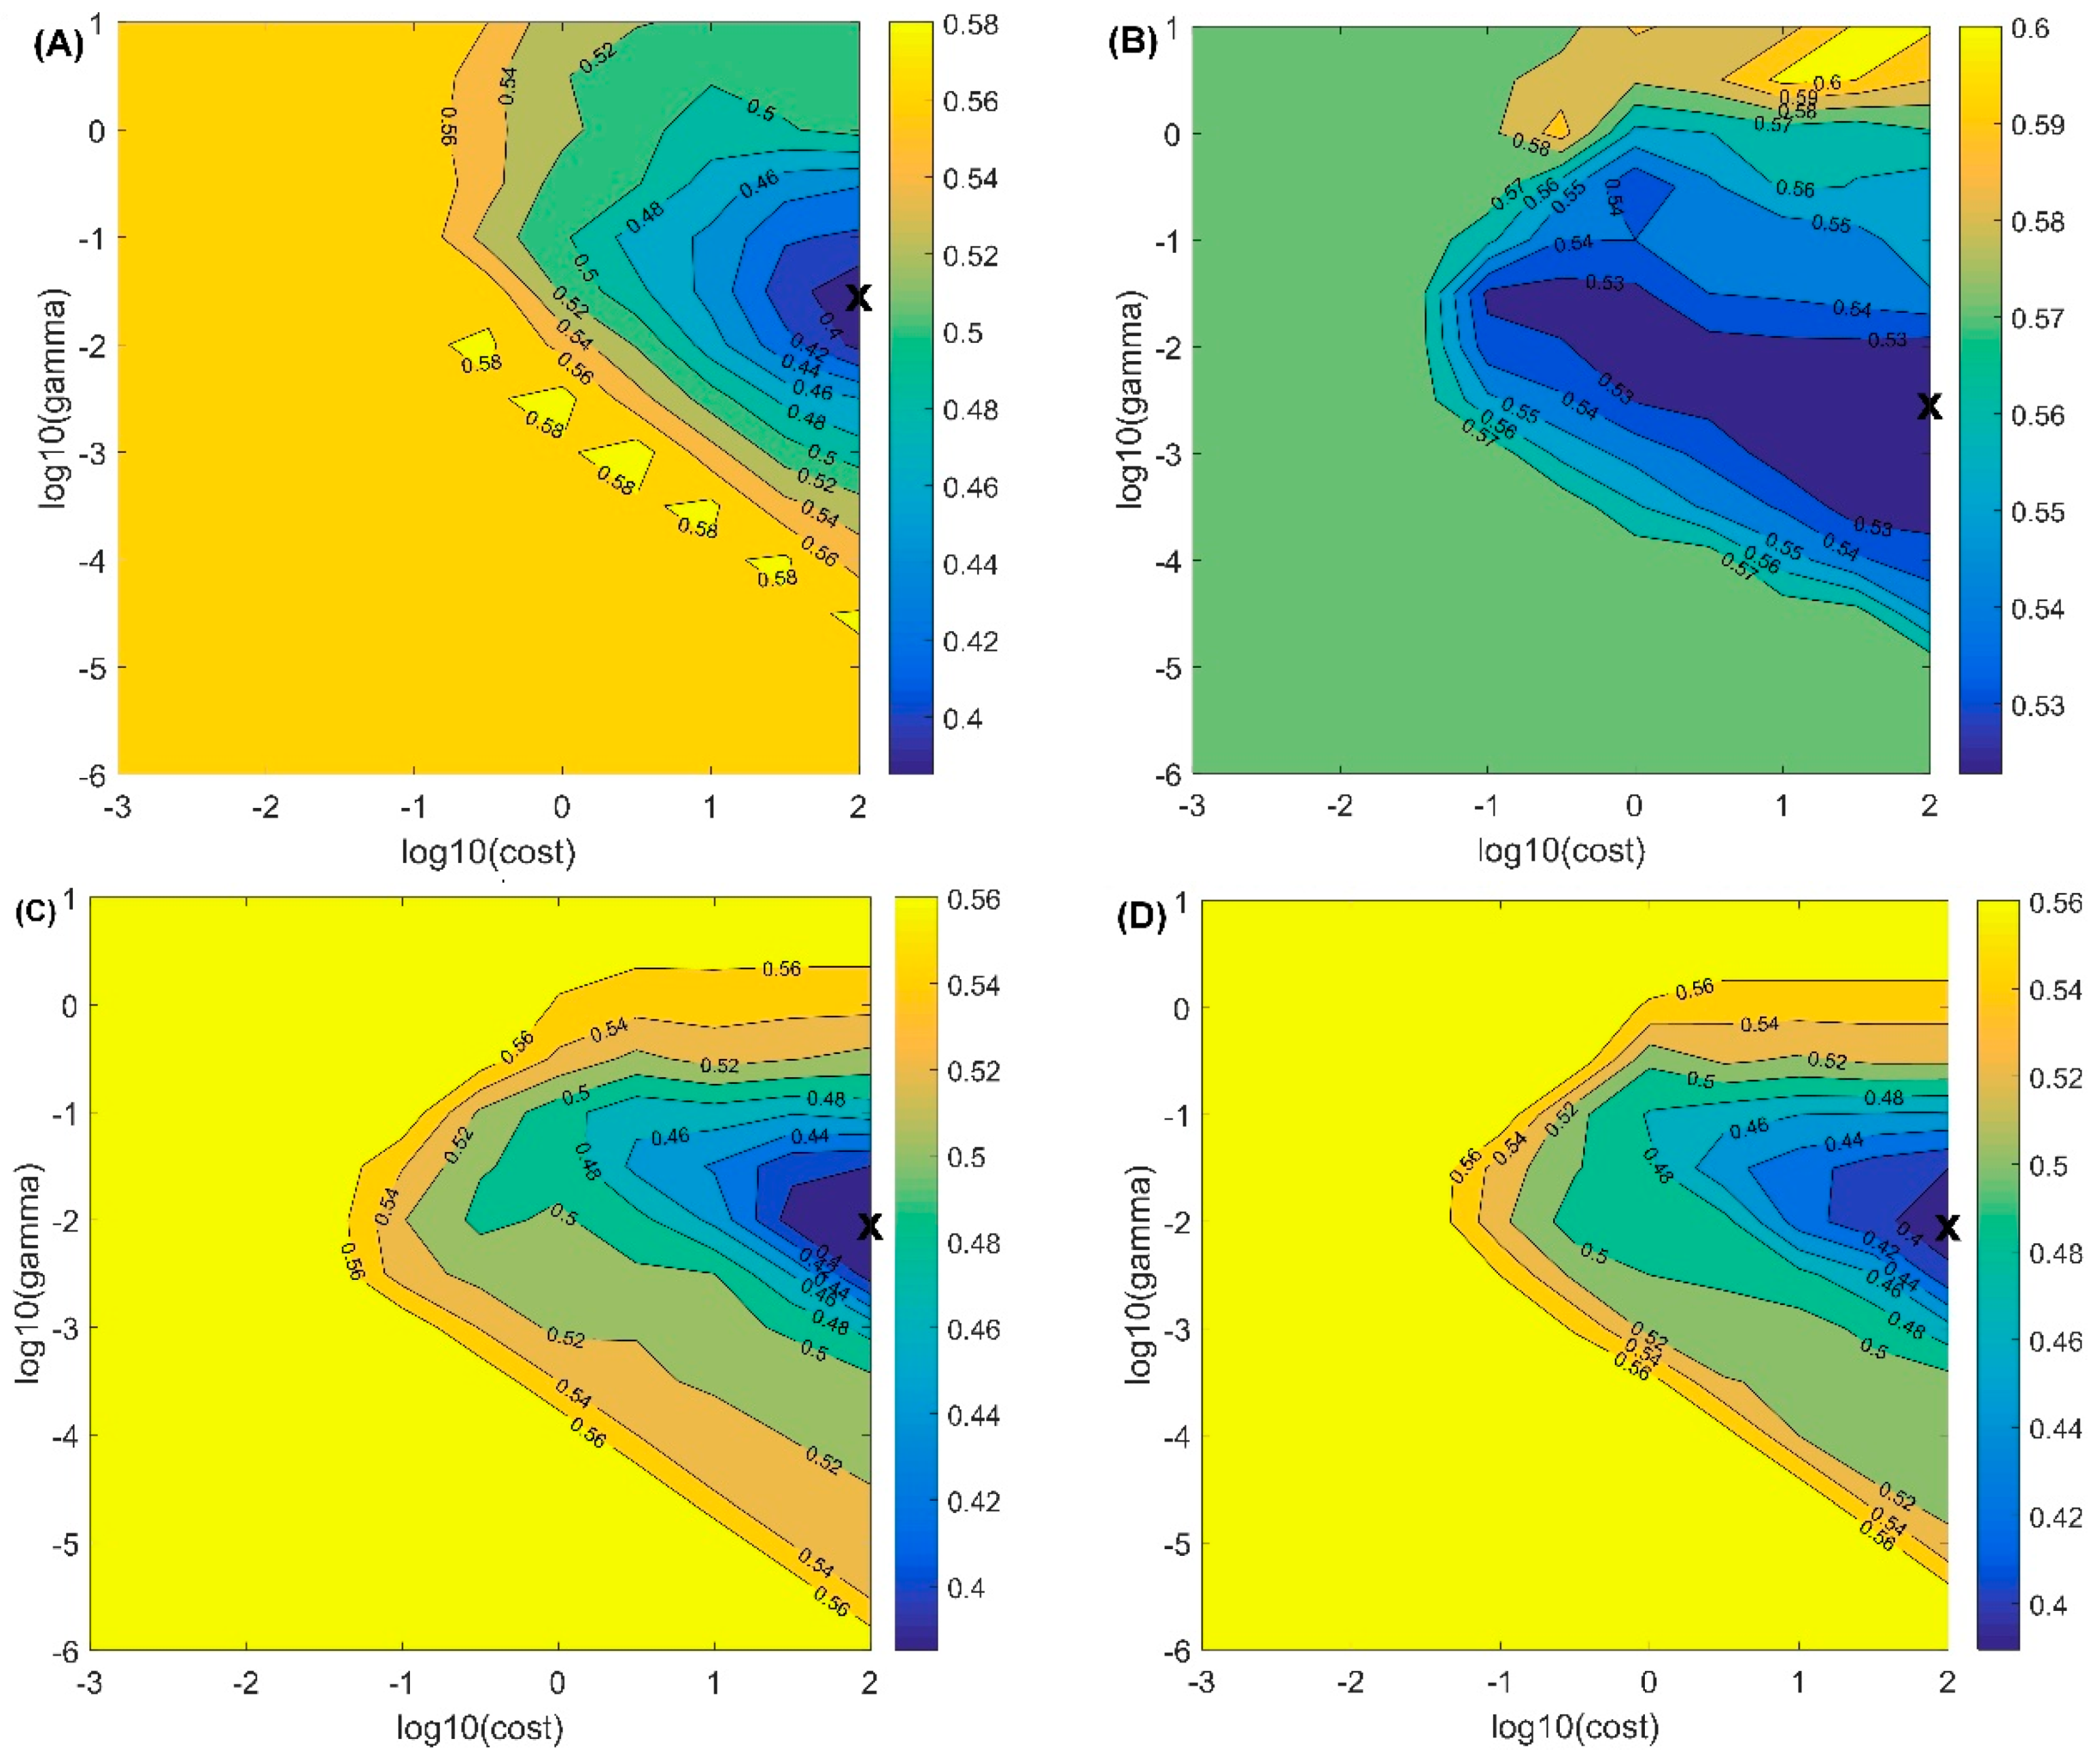
3.3. Classification of Bruised Peaches

Table 4 shows the SVM results for the bruised peaches using the optical properties as well as their combinations (μs′, μa, µa × µs’, & µeff = [3µaa + µs’)]1/2) over 550−1000 nm. The bruise class included samples from groups 4–12 of all maturity stages (900 samples), while the intact class consisted of groups 1–3 (300 samples). Two-thirds of the samples from each class were randomly selected for the training set, and the remaining third was used as the testing set. As shown in Table 4, the classification accuracies ranged between 24% and 93.67% for the tested samples. Comparing the properties, μs′ had a poor overall classification accuracy of 76.25%, while μa had the highest overall classification accuracy of 85%. These results were quite different from those of some other studies. Researchers have reported that combined data (µa × µs’, & µeff) usually show better results than single parameters, but the classification accuracies of the combined data in this study were slightly lower than the results of µa. The possible reason for this result is that the maturity levels have a strong influence on µs’. Overripeness and bruising both leads to a decrease in µs’, so the µs’ values of overripe intact peaches partially overlap with the µs’ values of bruised samples, which makes it easy to misclassify an intact overripe peach as a bruised peach. Figure 5 shows the selection method for the two parameters (gamma and cost) in the SVM model based on the misclassification fraction of cross-validation. The conclusions are consistent with the results presented in Table 4. The optimal misclassification fraction of the cross-validation model shown in Figure 5B is the largest among all four models, while the optimal misclassification fractions of the other three models are below 0.4. A simpler algorithm of PLS-DA were used to validate the classification performance of data, as shown in the supplemental material (Table S1), the overall classification accuracy is lower than the results of SVM, and similar results were obtained that μa had the highest classification accuracies. Overall, the optical parameters showed the ability to identify bruised peach samples for the multiple maturity stages and post-bruising times. However, the classification results of different groups by the optical properties are still unclear. In addition, further research is needed on the effect of maturity stages and times on bruise detection.
Based on the above research, it was found that µa had the best classification effects for bruise detection. Therefore, μa was used for further research to classify bruised peaches in different groups via the SVM model based on wavelengths from 550–1000 nm; the classification results are shown in Table 5. Each group contained 100 samples, 67 samples of each group were randomly selected for the training set, and the other 33 samples were used as the testing set. The classification accuracies ranged between 57.35% and 100% for the tested samples. The lowest classification results were observed between group 1 (S1-intact) and group 4 (S1—0 h after bruising), which means that the occurrence of bruising will not immediately cause a very large change in the optical parameters of the tissue when the peach is immature with a hard texture. The highest classification accuracy of 100% was observed between group 1 and group 9 (S2—24 h after bruising), group 1 and group 11 (S3—4 h after bruising), and group 1 and group 12 (S3—24 h after bruising), which means that with the dual effects of peach ripening and bruising, the optical absorption coefficient changes significantly. With the extension of the bruising time, the classification accuracy between the intact group and the corresponding bruised group gradually increased. For S1 peaches, the detection accuracy increased from 57.35% at 0 h after bruising to 94.12% at 24 h after bruising; for S2 peaches, from 91.18% to 95.59%, and for S3 peaches, from 83.82% to 94.12%. Researchers have reported that as time passes after bruising, damage to cell tissue initiates contact between the polyphenol oxidase (PPO) and peroxidase (POD) cytoplasmic oxidizing enzymes and phenolic contents originally stored in the vacuole [26]. Enzymatic oxidation in damaged cells converts phenolics into quinones, which polymerize to form dark/brown pigments on the damaged part of the fruit [26,27]. Therefore, the more time that passes since damage occurs, the higher the detection accuracy, and therefore, it is difficult to detect bruise damage at an early stage. In addition, for the peaches from different maturity stages (for example bruised S3 and intact S2, bruised S1, and intact S3), the classification results were irregular during the extend of the bruising time. The possible reason is that maturity also leads to changes in optical characteristics when the difference in maturity was higher than the difference caused by bruising, the detection results were high even in the early stages of bruises.

4. Conclusions

In this research, the spectral absorption (µa) and reduced scattering (µs’) coefficients spectra were obtained from 550 to 1000 nm for bruised peaches. The absorption spectra gradually decreased during maturation and bruising, while the reduced scattering spectra showed an increasing trend. The two absorption peaks of µa spectra were observed at approximately 675 nm for chlorophyll-a and 970 nm for water, while the μs′ curve first decreased and then flattened over 550–1000 nm with no characteristic peaks. Mature peaches are more susceptible to outside pressure of bruise damage than immature peaches, while the optical properties of immature peaches changed more after bruising than the optical properties of ripe peaches. The Support Vector Machine (SVM) model were adopted for classification, the classification accuracy for intact and bruised peaches based on μa, μs′, µa × µs’, and µeff was 85%, 76.25%, 84.75%, and 84.5%, respectively. The detection effects were further analyzed based on μa for 12 subgroups (3 maturity levels * 4 detection times), with classification accuracies from 57.35% to 100%. The highest classification accuracy of 100% was observed between intact immature peaches and 24 h bruised peaches, which means that with the dual effects of peach ripening and bruising, the optical absorption coefficient changes significantly. These results provide a basic understanding of the optical characterization of peaches under bruising.

Supplementary Materials

The following are available online at https://www.mdpi.com/2304-8158/10/2/388/s1, Table S1: Two-class classification results for the training and test sets of peach samples via partial least squares discrimination analysis (PLS-DA) model using optical parameters (μa, μs′, μa × μs′ and μeff) over 600–1000 nm.

Author Contributions

Manuscript writing and data analysis, Y.S.; experimental methodology, Y.H.; reviewing and editing, L.P.; reviewing and manuscript writing, X.W. All authors have read and agreed to the published version of the manuscript.

Funding

This work was supported by the National Natural Science Foundation of China (No. 31901769) and the Natural and Science Foundation of Jiangsu Province (No. BK20190541).

Acknowledgments

The authors would like to thank Renfu Lu in the USDA/ARS postharvest engineering laboratory at Michigan State University for his help in carrying out the experiment reported in this paper.

Conflicts of Interest

The authors declare no conflict of interest.

References

  1. Sun, Y.; Li, Y.; Pan, L.; Abbas, A.; Jiang, Y.; Wang, X. Authentication of the Geographic Origin of Yangshan Region Peaches Based on Hyperspectral Imaging. Postharvest Biol. Technol. 2021, 171, 111320. [Google Scholar] [CrossRef]
  2. Ahmadi, E.; Ghassemzadeh, H.R.; Sadeghi, M.; Moghaddam, M.; Neshat, S.Z. The Effect of Impact and Fruit Properties on the Bruising of Peach. J. Food Eng. 2010, 97, 110–117. [Google Scholar] [CrossRef]
  3. Hussein, Z.; Fawole, O.A.; Opara, U.L. Harvest and Postharvest Factors Affecting Bruise Damage of Fresh Fruits. Hortic. Plant J. 2020, 6, 1–13. [Google Scholar] [CrossRef]
  4. Opara, U.L.; Pathare, P.B. Bruise Damage Measurement and Analysis of Fresh Horticultural Produce—A Review. Postharvest Biol. Technol. 2014, 91, 9–24. [Google Scholar] [CrossRef]
  5. Leszczuk, A.; Chylińska, M.; Zięba, E.; Skrzypek, T.; Szczuka, E.; Zdunek, A. Structural Network of Arabinogalactan Proteins (Agps) and Pectins in Apple Fruit During Ripening and Senescence Processes. Plant Sci. 2018, 275, 36–48. [Google Scholar] [CrossRef]
  6. Sun, Y.; Lu, R.; Pan, L.; Wang, X.; Tu, K. Assessment of the Optical Properties of Peaches with Fungal Infection Using Spatially-Resolved Diffuse Reflectance Technique and Their Relationships with Tissue Structural and Biochemical Properties. Food Chem. 2020, 321, 126704. [Google Scholar] [CrossRef] [PubMed]
  7. Che, W.; Sun, L.; Zhang, Q.; Tan, W.; Ye, D.; Zhang, D.; Liu, Y. Pixel Based Bruise Region Extraction of Apple Using Vis-Nir Hyperspectral Imaging. Comput. Electron. Agric. 2018, 146, 12–21. [Google Scholar] [CrossRef]
  8. Zhang, M.; Jiang, Y.; Li, C.; Yang, F. Fully Convolutional Networks for Blueberry Bruising and Calyx Segmentation Using Hyperspectral Transmittance Imaging. Biosyst. Eng. 2020, 192, 159–175. [Google Scholar] [CrossRef]
  9. Kuzy, J.; Jiang, Y.; Li, C. Blueberry Bruise Detection by Pulsed Thermographic Imaging. Postharvest Biol. Technol. 2018, 136, 166–177. [Google Scholar] [CrossRef]
  10. Mazhar, M.; Joyce, D.; Hofman, P.; Vu, N. Factors Contributing to Increased Bruise Expression in Avocado (Persea Americana M.) Cv. ‘Hass’ Fruit. Postharvest Biol. Technol. 2018, 143, 58–67. [Google Scholar] [CrossRef]
  11. Li, J.; Chen, L.; Huang, W. Detection of Early Bruises on Peaches (Amygdalus Persica L.) Using Hyperspectral Imaging Coupled with Improved Watershed Segmentation Algorithm. Postharvest Biol. Technol. 2018, 135, 104–113. [Google Scholar] [CrossRef]
  12. Sun, Y.; Wang, Y.; Xiao, H.; Gu, X.; Pan, L.; Tu, K. Hyperspectral Imaging Detection of Decayed Honey Peaches Based on Their Chlorophyll Content. Food Chem. 2017, 235, 194–202. [Google Scholar] [CrossRef] [PubMed]
  13. Gao, M.; Guo, W.; Huang, X.; Du, R.; Zhu, X. Effect of Pressing and Impacting Bruises on Optical Properties of Kiwifruit Flesh. Postharvest Biol. Technol. 2021, 172, 111385. [Google Scholar] [CrossRef]
  14. Cen, H.; Lu, R.; Mendoza, F.A.; Ariana, D.P. Assessing Multiple Quality Attributes of Peaches Using Optical Absorption and Scattering Properties. Trans. ASABE 2012, 55, 647–657. [Google Scholar] [CrossRef]
  15. Cen, H.; Lu, R.; Mendoza, F.; Beaudry, R.M. Relationship of the Optical Absorption and Scattering Properties with Mechanical and Structural Properties of Apple Tissue. Postharvest Biol. Technol. 2013, 85, 30–38. [Google Scholar] [CrossRef]
  16. Lu, R.; Cen, H.; Huang, M.; Ariana, D.P. Spectral Absorption and Scattering Properties of Normal and Bruised Apple Tissue. Trans. ASABE 2010, 53, 263–269. [Google Scholar] [CrossRef]
  17. He, X.; Fu, X.; Li, T.; Rao, X. Spatial Frequency Domain Imaging for Detecting Bruises of Pears. J. Food Meas. Charact. 2018, 12, 1266–1273. [Google Scholar] [CrossRef]
  18. Berardinelli, A.; Donati, V.; Giunchi, A.; Guarnieri, A.; Ragni, L. Damage to Pears Caused by Simulated Transport. J. Food Eng. 2005, 66, 219–226. [Google Scholar] [CrossRef]
  19. Sun, Y.; Lu, R.; Wang, X. Evaluation of Fungal Infection in Peaches Based on Optical and Microstructural Properties. Postharvest Biol. Technol. 2020, 165, 111181. [Google Scholar] [CrossRef]
  20. Zhu, Q.; Guan, J.; Huang, M.; Lu, R.; Mendoza, F. Predicting Bruise Susceptibility of ‘Golden Delicious’ Apples Using Hyperspectral Scattering Technique. Postharvest Biol. Technol. 2016, 114, 86–94. [Google Scholar] [CrossRef]
  21. Cen, H.; Lu, R. Optimization of the Hyperspectral Imaging-Based Spatially-Resolved System for Measuring the Optical Properties of Biological Materials. Opt. Express 2010, 18, 17412–17432. [Google Scholar] [CrossRef] [PubMed]
  22. Hussein, Z.; Fawole, O.A.; Opara, U.L. Bruise Damage Susceptibility of Pomegranates (Punica Granatum, L.) And Impact on Fruit Physiological Response During Short Term Storage. Sci. Hortic. 2019, 246, 664–674. [Google Scholar] [CrossRef]
  23. Ruiz-Altisent, M.; Moreda, G.P. Fruits, Mechanical Properties and Bruise Susceptibility; Springer: Amsteldam, The Netherlands, 2011. [Google Scholar]
  24. Kamruzzaman, M.; Elmasry, G.; Sun, D.W.; Allen, P. Application of Nir Hyperspectral Imaging for Discrimination of Lamb Muscles. J. Food Eng. 2011, 104, 332–340. [Google Scholar] [CrossRef]
  25. Khan, A.; Luqman, S.; Masood, N.; Singh, D.K.; Saeed, S.T.; Samad, A. Eclipta Yellow Vein Virus Enhances Chlorophyll Destruction, Singlet Oxygen Production and Alters Endogenous Redox Status in Andrographis Paniculata. Plant. Physiol. Biochem. 2016, 104, 165–173. [Google Scholar] [CrossRef]
  26. Hussein, Z.; Fawole, O.A.; Opara, U.L. Preharvest Factors Influencing Bruise Damage of Fresh Fruits–a Review. Sci. Hortic. 2018, 229, 45–58. [Google Scholar] [CrossRef]
  27. Jiménez, R.; Rallo, P.; Suárez, M.P.; Morales-Sillero, A.M.; Casanova, L.; Rapoport, H.F. Cultivar Susceptibility and Anatomical Evaluation of Table Olive Fruit Bruising. Acta Hortic. 2011, 924, 419–424. [Google Scholar] [CrossRef]
Figure 1. A wooden-ball pendulum impacting device for bruised test on peaches.
Foods 10 00388 g001
Figure 2. The scheme of a spatially-resolved spectroscopic system for measuring the optical properties of peach samples.
Foods 10 00388 g002
Figure 3. Confocal laser scanning microscopic images of a cross-section of intact and bruised peach flesh tissue for three maturity stages (stage 1–3) and three detection times after bruising (the white ruler shown in the image represents 100 μm).
Foods 10 00388 g003
Figure 4. The reduced scattering coefficient (µs’) and the absorption coefficient (µa) of peaches at different maturity stages for health (A,E), bruise after 0 h (B,F), bruise after 4 h (C,G), and bruise after 24 h (D,H).
Foods 10 00388 g004aFoods 10 00388 g004b
Figure 5. The misclassification fraction of cross-validation for the SVM model based on µa (A), µs’ (B), µa × µs’ (C), and µeff (D).
Foods 10 00388 g005
Table 1. Grouping introduction of the total twelve groups *.
MaturityIntactDetection Time
0 h4 h24 h
S1Group 1Group 4Group 5Group 6
S2Group 2Group 7Group 8Group 9
S3Group 3Group 10Group 11Group 12
* S1: stage 1, relatively immature; S2: stage 2, commercially ripe; S3: stage 3, over-ripe.
Table 2. Means and standard deviations of the quality parameters for different groups of peaches *.
GroupsPeel Color
(L* Value)
Pulp Color
(L* Value)
Bruises Diameter (mm)
Intact149.38 ± 7.10 f//
246.75 ± 9.28 e,f//
345.53 ± 10.02 c,d,e//
S1-bruise447.63 ± 5.05 e,f//
547.10 ± 7.17 e,f//
645.95 ± 4.71 d,e67.26 ± 5.50 a10.5 ± 5.42 a
S2-bruise746.51 ± 6.17 e,f//
844.61 ± 6.90 c,d,e//
943.04 ± 7.96 c,d56.14 ± 11.62 b13.96 ± 4.94 b
S3-bruise1042.88 ± 5.29 c//
1137.89 ± 7.67 b//
1235.13 ± 8.59 a47.11 ± 6.98 c20.37 ± 4.88 c
* Data were expressed as the mean of 100 samples ± standard deviation. Numbers on the same column with different letters are different (p < 0.05). ‘/’ represents uncollected data.
Table 3. Means and standard deviations of the optical parameters for different groups of peaches *.
Groupsµa 675 nmµa 970 nmµs’ 675 nmµs’ 970 nm
Intact10.04 ± 0.04 a0.24 ± 0.26 a24.64 ± 8.80 e27.86 ± 10.14 g
20.09 ± 0.10 b,c0.34 ± 0.36 b15.79 ± 7.61 d14.74 ± 10.15 d
30.20 ± 0.07 e0.73 ± 0.20 e4.96 ± 0.72 a3.85 ± 0.67 b
S1-bruise40.03 ± 0.03 a0.23 ± 0.21 a22.85 ± 9.52 e25.23 ± 9.83 f
50.09 ± 0.10 b0.54 ± 0.27 c8.65 ± 6.42 b8.73 ± 6.65 e
60.11 ± 0.11 c,d0.58 ± 0.31 c4.01 ± 0.98 a3.88 ± 0.99 b
S2-bruise70.07 ± 0.04 b0.34 ± 0.25 b13.90 ± 7.83 c16.90 ± 7.83 e
80.11 ± 0.11 b,c,d0.53 ± 0.25 c7.05 ± 6.21 b7.05 ± 6.21 c
90.14 ± 0.08 d0.59 ± 0.20 c3.84 ± 0.87 a3.74 ± 0.87 b
S3-bruise100.21 ± 0.12 e0.75 ± 0.07 e4.88 ± 2.65 a4.41 ± 0.65 b
110.22 ± 0.12 e0.74 ± 0.27 e4.60 ± 2.13 a3.97 ± 1.94 b
120.27 ± 0.17 f0.68 ± 0.27 e4.33 ± 1.00 a3.22 ± 0.91 a
* Data were expressed as the mean of 100 samples ± standard deviation. Numbers on the same column with different letters are different (p < 0.05).
Table 4. Classification results for bruised peach samples via Support Vector Machine (SVM) model using optical parameters (μa, μs′, μa × μs′, and μeff) over 550–1000 nm *.
Optical ParameterActual ClassModel
Parameters
Training Set (%)Testing Set
Predicted Intact ClassPredicted Bruise ClassAccuracy (%)
(A) μaIntactCost: 100
Gamma: 0.0316
Number of SVs: 245
90.00762476.00
Bruise93.503626488.00
Overall92.6311228885.00
(B) μsIntactCost: 100
Gamma: 0.0316
Number of SVs: 353
22.50247624.00
Bruise96.171928193.67
Overall77.754335776.25
(C) μa × μsIntactCost: 100
Gamma: 0.01
Number of SVs: 251
83.50623862.00
Bruise95.002327792.33
Overall92.138531584.75
(D) μeffIntactCost: 100
Gamma: 0.01
Number of SVs: 243
85.00633763.00
Bruise94.002527591.67
Overall91.758831284.50
* The bruise class included samples from groups 4–12 of all maturity stages, while the intact class consisted of groups 1–3.
Table 5. Discrimination result between bruised samples and intact samples via Support Vector Machine (SVM) model using μa over 550–1000 nm.
Discrimination Result (%)
Bruised SampleIntact Sample
MaturityDetection TimeS1-IntactS2-IntactS3-IntactOverall
S10 h-Bruise57.3582.3595.5878.43
4 h-Bruise86.7179.4194.1286.75
24 h-Bruise94.1295.5994.1294.61
Overall79.3985.7894.61/
S20 h-Bruise79.4191.1895.5888.72
4 h-Bruise98.5394.1294.1295.59
24 h-Bruise10095.5994.1296.57
Overall92.6593.6394.61/
S30 h-Bruise98.5382.3583.8288.23
4 h-Bruise10079.4186.7788.72
24 h-Bruise10095.5994.1296.57
Overall99.5185.7888.24/
Publisher’s Note: MDPI stays neutral with regard to jurisdictional claims in published maps and institutional affiliations.

