
The Application of Pureed Butter Beans and a Combination of Inulin and Rebaudioside A for the Replacement of Fat and Sucrose in Sponge Cake: Sensory and Physicochemical Analysis

 ,
,  ,
, 
Abstract
1. Introduction
2. Materials and Methods
2.1. Reb A Concentration Adjustment
2.2. Sponge Cake Treatments
2.3. Sponge Cake Preparation
2.4. Sensory Analysis
2.4.1. Sensory Acceptance Testing (SAT)
2.4.2. Optimised Descriptive Profiling (ODP)
2.5. Physicochemical Analysis
2.5.1. Texture Profile Analysis (TPA)
2.5.2. Colour
2.5.3. Moisture and Fat
2.5.4. Protein
2.5.5. Ash
2.5.6. Carbohydrate
2.5.7. Dietary Fibre
2.5.8. Total Sugars and Sucrose Content
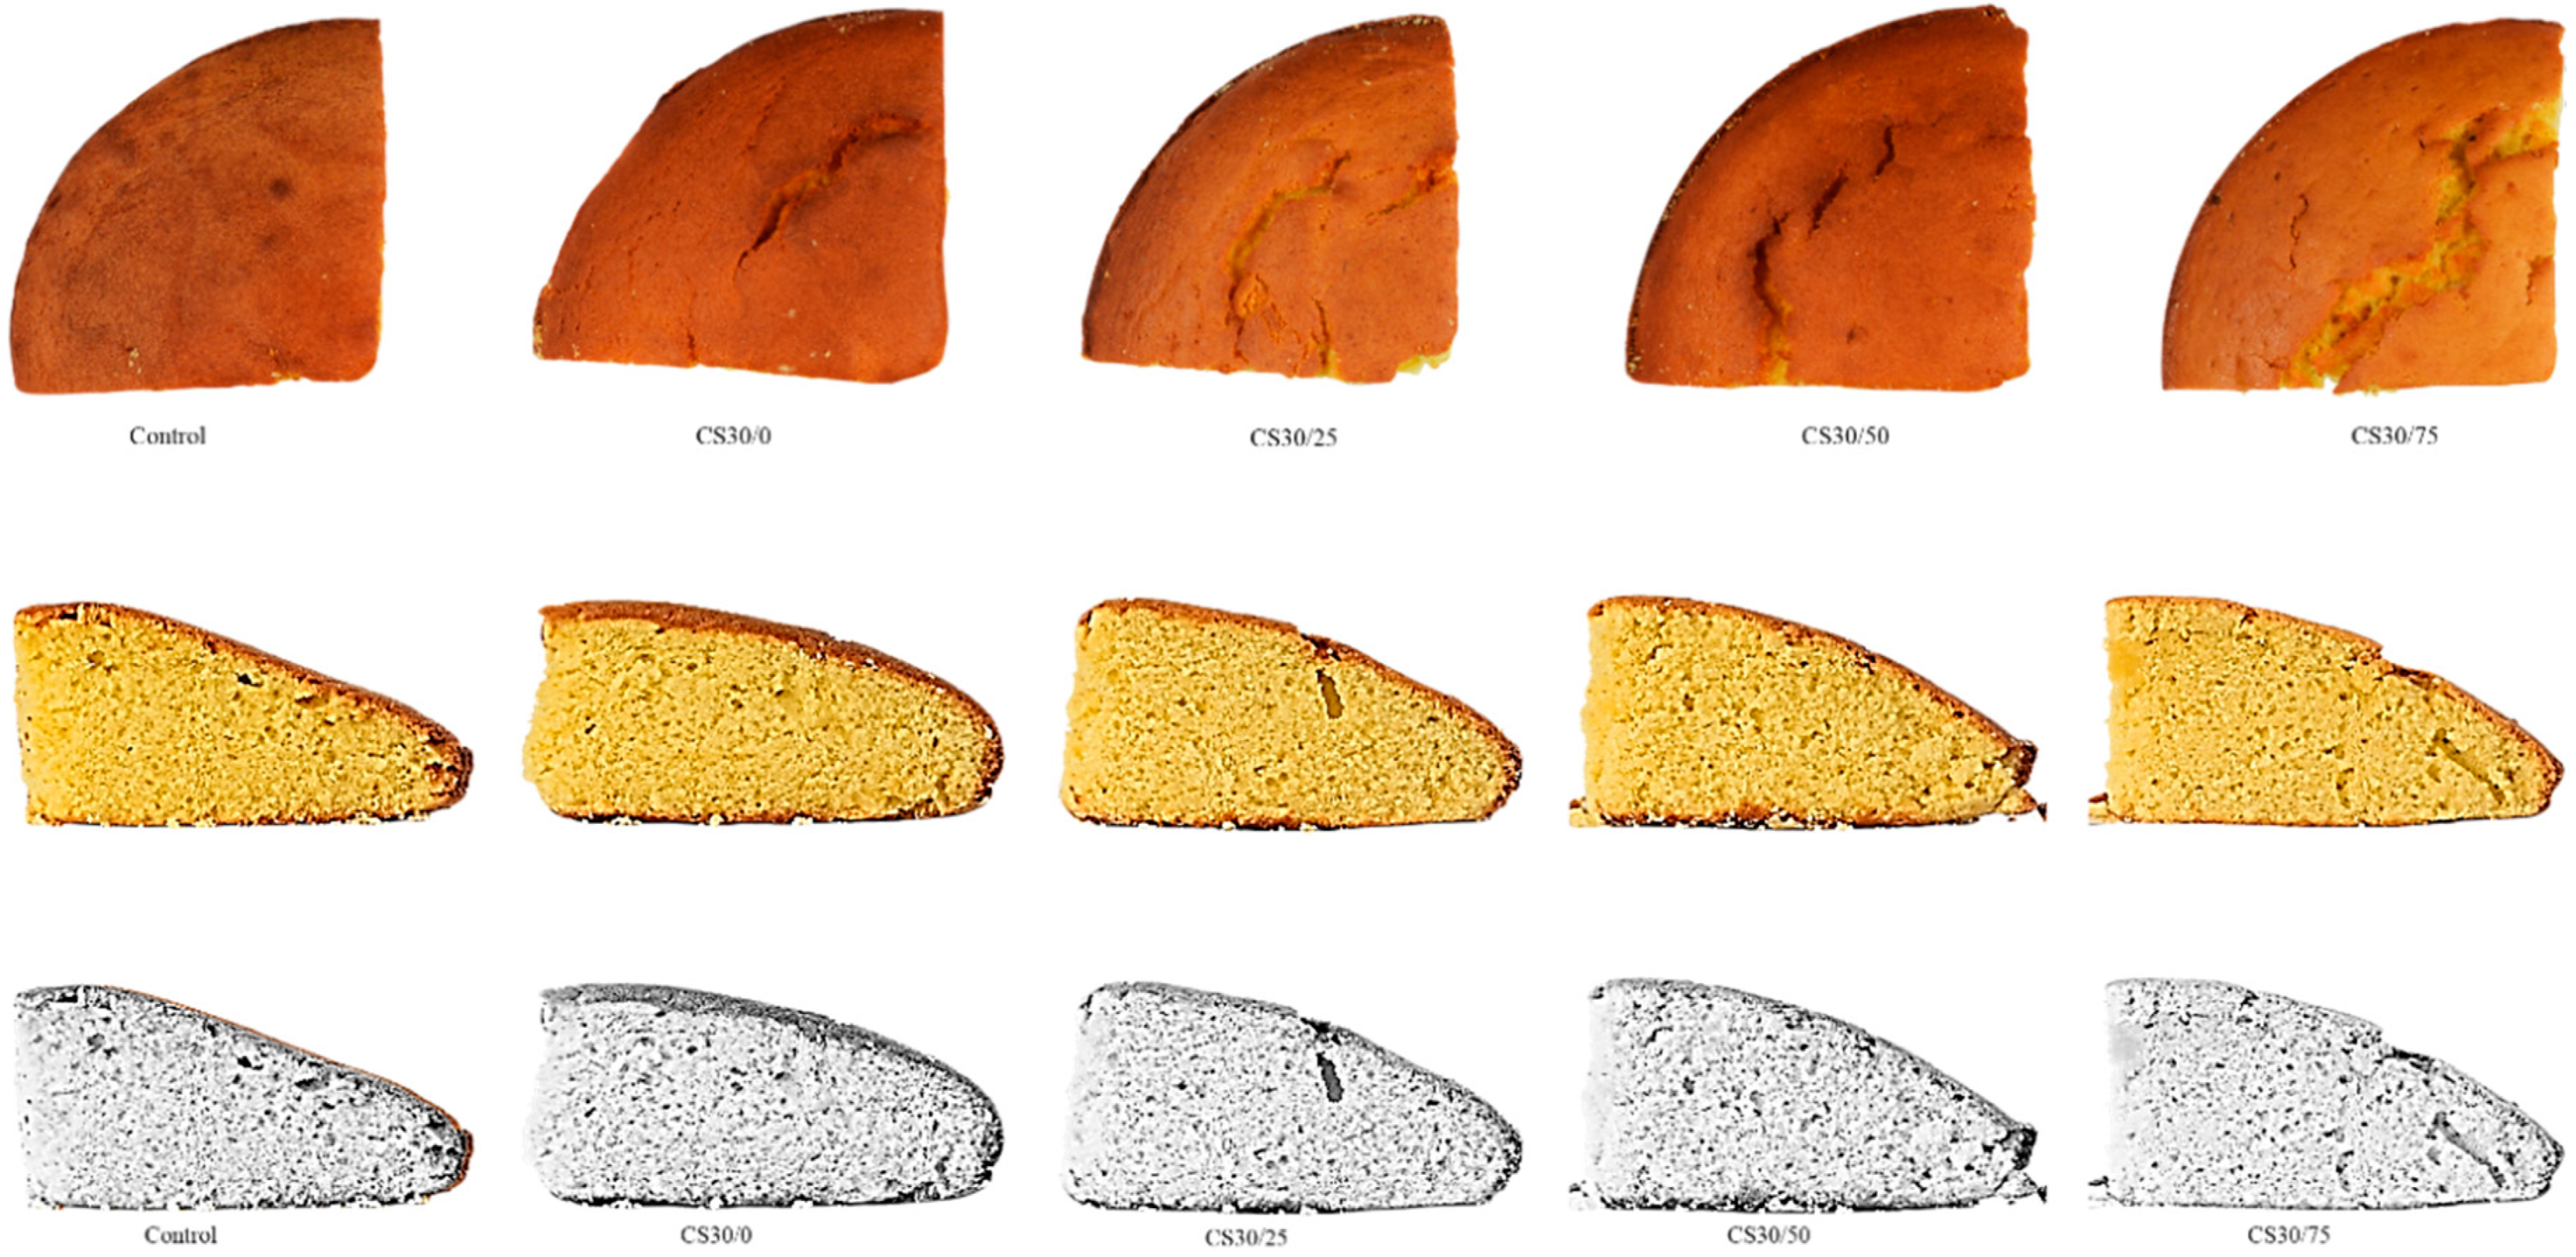
2.6. Sponge Cake Images
2.7. Statistical Analysis
3. Results and Discussion
3.1. Reb A for Sucrose Replacement
3.2. Sensory Analysis
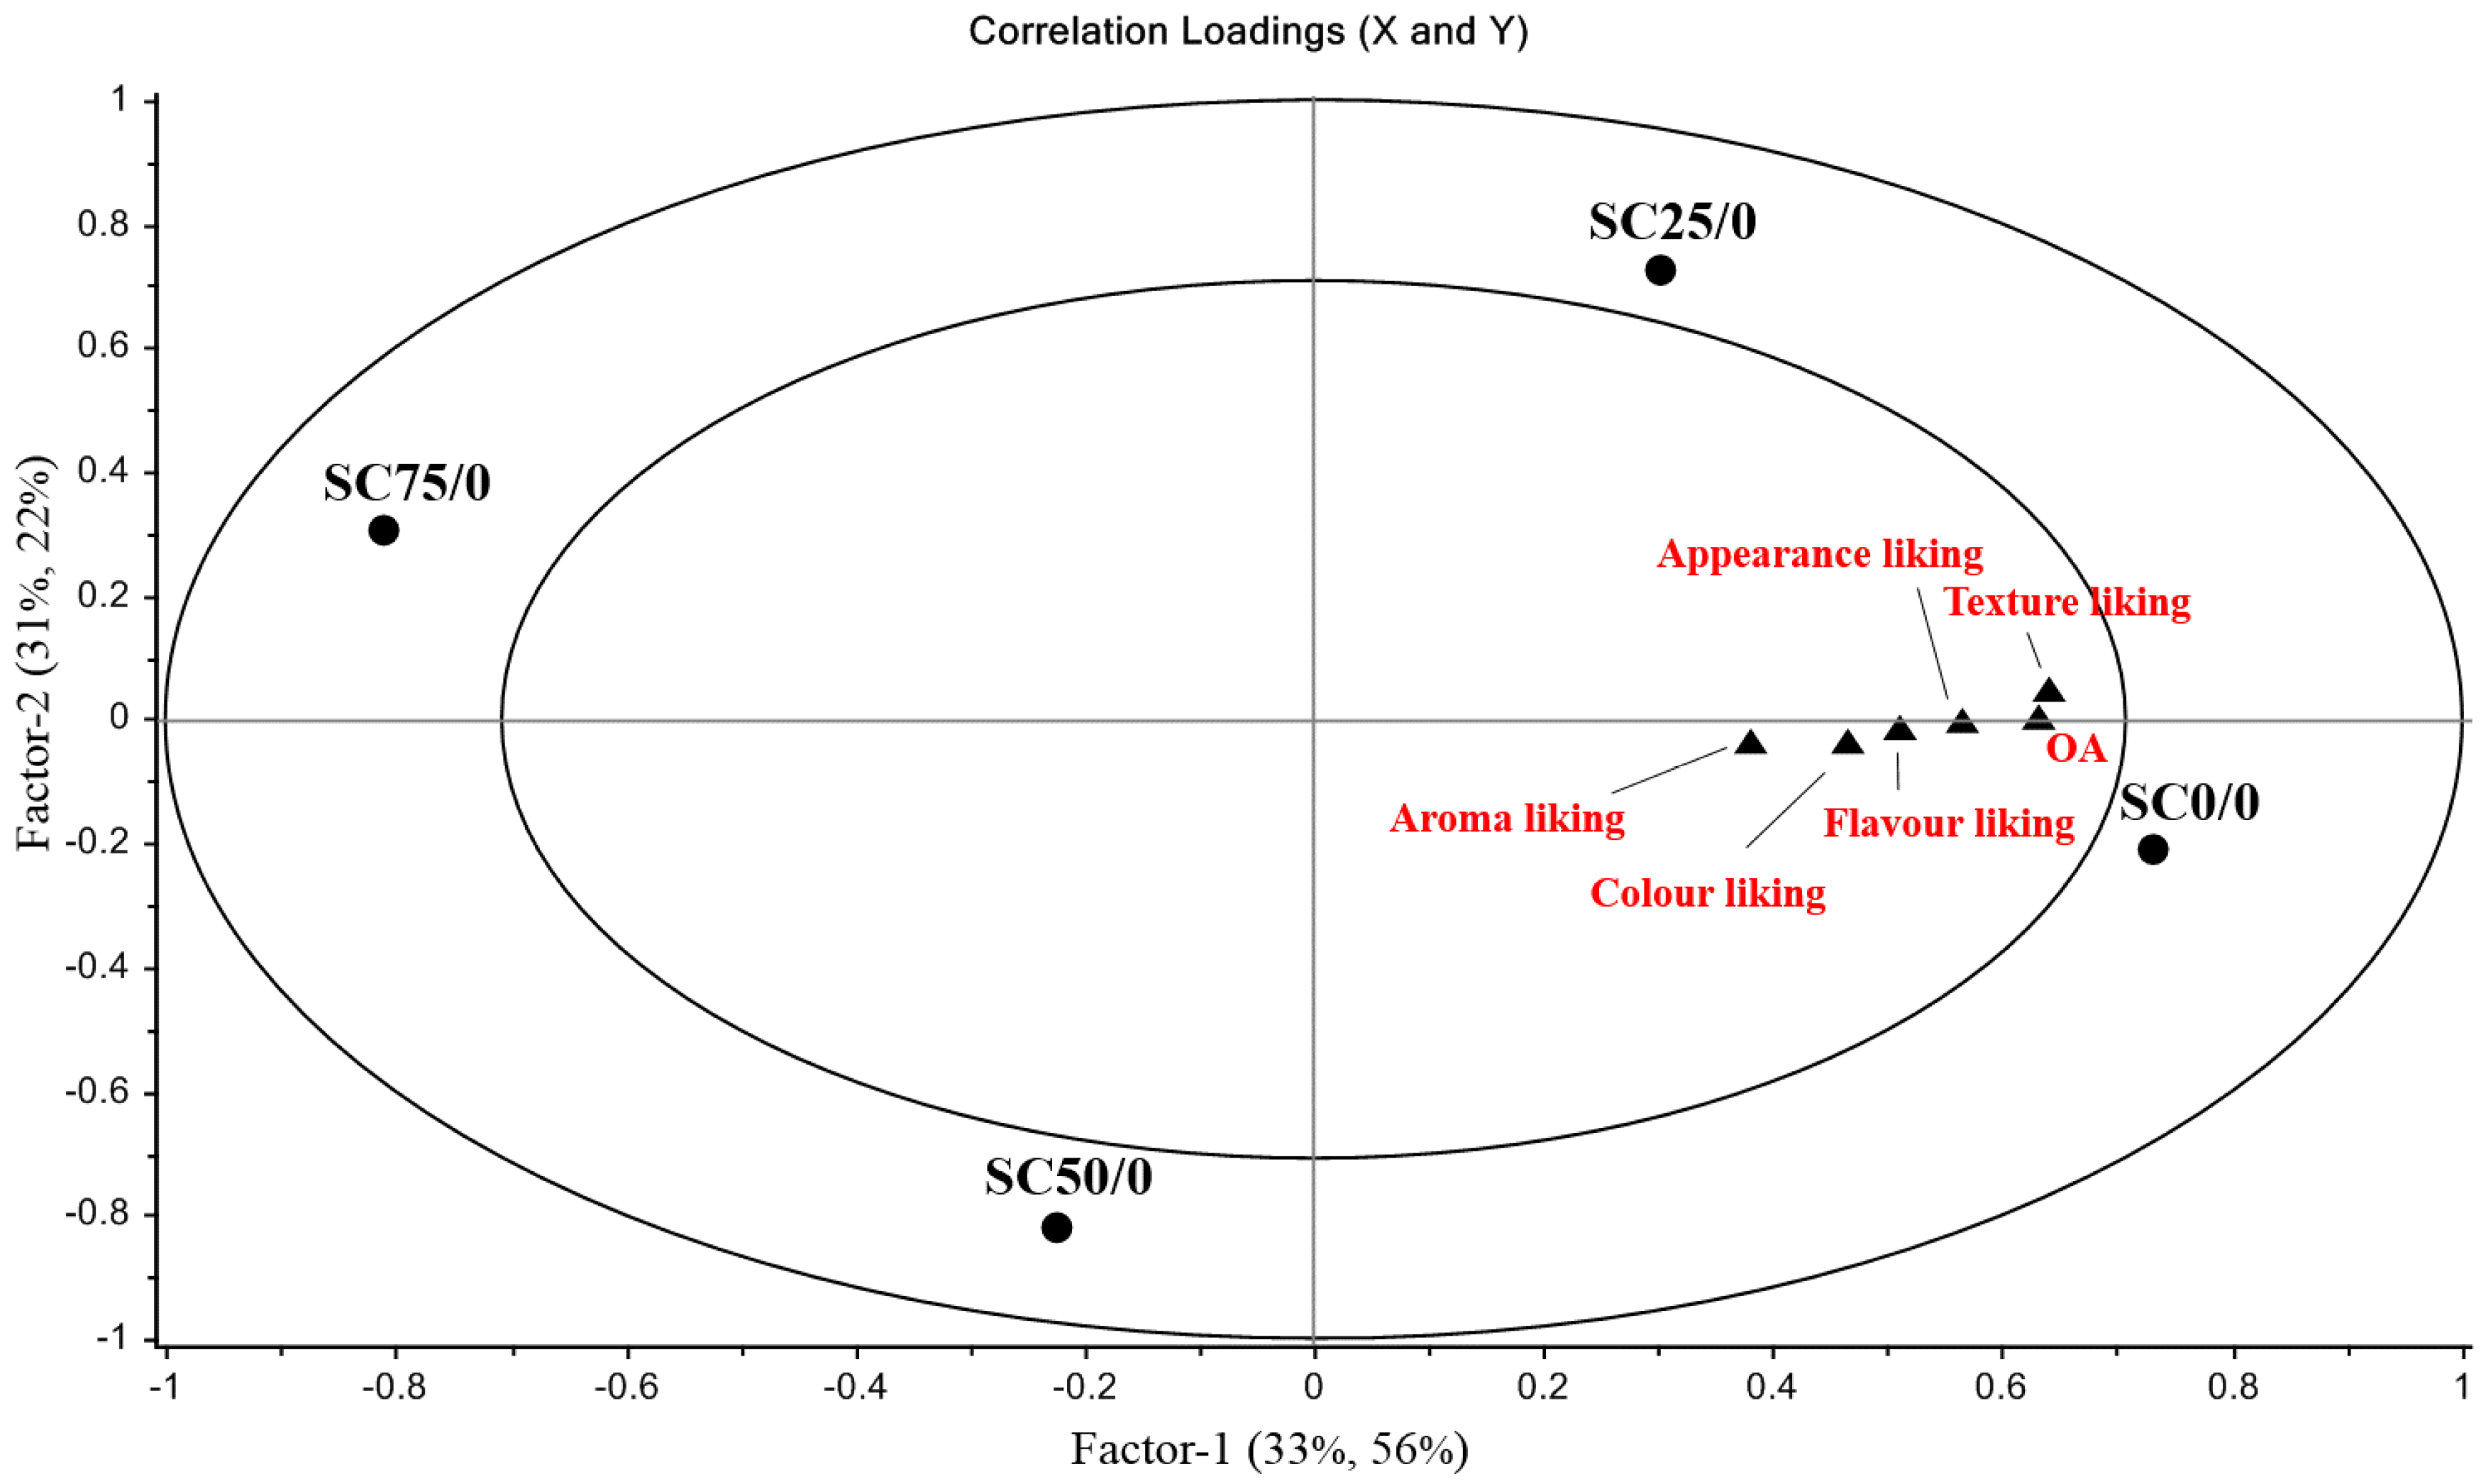
3.2.1. Sensory Acceptance of Sucrose-Replaced Cakes
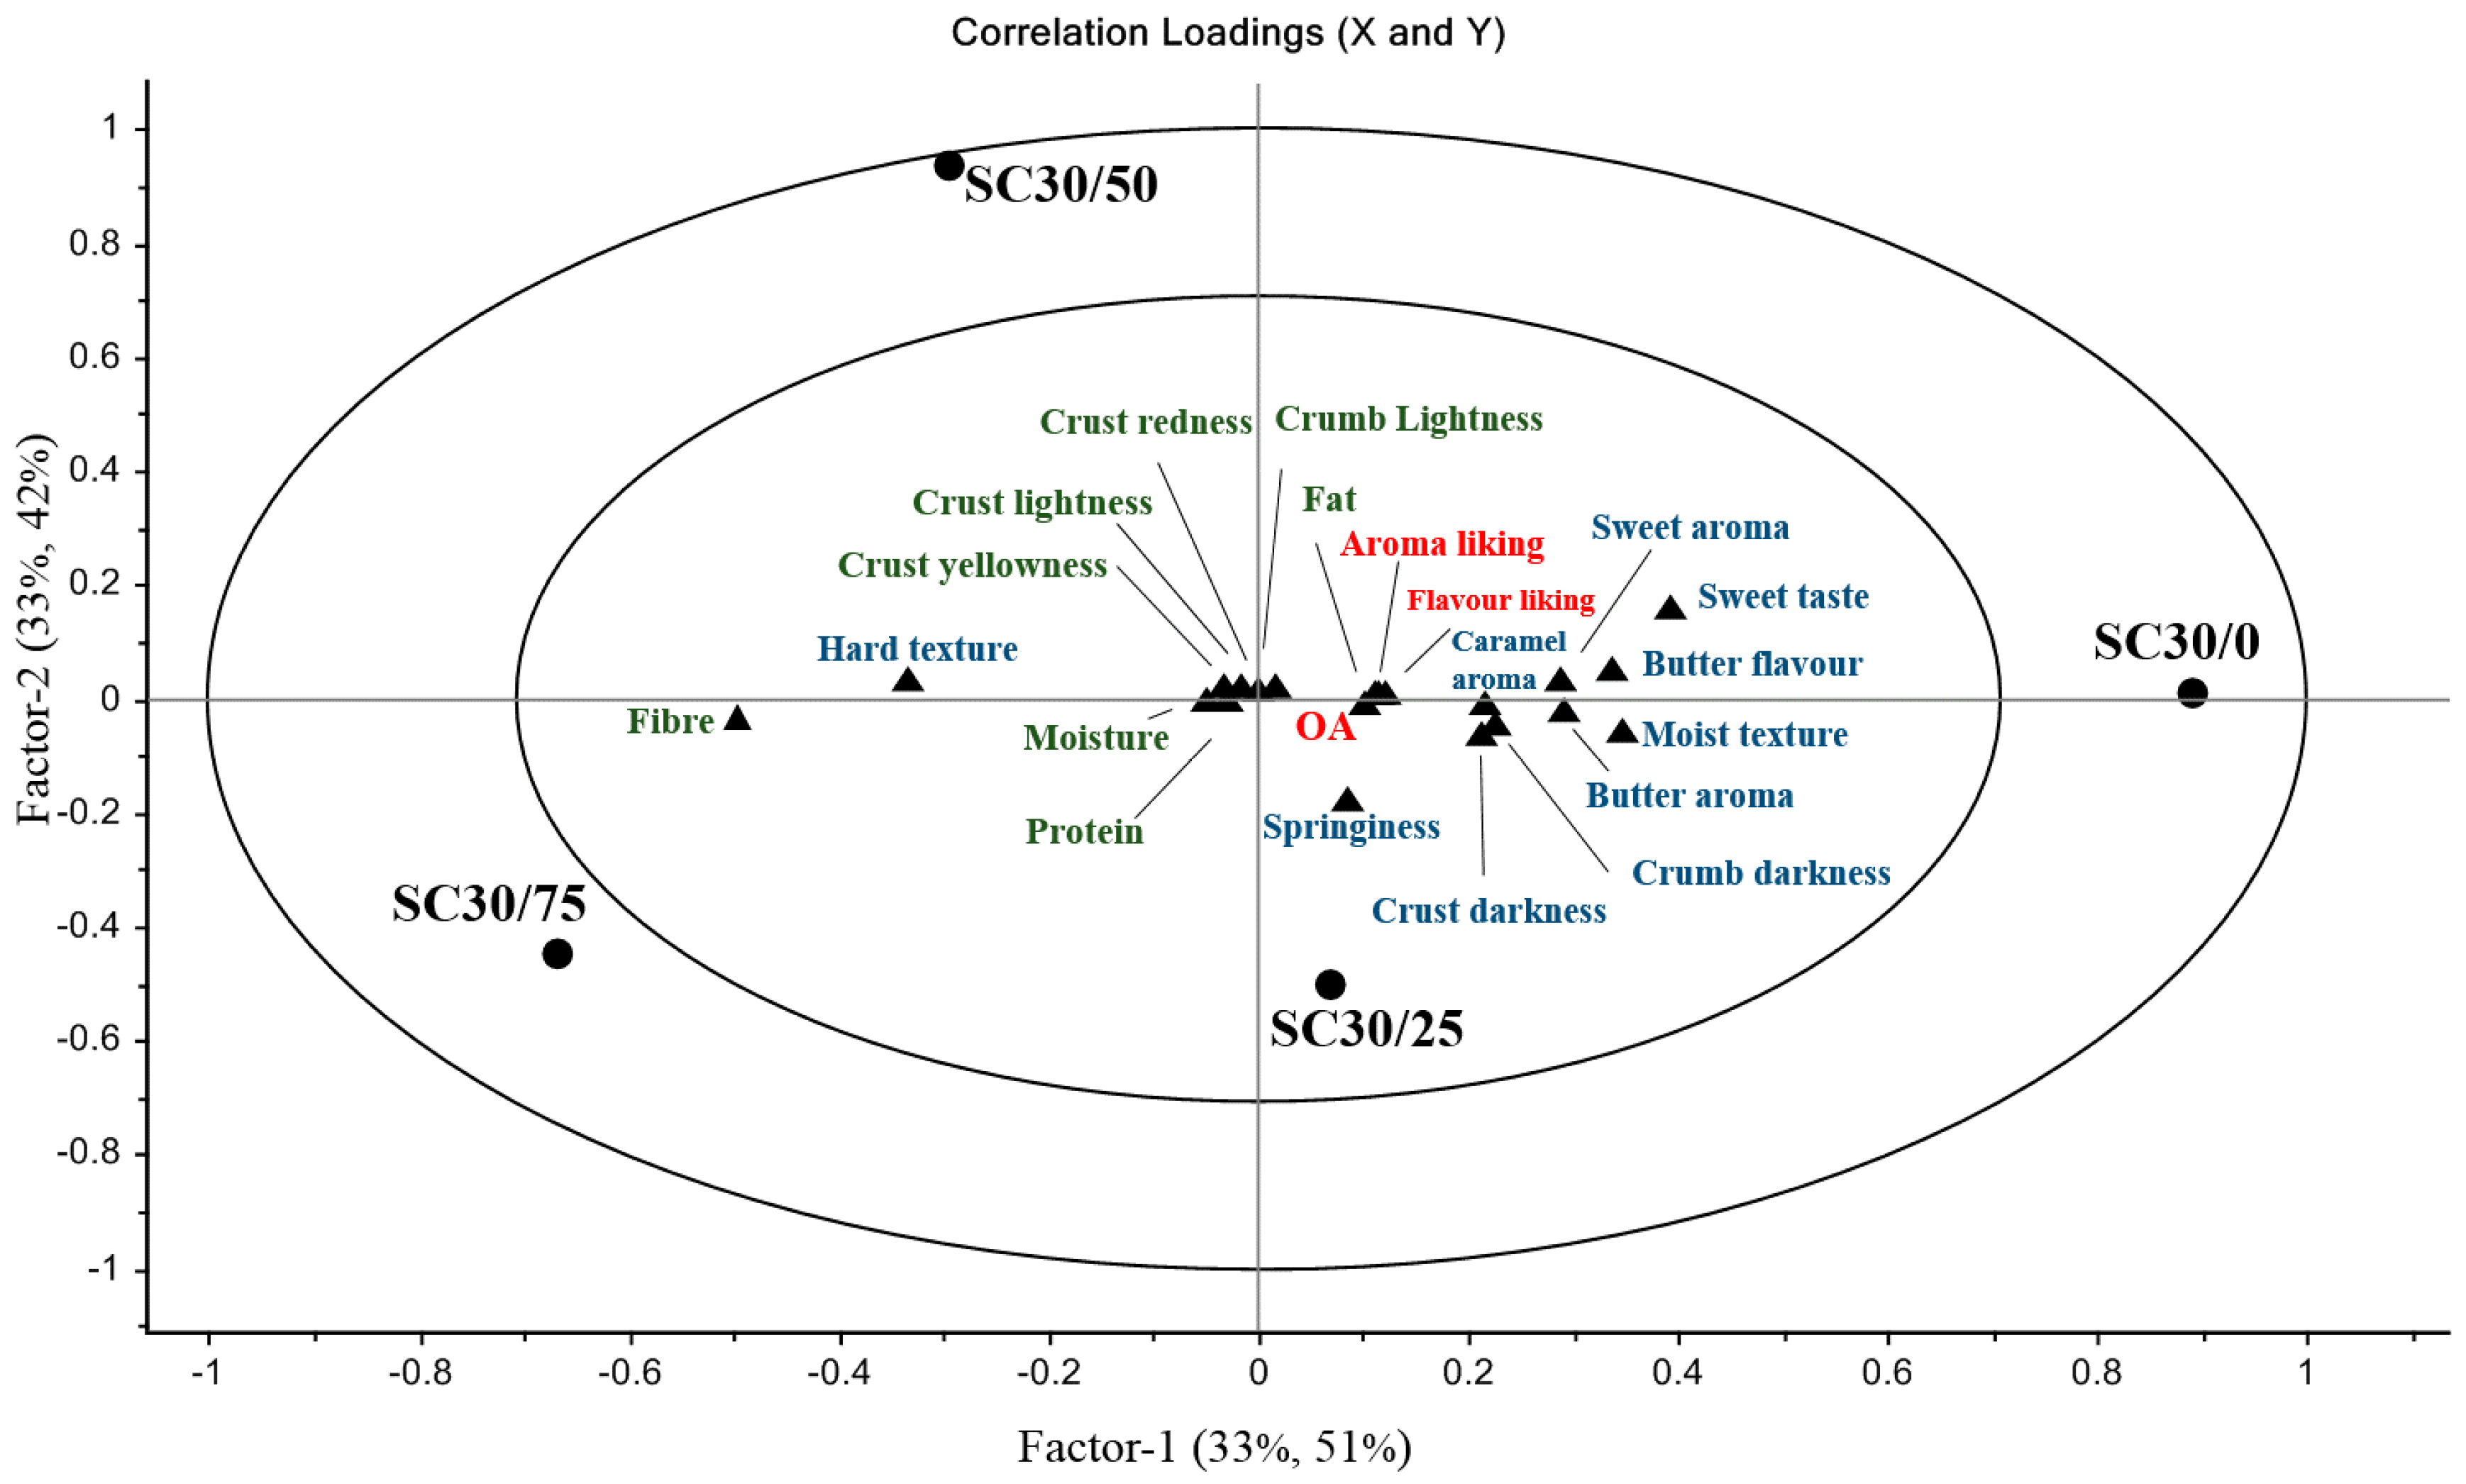
3.2.2. Sensory and Physicochemical Properties of Reduced Sucrose Cakes with Increasing Levels of FR
3.3. Physical Properties and Images of Sponge Cake Samples
3.4. Proximate Composition of Sponge Cake Samples
4. Conclusions
Supplementary Materials
Author Contributions
Funding
Institutional Review Board Statement
Informed Consent Statement
Conflicts of Interest
References
- Blundell, J.E.; Macdiarmid, J.I. Passive overconsumption. Fat intake and short-term energy balance. Ann. N. Y. Acad. Sci. 1997, 827, 392–407. [Google Scholar] [CrossRef] [PubMed]
- World Health Organization. Guidelines. 2011. Available online: https://www.diabetes.ie/are-you-at-risk-free-diabetes-test/get-sugar-smart/ (accessed on 14 December 2020).
- National Taskforce on Obesity. Obesity the Policy Challenges—The Report of the National Taskforce on Obesity. Available online: http://www.hse.ie/eng/health/child/healthyeating/taskforceonobesity.pdf (accessed on 5 May 2019).
- Irish Universities Nutrition Alliance. National Adult Nutrition Survey (NANS) Summary Report. Available online: http://www.iuna.net/wp-content/uploads/2010/12/National-Adult-Nutrition-Survey-Summary-Report-March-2011.pdf (accessed on 1 April 2019).
- Azaïs-braesco, V.; Sluik, D.; Maillot, M.; Kok, F.; Moreno, L.A. A review of total & added sugar intakes and dietary sources in Europe. Nutr. J. 2017, 16, 1–15. [Google Scholar] [CrossRef]
- Bennion, E.B.; Bamford, G.S.T. Sugars. In The Technology of Cake Making, 6th ed.; Bent, A.J., Ed.; Springer Science + Business Media Dordrecht: Bristol, UK, 1997; pp. 84–99. Available online: http://10.1007/978-1-4757-6690-5 (accessed on 22 May 2019).
- Wilderjans, E.; Luyts, A.; Brijs, K.; Delcour, J.A. Ingredient functionality in batter type cake making. Trends Food Sci. Technol. 2013, 30, 6–15. [Google Scholar] [CrossRef]
- Ureta, M.M.; Olivera, D.F.; Salvadori, V.O. Baking of Sponge Cake: Experimental Characterization and Mathematical Modelling. Food Bioprocess Technol. 2016, 9, 664–674. [Google Scholar] [CrossRef]
- Pyler, E.J.; Gorton, L.A. Baking Science & Technology, 14th ed.; Sosland Publishing Company: Kansas City, MI, USA, 2017. [Google Scholar]
- O’Sullivan, M.G. A Handbook for Sensory and Consumer-Driven New Product Development. Technologies for the Food and Beverage Industry. In Food Science, Technology and Nutrition; Woodhead Publishing: Cambridge, UK, 2017; p. 370. [Google Scholar]
- Struck, S.; Jaros, D.; Brennan, C.S.; Rohm, H. Sugar replacement in sweetened bakery goods. Int. J. Food Sci. Tech. 2014, 49, 1963–1976. [Google Scholar] [CrossRef]
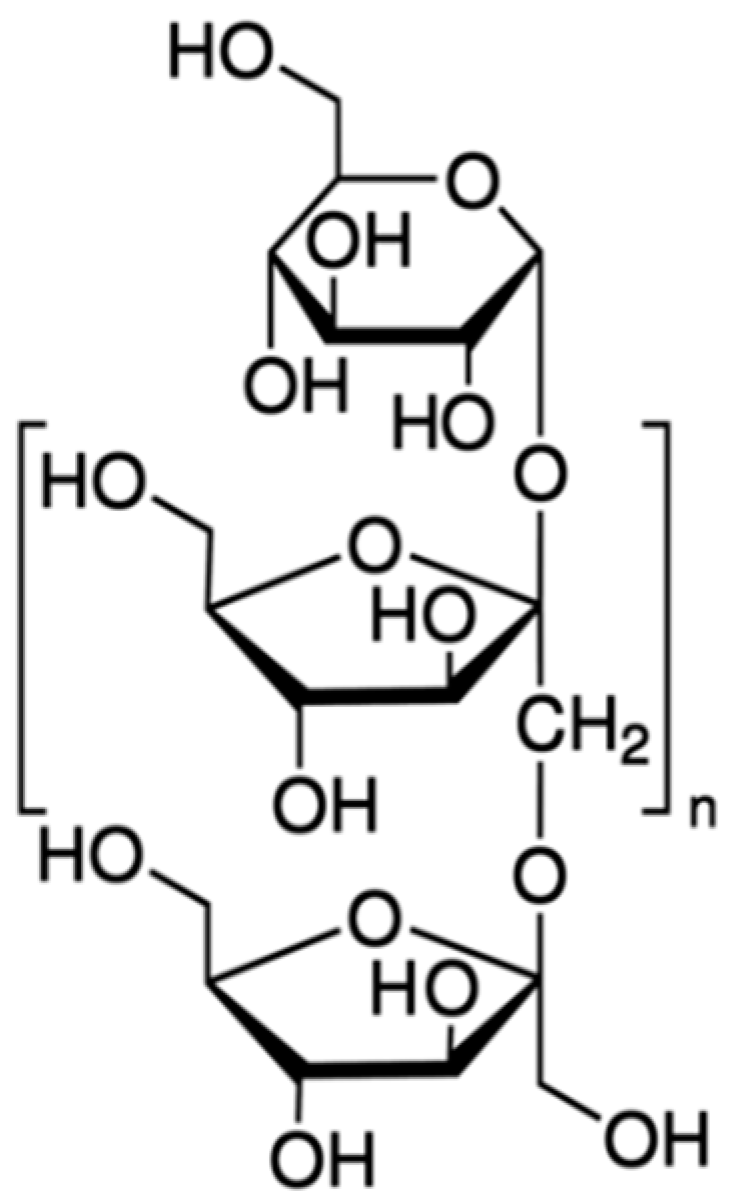
- Shoaib, M.; Shehzad, A.; Omar, M.; Rakha, A.; Raza, H.; Sharif, H.R.; Shakeel, A.; Ansari, A.; Niazi, S. Inulin: Properties, health benefits and food applications. Carbohydr. Polym. 2016, 147, 444–454. [Google Scholar] [CrossRef]
- Roberfroid, M. Inulin-Type Fructans: Functional Food Ingredients. J. Nutr. 2005, 137, 2493–2502. [Google Scholar] [CrossRef]
- Stephen, A.M.; Champ, M.M.; Cloran, S.J.; Fleith, M.; van Lieshout, L.; Mejborn, H.; Burley, V.J. Dietary fibre in Europe: Current state of knowledge on definitions, sources, recommendations, intakes and relationships to health. Nutr. Res. Rev. 2017, 30, 149–190. [Google Scholar] [CrossRef]
- Meyer, D.; Bayarri, S.; Tárrega, A.; Costell, E. Inulin as texture modifier in dairy products. Food Hydrocoll. 2011, 25, 1881–1890. [Google Scholar] [CrossRef]
- Rodríguez-García, J.; Salvador, A.; Hernando, I. Replacing Fat and Sugar with Inulin in Cakes: Bubble Size Distribution, Physical and Sensory Properties. Food Bioprocess Technol. 2014, 7, 964–974. [Google Scholar] [CrossRef]
- Struck, S.; Gundel, L.; Zahn, S.; Rohm, H. Fiber enriched reduced sugar muffins made from ISO-viscous batters. LWT Food Sci. Technol. 2016, 65, 32–38. [Google Scholar] [CrossRef]
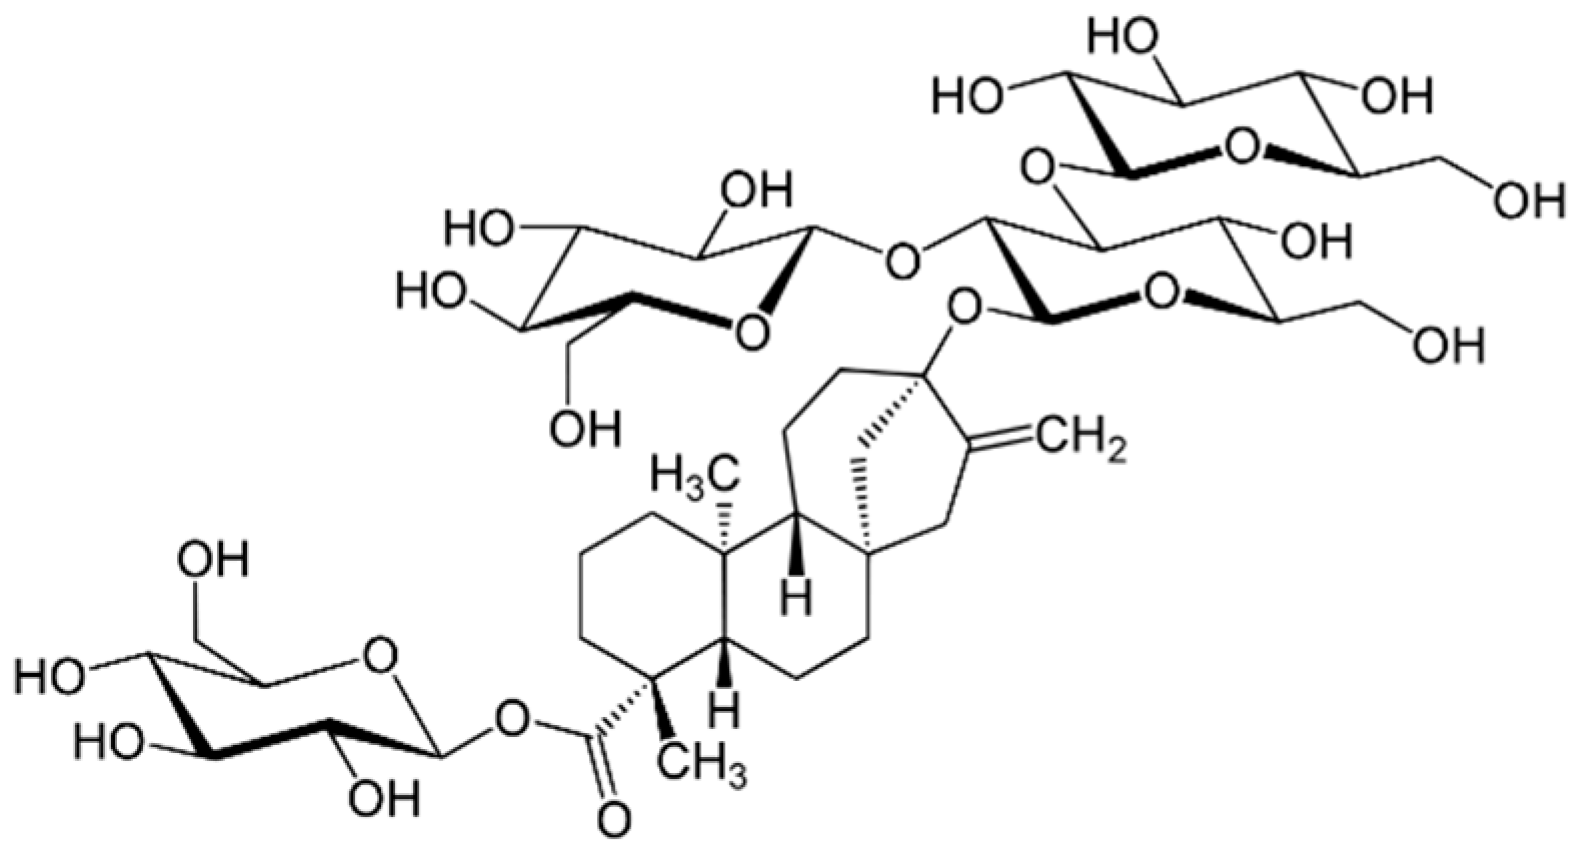
- Kinghorn, A.D.; Wu, C.D.; Soejarto, D.D.; Compadre, C.M. Stevioside. Alternative Sweeteners, 3rd ed.; Nabors, L.O., Ed.; Dekker Marcel, Inc.: New York, NY, USA, 2001; pp. 167–183. [Google Scholar]
- Jorge, K. Soft drinks. Chemical Composition. In Encyclopedia of Food Sciences and Nutrition, 2nd ed.; Elsevier Ltd.: London, UK, 2003; pp. 5346–5352. [Google Scholar] [CrossRef]
- Izawa, K.; Amino, Y.; Kohmura, M.; Ueda, Y.; Kuroda, M. 4.16-Human–Environment Interactions—Taste. In Comprehensive Natural Products II; Liu, H.-W., Mander, L., Eds.; Elsevier: Amsterdam, The Netherlands, 2010; pp. 631–671. [Google Scholar]
- Li, Y.; Li, Y.; Wang, Y.; Chen, L.; Yan, M.; Chen, K.; Xu, L.; Ouyang, P. Production of Rebaudioside A from Stevioside Catalyzed by the Engineered Saccharomyces cerevisiae. Appl. Biochem. Biotechnol. 2016, 178, 1586–1598. [Google Scholar] [CrossRef] [PubMed]
- Marcus, J. Lipids Basics: Fats and oils in Foods and Health: Healthy Lipid Choices, Roles and Applications in Nutrition, Culinary Nutrition: The Science and Practice of Healthy Cooking; Elsevier: Amsterdam, The Netherlands, 2014; pp. 231–277. [Google Scholar]
- Confortiv, F.D.; Charles, S.A.; Duncan, S.E. Evaluation of a carbohydrate-based Fat replacer in a fat reduced baking powder biscuit. J. Food Qual. 1997, 20, 247–256. [Google Scholar] [CrossRef]
- Bazzano, L.A.; Ogden, H.J. Legume Consumption and Risk of Coronary Heart Disease in US Men and Women. Arch. Intern. Med. 2001, 161, 2573–2578. [Google Scholar] [CrossRef] [PubMed]
- Uruakpa, F.O.; Fleisher, A.M. Sensory and Nutritional Attributes of Black Bean Brownies. Am. J. Food Sci. Nutr. 2016, 3, 27–36. Available online: https://pdfs.semanticscholar.org/3549/3d339792903d0a076577861e654496a5d064.pdf (accessed on 5 May 2019).
- Rankin, L.L.; Bingham, M. Acceptability of oatmeal chocolate chip cookies prepared using pureed white beans as a fat ingredient substitute. J. Am. Diet. Assoc. 2000, 100, 831–833. [Google Scholar] [CrossRef]
- Szafranski, M.; Whittington, J.A.; Bessinger, C. Pureed cannellini beans can be substituted for shortening in brownies. J. Am. Diet. Assoc. 2005, 105, 1295–1298. [Google Scholar] [CrossRef] [PubMed]
- dos Silva Navarro, R.D.C.; Minim, V.P.R.; da Silva, A.N.; Gonçalves, A.C.A.; Carneiro, J.D.D.S.; Gomide, A.I.; Lucia, S.M.D.; Minim, L.A. Validation of Optimized Descriptive Profile (ODP) technique: Accuracy, precision and robustness. Food Res. Int. 2014, 66, 445–453. [Google Scholar] [CrossRef]
- dos Santos Navarro, R.D.C.; Minim, V.P.R.; Simiqueli, A.A.; da Silva Moraes, L.E.; Gomide, A.I.; Minim, L.A. Optimized descriptive profile: A rapid methodology for sensory description. Food Qual. Prefer. 2012, 24, 190–200. [Google Scholar] [CrossRef]
- dos Santos Navarro, R.D.C.; Minim, V.P.R.; Carneiro, J.D.D.S.; Nascimento, M.; Della Lucia, S.M.; Minim, L.A. Quantitative sensory description using the optimized descriptive profile: Comparison with conventional and alternative methods for evaluation of chocolate. Food Qual. Prefer. 2013, 30, 169–179. [Google Scholar] [CrossRef]
- dos Santos Navarro, R.D.C.; Minim, V.P.R.; da Silva, A.N.; Peternelli, L.A.; Minim, L.A. Optimized descriptive profile: How many judges are necessary? Food Qual. Prefer. 2014, 36, 3–11. [Google Scholar] [CrossRef]
- International Organisation for Standardisation. 11136:2014 Sensory Analysis-Methodology-General Guidance for Conducting Hedonic Tests with Consumers in a Controlled Area. Available online: https://www.iso.org/home.html (accessed on 15 May 2017).
- MacFie, H.J.; Bratchell, N.; Greenhoff, K.; Vallis, L.V. Designs to balance the effect of order of presentation and first-order carry-over effects in hall tests. J. Sens. Stud. 1989, 4, 129–148. [Google Scholar] [CrossRef]
- Stone, H.; Bleibaum, R.; Thomas, H.A. Test strategy and design of experiments. In Sensory Evaluation Practices, 4th ed.; Elsevier Academic Press: Cambridge, MA, USA, 2012; pp. 117–157. [Google Scholar]
- Janjarasskul, T.; Tananuwong, K.; Kongpensook, V.; Tantratian, S.; Kokpol, S. Shelf life extension of sponge cake by active packaging as an alternative to direct addition of chemical preservatives. LWT Food Sci. Technol. 2005, 72, 166–174. [Google Scholar] [CrossRef]
- Bostian, M.L.; Fish, D.L.; Webb, N.B.; Arey, J.J. Automated methods for determination of fat and moisture in meat and poultry products: Collaborative study. J. Assoc. Off. Anal. Chem. 1985, 68, 876–880. [Google Scholar] [CrossRef]
- Jeddou, K.B.; Bouaziz, F.; Zouari-Ellouzi, S.; Chaari, F.; Ellouz-Chaabouni, S.; Ellouz-Ghorbel, R.; Nouri-Ellouz, O. Improvement of texture and sensory properties of cakes by addition of potato peel powder with high level of dietary fibre and protein. Food Chem. 2017, 217, 668–677. [Google Scholar] [CrossRef] [PubMed]
- AOAC International. Official Methods of Analysis of AOAC International, 18th ed.; AOAC International: Gaithersburg, MD, USA, 2007. [Google Scholar]
- Martens, H.; Martens, M. Modified Jack-knife estimation of parameter uncertainty in bilinear modelling by partial least squares regression (PLSR). Food Qual. Prefer. 2000, 11, 5–16. [Google Scholar] [CrossRef]
- Volpini-Rapina, L.F.; Sokei, F.R.; Conti-Silva, A.C. Sensory profile and preference mapping of orange cakes with addition of prebiotics inulin and oligofructose. LWT Food Sci. Technol. 2012, 48, 37–42. [Google Scholar] [CrossRef]
- Laguna, L.; Primo-Martín, C.; Varela, P.; Salvador, A.; Sanz, T. HPMC and inulin as fat replacers in biscuits: Sensory and instrumental evaluation. LWT Food Sci. Technol. 2014, 56, 494–501. [Google Scholar] [CrossRef]
- Biguzzi, C.; Schlich, P.; Christine, L. The impact of sugar and fat reduction on perception and liking of biscuits. Food Qual. Prefer. 2014, 35, 41–47. [Google Scholar] [CrossRef]
- Rios, R.V.; Pessanhai, M.D.F.; Almeida, P.F.D.; Viana, C.L.; Lannesi, S.C.D.S. Application of fats in some food products. Food Sci. Technol. 2014, 34, 3–15. [Google Scholar] [CrossRef]
- O’Brien, C.M.; Mueller, A.; Scannell, A.G.M.; Arendt, E.K. Evaluation of the effects of fat replacers on the quality of wheat bread. J. Food Eng. 2013, 56, 265–267. [Google Scholar] [CrossRef]
- Souza, N.C.O.; Oliveira, L.D.L.; Alencar, E.R.; Moreira, G.P.; Santos Leandro, E.; Ginani, V.C.; Zandonadi, R.P. Textural, physical and sensory impacts of the use of green banana puree to replace fat in reduced sugar pound cakes. LWT Food Sci. Technol. 2018, 89, 617–623. [Google Scholar] [CrossRef]
- Food Safety Authority Ireland. Information on Nutrition and Health Claims; FSAI: Dublin, Ireland, 2006; Available online: https://www.fsai.ie/science_and_health/nutrition_and_health_claims.html (accessed on 15 December 2020).


| % | ||||||||||
|---|---|---|---|---|---|---|---|---|---|---|
| Samples | Sucrose | Inulin | Reb A | Butter | Pureed Butter Beans | Flour | Milk | Baking Powder | Eggs | |
| Sucrose replacement | SC0/0 | 26.1 | 0 | 0 | 18.6 | 0 | 26.1 | 1.7 | 0.7 | 26.8 |
| SC25/0 | 19.55 | 6.49 | 0.02 | 18.6 | 0 | 26.1 | 1.7 | 0.7 | 26.8 | |
| SC50/0 | 13.04 | 13.0 | 0.04 | 18.6 | 0 | 26.1 | 1.7 | 0.7 | 26.8 | |
| SC75/0 | 6.51 | 19.49 | 0.06 | 18.6 | 0 | 26.1 | 1.7 | 0.7 | 26.8 | |
| Fat replacement | SC30/0 | 18.23 | 7.82 | 0.02 | 18.6 | 0 | 26.1 | 1.7 | 0.7 | 26.8 |
| SC30/25 | 18.23 | 7.82 | 0.02 | 13.96 | 4.7 | 26.1 | 1.7 | 0.7 | 26.8 | |
| SC30/50 | 18.23 | 7.82 | 0.02 | 9.3 | 9.3 | 26.1 | 1.7 | 0.7 | 26.8 | |
| SC30/75 | 18.23 | 7.82 | 0.02 | 4.7 | 13.96 | 26.1 | 1.7 | 0.7 | 26.8 | |
| Attributes | Anchor Points on Scale | Definition |
|---|---|---|
| Springiness | None–extreme | Rate⁄speed by visual observation that the sponge cake returns to its original shape after the deforming force is removed |
| Appearance | ||
| Crust darkness | Light–dark | Degree of colour darkness ranging from light brown to dark brown |
| Porous | None–extreme | Amount of bubbles and voids present in the inner mass of the sponge cake |
| Aroma | ||
| Sweet aroma | None–extreme | Fundamental smell sensation of which sucrose is typical |
| Buttery aroma | None–extreme | Aromatics associated with butter produced from cow’s milk |
| Caramel aroma | None–extreme | Odour produced when caramelising sugar without burning it |
| Texture | ||
| Moisture | Dry–moist | Wet texture in mouth |
| Hardness | Soft–hard | The resistance of the cake to breaking upon pressure of the front teeth during biting |
| Crumbly | None–extreme | Easily broken up in the mouth into a lot of little pieces |
| Dense | Light–heavy | A heavy texture in mouth |
| Taste | ||
| Sweet taste | None–extreme | Taste sensation associated with sucrose |
| Buttery flavour | None–extreme | Flavour sensation associated with butter; creamy mouthfeel and buttery aroma |
| Sweetener | Concentration (g/L) | Mean Scores | Dilution Factor |
|---|---|---|---|
| Reb A | 0.060 | 1.2 a | 400 |
| Reb A | 0.069 | 5.4 b | 350 |
| Reb A | 0.080 | 6.2 c | 300 |
| Reb A | 0.096 | 6.3 c | 250 |
| Reb A | 0.120 | 7.4 d | 200 |
| Reb A | 0.160 | 9.4 d | 150 |
| Sucrose | 24.0 | 5.6 b | n/a |
| Hedonics | ||||||
|---|---|---|---|---|---|---|
| Aroma Liking | Appearance Liking | Colour Liking | Texture Liking | Flavour Liking | Overall Acceptability | |
| SC0/0 | 0.57 | 0.68 | 0.56 | 0.57 | 0.68 | 0.56 |
| SC25/0 | 0.55 | 0.84 | 0.56 | 0.57 | 0.76 | 0.66 |
| SC50/0 | 0.57 | 0.84 | 0.57 | −0.04 * | 0.83 | −0.03 * |
| SC75/0 | −0.05 | −0.03 * | −0.04 * | −0.01 ** | −0.03 * | −0.02 * |
| SC0/0 | SC30/0 | SC30/25 | SC30/50 | SC30/75 | ||
|---|---|---|---|---|---|---|
| TPA para-meters | Hardness (N) | 8.2 ± 0.55 a | 15.1 ± 0.14 b | 13.2 ± 0.44 b | 14.1 ± 0.76 b | 14.2 ± 1.52 b |
| Gumminess (N) | 4.8 ± 0.66 a | 6.0 ± 0.78 b | 5.8 ± 0.33 b | 5.9 ± 0.72 b | 6.4 ± 0.60 b | |
| Chewiness (N) | 8.3 ± 0.58 a | 3.9 ± 0.59 b | 3.9 ± 0.82 b | 3.8 ± 0.75 b | 3.7 ± 0.55 b | |
| Springiness (mm) | 0.7 ± 0.12 a | 0.6 ± 0.03 a | 0.7 ± 0.04 a | 0.6 ± 0.07 a | 0.7 ± 0.05 a | |
| Cohesiveness | 0.6 ± 0.71 a | 0.4 ± 0.04 a | 0.4 ± 0.03 a | 0.4 ± 0.04 a | 0.4 ± 0.08 a | |
| Crust colour | Lightness (L*) | 39.8 ± 0.65 a | 40.5 ± 0.41 a | 41.0 ± 0.77 a | 45.5 ± 0.40 b | 49.8 ± 0.32 c |
| Redness (a*) | 15.1 ± 0.25 a | 15.8 ± 0.38 a | 16.8 ± 0.88 ab | 16.9 ± 0.60 b | 17.5 ± 0.78 b | |
| Yellowness (b*) | 24.1 ± 0.61 a | 24.8 ± 0.88 a | 25.2 ± 0.66 ab | 29.8 ± 0.20 b | 34.1 ± 0.40 c | |
| Crumb colour | Lightness (L*) | 69.2 ± 0.44 a | 70.8 ± 0.50 a | 71.6 ± 0.31 ab | 72.3 ± 0.45 b | 70.7 ± 0.51 a |
| Redness (a*) | −3.1 ± 0.32 a | −2.8 ± 0.21 a | −2.7 ± 0.42 a | −2.8 ± 0.45 a | −2.7 ± 0.36 a | |
| Yellowness (b*) | 31.0 ± 0.24 a | 29.8 ± 0.60 a | 27.7 ± 0.80 a | 27.2 ± 0.30 a | 28.0 ± 0.54 a |
| SC0/0 | SC30/0 | SC30/25 | SC30/50 | SC30/75 | |
|---|---|---|---|---|---|
| Moisture | 21.6 ± 0.55 a | 22.1 ± 0.01 a | 27.5 ± 0.03 b | 28.6 ± 0.42 b | 32.4 ± 0.06 c |
| Fat | 12.9 ± 0.41 a | 12.6 ± 0.74 a | 10.1 ± 0.26 b | 7.5 ± 0.35 c | 4.5 ± 0.33 d |
| Protein | 6.1 ± 0.47 a | 6.0 ± 0.75 a | 6.7 ± 1.40 ab | 6.8 ± 0.51 ab | 7.5 ± 0.33 b |
| Ash | 1.0 ± 0.35 a | 1.3 ± 0.06 a | 1.6 ± 0.63 a | 1.3 ± 0.18 a | 1.4 ± 0.05 a |
| Carbohydrate | 58.4 ± 0.28 a | 55.0 ± 0.60 b | 54.2 ± 0.25 b | 55.5 ± 0.10 b | 54.2 ± 0.55 b |
| Sucrose | 28.9 ± 0.66 a | 20.4 ± 0.55 b | 21.0 ± 0.55 b | 21.0 ± 0.54 b | 21.1 ± 0.41 b |
| Total sugars | 29.8 ± 0.52 a | 20.8 ± 0.41 b | 21.4 ± 0.33 b | 21.5 ± 0.58 b | 21.4 ± 0.65 b |
| Dietary fibre | 1.3 ± 0.57 a | 2.0 ± 0.71 b | 2.4 ± 0.22 bc | 2.8 ± 0.46 c | 3.3 ± 0.22 cd |
| Energy (Kcal/100 g) | 374 | 357 | 335 | 317 | 287 |
Publisher’s Note: MDPI stays neutral with regard to jurisdictional claims in published maps and institutional affiliations. |
© 2021 by the authors. Licensee MDPI, Basel, Switzerland. This article is an open access article distributed under the terms and conditions of the Creative Commons Attribution (CC BY) license (http://creativecommons.org/licenses/by/4.0/).
Share and Cite
Richardson, A.M.; Tyuftin, A.A.; Kilcawley, K.N.; Gallagher, E.; O’Sullivan, M.G.; Kerry, J.P. The Application of Pureed Butter Beans and a Combination of Inulin and Rebaudioside A for the Replacement of Fat and Sucrose in Sponge Cake: Sensory and Physicochemical Analysis. Foods 2021, 10, 254. https://doi.org/10.3390/foods10020254
Richardson AM, Tyuftin AA, Kilcawley KN, Gallagher E, O’Sullivan MG, Kerry JP. The Application of Pureed Butter Beans and a Combination of Inulin and Rebaudioside A for the Replacement of Fat and Sucrose in Sponge Cake: Sensory and Physicochemical Analysis. Foods. 2021; 10(2):254. https://doi.org/10.3390/foods10020254
Chicago/Turabian StyleRichardson, Aislinn M., Andrey A. Tyuftin, Kieran N. Kilcawley, Eimear Gallagher, Maurice G. O’Sullivan, and Joseph P. Kerry. 2021. "The Application of Pureed Butter Beans and a Combination of Inulin and Rebaudioside A for the Replacement of Fat and Sucrose in Sponge Cake: Sensory and Physicochemical Analysis" Foods 10, no. 2: 254. https://doi.org/10.3390/foods10020254
APA StyleRichardson, A. M., Tyuftin, A. A., Kilcawley, K. N., Gallagher, E., O’Sullivan, M. G., & Kerry, J. P. (2021). The Application of Pureed Butter Beans and a Combination of Inulin and Rebaudioside A for the Replacement of Fat and Sucrose in Sponge Cake: Sensory and Physicochemical Analysis. Foods, 10(2), 254. https://doi.org/10.3390/foods10020254