The Old Man and the Meat: On Gender Differences in Meat Consumption across Stages of Human Life


Abstract
1. Introduction
2. Meat Consumption and Masculinity
3. Age as a Mediating Variable in the Gender Bias
4. Data and Method
4.1. Data
4.2. Method: Multiple-Group Regression
4.2.1. Model Specification
4.2.2. Choice of Estimation Technique
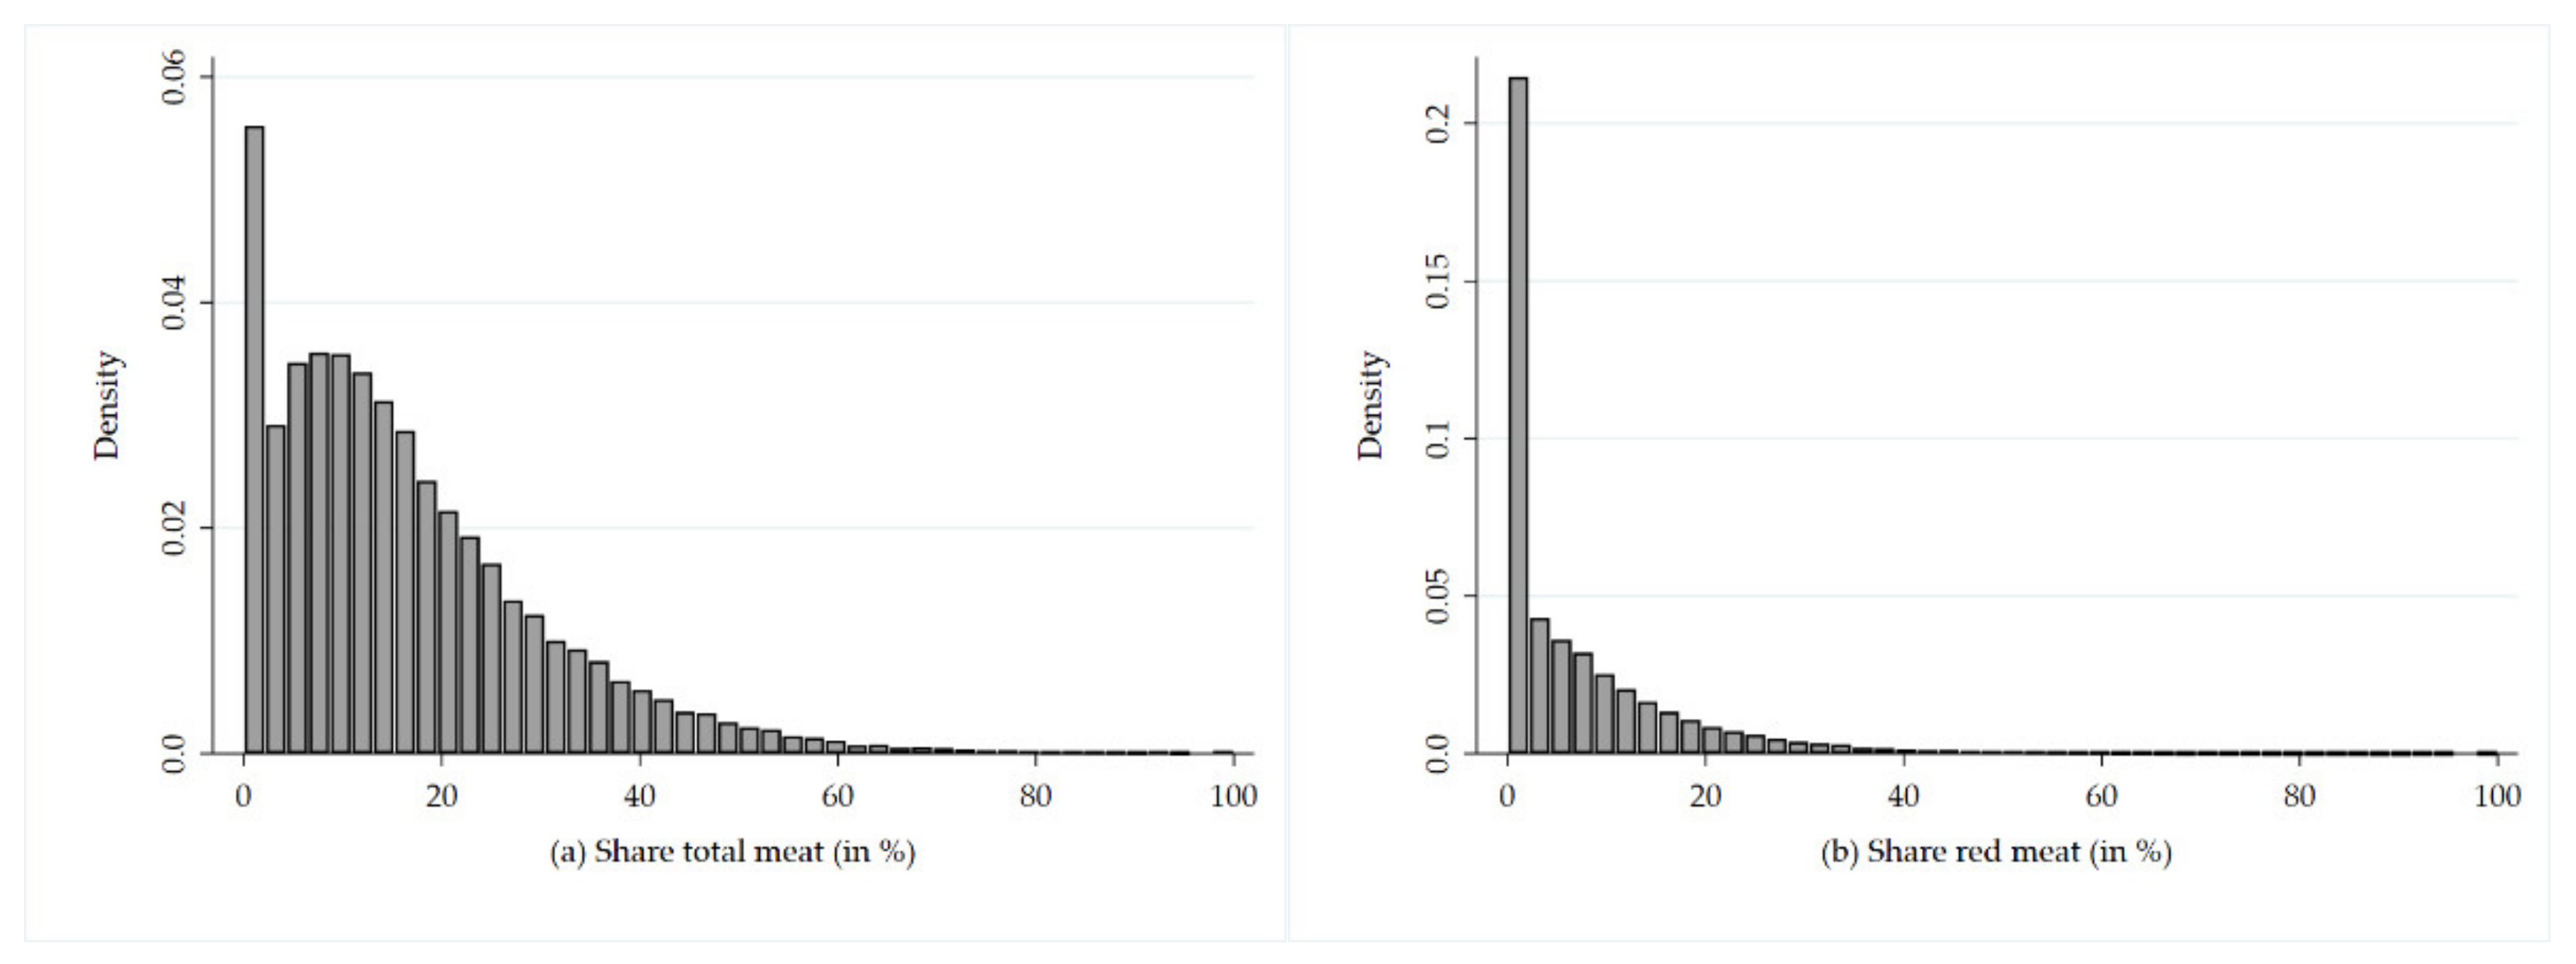
- First, we test the basic assumption of a Poisson distribution where the mean and variance are the same. For the two dependent variables, we detect over-dispersion. In the case of (1) share of total meat consumption (in %), the variance (198.3) is 12 times larger than the mean (16.6), and in the case of (2) share of red meat consumption (in %), the variance (118.3) is 14 times larger than the mean (8.7).
- Second, we estimate a simple Poisson regression and test the goodness of fit (note: age class is included in the equation as an ordinal-scaled variable). The null hypothesis that Poisson is the correctly specified model must be rejected because, for both dependent variables, we obtain a significant p-value (0.000) from Pearson’s chi-square test.
- Third, we estimate a simple negative binomial regression. The corresponding likelihood ratio provides a test of the over-dispersion parameter alpha. For both dependent variables, alpha is statistically significantly different from zero.
- Fourth, we compare fit indices the Akaike information criterion (AIC), Bayesian information criterion (BIC), and the log-likelihood (LL) for the following two models: Poisson with robust standard errors and Negative binomial with robust standard errors. Overall, the model specification negative binomial with robust standard errors is superior (comparative fit indices AIC, BIC, and LL are presented in Table 3).
5. Results and Discussion
5.1. The Gender Bias in Meat Consumption across Stages of Human Life
5.2. Further Controls
6. Conclusions
Author Contributions
Funding
Institutional Review Board Statement
Informed Consent Statement
Data Availability Statement
Conflicts of Interest
Appendix A

| Food Code | Description |
|---|---|
| 210 | Beef, not further specified (nfs) |
| 211 | Beef steak |
| 213 | Beef oxtails, neckbones, short ribs, head |
| 214 | Beef roasts, stew meat, corned beef, beef brisket, sandwich steaks |
| 215 | Ground beef, beef patties, beef meatballs |
| 216 | Other beef items (beef bacon, dried beef, pastrami) |
| 217 | Beef baby food |
| 220 | Pork, nfs; ground, dehydrated |
| 221 | Pork chops |
| 222 | Pork steaks, cutlets |
| 223 | Ham |
| 224 | Pork roasts |
| 225 | Canadian bacon |
| 226 | Bacon, salt pork |
| 227 | Other pork items (spareribs, cracklings, skin, miscellaneous parts) |
| 228 | Pork baby food |
| 230 | Lamb, nfs |
| 231 | Lamb and goat |
| 232 | Veal |
| 233 | Game |
| 234 | Lamb or veal baby food |
| 2711 | Beef in gravy or sauce (tomato-based sauce; gravy; cream, white, or soup-based sauce; soy-based sauce; other sauce; Puerto Rican) |
| 2712 | Pork with gravy or sauce |
| 2713 | Lamb and veal with gravy or sauce |
| 2721 | Beef with starch item (potatoes, noodles, rice, bread, Puerto Rican) |
| 2722 | Pork with starch item |
| 2723 | Lamb, veal, game with starch item |
| 2731 | Beef with starch and vegetable (potatoes, noodles, rice, bread, Puerto Rican) |
| 2732 | Pork with starch and vegetable |
| 2733 | Lamb, veal, game with starch and vegetable |
| 2741 | Beef with vegetable, no potatoes |
| 2742 | Pork with vegetable, no potatoes |
| 2743 | Lamb, veal, game with vegetable, no potatoes |
| 2751 | Beef sandwiches |
| 2752 | Pork sandwiches |
| 2753 | Poultry sandwiches |
| 2761 | Beef mixtures baby food |
| 2762 | Pork mixtures baby food |
| 2763 | Lamb, veal mixtures baby food |
| 2811 | Beef frozen or shelf-stable meals |
| 2812 | Pork or ham frozen or shelf-stable meals |
| 2813 | Veal frozen or shelf-stable meals |
| 2831 | Beef soups |
| 2832 | Pork soups |
| 2833 | Lamb soups |
| Independent Variables | Total Meat (in grams) | Red Meat (in grams) | ||||
|---|---|---|---|---|---|---|
| β | Robust Std. Error | AME | β | Robust Std. Error | AME | |
| Gender | ||||||
| Age Class 1 | 0.051 * | (0.031) | 6.6 | −0.008 | (0.056) | −0.3 |
| Age Class 2 | 0.104 *** | (0.021) | 26.7 | 0.120 *** | (0.036) | 12.8 |
| Age Class 3 | 0.352 *** | (0.023) | 123.1 | 0.490 *** | (0.036) | 75.8 |
| Age Class 4 | 0.361 *** | (0.021) | 151.1 | 0.506 *** | (0.034) | 96.0 |
| Age Class 5 | 0.373 *** | (0.020) | 160.0 | 0.487 *** | (0.033) | 90.1 |
| Age Class 6 | 0.360 *** | (0.021) | 148.5 | 0.524 *** | (0.035) | 88.7 |
| Age Class 7 | 0.272 *** | (0.024) | 94.3 | 0.334 *** | (0.040) | 45.6 |
| Education of household reference person | ||||||
| Age Class 1 | −0.022 | (0.017) | −2.9 | −0.011 | (0.029) | −0.5 |
| Age Class 2 | −0.003 | (0.011) | −0.6 | 0.002 | (0.019) | 0.2 |
| Age Class 3 | −0.005 | (0.011) | −1.9 | −0.037 ** | (0.018) | −5.7 |
| Age Class 4 | −0.009 | (0.010) | −3.7 | −0.064 *** | (0.017) | −12.1 |
| Age Class 5 | −0.007 | (0.010) | −3.2 | −0.031 * | (0.016) | −5.9 |
| Age Class 6 | −0.006 | (0.009) | −2.6 | −0.035 ** | (0.013) | −6.0 |
| Age Class 7 | −0.020 ** | (0.010) | −7.1 | −0.016 | (0.018) | −2.3 |
| Household income | ||||||
| Age Class 1 | −0.034 ** | (0.017) | −4.4 | −0.138 *** | (0.031) | −5.4 |
| Age Class 2 | −0.029 ** | (0.011) | −7.4 | −0.070 *** | (0.020) | −7.4 |
| Age Class 3 | −0.013 | (0.012) | −4.5 | −0.033 * | (0.019) | −5.0 |
| Age Class 4 | −0.014 | (0.010) | −5.8 | −0.056 *** | (0.016) | −10.6 |
| Age Class 5 | −0.002 | (0.010) | −0.9 | −0.036 ** | (0.017) | −6.7 |
| Age Class 6 | −0.017 * | (0.010) | −7.1 | −0.003 | (0.017) | −0.5 |
| Age Class 7 | −0.006 | (0.012) | −2.2 | −0.012 | (0.022) | −1.7 |
| Household size | ||||||
| Age Class 1 | 0.024 * | (0.013) | 3.1 | 0.083 *** | (0.022) | 3.3 |
| Age Class 2 | −0.008 | (0.008) | −2.1 | 0.013 | (0.015) | 1.4 |
| Age Class 3 | −0.042 *** | (0.008) | −14.7 | −0.050 *** | (0.014) | −7.7 |
| Age Class 4 | 0.015 ** | (0.007) | 6.2 | 0.023 * | (0.012) | 4.3 |
| Age Class 5 | −0.006 | (0.007) | −2.5 | 0.017 | (0.011) | 3.2 |
| Age Class 6 | −0.006 | (0.009) | −2.4 | 0.013 | (0.012) | 2.2 |
| Age Class 7 | −0.012 | (0.010) | −4.2 | −0.018 | (0.018) | −2.7 |
| Married household reference person | ||||||
| Age Class 1 | −0.027 | (0.035) | −3.6 | 0.090 | (0.067) | 3.5 |
| Age Class 2 | 0.042 * | (0.025) | 10.9 | 0.018 | (0.043) | 2.0 |
| Age Class 3 | −0.017 | (0.028) | −5.9 | −0.021 | (0.042) | −3.2 |
| Age Class 4 | 0.017 | (0.022) | −7.0 | −0.018 | (0.038) | −3.4 |
| Age Class 5 | −0.017 | (0.023) | −7.2 | −0.009 | (0.038) | −1.6 |
| Age Class 6 | 0.005 | (0.023) | 2.2 | 0.018 | (0.039) | 3.1 |
| Age Class 7 | 0.054 ** | (0.026) | 18.7 | 0.145 *** | (0.044) | 21.1 |
| Share of home consumption | ||||||
| Age Class 1 | −0.004 *** | (0.001) | −5.1 | −0.007 *** | (0.001) | −2.9 |
| Age Class 2 | 0.000 | (0.001) | −0.6 | 0.000 | (0.001) | −0.1 |
| Age Class 3 | −0.002 *** | (0.000) | −5.2 | −0.004 *** | (0.001) | −5.5 |
| Age Class 4 | −0.002 *** | (0.000) | −6.5 | −0.003 *** | (0.001) | −5.5 |
| Age Class 5 | −0.001 *** | (0.000) | −5.7 | −0.002 *** | (0.001) | −4.0 |
| Age Class 6 | −0.001 *** | (0.000) | −4.8 | −0.001 | (0.001) | −1.2 |
| Age Class 7 | −0.003 *** | (0.001) | −9.1 | −0.003 *** | (0.001) | −4.7 |
| Time FE | Yes | Yes | ||||
| Ethnicity FE | Yes | Yes | ||||
| No. of observations | ||||||
| Age Class 1 | 5652 | 5652 | ||||
| Age Class 2 | 5901 | 5901 | ||||
| Age Class 3 | 5960 | 5960 | ||||
| Age Class 4 | 6040 | 6040 | ||||
| Age Class 5 | 6243 | 6243 | ||||
| Age Class 6 | 6115 | 6115 | ||||
| Age Class 7 | 5356 | 5356 | ||||
| Dependent Variable | Difference between | Χ2 | p-Value | Null True? |
|---|---|---|---|---|
| (1) Share total meat | Age Classes 1 and 2 | 2.85 | 0.091 | No |
| Age Classes 2 and 3 | 1.01 | 0.316 | Yes | |
| Age Classes 3 and 4 | 5.40 | 0.020 | No | |
| Age Classes 4 and 5 | 0.31 | 0.581 | Yes | |
| Age Classes 5 and 6 | 0.17 | 0.677 | Yes | |
| Age Classes 6 and 7 | 0.53 | 0.468 | Yes | |
| (2) Share red meat | Age Classes 1 and 2 | 3.84 | 0.050 | No |
| Age Classes 2 and 3 | 10.07 | 0.002 | No | |
| Age Classes 3 and 4 | 2.05 | 0.153 | Yes | |
| Age Classes 4 and 5 | 0.03 | 0.864 | Yes | |
| Age Classes 5 and 6 | 1.25 | 0.263 | Yes | |
| Age Classes 6 and 7 | 3.61 | 0.058 | No |
References
- Garnett, T. Where are the best opportunities for reducing greenhouse gas emissions in the food system (including the food chain)? Food Policy 2011, 36, 23–32. [Google Scholar] [CrossRef]
- Popkin, B.M. Reducing meat consumption has multiple benefits for the world’s health. Arch. Intern. Med. 2009, 169, 543–545. [Google Scholar] [CrossRef] [PubMed]
- Singer, P. Animal Liberation: A New Ethics for Our Treatment of Animals; Avon Books: New York, NY, USA, 1975. [Google Scholar]
- Regan, T. The Case of Animal Rights; University of California Press: Berkeley, CA, USA, 1983. [Google Scholar]
- Gossard, M.H.; York, R. Social structural influences on meat consumption. Hum. Ecol. Rev. 2003, 10, 1–9. [Google Scholar]
- Clonan, A.; Roberts, K.E. Holdsworth, M. Socioeconomic and demographic drivers of red and processed meat consumption: Implications for health and environmental sustainability. Proc. Nutr. Soc. 2016, 75, 367–373. [Google Scholar] [CrossRef] [PubMed]
- Vartanian, L.R. Impression management and food intake. Current directions in research. Appetite 2015, 86, 74–80. [Google Scholar] [CrossRef]
- Cavazza, N.; Guidetti, M.; Butera, F. Ingredients of gender-based stereotypes about food. Indirect influence of food type, portion size and presentation on gendered intentions to eat. Appetite 2015, 91, 266–272. [Google Scholar] [CrossRef]
- McPhail, D.; Beagan, B.; Chapman, G.E. “I don’t want to be sexist but…”. Food Cult. Soc. 2012, 15, 473–489. [Google Scholar] [CrossRef]
- Kirkby, D. “Beer, glorious beer”: Gender politics and Australian popular culture. J. Pop. Cult. 2003, 37, 244–256. [Google Scholar] [CrossRef]
- Gottlieb, D.; Rossi, P.H. A Bibliography and Bibliographic Review of Food and Food Habit Research; U.S. Army, Quartermaster Food and Container Institute, Library Bulletin Number 4; Quartermaster Food and Container Institute: Chicago, IL, USA, 1961. [Google Scholar]
- Rothgerber, H. Real men don’t eat (vegetable) quiche: Masculinity and the justification of meat consumption. Psychol. Men Masc. 2013, 14, 363–375. [Google Scholar] [CrossRef]
- Yentsch, A. Excavating the South’s African American food history. Afr. Diaspora Archaeol. Newsl. 2008, 12, 1–40. [Google Scholar]
- Grabo, N.S. So who killed colonial literary history? William Mary Q. 1988, 45, 342–344. [Google Scholar] [CrossRef]
- Kubberød, E.; Ueland, O.; Rødbotten, M.; Risvik, E. Gender-specific preferences and attitudes towards meat. Food Qual. Prefer. 2002, 13, 285–294. [Google Scholar] [CrossRef]
- Herman, C.P.; Polivy, J. Sex and Gender Differences in Eating Behavior. In Handbook of Gender Research in Psychology; Chrisler, J.C., McCreary, D.R., Eds.; Springer: Heidelberg, Germany, 2009; Volume 1. [Google Scholar]
- Sumpter, K.C. Masculinity and meat consumption: An analysis through the theoretical lens of hegemonic masculinity and alternative masculinity theories. Sociol. Compass 2015, 9, 104–114. [Google Scholar] [CrossRef]
- Prättälä, R.; Paalanen, L.; Grinberga, D.; Helasoja, V.; Kasmel, A.; Petkeviciene, J. Gender differences in the consumption of meat, fruit and vegetables are similar in Finland and the Baltic countries. Eur. J. Public Health 2007, 17, 520–525. [Google Scholar] [CrossRef] [PubMed]
- Parkin, K.J. Food is Love: Food Advertising and Gender Roles in Modern America; University of Pennsylvania Press: Philadelphia, PA, USA, 2006. [Google Scholar]
- Knoll, S.; Eisend, M.; Steinhagen, J. Gender roles in advertising–measuring and comparing gender stereotyping on public and private TV channels in Germany. Int. J. Advert. 2011, 30, 867–888. [Google Scholar] [CrossRef]
- Castonguay, J.; Bakir, A. You eat “like a girl”: Gender differences in content and effects of food advertising depicting sports. J. Food Prod. Mark. 2019, 25, 233–256. [Google Scholar] [CrossRef]
- Pohlmann, A. Threatened at the Table: Meat Consumption, Maleness and Men’s Gender Identities; University of Hawaii Press: Manoa, HI, USA, 2014. [Google Scholar]
- Buerkle, C.W. Metrosexuality can stuff it: Beef consumption as (heteromasculine) fortification. Text Perform. Q. 2009, 29, 77–93. [Google Scholar] [CrossRef]
- Mertens, A.; von Krause, M.; Meyerhöfer, S.; Aziz, L.; Baumann, F.; Denk, A.; Maute, J. Valuing humans over animals–gender differences in meat-eating behavior and the role of the Dark Triad. Appetite 2020, 146, 104516. [Google Scholar] [CrossRef]
- Hayley, A.; Zinkiewicz, L.; Hardiman, K. Values, attitudes and frequency of meat consumption–predicting meat-reduced diets in Australians. Appetite 2015, 84, 98–106. [Google Scholar] [CrossRef]
- Dowsett, E.; Semmler, C.; Bray, H.; Ankeny, R.A.; Chur-Hansen, A. Neutralizing the meat paradox: Cognitive dissonance, gender and eating animals. Appetite 2018, 123, 280–288. [Google Scholar] [CrossRef]
- Hisasue, S.; Sasaki, S.; Tsukamoto, T.; Horie, S. The relationship between second-to-fourth digit ratio and female gender identity. J. Sex. Med. 2012, 9, 2903–2910. [Google Scholar] [CrossRef]
- Bradley, S.J.; Zucker, K.J. Gender identity disorder: A review of the past 10 years. J. Am. Acad. Child Adolesc. Psychiatry 1997, 36, 872–880. [Google Scholar] [CrossRef]
- McIntyre, M.H.; Edwards, C.P. The early development of gender differences. Annu. Rev. Anthropol. 2009, 38, 83–97. [Google Scholar] [CrossRef]
- Goodell, L.S.; Johnson, S.C.; Antono, A.C.; Power, T.G.; Hughes, S.O. Strategies low-income parents use to overcome their children’s food refusal. Matern. Child Health J. 2017, 21, 68–76. [Google Scholar] [CrossRef]
- Søndergaard, H.; Edelenbos, M. What parents prefer and children like—Investigating choice of vegetable-based food for children. Food Qual. Prefer. 2007, 18, 949–962. [Google Scholar] [CrossRef]
- Abiba, D.; Grace, A.N.K.; Kubeziga, K.C. Effects of dietary patterns on the nutritional status of upper primary school children in Tamale metropolis. Pak. J. Nutr. 2012, 11, 591–609. [Google Scholar] [CrossRef][Green Version]
- Zellner, D.A.; Garriga-Trillo, A.; Rohm, E.; Centeno, S.; Parker, S. Food Liking and Craving: A Cross-cultural Approach. Appetite 1999, 33, 61–70. [Google Scholar] [CrossRef] [PubMed]
- Del Giudice, M. Pink, blue, and gender: An update. Arch. Sex. Behav. 2017, 46, 1555–1563. [Google Scholar] [CrossRef] [PubMed]
- Armstrong, T. The Human Odyssey: Navigating the Twelve Stages of Life; Dover Publications: Mineola, NY, USA, 2019. [Google Scholar]
- National Center for Health Statistics. NHANES Questionnaires, Datasets, and Related Documentation. Available online: https://wwwn.cdc.gov/nchs/nhanes/Default.aspx (accessed on 21 July 2021).
- National Center for Health Statistics. About the National Health and Nutrition Examination Survey. Available online: https://www.cdc.gov/nchs/nhanes/about_nhanes.htm (accessed on 2 October 2021).
- Kleiser, C.; Mensink, G.B.M.; Neuhauser, H.; Schenk, L.; Kurth, B.M. Food intake of young people with a migration background living in Germany. Public Health Nutr. 2014, 13, 324–330. [Google Scholar] [CrossRef]
- Pour, M.B.; Bergström, A.; Bottai, M.; Kull, I.; Wickman, M.; Hakansson, N.; Wolk, A.; Moradi, T. Effect of parental migration background on childhood nutrition, physical activity, and body mass index. J. Obes. 2014, 2014, 406529. [Google Scholar] [CrossRef]
- Papke, L.E.; Wooldridge, J.M. Econometric methods for fractional response variables with an application to 401 (k) plan participation rates. J. Appl. Econom. 1996, 11, 619–632. [Google Scholar] [CrossRef]
- StataCorp. Stata Structural Equation Modeling Reference Manual Release 16. Available online: https://www.stata.com/manuals/sem.pdf (accessed on 3 June 2021).
- Rodriguez, G. Models for Over-Dispersed Count Data. 2020. Available online: https://data.princeton.edu/wws509/stata/overdispersion (accessed on 3 June 2021).
- Hayward, C. (Ed.) Gender Differences at Puberty; Cambridge University Press: Cambridge, UK, 2003. [Google Scholar]
- Diamond, M.J. Accessing the multitude within: A psychoanalytic perspective on the transformation of masculinity at mid-life. Int. J. Psychoanal. 2004, 85, 45–64. [Google Scholar] [CrossRef]
- Bruun Eriksen, C. Men in/and crisis: The cultural narrative of men’s midlife crises. J. Aging Stud. 2021, 57, 100926. [Google Scholar] [CrossRef]
- Terry, G.; Braun, V. “When I was a bastard”: Constructions of maturity in men’s accounts of masculinity. J. Gend. Stud. 2009, 18, 165–178. [Google Scholar] [CrossRef]
- Spector-Mersel, G. Never-aging stories: Western hegemonic masculinity scripts. J. Gend. Stud. 2006, 15, 67–82. [Google Scholar] [CrossRef]
- Daniel, C.R.; Cross, A.J.; Koebnick, C.; Sinha, R. Trends in meat consumption in the USA. Public Health Nutr. 2010, 14, 575–583. [Google Scholar] [CrossRef] [PubMed]
- Zeng, L.; Ruan, M.; Liu, J.; Wilde, P.; Naumova, E.N.; Mozaffarian, D.; Zhang, F.F. Trends in processed meat, unprocessed red meat, poultry, and fish consumption in the United States, 1999–2016. J. Acad. Nutr. Diet. 2019, 119, 1085–1098. [Google Scholar] [CrossRef]
- Guenther, P.M.; Jensen, H.H.; Bartes-Marquez, S.P.; Chen, C.F. Sociodemographic, knowledge, and attitudinal factors related to meat consumption in the United States. J. Am. Diet. Assoc. 2005, 105, 1266–1274. [Google Scholar] [CrossRef]
- Sobal, J. Men, masculinity, and marriage: Models of masculinity. Food Foodways 2005, 13, 135–158. [Google Scholar] [CrossRef]
- Eng, P.M.; Kawachi, I.; Fitzmaurice, G.; Rimm, E.B. Effects of marital transitions on changes in dietary and other health behaviours in US male health professionals. J. Epidemiol. Community Health 2004, 59, 56–62. [Google Scholar] [CrossRef] [PubMed]
- Tonsor, G.T.; Mintert, J.R.; Schroeder, T.C. U.S. meat demand: Household dynamics and media information impacts. J. Agric. Resour. Econ. 2010, 35, 1–17. [Google Scholar]

| Stages of Human Life | Description | Age Class | Description |
|---|---|---|---|
| 3 | Infancy (Ages 0–3) | 1 | Infancy (Ages 0–4) |
| 4 | Early Childhood (Ages 4–6) | 2 | Childhood (Ages 5–11) |
| 5 | Middle Childhood (Ages 7–8) | 2 | Childhood (Ages 5–11) |
| 6 | Late Childhood (Ages 9–11) | 2 | Childhood (Ages 5–11) |
| 7 | Adolescence (Ages 12–20) | 3 | Adolescence (Ages 12–20) |
| 8 | Early Adulthood (Ages 21–35) | 4 | Early Adulthood (Ages 21–35) |
| 9 | Midlife (Ages 36–50) | 5 | Midlife (Ages 36–50) |
| 10 | Mature Adulthood (Ages 51–80) | 6 and 7 | Mature Adulthood (Ages 51–65) and Late Adulthood (Ages 66–80) |
| 11 | Late Adulthood (Age 80+) | 7 | Top-coded at age 80 |
| Variables | Description | Mean/ Frequency % | Standard Deviation | Minimum | Maximum |
|---|---|---|---|---|---|
| Dependent variables | |||||
| (1) Share of total meat consumption (%) | Share of total meat consumption = (total meat consumption in grams/total food consumption in grams excl. beverages) × 100 | 16.6 | 14.1 | 0.0 | 100.0 |
| (2) Share of red meat consumption (%) | Share of red meat consumption = (red meat consumption in grams/total food consumption in grams excl. beverages) × 100 | 7.0 | 10.3 | 0.0 | 100.0 |
| Total meat consumption (grams) | 337.6 | 313.,3 | 0.0 | 4122.0 | |
| Red meat consumption (grams) | 142.1 | 214.6 | 0.0 | 3303.9 | |
| Total food consumption excl. beverages (grams) | 2168.4 | 1041.6 | 0.0 | 14,422.9 | |
| Independent variables | |||||
| Gender (binary) | 1 = male; 0 = female | 0.5 | 0.5 | 0.0 | 1.0 |
| Age (continuous) | From 0 to max. 80 years | 32.4 | 24.6 | 0.0 | 80.0 |
| Education household reference person (ordinal) | 1 = less than 9th Grade | 10.3 | |||
| 2 = 9–11th+ Grade (incl. 12th+ Grade with no diploma) | 15.3 | ||||
| 3 = High school graduate or equivalent | 22.8 | ||||
| 4 = Some college or Associate degree | 29.0 | ||||
| 5 = College graduate or above | 22.6 | ||||
| Household income (ordinal) | 1 = under US-Dollar (USD) 20,000 | 22.7 | |||
| 2 = USD 20,000 to USD 44,999 | 30.7 | ||||
| 3 = USD 45,000 to USD 64,999 | 13.6 | ||||
| 4 ≥ USD 65,000 | 33.0 | ||||
| Household size (count) | From 1 person to max. 7 persons | 3.8 | 1.7 | 1.0 | 7.0 |
| Married household reference person (binary) | 1 = married; 0 = otherwise | 0.6 | 0.5 | 0.0 | 1.0 |
| Share home consumption (%) | Share home consumption = (food consumption at home in grams incl. beverages/total food consumption at home and outside in grams incl. beverages) × 100 | 71.9 | 26.6 | 0.0 | 100.0 |
| Ethnicity (nominal) | 1 = Mexican American (base outcome) | 18.6 | |||
| 2 = Other Hispanic | 10.9 | ||||
| 3 = Non-Hispanic White | 37.8 | ||||
| 4 = Non-Hispanic Black | 22.1 | ||||
| 5 = Other race (incl. multiracial) | 10.6 | ||||
| Age class | 1 = 0 to 4 years | 13.6 | |||
| 2 = 5 to 11 years | 14.2 | ||||
| 3 = 12 to 20 years | 14.6 | ||||
| 4 = 21 to 35 years | 14.9 | ||||
| 5 = 36 to 50 years | 15.1 | ||||
| 6 = 51 to 65 years | 14.8 | ||||
| 7 ≥ 65 years | 12.8 |
| Estimation Technique and Model Variant | AIC | BIC | LL |
|---|---|---|---|
| Poisson and (1) share of total meat (in %) | 566,054 | 566,960 | −282,922 |
| Poisson and (2) share of red meat (in %) | 548,131 | 549,037 | −273,961 |
| Negative binomial and (1) share of total meat (in %) | 307,539 | 308,504 | −153,657 |
| Negative binomial and (2) share of red meat (in %) | 227,128 | 228,095 | −113,452 |
| Independent Variables | Share of Total Meat (in %) | Share of Red Meat (in %) | ||||
|---|---|---|---|---|---|---|
| β | Robust Standard Error | Average Marginal Effect | β | Robust Standard Error | Average Marginal Effect | |
| Gender | ||||||
| Age Class 1 | −0.005 | (0.030) | −0.0 | −0.075 | (0.056) | −0.2 |
| Age Class 2 | 0.056 *** | (0.021) | 0.7 | 0.058 | (0.036) | 0.3 |
| Age Class 3 | 0.086 *** | (0.021) | 1.5 | 0.221 *** | (0.036) | 1.7 |
| Age Class 4 | 0.153 *** | (0.020) | 3.2 | 0.291 *** | (0.034) | 2.8 |
| Age Class 5 | 0.168 *** | (0.018) | 3.4 | 0.282 *** | (0.033) | 2.5 |
| Age Class 6 | 0.179 *** | (0.018) | 3.5 | 0.335 *** | (0.034) | 2.8 |
| Age Class 7 | 0.158 *** | (0.021) | 2.7 | 0.239 *** | (0.038) | 1.7 |
| Education of household reference person | ||||||
| Age Class 1 | −0.048 *** | (0.016) | −0.3 | −0.042 | (0.029) | −0.1 |
| Age Class 2 | −0.025 ** | (0.011) | −0.3 | −0.024 | (0.019) | −0.1 |
| Age Class 3 | −0.040 *** | (0.010) | −0.7 | −0.075 *** | (0.017) | −0.6 |
| Age Class 4 | −0.043 *** | (0.010) | −0.9 | −0.090 *** | (0.017) | −0.9 |
| Age Class 5 | −0.046 *** | (0.009) | −1.0 | −0.079 *** | (0.016) | −0.7 |
| Age Class 6 | −0.052 *** | (0.008) | −1.0 | −0.071 *** | (0.013) | −0.6 |
| Age Class 7 | −0.046 *** | (0.009) | −0.8 | −0.074 *** | (0.016) | −0.6 |
| Household income | ||||||
| Age Class 1 | −0.038 ** | (0.017) | −0.3 | −0.125 *** | (0.032) | −0.3 |
| Age Class 2 | −0.032 *** | (0.011) | −0.4 | −0.078 *** | (0.019) | −0.4 |
| Age Class 3 | −0.020 * | (0.011) | −0.4 | −0.047 ** | (0.019) | −0.4 |
| Age Class 4 | −0.023 ** | (0.010) | −0.5 | −0.055 *** | (0.017) | −0.5 |
| Age Class 5 | −0.016 * | (0.009) | −0.3 | −0.047 *** | (0.017) | −0.4 |
| Age Class 6 | −0.027 *** | (0.009) | −0.5 | −0.057 *** | (0.017) | −0.5 |
| Age Class 7 | −0.022 ** | (0.010) | −0.4 | −0.051 ** | (0.020) | −0.4 |
| Household size | ||||||
| Age Class 1 | 0.027 ** | (0.012) | 0.2 | 0.083 *** | (0.022) | 0.2 |
| Age Class 2 | −0.008 | (0.008) | −0.1 | 0.010 | (0.014) | 0.1 |
| Age Class 3 | −0.042 *** | (0.008) | −0.7 | −0.051 *** | (0.014) | −0.4 |
| Age Class 4 | 0.020 *** | (0.007) | 0.4 | 0.024 ** | (0.012) | 0.2 |
| Age Class 5 | 0.003 | (0.006) | 0.1 | 0.026 ** | (0.011) | 0.2 |
| Age Class 6 | 0.001 | (0.006) | 0.0 | 0.019 * | (0.011) | 0.2 |
| Age Class 7 | 0.011 | (0.009) | 0.2 | 0.001 | (0.017) | 0.0 |
| Married household reference person | ||||||
| Age Class 1 | −0.050 | (0.036) | −0.3 | 0.057 | (0.056) | 0.1 |
| Age Class 2 | −0.004 | (0.024) | −0.1 | 0.026 | (0.043) | 0.1 |
| Age Class 3 | −0.057 ** | (0.025) | −1.0 | −0.046 | (0.042) | −0.4 |
| Age Class 4 | −0.056 *** | (0.021) | −1.2 | −0.086 ** | (0.037) | −0.8 |
| Age Class 5 | −0.042* | (0.021) | −0.9 | −0.047 | (0.038) | −0.4 |
| Age Class 6 | −0.013 | (0.020) | −0.3 | 0.014 | (0.037) | 0.1 |
| Age Class 7 | 0.036 | (0.023) | 0.6 | 0.107 *** | (0.042) | 0.8 |
| Share of home consumption | ||||||
| Age Class 1 | −0.006 *** | (0.001) | −0.4 | −0.009 *** | (0.001) | −0.2 |
| Age Class 2 | −0.001** | (0.001) | −0.1 | −0.001 | (0.001) | −0.0 |
| Age Class 3 | −0.002 *** | (0.000) | −0.4 | −0.004 *** | (0.001) | −0.3 |
| Age Class 4 | −0.002 *** | (0.000) | −0.5 | −0.003 *** | (0.001) | −0.3 |
| Age Class 5 | −0.002 *** | (0.000) | −0.3 | −0.003 *** | (0.001) | −0.3 |
| Age Class 6 | −0.002 *** | (0.000) | −0.3 | −0.001 | (0.001) | −0.1 |
| Age Class 7 | −0.003 *** | (0.001) | −0.6 | −0.005 *** | (0.001) | −0.3 |
| Time Fixed Effects | Yes | Yes | ||||
| Ethnicity Fixed Effects | Yes | Yes | ||||
| No. of observations | ||||||
| Age Class 1 | 5652 | 5652 | ||||
| Age Class 2 | 5901 | 5901 | ||||
| Age Class 3 | 5960 | 5960 | ||||
| Age Class 4 | 6040 | 6040 | ||||
| Age Class 5 | 6243 | 6243 | ||||
| Age Class 6 | 6115 | 6115 | ||||
| Age Class 7 | 5356 | 5356 | ||||
Publisher’s Note: MDPI stays neutral with regard to jurisdictional claims in published maps and institutional affiliations. |
© 2021 by the authors. Licensee MDPI, Basel, Switzerland. This article is an open access article distributed under the terms and conditions of the Creative Commons Attribution (CC BY) license (https://creativecommons.org/licenses/by/4.0/).
Share and Cite
Ritzel, C.; Mann, S. The Old Man and the Meat: On Gender Differences in Meat Consumption across Stages of Human Life. Foods 2021, 10, 2809. https://doi.org/10.3390/foods10112809
Ritzel C, Mann S. The Old Man and the Meat: On Gender Differences in Meat Consumption across Stages of Human Life. Foods. 2021; 10(11):2809. https://doi.org/10.3390/foods10112809
Chicago/Turabian StyleRitzel, Christian, and Stefan Mann. 2021. "The Old Man and the Meat: On Gender Differences in Meat Consumption across Stages of Human Life" Foods 10, no. 11: 2809. https://doi.org/10.3390/foods10112809
APA StyleRitzel, C., & Mann, S. (2021). The Old Man and the Meat: On Gender Differences in Meat Consumption across Stages of Human Life. Foods, 10(11), 2809. https://doi.org/10.3390/foods10112809