
Utilizing a Rapid Multi-Plug Filtration Cleanup Method for 72 Pesticide Residues in Grape Wines Followed by Detection with Gas Chromatography Tandem Mass Spectrometry

 ,
,
Abstract
:1. Introduction
2. Materials and Methods
2.1. Chemicals and Materials
2.2. Apparatus and Conditions
2.3. Sample Preparation
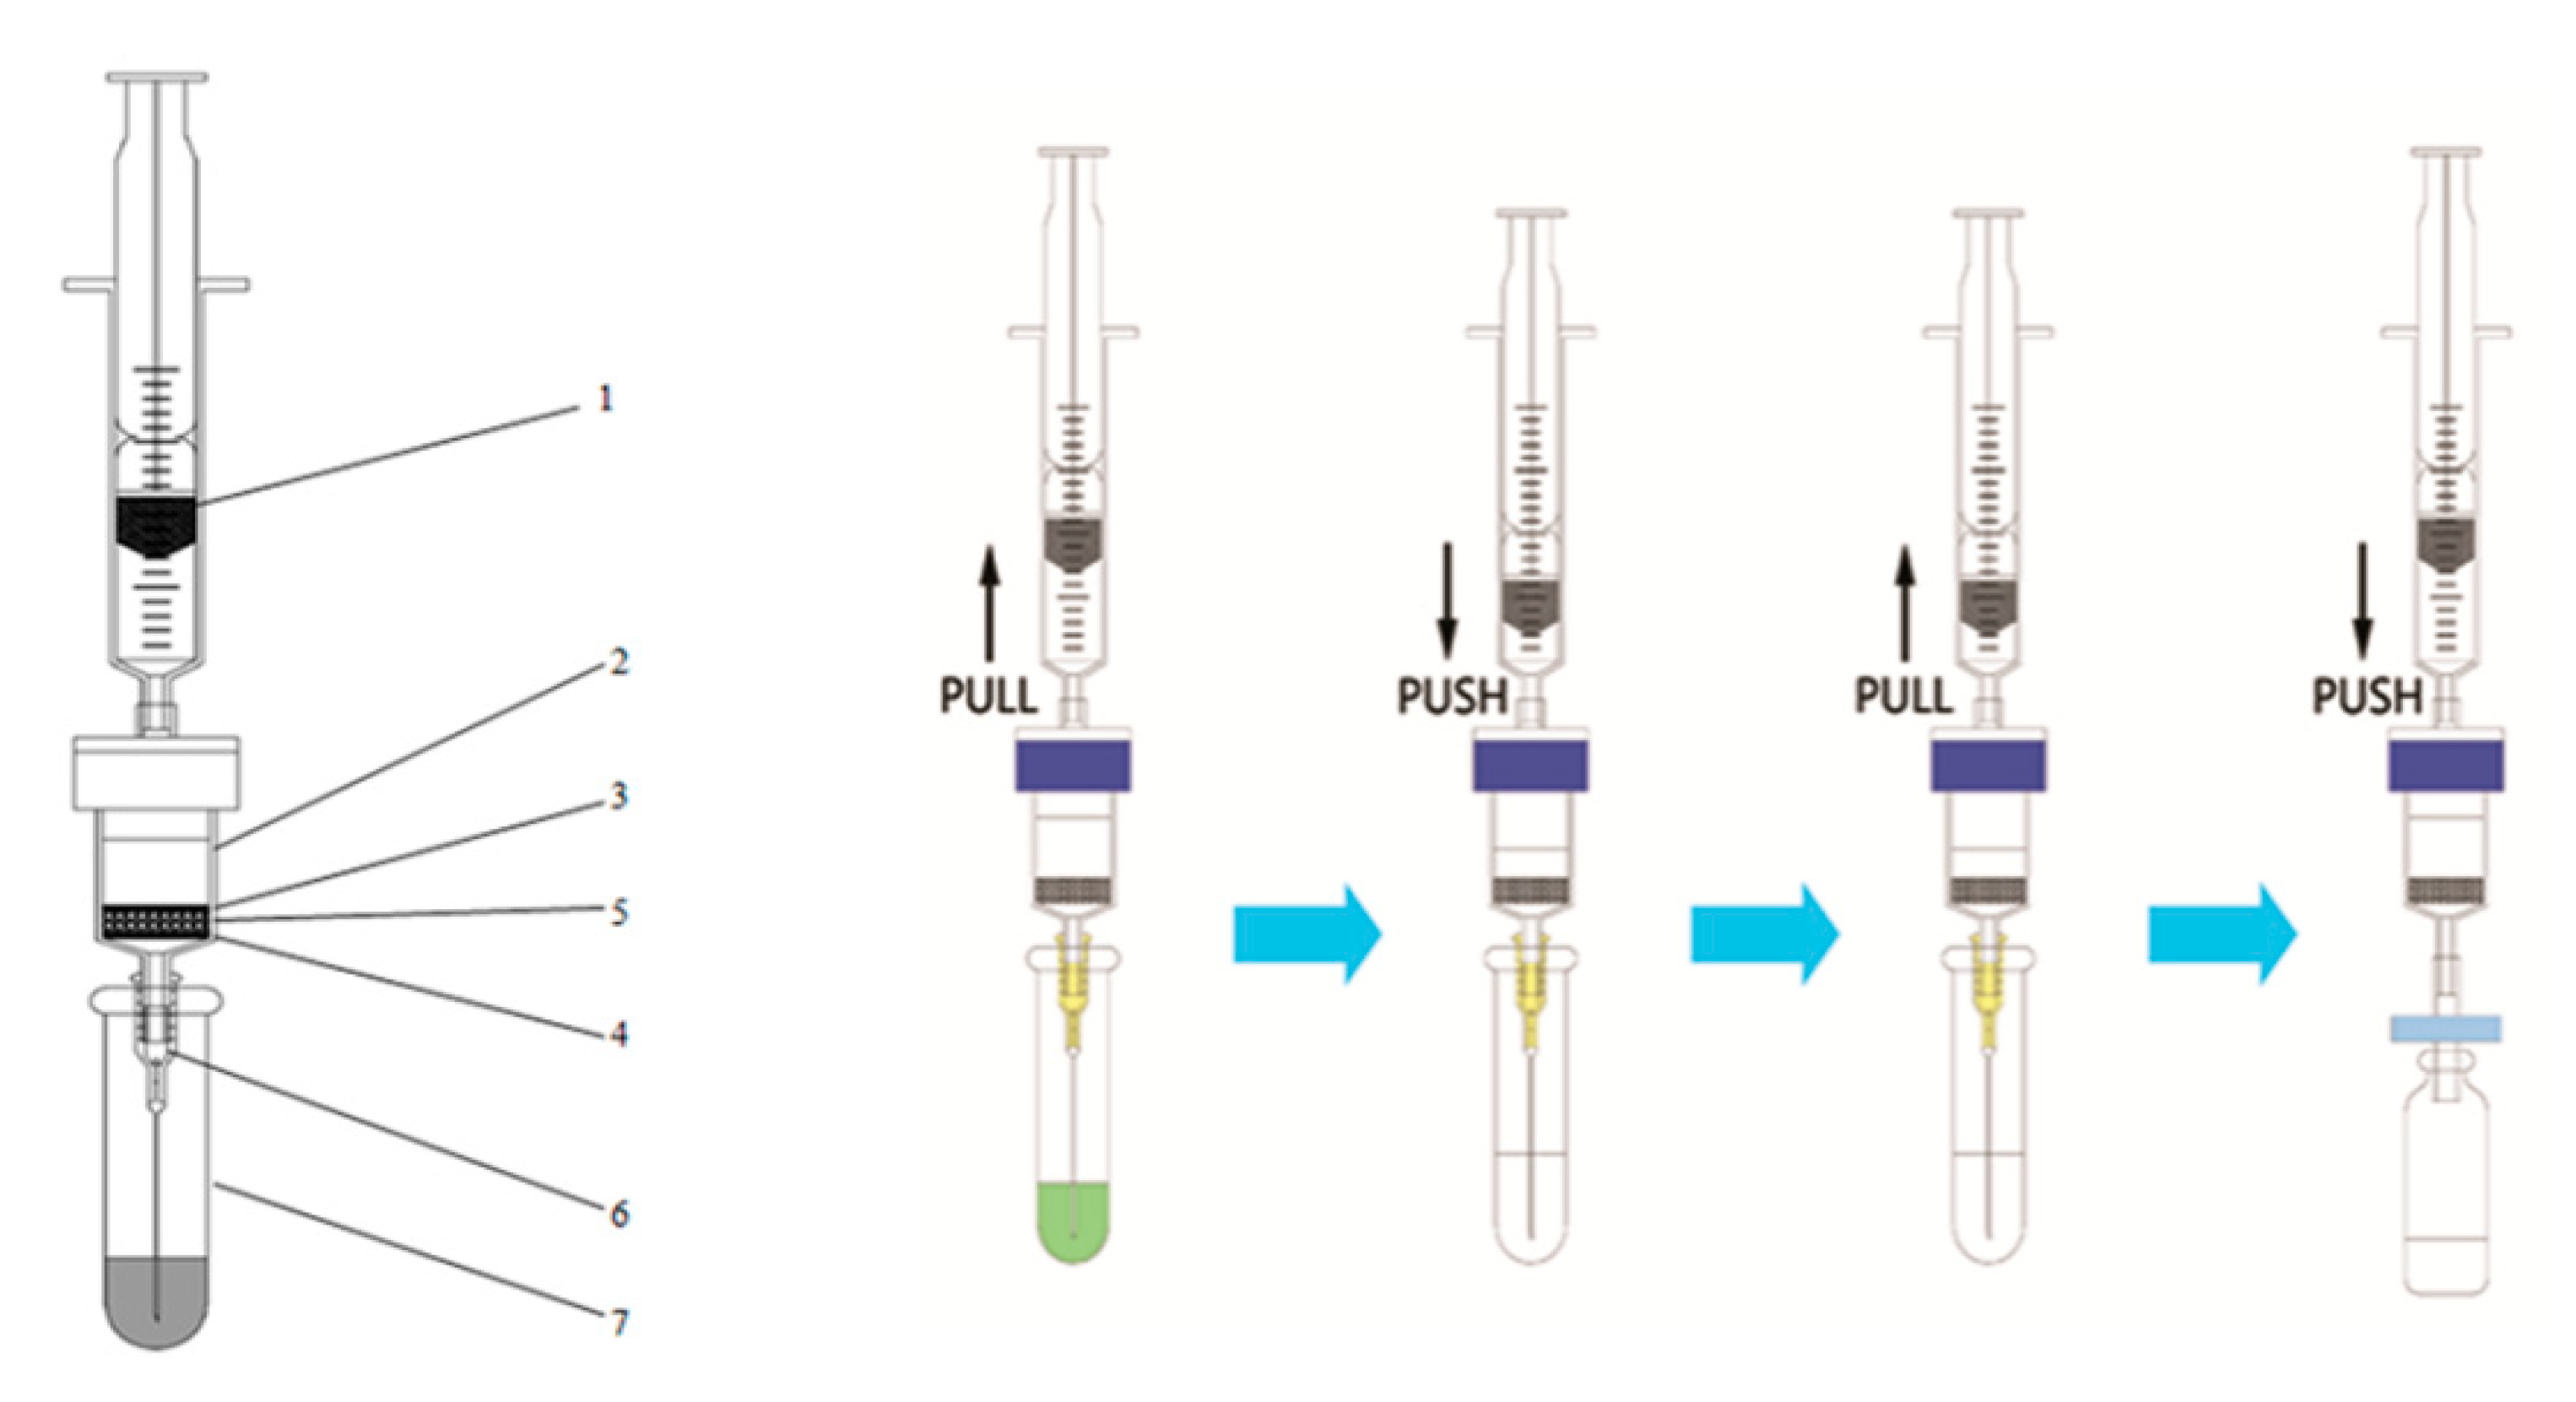
2.4. m-PFC Procedures
2.5. Method Performance
2.6. Analysis of Grape Wine Samples
3. Results and Discussion
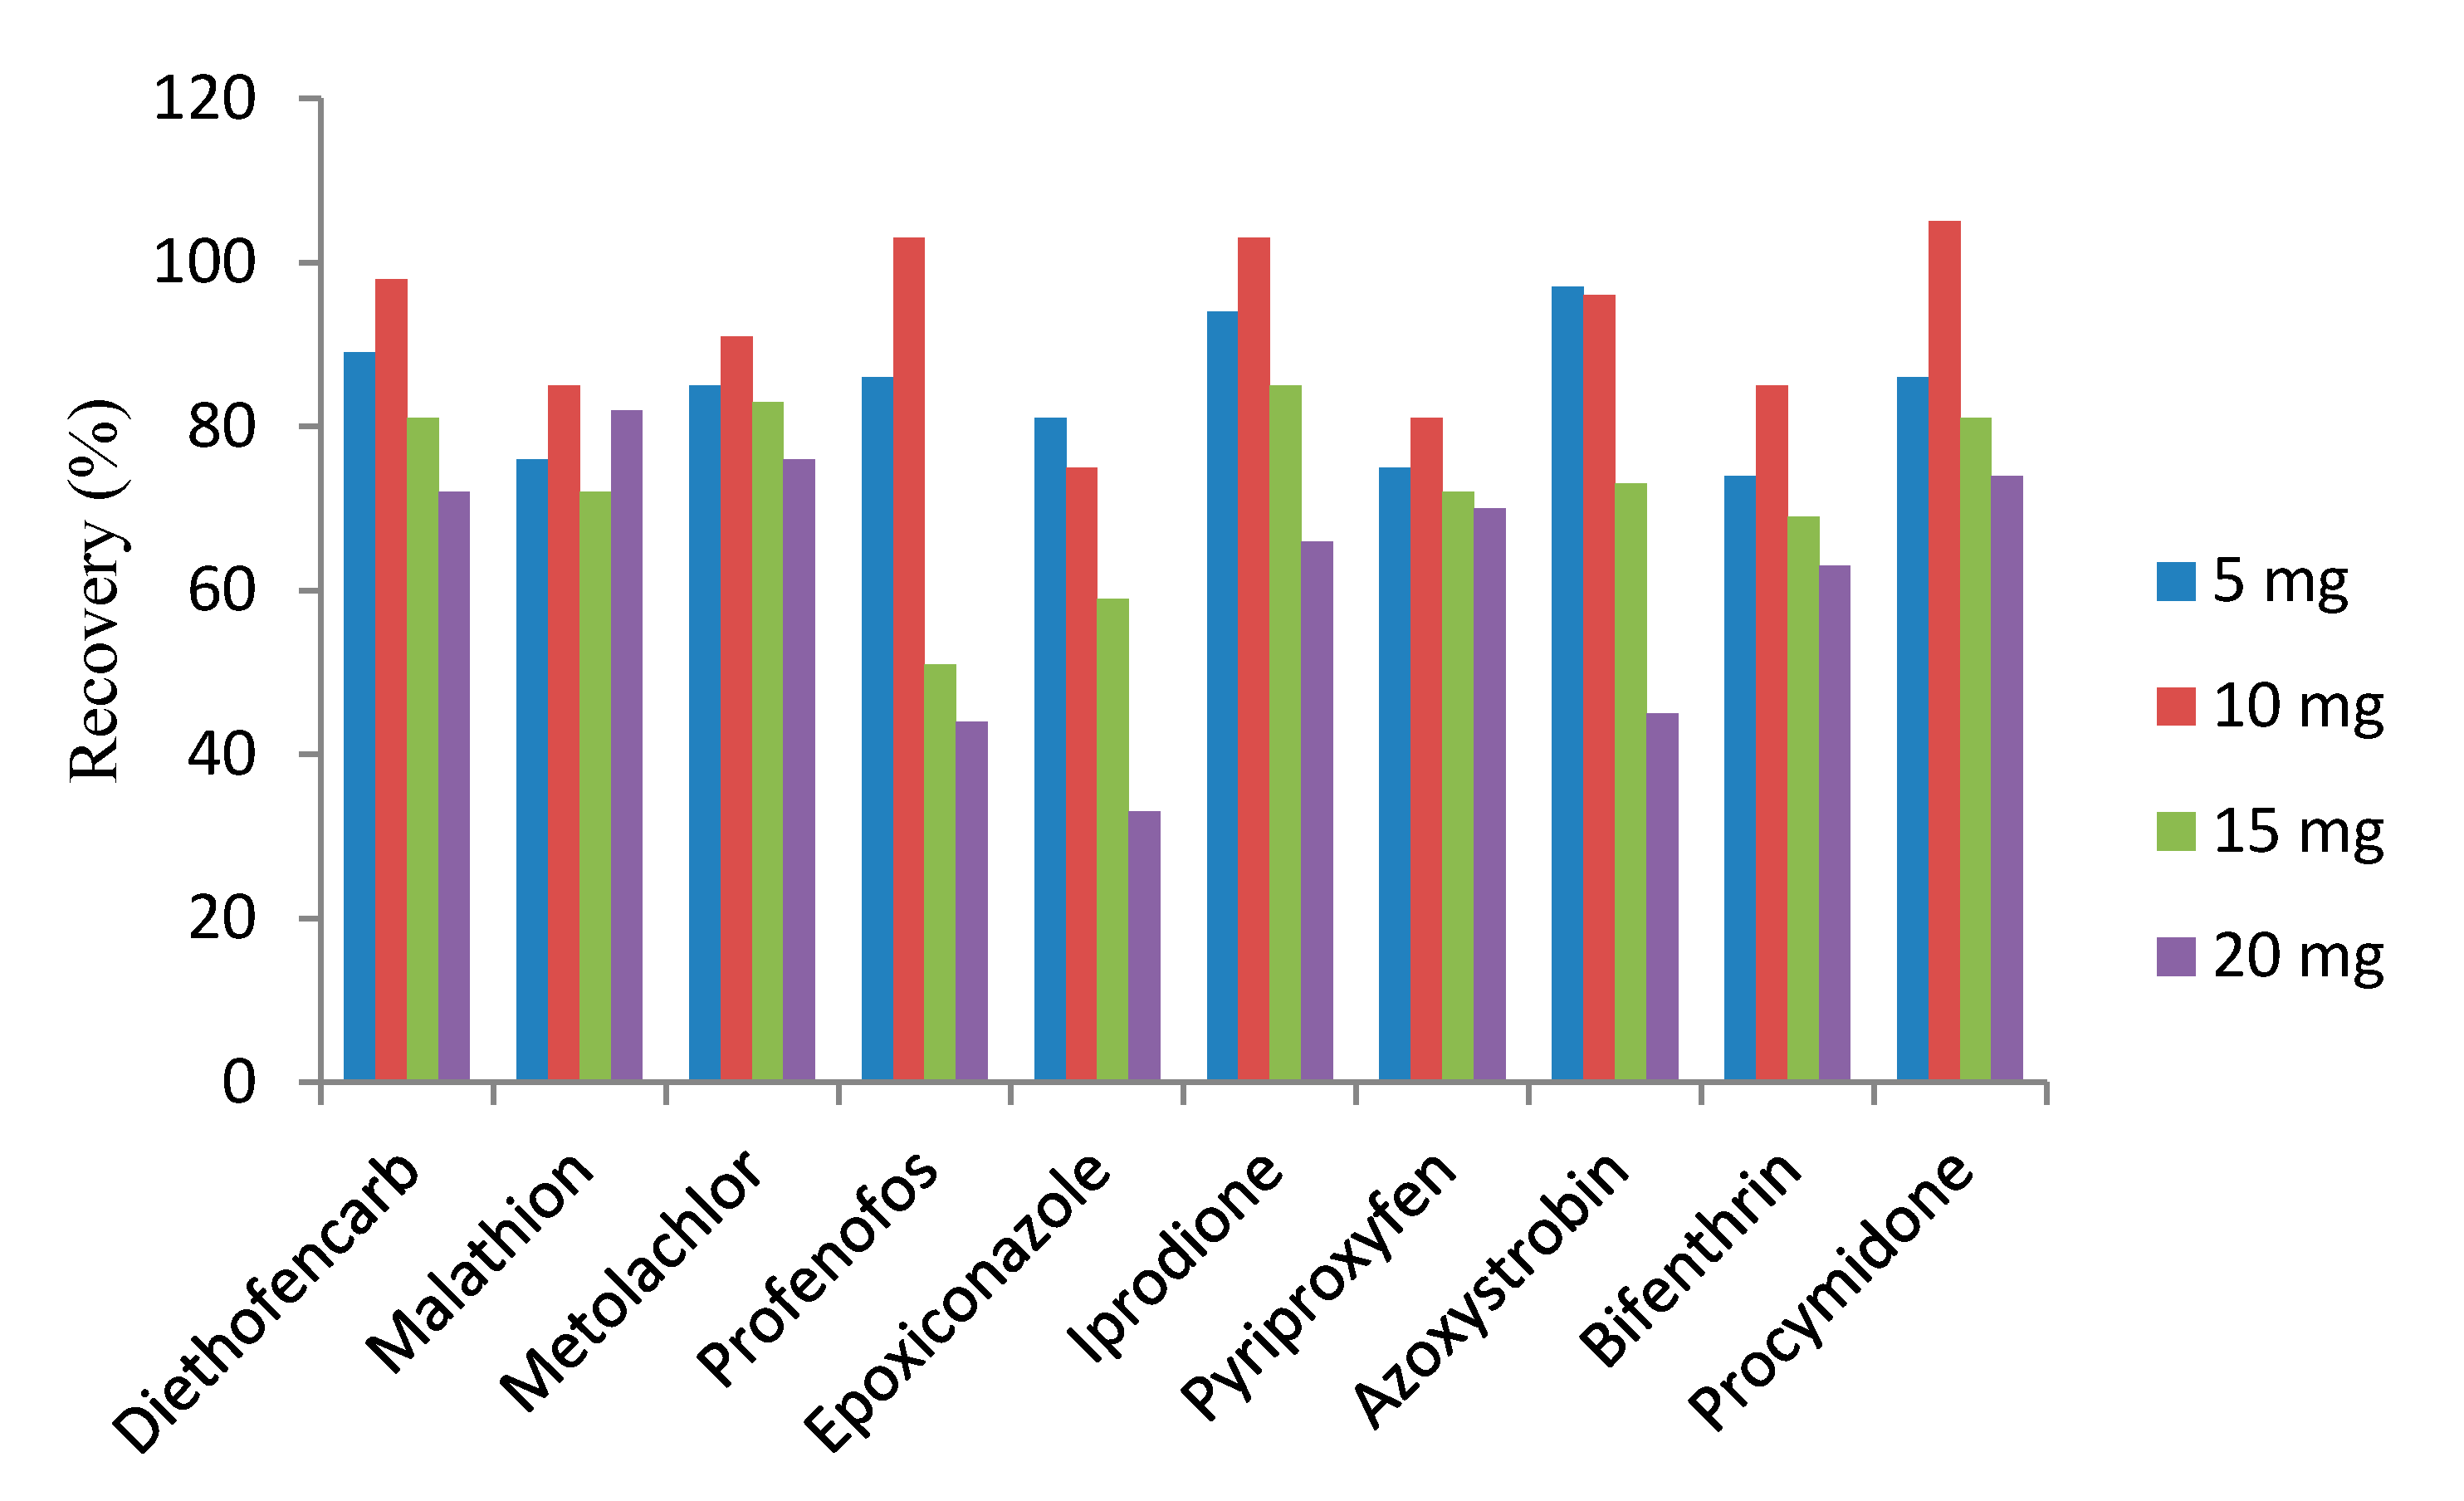
3.1. Amount of the MWCNTs
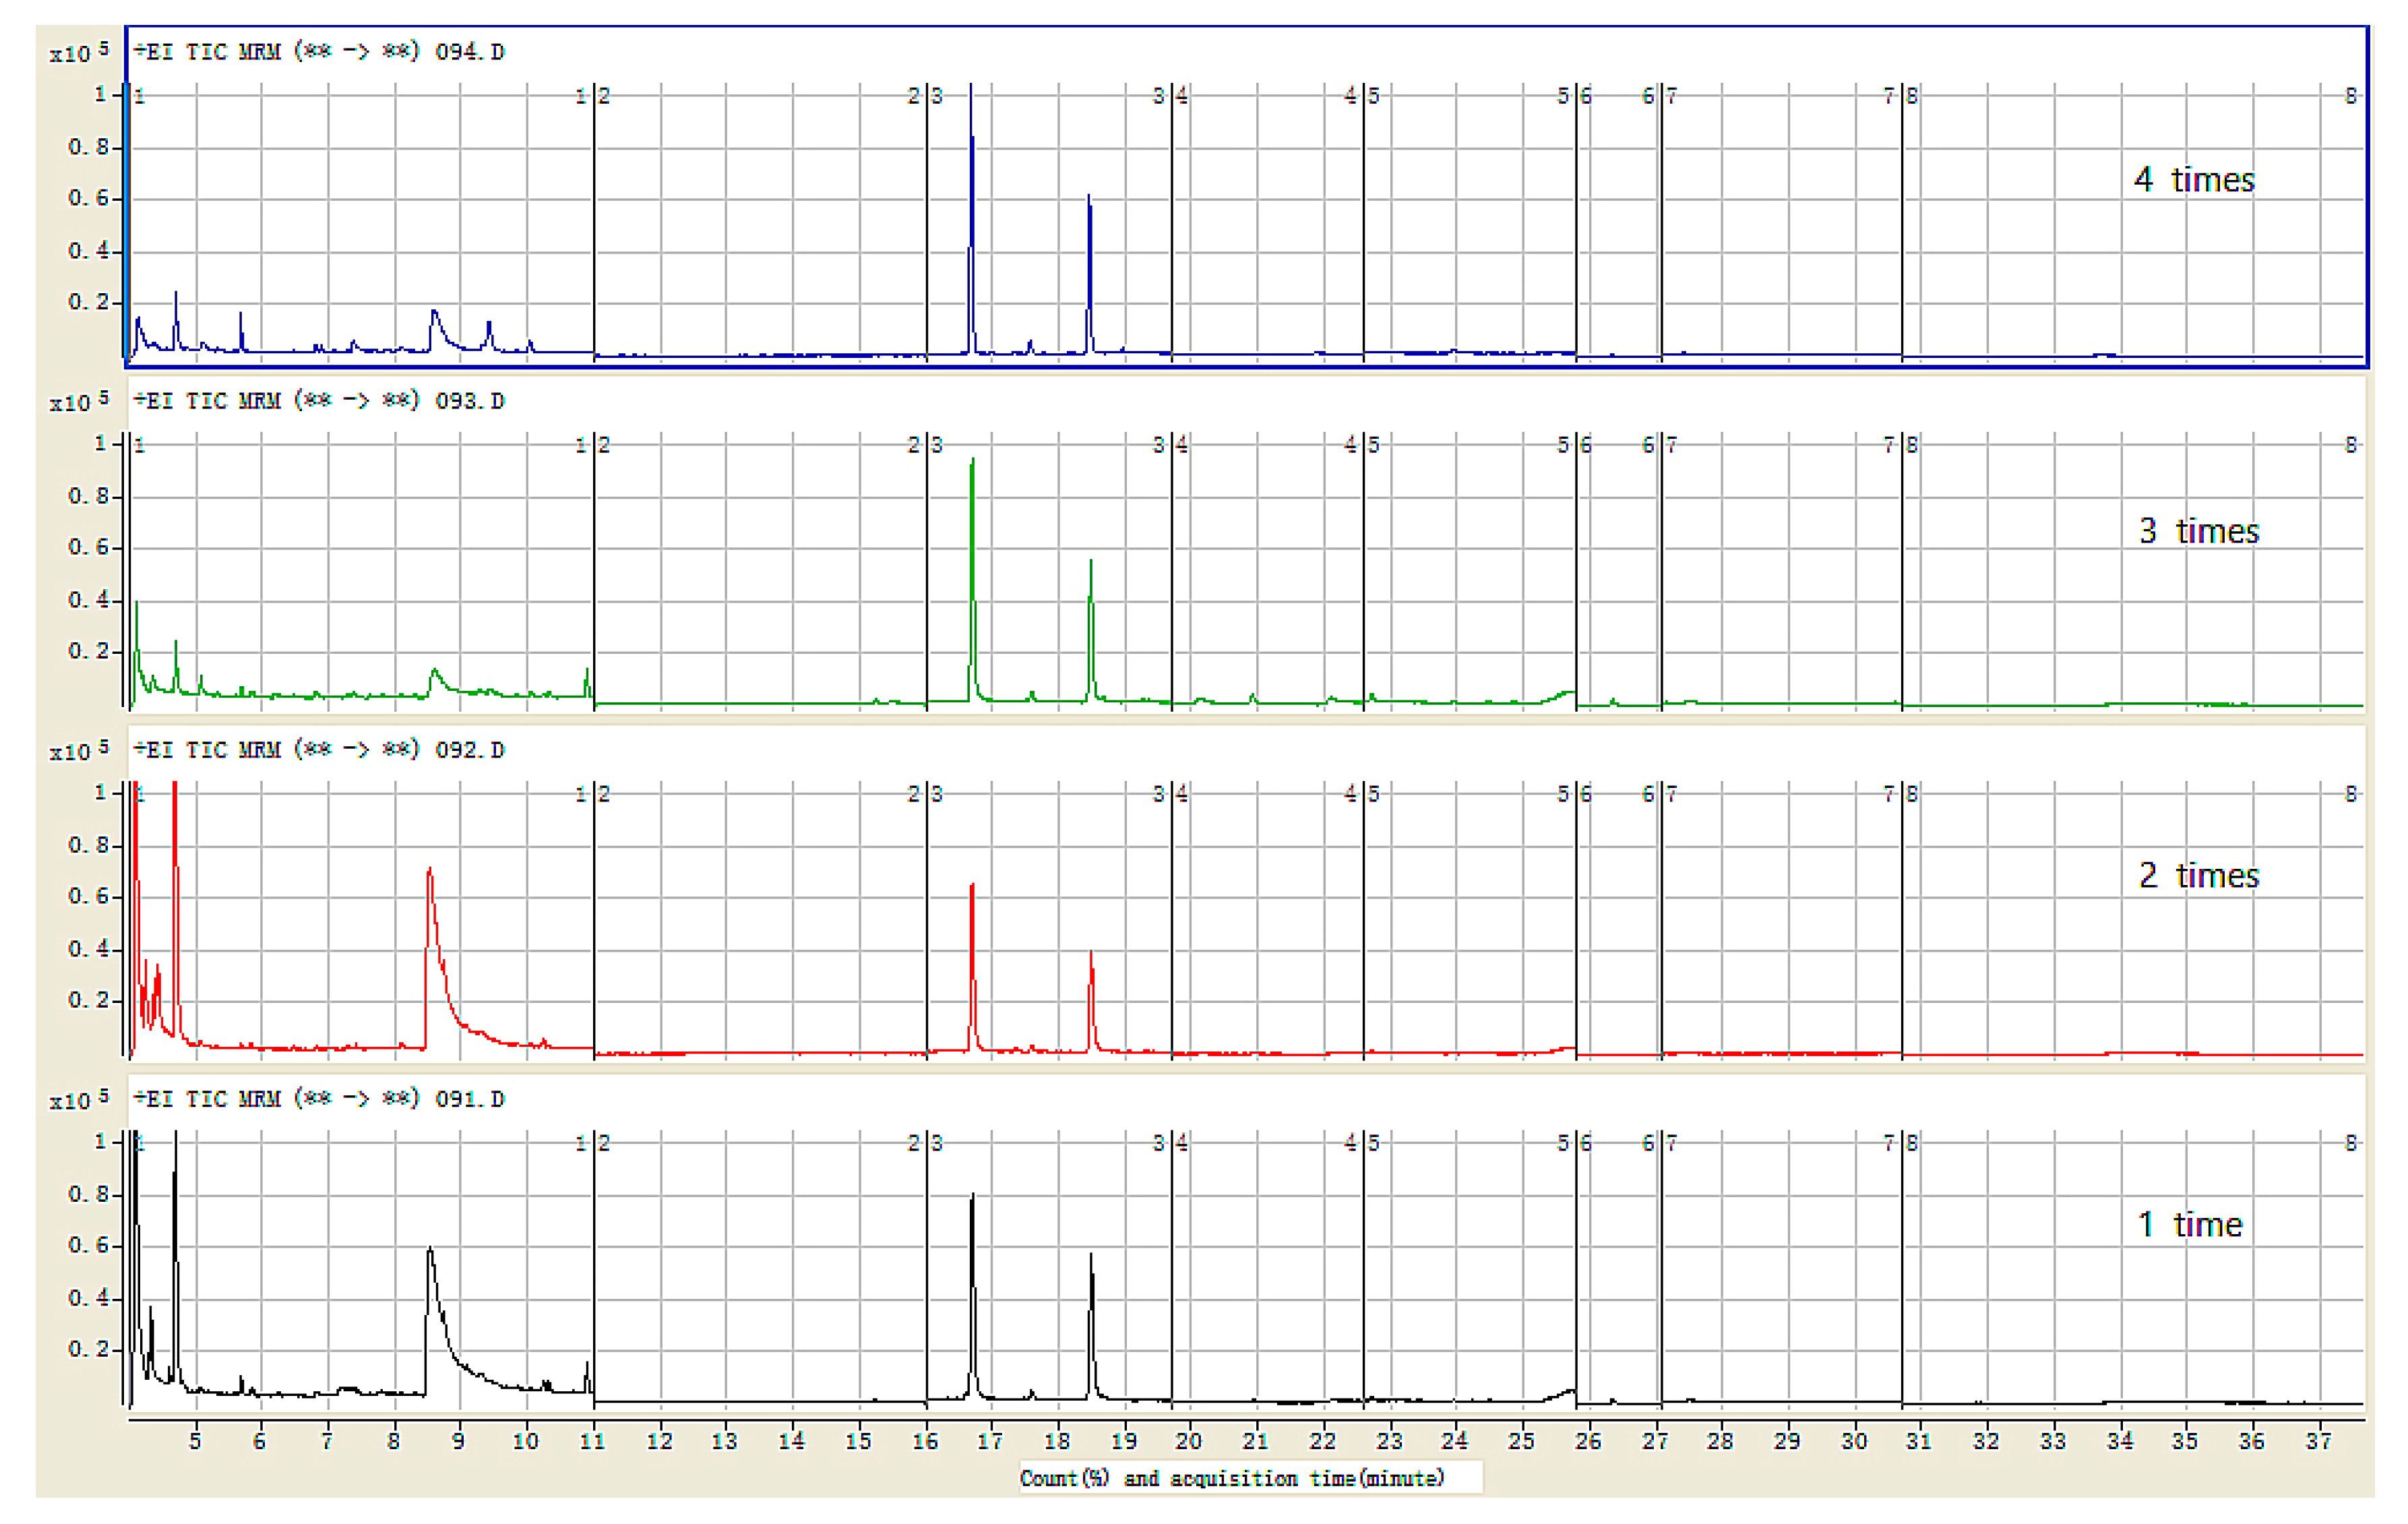
3.2. Optimization of the m-PFC Procedure Cycle Times
3.3. Validation of the Method
3.3.1. Linearity and Matrix Effects
3.3.2. Recovery and Precision
3.3.3. Limits of Quantitation and Limits of Detection
3.4. Method Application
4. Conclusions
Author Contributions
Funding
Conflicts of Interest
References
- Holahan, C.J.; Schutte, K.K.; Brennan, P.L.L.; North, R.J.; Holahan, C.K.; Moos, B.S.; Moos, R.H. Wine consumption and 20-year mortality among late-life moderate drinkers. J. Stud. Alcohol Drugs 2012, 73, 80–88. [Google Scholar] [CrossRef] [PubMed] [Green Version]
- Covas, M.I.; Gambert, P.; Fitó, M.; de la Torre, R. Wine and oxidative stress: Up-to-date evidence of the effects of moderate wine consumption on oxidative damage in humans. Atherosclerosis 2010, 208, 297–304. [Google Scholar] [CrossRef] [PubMed]
- The International Organisation of Vine and Wine. Available online: http://www.oiv.int/oiv/info/enpublicationsstatistiques (accessed on 28 September 2021).
- Moeder, M.; Bauer, C.; Popp, P.; Van Pinxteren, M.; Reemtsma, T. Determination of pesticide residues in wine by membrane-assisted solvent extraction and high-performance liquid chromatography–tandem mass spectrometry. Anal. Bioanal. Chem. 2012, 403, 1731–1741. [Google Scholar] [CrossRef] [PubMed]
- Yigit, N.; Velioglu, Y.S. Effects of processing and storage on pesticide residues in foods. Crit. Rev. Food Sci. Nutr. 2019, 60, 1–20. [Google Scholar] [CrossRef]
- Rahman, S.; Mele, M.A.; Lee, Y.-T.; Islam, M.Z. Consumer preference, quality, and safety of organic and conventional fresh fruits, vegetables, and cereals. Foods 2021, 10, 105. [Google Scholar] [CrossRef]
- Schusterova, D.; Hajslova, J.; Kocourek, V.; Pulkrabova, J. Pesticide residues and their metabolites in grapes and wines from conventional and organic farming system. Foods 2021, 10, 307. [Google Scholar] [CrossRef]
- Yang, M.; Luo, F.; Zhang, X.; Zhou, L.; Lou, Z.; Zhao, M.; Chen, Z. Dissipation and risk assessment of multiresidual fungicides in grapes under field conditions. J. Agric. Food Chem. 2020, 68, 1071–1078. [Google Scholar] [CrossRef]
- Jin, B.; Xie, L.; Guo, Y.; Pang, G. Multi-residue detection of pesticides in juice and fruit wine: A review of extraction and detection methods. Food Res. Int. 2012, 46, 399–409. [Google Scholar] [CrossRef]
- Tsakiris, I.; Tzatzarakis, M.; Alegakis, A.; Mitlianga, P.; Kavvalakis, M.; Vakonaki, E.; Goumenou, M.; Stivaktakis, P.; Tsatsakis, A. Monitoring of pesticides residues in Greek bottled wine. Toxicol. Lett. 2014, 229, S184. [Google Scholar] [CrossRef]
- Čuš, F.; Česnik, H.B.; Bolta, Š.V.; Gregorčič, A. Pesticide residues and microbiological quality of bottled wines. Food Control 2010, 21, 150–154. [Google Scholar] [CrossRef]
- Angioni, A.; Dedola, F. Three years monitoring survey of pesticide residues in Sardinia wines following integrated pest management strategies. Environ. Monit. Assess. 2013, 185, 4281–4289. [Google Scholar] [CrossRef]
- He, Z.; Xu, Y.; Wang, L.; Peng, Y.; Luo, M.; Cheng, H.; Liu, X. Wide-scope screening and quantification of 50 pesticides in wine by liquid chromatography/quadrupole time-of-flight mass spectrometry combined with liquid chromatography/quadrupole linear ion trap mass spectrometry. Food Chem. 2016, 196, 1248–1255. [Google Scholar] [CrossRef]
- Oliva, J.; Martínez-Gil, A.; Lorenzo, C.; Cámara, M.; Salinas, M.; Barba, A.; Garde-Cerdán, T. Influence of the use of fungicides on the volatile composition of Monastrell red wines obtained from inoculated fermentation. Food Chem. 2015, 170, 401–406. [Google Scholar] [CrossRef]
- Celeiro, M.; Llompart, M.; Lamas, J.P.; Lores, M.; Garcia-Jares, C.; Dagnac, T. Determination of fungicides in white grape bagasse by pressurized liquid extraction and gas chromatography tandem mass spectrometry. J. Chromatogr. A 2014, 1343, 18–25. [Google Scholar] [CrossRef]
- Pelajić, M.; Peček, G.; Pavlović, D.M.; Čepo, D.V. Novel multiresidue method for determination of pesticides in red wine using gas chromatography–mass spectrometry and solid phase extraction. Food Chem. 2016, 200, 98–106. [Google Scholar] [CrossRef]
- Santana-Mayor, Á.; Rodríguez-Ramos, R.; Socas-Rodríguez, B.; Díaz-Romero, C.; Rodríguez-Delgado, M. Comparison of pesticide residue levels in red wines from Canary Islands, Iberian Peninsula, and Cape Verde. Foods 2020, 9, 1555. [Google Scholar] [CrossRef]
- González-Rodríguez, R.M.; Cancho-Grande, B.; Simal-Gándara, J. Multiresidue determination of 11 new fungicides in grapes and wines by liquid–liquid extraction/clean-up and programmable temperature vaporization injection with analyte protectants/gas chromatography/ion trap mass spectrometry. J. Chromatogr. A 2009, 1216, 6033–6042. [Google Scholar] [CrossRef]
- Zhong, X.-D.; Fu, D.-S.; Wu, P.-P.; Liu, Q.; Lin, G.-C.; Cao, S.-H.; Li, Y.-Q. Rapid fluorescence spectroscopic screening method for the sensitive detection of thiabendazole in red wine. Anal. Methods 2014, 6, 7260–7267. [Google Scholar] [CrossRef]
- Uclés, A.; García, A.V.; Gil García, M.D.; del Real, A.M.A.; Fernández-Alba, A.R. Benzimidazole and imidazole fungicide analysis in grape and wine samples using a competitive enzyme-linked immunosorbent assay. Anal. Methods 2015, 7, 9158–9165. [Google Scholar] [CrossRef]
- Economou, A.; Botitsi, H.; Antoniou, S.; Tsipi, D. Determination of multi-class pesticides in wines by solid-phase extraction and liquid chromatography-tandem mass spectrometry. J. Chromatogr. A 2009, 1216, 5856–5867. [Google Scholar] [CrossRef]
- Carpinteiro, I.; Ramil, M.; Rodríguez, I.; Cela, R. Determination of fungicides in wine by mixed-mode solid phase extraction and liquid chromatography coupled to tandem mass spectrometry. J. Chromatogr. A 2010, 1217, 7484–7492. [Google Scholar] [CrossRef]
- Pang, G.-F.; Fan, C.-L.; Liu, Y.-M.; Cao, Y.-Z.; Zhang, J.-J.; Fu, B.-L.; Li, X.-M.; Li, Z.-Y.; Wu, Y.-P. Multi-residue method for the determination of 450 pesticide residues in honey, fruit juice and wine by double-cartridge solid-phase extraction/gas chromatography-mass spectrometry and liquid chromatography-tandem mass spectrometry. Food Addit. Contam. 2006, 23, 777–810. [Google Scholar] [CrossRef]
- Walorczyk, S.; Drozdzynski, D.; Gnusowski, B. Multiresidue determination of 160 pesticides in wines employing mixed-mode dispersive-solid phase extraction and gas chromatography–tandem mass spectrometry. Talanta 2011, 85, 1856–1870. [Google Scholar] [CrossRef]
- Fontana, A.; Rodríguez, I.; Ramil, M.; Altamirano, J.; Cela, R. Solid-phase extraction followed by liquid chromatography quadrupole time-of-flight tandem mass spectrometry for the selective determination of fungicides in wine samples. J. Chromatogr. A 2011, 1218, 2165–2175. [Google Scholar] [CrossRef]
- Pérez-Ortega, P.; Gilbert-López, B.; García-Reyes, J.F.; Ramos-Martos, N.; Molina-Díaz, A. Generic sample treatment method for simultaneous determination of multiclass pesticides and mycotoxins in wines by liquid chromatography–mass spectrometry. J. Chromatogr. A 2012, 1249, 32–40. [Google Scholar] [CrossRef]
- Beneito-Cambra, M.; Pérez-Ortega, P.; Molina-Díaz, A.; García-Reyes, J.F. Rapid determination of multiclass fungicides in wine by low-temperature plasma (LTP) ambient ionization mass spectrometry. Anal. Methods 2015, 7, 7345–7351. [Google Scholar] [CrossRef]
- Zambonin, C.G.; Quinto, M.; De Vietro, N.; Palmisano, F. Solid-phase microextraction—Gas chromatography mass spectrometry: A fast and simple screening method for the assessment of organophosphorus pesticides residues in wine and fruit juices. Food Chem. 2004, 86, 269–274. [Google Scholar] [CrossRef]
- Fontana, A.; Rodríguez, I.; Ramil, M.; Altamirano, J.; Cela, R. Liquid chromatography time-of-flight mass spectrometry following sorptive microextraction for the determination of fungicide residues in wine. Anal. Bioanal. Chem. 2011, 401, 767–775. [Google Scholar] [CrossRef]
- You, X.; Wang, S.; Liu, F.; Shi, K. Ultrasound-assisted surfactant-enhanced emulsification microextraction based on the solidification of a floating organic droplet used for the simultaneous determination of six fungicide residues in juices and red wine. J. Chromatogr. A 2013, 1300, 64–69. [Google Scholar] [CrossRef]
- Viñas, P.; Martínez-Castillo, N.; Campillo, N.; Hernández-Córdoba, M. Liquid–liquid microextraction methods based on ultrasound-assisted emulsification and single-drop coupled to gas chromatography–mass spectrometry for determining strobilurin and oxazole fungicides in juices and fruits. J. Chromatogr. A 2010, 1217, 6569–6577. [Google Scholar] [CrossRef]
- Garbi, A.; Sakkas, V.; Fiamegos, Y.C.; Stalikas, C.D.; Albanis, T. Sensitive determination of pesticides residues in wine samples with the aid of single-drop microextraction and response surface methodology. Talanta 2010, 82, 1286–1291. [Google Scholar] [CrossRef] [PubMed]
- Cabo, T.R.; Rodríguez, I.; Ramil, M.; Cela, R. Dispersive liquid–liquid microextraction using non-chlorinated, lighter than water solvents for gas chromatography—Mass spectrometry determination of fungicides in wine. J. Chromatogr. A 2011, 1218, 6603–6611. [Google Scholar] [CrossRef] [PubMed]
- Dos Anjos, J.P.; de Andrade, J.B. Simultaneous determination of pesticide multiresidues in white wine and rosé wine by SDME/GC-MS. Microchem. J. 2015, 120, 69–76. [Google Scholar] [CrossRef]
- Montes, R.; Rodríguez, I.; Ramil, M.; Rubí, E.; Cela, R. Solid-phase extraction followed by dispersive liquid–liquid microextraction for the sensitive determination of selected fungicides in wine. J. Chromatogr. A 2009, 1216, 5459–5466. [Google Scholar] [CrossRef]
- Cabo, T.R.; Rodríguez, I.; Cela, R. Determination of hydroxylated stilbenes in wine by dispersive liquid–liquid microextraction followed by gas chromatography mass spectrometry. J. Chromatogr. A 2012, 1258, 21–29. [Google Scholar] [CrossRef]
- Gure, A.; Lara, F.J.; García-Campaña, A.M.; Megersa, N.; del Olmo-Iruela, M. Vortex-assisted ionic liquid dispersive liquid–liquid microextraction for the determination of sulfonylurea herbicides in wine samples by capillary high-performance liquid chromatography. Food Chem. 2015, 170, 348–353. [Google Scholar] [CrossRef]
- Anastassiades, M.; Lehotay, S.J.; Štajnbaher, D.; Schenck, F.J. Fast and easy multiresidue method employing acetonitrile extraction/partitioning and “Dispersive Solid-Phase Extraction” for the determination of pesticide residues in produce. J. AOAC Int. 2003, 86, 412–431. [Google Scholar] [CrossRef] [Green Version]
- Lehotay, S.J.; Son, K.A.; Kwon, H.; Koesukwiwat, U.; Fu, W.; Mastovska, K.; Hoh, E.; Leepipatpiboon, N. Comparison of QuEChERS sample preparation methods for the analysis of pesticide residues in fruits and vegetables. J. Chromatogr. A 2010, 1217, 2548–2560. [Google Scholar] [CrossRef]
- Zhang, K.; Wong, J.W.; Hayward, D.G.; Sheladia, P.; Krynitsky, A.J.; Schenck, F.J.; Webster, M.G.; Ammann, J.A.; Ebeler, S. Multiresidue pesticide analysis of wines by dispersive solid-phase extraction and ultrahigh-performance liquid chromatography−tandem mass spectrometry. J. Agric. Food Chem. 2009, 57, 4019–4029. [Google Scholar] [CrossRef]
- Jiang, Y.; Li, X.; Xu, J.; Pan, C.; Zhang, J.; Niu, W. Multiresidue method for the determination of 77 pesticides in wine using QuEChERS sample preparation and gas chromatography with mass spectrometry. Food Addit. Contam. Part. A 2009, 26, 859–866. [Google Scholar] [CrossRef]
- Cunha, S.; Fernandes, J.; Alves, A.; Oliveira, B. Fast low-pressure gas chromatography–mass spectrometry method for the determination of multiple pesticides in grapes, musts and wines. J. Chromatogr. A 2009, 1216, 119–126. [Google Scholar] [CrossRef]
- Patil, S.H.; Banerjee, K.; Dasgupta, S.; Oulkar, D.P.; Patil, S.B.; Jadhav, M.R.; Savant, R.H.; Adsule, P.G.; Deshmukh, M.B. Multiresidue analysis of 83 pesticides and 12 dioxin-like polychlorinated biphenyls in wine by gas chromatography–time-of-flight mass spectrometry. J. Chromatogr. A 2009, 1216, 2307–2319. [Google Scholar] [CrossRef]
- Stadler, R.H.; Tran, L.-A.; Cavin, C.; Zbinden, P.; Konings, E.J.M. Analytical approaches to verify food integrity: Needs and challenges. J. AOAC Int. 2016, 99, 1135–1144. [Google Scholar] [CrossRef]
- Payá, P.; Anastassiades, M.; Mack, D.; Sigalova, I.; Tasdelen, B.; Oliva, J.; Barba, A. Analysis of pesticide residues using the Quick Easy Cheap Effective Rugged and Safe (QuEChERS) pesticide multiresidue method in combination with gas and liquid chromatography and tandem mass spectrometric detection. Anal. Bioanal. Chem. 2007, 389, 1697–1714. [Google Scholar] [CrossRef]
- Romero-González, R.; Frenich, A.G.; Vidal, J.M.; Prestes, O.D.; Grio, S. Simultaneous determination of pesticides, biopesticides and mycotoxins in organic products applying a quick, easy, cheap, effective, rugged and safe extraction procedure and ultra-high performance liquid chromatography–tandem mass spectrometry. J. Chromatogr. A 2011, 1218, 1477–1485. [Google Scholar] [CrossRef]
- Martínez, G.; Morales, A.; Maestro, A.; Cermeño, S.; Oliva, J.; Barba, A. Determination of nine fungicides in grape and wine using QuEChERS Extraction and LC/MS/MS analysis. J. AOAC Int. 2015, 98, 1745–1751. [Google Scholar] [CrossRef]
- Bernardi, G.; Kemmerich, M.; Adaime, M.B.; Prestes, O.D.; Zanella, R. Miniaturized QuEChERS method for determination of 97 pesticide residues in wine by ultra-high performance liquid chromatography coupled with tandem mass spectrometry. Anal. Methods 2020, 12, 2682–2692. [Google Scholar] [CrossRef]
- Kosma, C.I.; Koloka, O.L.; Albanis, T.A.; Konstantinou, I.K. Accurate mass screening of pesticide residues in wine by modified QuEChERS and LC-hybrid LTQ/Orbitrap-MS. Food Chem. 2021, 360, 130008. [Google Scholar] [CrossRef]
- Iijima, S. Helical microtubules of graphitic carbon. Nature 1991, 354, 56–58. [Google Scholar] [CrossRef]
- Petrovic, M.; Farre, M.; de Alda, M.L.; Pérez, S.; Postigo, C.; Köck-Schulmeyer, M.; Radjenovic, J.; Gros, M.; Barceló, D. Recent trends in the liquid chromatography–mass spectrometry analysis of organic contaminants in environmental samples. J. Chromatogr. A 2010, 1217, 4004–4017. [Google Scholar] [CrossRef]
- Ren, J.; Li, L.; Chen, C.; Chen, X.; Cai, Z.; Qiu, L.; Wang, Y.; Zhu, X.; Peng, H. Twisting carbon nanotube fibers for both wire-shaped micro-supercapacitor and micro-battery. Adv. Mater. 2013, 25, 1155–1159. [Google Scholar] [CrossRef]
- Asensio-Ramos, M.; Hernández-Borges, J.; Borges-Miquel, T.; Rodríguez-Delgado, M. Evaluation of multi-walled carbon nanotubes as solid-phase extraction adsorbents of pesticides from agricultural, ornamental and forestal soils. Anal. Chim. Acta 2009, 647, 167–176. [Google Scholar] [CrossRef]
- Valcárcel, M.; Cárdenas, A.S.; Simonet, B.M. Role of carbon nanotubes in analytical science. Anal. Chem. 2007, 79, 4788–4797. [Google Scholar] [CrossRef]
- Morales-Cid, G.; Fekete, A.; Simonet, B.M.; Lehmann, R.; Cárdenas, S.; Zhang, X.; Valcárcel, M.; Schmitt-Kopplin, P. In situ synthesis of magnetic multiwalled carbon nanotube composites for the clean-up of (fluoro)quinolones from human plasma prior to ultrahigh pressure liquid chromatography analysis. Anal. Chem. 2010, 82, 2743–2752. [Google Scholar] [CrossRef]
- Zhao, P.; Wang, L.; Zhou, L.; Zhang, F.; Kang, S.; Pan, C. Multi-walled carbon nanotubes as alternative reversed-dispersive solid phase extraction materials in pesticide multi-residue analysis with QuEChERS method. J. Chromatogr. A 2012, 1225, 17–25. [Google Scholar] [CrossRef]
- Zhao, P.; Wang, L.; Luo, J.; Li, J.; Pan, C. Determination of pesticide residues in complex matrices using multi-walled carbon nanotubes as reversed-dispersive solid-phase extraction sorbent. J. Sep. Sci. 2011, 35, 153–158. [Google Scholar] [CrossRef]
- Zhao, P.; Wang, L.; Jiang, Y.; Zhang, F.; Pan, C. Dispersive cleanup of acetonitrile extracts of tea samples by mixed multiwalled carbon nanotubes, primary secondary amine, and graphitized carbon black sorbents. J. Agric. Food Chem. 2012, 60, 4026–4033. [Google Scholar] [CrossRef]
- Meng, Z.; Li, Q.; Cong, J.; Huang, Y.; Wang, D.; Pan, C.; Fan, S.; Zhang, Y. Rapid screening of 350 pesticide residues in vegetable and fruit juices by multi-plug filtration cleanup method combined with gas chromatography-electrostatic field orbitrap high resolution mass spectrometry. Foods 2021, 10, 1651. [Google Scholar] [CrossRef]
- Guan, W.; Li, Z.; Zhang, H.; Hong, H.; Rebeyev, N.; Ye, Y.; Ma, Y. Amine modified graphene as reversed-dispersive solid phase extraction materials combined with liquid chromatography–tandem mass spectrometry for pesticide multi-residue analysis in oil crops. J. Chromatogr. A 2013, 1286, 1–8. [Google Scholar] [CrossRef]
- You, X.; Liang, L.; Liu, F. Dissipation and residues of clethodim and its oxidation metabolites in a rape-field ecosystem using QuEChERS and liquid chromatography/tandem mass spectrometry. Food Chem. 2014, 143, 170–174. [Google Scholar] [CrossRef]
- Zhao, P.; Fan, S.; Yu, C.; Zhang, J.; Pan, C. Multiplug filtration clean-up with multiwalled carbon nanotubes in the analysis of pesticide residues using LC-ESI-MS/MS. J. Sep. Sci. 2013, 36, 3379–3386. [Google Scholar] [CrossRef] [PubMed]
- Zhao, P.; Huang, B.; Li, Y.; Han, Y.; Zou, N.; Gu, K.; Li, X.; Pan, C. Rapid multiplug filtration cleanup with multiple-walled carbon nanotubes and gas chromatography–triple-quadruple mass spectrometry detection for 186 pesticide residues in tomato and tomato products. J. Agric. Food Chem. 2014, 62, 3710–3725. [Google Scholar] [CrossRef] [PubMed]
- Qin, Y.; Zhao, P.; Fan, S.; Han, Y.; Li, Y.; Zou, N.; Song, S.; Zhang, Y.; Li, F.; Li, X.; et al. The comparison of dispersive solid phase extraction and multi-plug filtration cleanup method based on multi-walled carbon nanotubes for pesticides multi-residue analysis by liquid chromatography tandem mass spectrometry. J. Chromatogr. A 2015, 1385, 1–11. [Google Scholar] [CrossRef] [PubMed]
- European Commission. Analytical Quality Control and Method Validation for Pesticide Residues Analysis in Food and Feed. 2019. Available online: https://ec.europa.eu/food/system/files/2020-01/pesticides_mrl_guidelines_wrkdoc_2019-12682.pdf (accessed on 28 September 2021).
- Guidance Document on Pesticide Analytical Methods for Risk Assessment and Post-Approval Control and Monitoring Purposes. 2021. Available online: https://ec.europa.eu/food/system/files/2021-03/pesticides_ppp_app-proc_guide_res_mrl-guidelines-2020-12830.pdf (accessed on 28 September 2021).
- Commission Decision. (EC) No 657/2002 of 12 August 2002 implementing Council Directive 96/23/EC concerning the performance of analytical methods and the interpretation of results. Off. J. Eur. Communities 2002, L221, 8–36. [Google Scholar]
- Commission Decision. European Commission Implementing Regulation (EU) 2018/555 of 9 April 2018 concerning a coordinated multiannual control programme of the Union for 2019, 2020 and 2021 to ensure compliance with maximum residue levels of pesticides and to assess the consumer exposure. Off. J. Eur. Communities 2018, 2016, 48–119. [Google Scholar]

| No. | Pesticide | RT (min) | Quantification Transition a | Confirmation Transition a |
|---|---|---|---|---|
| 1 | dichlorvos | 5.22 | 109→79 (5) | 185→93 (10) |
| 2 | o-phenylphenol | 10.21 | 170→169 (10) | 169→141 (10) |
| 3 | sulfotep-ethyl | 13.31 | 322→146 (25) | 322→65 (40) |
| 4 | phorate | 13.41 | 121→65 (10) | 260→75 (5) |
| 5 | simazine | 14.32 | 201→172 (10) | 186→68 (25) |
| 6 | thiabendazole | 14.33 | 201→130 (25) | 201→174 (15) |
| 7 | carbofuran | 14.51 | 164→149 (10) | 164→131 (20) |
| 8 | indoxacarb | 14.51 | 218→203 (15) | 264→176 (15) |
| 9 | atrazine | 14.52 | 171.9→69 (15) | 172→43 (30) |
| 10 | acephate | 14.52 | 136→94 (10) | 136→42 (10) |
| 11 | clomazone | 14.60 | 124.9→89 (20) | 204→107 (20) |
| 12 | terbufos | 15.01 | 231→129 (25) | 231→175 (10) |
| 13 | pyrimethanil | 15.33 | 198→118 (25) | 198→156 (25) |
| 14 | acetochlor | 17.18 | 223→132 (20) | 146→118 (10) |
| 15 | methyl parathion | 17.23 | 263→109 (15) | 263→79 (30) |
| 16 | dimethoate | 17.36 | 125→79 (5) | 125→93 (10) |
| 17 | tolclofos-methyl | 17.36 | 265→250 (15) | 265→93 (25) |
| 18 | iprovalicarb I | 17.88 | 158→98 (10) | 158→116 (10) |
| 19 | fenitrothion | 18.29 | 277→260 (5) | 277→109 (20) |
| 20 | ethofumesate | 18.44 | 286→207 (5) | 286→179 (15) |
| 21 | carbosulfan | 18.74 | 160→104 (10) | 160→57 (15) |
| 22 | malathion | 18.76 | 173→99 (15) | 173→117 (15) |
| 23 | metolachlor | 18.87 | 162→133 (15) | 162.2→132 (25) |
| 24 | fenthion | 18.99 | 278→109 (10) | 278→125 (15) |
| 25 | diethofencarb | 19.01 | 267→225 (5) | 196→168 (5) |
| 26 | chlorpyrifos | 19.06 | 314→258 (15) | 314→286 (15) |
| 27 | triadimefon | 19.26 | 208→181 (10) | 208→111 (15) |
| 28 | isocarbophos | 19.34 | 136→108 (14) | 230→212 (8) |
| 29 | cyprodinil | 19.977 | 225→224 (10) | 224→208 (20) |
| 30 | metazachlor | 20.18 | 209→132 (20) | 133→117 (25) |
| 31 | pendimethalin | 20.25 | 252→162 (10) | 252→161 (20) |
| 32 | chlorfenvinphos | 20.68 | 267→159 (20) | 267→81 (40) |
| 33 | fipronil | 20.78 | 367→213 (30) | 367→228 (30) |
| 34 | procymidone | 20.90 | 283→96 (10) | 283→255 (10) |
| 35 | vinclozolin | 20.90 | 212→145 (15) | 212→172 (25) |
| 36 | methidathion | 21.18 | 145→85 (5) | 145→58 (15) |
| 37 | butachlor | 21.76 | 237→160 (5) | 188.1→160 (10) |
| 38 | flutriafol | 21.94 | 164→109 (20) | 219→123 (15) |
| 39 | carbaryl | 22.04 | 144→116 (15) | 144→114 (30) |
| 40 | napropamide | 22.04 | 128→72 (10) | 271→128 (5) |
| 41 | hexaconazole | 22.14 | 213.9→172 (20) | 214→159 (20) |
| 42 | profenofos | 22.40 | 208→63 (35) | 208→98 (25) |
| 43 | oxadiazon | 22.72 | 175→112 (15) | 302→175 (13) |
| 44 | iprovalicarb II | 22.73 | 158→98 (10) | 158→116 (10) |
| 45 | carboxin | 22.76 | 235→143 (5) | 144→87 (5) |
| 46 | oxyfluorfen | 22.97 | 252→252 (5) | 252→196 (20) |
| 47 | flusilazole | 23.05 | 233→152 (20) | 233→165 (20) |
| 48 | kresoxim-methyl | 23.13 | 206→116 (5) | 206→131 (10) |
| 49 | metalaxyl | 23.13 | 206→132 (5) | 206→162 (20) |
| 50 | diniconazole | 24.11 | 268→232 (15) | 270→234 (15) |
| 51 | triazophos | 24.72 | 161→134 (5) | 257→162 (5) |
| 52 | propiconazole Ⅰ | 25.27 | 259→173 (15) | 261→175 (15) |
| 53 | propiconazole Ⅱ | 25.46 | 259→69 (12) | 259→191 (5) |
| 54 | propyzamide | 25.47 | 173→145 (20) | 175→147 (20) |
| 55 | diclofop-methyl | 25.96 | 253→162 (15) | 340→253 (15) |
| 56 | epoxiconazole | 26.55 | 192→138 (10) | 192→157 (5) |
| 57 | iprodione | 26.85 | 314→245 (10) | 314→271 (20) |
| 58 | cypermethrin-Ⅰ | 27.33 | 181→152 (30) | 181→127 (35) |
| 59 | bifenthrin | 27.33 | 181→165 (25) | 181→166 (25) |
| 60 | bifenox | 27.77 | 311→279 (10) | 311→216 (20) |
| 61 | pyriproxyfen | 28.61 | 136→78 (25) | - |
| 62 | cypermethrin Ⅱ | 28.91 | 181→152 (30) | 181→127 (35) |
| 63 | beta-cypermethrin | 28.92 | 181→152 (30) | 181→127 (35) |
| 64 | cypermethrin Ⅲ | 29.26 | 181→152 (30) | 181→127 (35) |
| 65 | permethrin Ⅰ | 30.58 | 183→153 (20) | 183→168 (20) |
| 66 | pyridaben | 30.52 | 147→117 (20) | 147→132 (10) |
| 67 | permethrin Ⅱ | 30.37 | 183→115 (25) | 183→77 (30) |
| 68 | cypermethrin Ⅳ | 30.58 | 181→152 (30) | 181→127 (35) |
| 69 | difenoconazole | 33.61 | 323→265 (10) | 265→139 (25) |
| 70 | azoxystrobin | 34.40 | 344→329 (15) | 253→172 (20) |
| 71 | deltamethrin Ⅰ | 33.62 | 181→152 (25) | 253→172 (10) |
| 72 | deltamethrin Ⅱ | 33.92 | 181→152 (25) | 253→172 (10) |
| Pesticide | Linearity Range (mg/kg) | Acetonitrile | Red Wine | White Wine | |||||
|---|---|---|---|---|---|---|---|---|---|
| Slope | R2 | Slope | R2 | Matrix Effect, % | Slope | R2 | Matrix Effect, % | ||
| dichlorvos | 0.002–0.1 | 9.6 × 10⁴ | 0.9924 | 1.1 × 10⁵ | 0.9977 | 9.4 | 9.5 × 10⁴ | 0.9999 | −1.7 |
| o-phenylphenol | 0.002–0.1 | 6.8 × 10⁵ | 0.9989 | 8.5 × 10⁵ | 0.9912 | 19.5 | 7.0 × 10⁵ | 0.9958 | 2.2 |
| sulfotep-ethyl | 0.002–0.1 | 3.3 × 10⁵ | 0.9916 | 3.6 × 10⁵ | 0.9982 | 8.5 | 3.4 × 10⁵ | 0.9920 | 3.6 |
| phorate | 0.002–0.1 | 2.2 × 10⁵ | 0.9897 | 2.3 × 10⁵ | 0.9899 | 6.1 | 2.3 × 10⁵ | 0.9957 | 5.9 |
| simazine | 0.002–0.1 | 3.4 × 10⁴ | 0.9878 | 3.9 × 10⁴ | 0.9985 | 12.5 | 3.1 × 10⁴ | 0.9990 | −7.4 |
| thiabendazole | 0.005–0.1 | 6.8 × 10³ | 0.9855 | 5.9 × 10³ | 0.9959 | −14.9 | 6.6 × 10³ | 0.9956 | −3.8 |
| carbofuran | 0.002–0.1 | 3.1 × 10⁵ | 0.9968 | 3.3 × 10⁵ | 0.9986 | 8.1 | 3.2 × 10⁵ | 0.9921 | 4.5 |
| indoxacarb | 0.005–0.1 | 3.0 × 10³ | 0.9997 | 2.8 × 10³ | 0.9922 | −5.9 | 2.5 × 10³ | 0.9894 | −17.0 |
| atrazine | 0.002–0.1 | 1.7 × 10⁴ | 0.9989 | 2.0 × 10⁴ | 0.9954 | 11.1 | 1.5 × 10⁴ | 0.9853 | −15.3 |
| acephate | 0.005–0.1 | 3.3 × 10³ | 0.9991 | 3.8 × 10³ | 0.9858 | 13.6 | 3.4 × 10³ | 0.9887 | 2.6 |
| clomazone | 0.002–0.1 | 3.1 × 10⁵ | 0.9926 | 3.7 × 10⁵ | 0.9495 | 14.8 | 3.2 × 10⁵ | 0.9885 | 3.2 |
| terbufos | 0.002–0.1 | 2.1 × 10⁴ | 0.9917 | 2.5 × 10⁴ | 0.9916 | 17.4 | 2.5 × 10⁴ | 0.9977 | 17.1 |
| pyrimethanil | 0.002–0.1 | 1.7 × 10⁵ | 0.9957 | 1.5 × 10⁵ | 0.9987 | −10.1 | 1.6 × 10⁵ | 0.9986 | −6.9 |
| acetochlor | 0.002–0.1 | 8.8 × 10⁴ | 0.9935 | 1.2 × 10⁵ | 0.9984 | 24.1 | 9.5 × 10⁴ | 0.9910 | 6.9 |
| methyl parathion | 0.002–0.1 | 3.8 × 10⁵ | 0.9996 | 4.1 × 10⁵ | 0.9941 | 7.2 | 3.7 × 10⁵ | 0.9915 | −2.1 |
| dimethoate | 0.002–0.1 | 1.0 × 10⁶ | 0.9919 | 9.3 × 10⁵ | 0.9896 | −7.2 | 8.9 × 10⁵ | 0.9994 | −12.9 |
| tolclofos-methyl | 0.002–0.1 | 5.0 × 10⁶ | 0.9928 | 6.0 × 10⁶ | 0.9959 | 16.7 | 5.4 × 10⁶ | 0.9995 | 7.4 |
| iprovalicarb I | 0.002–0.1 | 5.5 × 10³ | 0.9937 | 6.8 × 10³ | 0.9866 | 18.7 | 4.9 × 10³ | 0.9956 | −12.8 |
| fenitrothion | 0.002–0.1 | 8.4 × 10⁴ | 0.9930 | 9.5 × 10⁴ | 0.9859 | 12.3 | 8.5 × 10⁴ | 0.9943 | 1.9 |
| ethofumesate | 0.002–0.1 | 2.1 × 10⁵ | 0.9954 | 2.2 × 10⁵ | 0.9973 | 5.8 | 1.9 × 10⁵ | 0.9899 | −11.2 |
| carbosulfan | 0.002–0.1 | 9.2 × 10² | 0.9919 | 1.1 × 10³ | 0.9928 | 15.4 | 1.1 × 10³ | 0.9945 | 15.6 |
| malathion | 0.002–0.1 | 2.8 × 10⁵ | 0.9966 | 3.1 × 10⁵ | 0.9959 | 10.4 | 2.5 × 10⁵ | 0.9948 | −11.9 |
| metolachlor | 0.002–0.1 | 4.5 × 10⁵ | 0.9987 | 5.5 × 10⁵ | 0.9866 | 18.2 | 4.5 × 10⁵ | 0.9942 | −0.4 |
| fenthion | 0.002–0.1 | 1.4 × 10⁵ | 0.9934 | 1.6 × 10⁵ | 0.9967 | 7.5 | 1.4 × 10⁵ | 0.9984 | −3.5 |
| diethofencarb | 0.002–0.1 | 3.7 × 10⁵ | 0.9997 | 4.0 × 10⁵ | 0.9819 | 6.5 | 3.9 × 10⁵ | 0.9894 | 5.6 |
| chlorpyrifos | 0.002–0.1 | 1.9 × 10⁵ | 0.9942 | 2.2 × 10⁵ | 0.9925 | 15.7 | 1.9 × 10⁵ | 0.9948 | 1.3 |
| triadimefon | 0.002–0.1 | 1.2 × 10⁵ | 0.9998 | 9.7 × 10⁴ | 0.9937 | −24.1 | 1.1 × 10⁵ | 0.9951 | −9.3 |
| isocarbophos | 0.002–0.1 | 3.3 × 10⁵ | 0.9929 | 3.5 × 10⁵ | 0.9958 | 5.8 | 3.4 × 10⁵ | 0.9935 | 4.2 |
| cyprodinil | 0.002–0.1 | 9.5 × 10⁵ | 0.9999 | 8.6 × 10⁵ | 0.9863 | −10.4 | 7.7 × 10⁵ | 0.9864 | −23.1 |
| metazachlor | 0.002–0.1 | 1.5 × 10⁵ | 0.9991 | 1.4 × 10⁵ | 0.9988 | −9.2 | 1.8 × 10⁵ | 0.9987 | 14.0 |
| pendimethalin | 0.002–0.1 | 1.0 × 10⁵ | 0.9894 | 1.0 × 10⁵ | 0.9979 | 2.2 | 1.2 × 10⁵ | 0.9839 | 15.1 |
| chlorfenvinphos | 0.002–0.1 | 1.0 × 10⁵ | 0.9931 | 1.2 × 10⁵ | 0.9890 | 12.6 | 8.9 × 10⁴ | 0.9847 | −14.9 |
| fipronil | 0.002–0.1 | 5.2 × 10⁴ | 0.9968 | 6.5 × 10⁴ | 0.9881 | 19.0 | 4.9 × 10⁴ | 0.9850 | −6.6 |
| procymidone | 0.002–0.1 | 2.2 × 10⁵ | 0.9914 | 2.1 × 10⁵ | 0.9959 | −3.2 | 1.8 × 10⁵ | 0.9854 | −23.2 |
| vinclozolin | 0.002–0.1 | 6.6 × 10³ | 0.9934 | 6.0 × 10³ | 0.9948 | −10.5 | 5.9 × 10³ | 0.9994 | −13.2 |
| methidathion | 0.002–0.1 | 4.3 × 10⁵ | 0.9895 | 4.7 × 10⁵ | 0.9939 | 9.2 | 3.8 × 10⁵ | 0.9885 | −11.3 |
| butachlor | 0.002–0.1 | 7.5 × 10⁴ | 0.9916 | 9.1 × 10⁴ | 0.9957 | 18.0 | 7.3 × 10⁴ | 0.9887 | −1.7 |
| flutriafol | 0.002–0.1 | 1.3 × 10⁵ | 0.9967 | 1.4 × 10⁵ | 0.9955 | 10.7 | 1.2 × 10⁵ | 0.9916 | −8.6 |
| carbaryl | 0.005–0.1 | 2.7 × 10⁴ | 0.9958 | 2.4 × 10⁴ | 0.9889 | −13.9 | 2.6 × 10⁴ | 0.9943 | −6.9 |
| napropamide | 0.002–0.1 | 1.7 × 10⁵ | 0.9938 | 1.7 × 10⁵ | 0.9998 | 1.5 | 1.6 × 10⁵ | 0.9979 | −6.3 |
| hexaconazole | 0.002–0.1 | 5.1 × 10⁴ | 0.9996 | 4.6 × 10⁴ | 0.9964 | −12.0 | 4.8 × 10⁴ | 0.9948 | −6.7 |
| profenofos | 0.002–0.1 | 1.6 × 10⁴ | 0.9949 | 2.1 × 10⁴ | 0.9962 | 25.3 | 1.8 × 10⁴ | 0.9999 | 12.3 |
| oxadiazon | 0.002–0.1 | 3.0 × 10⁵ | 0.9925 | 3.0 × 10⁵ | 0.9969 | −0.8 | 2.5 × 10⁵ | 0.9948 | −18.9 |
| iprovalicarb II | 0.005–0.1 | 1.1 × 10³ | 0.9939 | 9.9 × 10² | 0.9928 | −5.7 | 9.3 × 10² | 0.9972 | −12.7 |
| carboxin | 0.002–0.1 | 2.5 × 10⁵ | 0.9916 | 3.4 × 10⁵ | 0.9896 | 28.6 | 2.4 × 10⁵ | 1.0000 | −4.2 |
| oxyfluorfen | 0.002–0.1 | 2.3 × 10⁵ | 0.9984 | 2.6 × 10⁵ | 0.9927 | 11.5 | 2.0 × 10⁵ | 0.9942 | −17.5 |
| flusilazole | 0.002–0.1 | 1.1 × 10⁵ | 0.9956 | 8.8 × 10⁴ | 0.9990 | −24.3 | 9.5 × 10⁴ | 0.9940 | −15.0 |
| kresoxim-methyl | 0.002–0.1 | 1.9 × 10⁵ | 0.9942 | 1.6 × 10⁵ | 0.9792 | −19.6 | 1.8 × 10⁵ | 0.9998 | −10.1 |
| metalaxyl | 0.002–0.1 | 1.2 × 10⁵ | 0.9967 | 9.7 × 10⁴ | 0.9963 | −20.1 | 9.3 × 10⁴ | 0.9965 | −25.2 |
| diniconazole | 0.002–0.1 | 1.5 × 10⁵ | 0.9924 | 1.3 × 10⁵ | 0.9928 | −21.4 | 1.4 × 10⁵ | 0.9971 | −14.1 |
| triazophos | 0.002–0.1 | 9.2 × 10⁴ | 0.9913 | 9.2 × 10⁴ | 0.9969 | −0.8 | 9.1 × 10⁴ | 0.9857 | −2.0 |
| Propiconazole I | 0.002–0.1 | 9.4 × 10⁴ | 0.9957 | 9.4 × 10⁴ | 0.9942 | −0.8 | 9.1 × 10⁴ | 0.9920 | −3.7 |
| propiconazole II | 0.002–0.1 | 2.1 × 10⁵ | 0.9962 | 2.2 × 10⁵ | 0.9967 | 2.5 | 1.9 × 10⁵ | 0.9854 | −10.3 |
| propyzamide | 0.002–0.1 | 5.5 × 10⁵ | 0.9938 | 4.0 × 10⁵ | 0.9966 | −37.3 | 4.9 × 10⁵ | 0.9801 | −13.0 |
| diclofop-methyl | 0.002–0.1 | 1.1 × 10⁵ | 0.9989 | 1.3 × 10⁵ | 0.9894 | 18.3 | 1.0 × 10⁵ | 0.9900 | −3.9 |
| epoxiconazole | 0.01–0.1 | 6.0 × 10⁴ | 0.9937 | 6.4 × 10⁴ | 0.9964 | 5.5 | 5.1 × 10⁴ | 0.9977 | −17.2 |
| iprodione | 0.002–0.1 | 5.5 × 10⁴ | 0.9988 | 7.3 × 10⁴ | 0.9922 | 24.3 | 5.6 × 10⁴ | 0.9884 | 1.9 |
| cypermethrin-I | 0.002–0.1 | 2.2 × 10⁴ | 0.9936 | 2.4 × 10⁴ | 0.9960 | 8.4 | 2.1 × 10⁴ | 0.9978 | −4.3 |
| bifenthrin | 0.002–0.1 | 8.8 × 10⁵ | 0.9942 | 1.0 × 10⁶ | 0.9920 | 12.3 | 8.8 × 10⁵ | 0.9920 | 0.4 |
| bifenox | 0.002–0.1 | 4.1 × 10⁴ | 0.9969 | 4.9 × 10⁴ | 0.9935 | 16.2 | 5.6 × 10⁴ | 0.9918 | 26.8 |
| pyriproxyfen | 0.002–0.1 | 2.0 × 10⁵ | 0.9960 | 2.6 × 10⁵ | 0.9919 | 24.4 | 2.0 × 10⁵ | 0.9912 | 3.3 |
| cypermethrin II | 0.005–0.1 | 5.3 × 10⁴ | 0.9938 | 4.7 × 10⁴ | 0.9933 | −11.8 | 4.2 × 10⁴ | 0.9924 | −25.4 |
| beta-cypermethrin | 0.005–0.1 | 3.4 × 10⁴ | 0.9962 | 3.7 × 10⁴ | 0.9957 | 9.9 | 3.2 × 10⁴ | 0.9909 | −4.4 |
| cypermethrin III | 0.005–0.1 | 2.8 × 10⁴ | 0.9973 | 2.8 × 10⁴ | 0.9872 | −1.7 | 2.5 × 10⁴ | 0.9955 | −11.7 |
| permethrin I | 0.005–0.1 | 3.9 × 10⁴ | 0.9959 | 4.7 × 10⁴ | 0.9868 | 16.0 | 5.0 × 10⁴ | 0.9947 | 21.6 |
| pyridaben | 0.002–0.1 | 8.0 × 10⁵ | 0.9929 | 1.0 × 10⁶ | 0.9910 | 20.0 | 8.3 × 10⁵ | 0.9948 | 4.0 |
| Permethrin II | 0.005–0.1 | 2.5 × 10⁴ | 0.9954 | 2.3 × 10⁴ | 0.9925 | −8.1 | 2.8 × 10⁴ | 0.9944 | 10.5 |
| cypermethrin IV | 0.005–0.1 | 7.7 × 10³ | 0.9966 | 9.2 × 10³ | 0.9890 | 16.2 | 9.3 × 10³ | 0.9978 | 17.0 |
| difenoconazole | 0.002–0.1 | 5.9 × 10⁵ | 0.9919 | 6.2 × 10⁵ | 0.9887 | 3.9 | 4.6 × 10⁵ | 0.9991 | −28.4 |
| azoxystrobin | 0.005–0.1 | 2.0 × 10⁴ | 0.9961 | 2.4 × 10⁴ | 0.9921 | 16.2 | 1.6 × 10⁴ | 0.9958 | −26.8 |
| deltamethrin I | 0.002–0.1 | 3.8 × 10³ | 0.9958 | 3.4 × 10³ | 0.9858 | −13.1 | 3.6 × 10³ | 0.9957 | −6.8 |
| deltamethrin II | 0.002–0.1 | 5.0 × 10³ | 0.9952 | 4.30 × 10³ | 0.9853 | −16.1 | 4.20 × 10³ | 0.9875 | −18.9 |
| Pesticide | Red Wine | White Wine | ||||||||
|---|---|---|---|---|---|---|---|---|---|---|
| Recovery (RSD), % | LOD | LOQ | Recovery (RSD), % | LOD | LOQ | |||||
| 0.01 mg/kg | 0.05 mg/kg | 0.1 mg/kg | (mg/kg) | (mg/kg) | 0.01 mg/kg | 0.05 mg/kg | 0.1 mg/kg | (mg/kg) | (mg/kg) | |
| dichlorvos | 102.2 (6.2) | 99.8 (3.2) | 98.4 (8.1) | 0.002 | 0.01 | 88.8 (2.1) | 100.4 (8.0) | 103.2 (2.5) | 0.002 | 0.01 |
| o-phenylphenol | 100.5 (5.0) | 88.4 (1.0) | 83.4 (3.2) | 0.002 | 0.01 | 81.8 (4.7) | 97.1 (4.0) | 86.9 (3.4) | 0.002 | 0.01 |
| sulfotep-ethyl | 93.1 (1.4) | 87.1 (3.1) | 84.2 (2.7) | 0.002 | 0.01 | 103.8 (4.8) | 91.1 (1.1) | 91.3 (3.1) | 0.002 | 0.01 |
| phorate | 95.0 (4.9) | 86.0 (2.1) | 84.0 (2.5) | 0.002 | 0.01 | 102.9 (4.1) | 97.0 (1.2) | 93.0 (0.5) | 0.002 | 0.01 |
| simazine | 82.2 (4.4) | 86.5 (1.8) | 82.8 (1.3) | 0.002 | 0.01 | 100.7 (2.6) | 90.6 (4.4) | 83.5 (2.7) | 0.002 | 0.01 |
| thiabendazole | 84.7 (0.9) | 99.3 (2.2) | 88.1 (2.0) | 0.002 | 0.01 | - | 91.3 (1.9) | 86.9 (2.7) | 0.01 | 0.05 |
| carbofuran | 97.3 (2.9) | 89.1 (0.7) | 92.5 (4.6) | 0.002 | 0.01 | 108.4 (1.8) | 100.7 (4.1) | 100.2 (0.9) | 0.002 | 0.01 |
| indoxacarb | - | 100.5 (2.3) | 100.8 (5.9) | 0.01 | 0.05 | - | 108.3 (0.8) | 82.7 (2.1) | 0.01 | 0.05 |
| atrazine | 94.9 (2.5) | 86.8 (2.9) | 84.8 (3.0) | 0.002 | 0.01 | 96.0 (2.7) | 95.9 (3.2) | 91.3 (1.4) | 0.002 | 0.01 |
| acephate | - | 87.6.0 (8.3) | 94.5 (4.0) | 0.01 | 0.05 | - | 90.0 (2.6) | 95.3 (1.1) | 0.01 | 0.05 |
| clomazone | 84.5 (5.6) | 94.8 (2.5) | 97.9 (5.8) | 0.002 | 0.01 | 96.2 (4.0) | 97.2 (3.4) | 84.2 (1.1) | 0.002 | 0.01 |
| terbufos | 73.7 (0.7) | 83.6 (3.8) | 79.4 (2.4) | 0.002 | 0.01 | 92.4 (4.9) | 98.9 (3.4) | 89.4 (0.6) | 0.002 | 0.01 |
| pyrimethanil | 99.7 (2.4) | 92.7 (2.0) | 96.1 (2.4) | 0.002 | 0.01 | 94.8 (1.4) | 90.2 (2.2) | 85.1 (0.4) | 0.002 | 0.01 |
| acetochlor | 87.1 (9.2) | 92.7 (3.2) | 84.1 (4.4) | 0.002 | 0.01 | 105.3 (3.3) | 101.6 (3.4) | 90.8 (1.3) | 0.002 | 0.01 |
| methyl parathion | 72.3 (2.8) | 81.5 (2.6) | 87.7 (6.8) | 0.002 | 0.01 | 106.1 (3.0) | 89.7 (4.4) | 97.0 (1.7) | 0.002 | 0.01 |
| dimethoate | 85.1 (3.0) | 87.4 (2.9) | 82.2 (2.1) | 0.002 | 0.01 | 89.4 (2.3) | 85.6 (2.0) | 91.3 (5.9) | 0.002 | 0.01 |
| tolclofos-methyl | 84.6 (3.4) | 85.3 (2.4) | 82.2 (2.4) | 0.002 | 0.01 | 93.9 (3.8) | 81.2 (3.5) | 81.7 (2.0) | 0.002 | 0.01 |
| iprovalicarb I | - | 94.2 (6.2) | 104.3 (2.4) | 0.02 | 0.05 | 99.3 (4.1) | 96.3 (5.4) | 84.2 (1.5) | 0.002 | 0.01 |
| fenitrothion | 80.1 (3.2) | 78.4 (3.3) | 90.0 (4.4) | 0.002 | 0.01 | 90.7 (3.7) | 90.6 (5.7) | 95.7 (1.7) | 0.02 | 0.05 |
| ethofumesate | 94.7 (2.4) | 89.4 (4.7) | 90.7 (4.7) | 0.002 | 0.01 | 96.1 (3.1) | 100.2 (2.7) | 93.4 (2.1) | 0.003 | 0.01 |
| carbosulfan | 92.8 (2.7) | 96.8 (3.2) | 92.3 (3.0) | 0.002 | 0.01 | - | 95.9 (4.8) | 73.1 (5.5) | 0.002 | 0.05 |
| malathion | 81.3 (3.9) | 86.0 (4.0) | 89.0 (6.7) | 0.002 | 0.01 | 95.2 (4.3) | 102.6 (0.3) | 100.6 (2.4) | 0.002 | 0.01 |
| metolachlor | 81.9 (5.0) | 94.1 (3.1) | 82.4 (5.2) | 0.002 | 0.01 | 102.0 (1.6) | 103.1 (3.8) | 94.3 (1.4) | 0.002 | 0.01 |
| fenthion | 88.8 (6.5) | 92.2 (4.0) | 84.6 (4.7) | 0.002 | 0.01 | 87.5 (0.6) | 91.0 (2.8) | 84.8 (1.4) | 0.002 | 0.01 |
| diethofencarb | 72.3 (2.1) | 90.1 (3.5) | 80.2 (6.2) | 0.002 | 0.01 | 87.9 (3.3) | 81.0 (2.3) | 77.9 (0.7) | 0.002 | 0.01 |
| chlorpyrifos | 82.9 (5.7) | 99.8 (5.3) | 85.5 (2.3) | 0.002 | 0.01 | 78.8 (3.6) | 77.9 (3.8) | 73.0 (0.3) | 0.002 | 0.01 |
| triadimefon | 99.4 (0.9) | 90.5 (3.5) | 94.9 (4.2) | 0.002 | 0.01 | 85.0 (2.4) | 109.1 (1.0) | 93.4 (1.9) | 0.002 | 0.01 |
| isocarbophos | 73.7 (4.6) | 77.5 (4.1) | 89.2 (3.2) | 0.002 | 0.01 | 89.8 (5.5) | 98.5 (1.3) | 98.6 (0.9) | 0.004 | 0.01 |
| cyprodinil | 104.0 (2.0) | 86.9 (3.3) | 97.7 (1.5) | 0.002 | 0.01 | 72.0 (1.5) | 73.3 (4.4) | 83.2 (1.8) | 0.002 | 0.01 |
| metazachlor | 93.9 (5.2) | 91.9 (4.4) | 82.2 (6.7) | 0.002 | 0.01 | 106.0 (2.2) | 105.1 (4.5) | 87.5 (0.9) | 0.002 | 0.01 |
| pendimethalin | 84.1 (1.9) | 80.8 (4.6) | 72.8 (3.9) | 0.002 | 0.01 | 86.8 (8.3) | 78.6 (3.6) | 74.7 (1.1) | 0.002 | 0.01 |
| chlorfenvinphos | 103.1 (2.0) | 81.8 (1.2) | 100.0 (2.6) | 0.002 | 0.01 | 104.2 (3.5) | 100.0 (6.5) | 108.8 (1.4) | 0.002 | 0.01 |
| fipronil | 95.6 (5.2) | 94.6 (7.3) | 87.1 (5.2) | 0.002 | 0.01 | 98.7 (8.2) | 87.3 (4.4) | 97.4 (0.1) | 0.002 | 0.01 |
| procymidone | 105.1 (2.1) | 98.7 (2.3) | 86.8 (3.2) | 0.002 | 0.01 | 92.2 (2.0) | 94.1 (4.2) | 85.1 (2.1) | 0.002 | 0.01 |
| vinclozolin | 96.2 (1.4) | 79.5 (3.7) | 82.7 (3.4) | 0.002 | 0.01 | 85.0 (2.8) | 99.9 (3.5) | 90.3 (1.2) | 0.002 | 0.01 |
| methidathion | 76.7 (1.6) | 108.4 (2.9) | 92.8 (4.1) | 0.002 | 0.01 | 102.5 (5.6) | 98.2 (4.9) | 104.8 (1.5) | 0.002 | 0.01 |
| butachlor | 89.3 (6.7) | 90.8 (1.9) | 84.2 (4.7) | 0.002 | 0.01 | 101.2 (2.4) | 99.0 (3.7) | 92.7 (0.7) | 0.002 | 0.01 |
| flutriafol | 93.8 (0.9) | 85.2 (0.5) | 84.2 (2.3) | 0.002 | 0.01 | 94.0 (2.3) | 92.4 (2.1) | 94.5 (2.5) | 0.002 | 0.01 |
| carbaryl | - | 80.7 (4.0) | 97.4 (4.0) | 0.03 | 0.05 | 86.6 (2.4) | 85.9 (3.9) | 70.2 (1.3) | 0.005 | 0.01 |
| napropamide | 92.5 (2.0) | 89.9 (1.9) | 96.0 (0.9) | 0.002 | 0.01 | 84.3 (2.1) | 98.0 (0.8) | 93.6 (0.6) | 0.002 | 0.01 |
| hexaconazole | 95.4 (0.6) | 96.0 (2.8) | 97.3 (1.7) | 0.002 | 0.01 | 90.1 (0.9) | 90.2 (1.4) | 82.7 (1.0) | 0.002 | 0.01 |
| profenofos | 94.1 (2.5) | 83.9 (3.0) | 100.7 (5.6) | 0.002 | 0.01 | 100.8 (3.9) | 91.7 (1.8) | 100.8 (2.5) | 0.002 | 0.01 |
| oxadiazon | 97.2 (3.5) | 92.6 (1.8) | 84.1 (5.3) | 0.002 | 0.01 | 96.3 (1.6) | 97.3 (3.6) | 87.4 (1.0) | 0.002 | 0.01 |
| iprovalicarb II | - | 96.2 (4.3) | 98.0 (4.1) | 0.01 | 0.05 | - | 96.4 (1.9) | 91.0 (2.5) | 0.02 | 0.05 |
| carboxin | 106.1 (2.7) | 90.6 (4.9) | 89.5 (1.2) | 0.002 | 0.01 | 85.8 (3.5) | 89.7 (3.8) | 93.7 (0.9) | 0.002 | 0.01 |
| oxyfluorfen | 87.0 (0.8) | 101.8 (4.8) | 84.7 (2.5) | 0.002 | 0.01 | 83.5 (3.0) | 88.4 (7.7) | 84.9 (1.4) | 0.002 | 0.01 |
| flusilazole | - | 92.4 (5.3) | 90.9 (4.2) | 0.01 | 0.05 | 86.8 (1.6) | 85.1 (1.0) | 85.3 (3.1) | 0.002 | 0.01 |
| kresoxim-methyl | 83.6 (2.9) | 84.9 (0.8) | 81.4 (4.2) | 0.002 | 0.01 | 101.0 (1.4) | 95.5 (2.3) | 88.4 (1.7) | 0.002 | 0.01 |
| metalaxyl | 79.8 (2.3) | 78.0 (2.2) | 84.8 (4.3) | 0.002 | 0.01 | 92.0 (6.3) | 90.5 (3.4) | 88.8 (0.8) | 0.002 | 0.01 |
| diniconazole | 105.4 (2.4) | 106.0 (0.8) | 99.0 (5.5) | 0.002 | 0.01 | 96.4 (1.8) | 94.7 (2.8) | 92.7 (1.7) | 0.002 | 0.01 |
| triazophos | - | 86.0 (1.8) | 95.5 (3.2) | 0.01 | 0.05 | 100.8 (5.6) | 93.8 (2.4) | 94.5 (2.4) | 0.002 | 0.01 |
| propiconazole Ⅰ | 95.0 (5.1) | 89.8 (0.5) | 99.4 (4.5) | 0.002 | 0.01 | 97.0 (2.1) | 90.0 (1.1) | 94.2 (2.7) | 0.002 | 0.01 |
| propiconazole Ⅱ | 96.5 (2.5) | 92.1 (1.3) | 97.1 (0.2) | 0.002 | 0.01 | 91.7 (4.0) | 89.6 (2.1) | 94.9 (3.0) | 0.002 | 0.01 |
| propyzamide | 92.8 (3.4) | 85.6 (2.3) | 101.9 (2.6) | 0.002 | 0.01 | 98.3 (2.1) | 91.3 (2.2) | 94.2 (2.9) | 0.002 | 0.01 |
| diclofop-methyl | 99.2 (2.3) | 89.6 (3.1) | 96.1 (4.5) | 0.002 | 0.01 | 93.3 (4.6) | 92.6 (5.3) | 81.2 (1.3) | 0.002 | 0.01 |
| epoxiconazole | - | 72.4 (3.7) | 76.9 (2.8) | 0.02 | 0.05 | - | 75.7 (6.0) | 77.1 (0.4) | 0.02 | 0.05 |
| iprodione | 83.4 (4.2) | 93.8 (2.1) | 103.8 (7.5) | 0.002 | 0.01 | 104.1 (1.9) | 77.8 (3.5) | 79.9 (2.2) | 0.002 | 0.01 |
| cypermethrin-Ⅰ | 87.1 (0.8) | 89.6 (2.3) | 78.6 (4.0) | 0.002 | 0.01 | 94.7 (5.0) | 102.5 (3.4) | 93.3 (0.8) | 0.002 | 0.01 |
| bifenthrin | 85.0 (3.1) | 89.9 (4.5) | 85.7 (1.6) | 0.002 | 0.01 | 98.9 (3.4) | 85.6 (2.3) | 84.9 (1.0) | 0.002 | 0.01 |
| bifenox | 102.6 (2.3) | 90.7 (6.8) | 87.9 (4.5) | 0.002 | 0.01 | 97.7 (1.6) | 104.3 (1.2) | 103.4 (3.8) | 0.002 | 0.01 |
| pyriproxyfen | 83.5 (0.7) | 85.1 (4.2) | 83.0 (3.0) | 0.002 | 0.01 | 86.3 (0.6) | 79.0 (2.2) | 73.9 (0.4) | 0.002 | 0.01 |
| cypermethrin Ⅱ | - | 91.7 (2.9) | 93.4 (1.6) | 0.01 | 0.05 | 91.0 (2.8) | 100.6 (2.0) | 83.7 (0.8) | 0.002 | 0.01 |
| beta-cypermethrin | - | 91.7 (2.9) | 93.4 (1.6) | 0.01 | 0.05 | 91.0 (2.8) | 100.6 (2.0) | 83.7 (0.8) | 0.002 | 0.01 |
| cypermethrin Ⅲ | - | 103.6 (4.5) | 94.2 (3.9) | 0.01 | 0.05 | 98.5 (5.5) | 105.8 (2.5) | 105.4 (1.9) | 0.002 | 0.01 |
| permethrin Ⅰ | - | 94.7 (2.3) | 97.2 (3.2) | 0.01 | 0.05 | - | 104.2 (0.8) | 104.9 (2.5) | 0.02 | 0.05 |
| pyridaben | 98.4 (5.5) | 97.9 (2.2) | 96.5 (4.9) | 0.002 | 0.01 | 103.4 (2.9) | 83.3 (1.3) | 97.2 (0.8) | 0.002 | 0.01 |
| permethrin Ⅱ | 83.7 (1.7) | 83.9 (2.1) | 98.1 (4.6) | 0.003 | 0.01 | 95.7 (2.0) | 93.2 (1.5) | 96.0 (2.7) | 0.002 | 0.01 |
| cypermethrin Ⅳ | - | 94.7 (3.0) | 95.7 (2.3) | 0.01 | 0.05 | - | 101.7 (1.1) | 92.9 (1.9) | 0.01 | 0.05 |
| difenoconazole | 94.2 (4.3) | 93.7 (2.6) | 95.1 (3.5) | 0.002 | 0.01 | 94.6 (2.8) | 89.9 (1.0) | 93.1 (2.2) | 0.002 | 0.01 |
| azoxystrobin | - | 98.2 (6.1) | 95.2 (1.7) | 0.01 | 0.05 | - | 91.2.0 (4.1) | 103.6 (1.3) | 0.01 | 0.05 |
| deltamethrin Ⅰ | - | 95.8 (3.3) | 91.6 (4.6) | 0.01 | 0.05 | 96.4 (3.2) | 101.3 (0.7) | 98.8 (1.8) | 0.002 | 0.01 |
| deltamethrin Ⅱ | - | 96.1 (2.7) | 95.2 (3.5) | 0.01 | 0.05 | 98.3 (1.1) | 97.9 (3.6) | 84.8 (2.1) | 0.002 | 0.01 |
| Method | Detecting Instrument | Recoveries (%) | RSD (%) | LOQ (µg/kg) | Number of Pesticides | Cleanup Time Cost per Sample (Min) |
|---|---|---|---|---|---|---|
| m-PFC Method | GC-MS/MS | 70.2–108.8 | ≤9.2 | 10–50 | 72 | ≤2 |
| Payá et al. [45] | GC-MS/MS, LC-MS/MS | 60–127 | 1.2–16.7 | 10 | 42 | ≥10 |
| Romero-González et al. [46] | UHPLC-MS/MS | 70–120 | ≤24 | 10 | 90 | ≥10 |
| Martínez et al. [47] | LC/MS/MS | 73–87 | 2-16 | 10 | 9 | ≥10 |
| Santana-Mayor et al. [17] | UHPLC-(Q-ToF)-MS/MS or GC-QqQ-MS/MS | 75–100 | 5–20 | 2.6–21.39 | 173 | ≥10 |
| Bernardi et al. [48] | UHPLC-(HR)MS/MS | 70–120 | ≤20 | 10 | 90 | ≥10 |
| Kosma et al. [49] | UHPLC-Orbitrap-MS | 71.2–125 | ≤11 | 2.5–73 | ≥10 | |
| Schusterova et al. [7] | UHPLC-(HR)MS/MS | 70–120 | 1–20 | 1 | 367 | ≥10 |
| Pesticide | X ± SD a,n | ||||||
|---|---|---|---|---|---|---|---|
| Red Wine-03 | Red Wine-04 | Red Wine-15 | Red Wine-22 | Red Wine-27 | Red Wine-46 | White Wine-03 | |
| difenoconazole | ND | 0.010 ± 0.001 | ND | ND | 0.016 ± 0.003 | ND | ND |
| pyridaben | ND | ND | 0.012 ± 0.003 | 0.019 ± 0.004 | ND | 0.012 ± 0.003 | ND |
| carbosulfan | ND | ND | ND | ND | ND | 0.026 ± 0.005 | 0.054 ± 0.011 |
| pyrimethanil | ND | ND | 0.031 ± 0.006 | ND | ND | ND | ND |
| propyzamide | ND | ND | 0.035 ± 0.007 | ND | ND | ND | ND |
| simazine | 0.014 ± 0.003 | 0.013 ± 0.002 | 0.042 ± 0.009 | ND | ND | ND | ND |
| atrazine | 0.015 ± 0.004 | 0.016 ± 0.003 | 0.012 ± 0.002 | ND | ND | ND | ND |
Publisher’s Note: MDPI stays neutral with regard to jurisdictional claims in published maps and institutional affiliations. |
© 2021 by the authors. Licensee MDPI, Basel, Switzerland. This article is an open access article distributed under the terms and conditions of the Creative Commons Attribution (CC BY) license (https://creativecommons.org/licenses/by/4.0/).
Share and Cite
Liu, S.; Bai, A.; Song, L.; Zou, N.; Han, Y.; Zhou, L.; Yu, C.; Li, C.; Pan, C. Utilizing a Rapid Multi-Plug Filtration Cleanup Method for 72 Pesticide Residues in Grape Wines Followed by Detection with Gas Chromatography Tandem Mass Spectrometry. Foods 2021, 10, 2731. https://doi.org/10.3390/foods10112731
Liu S, Bai A, Song L, Zou N, Han Y, Zhou L, Yu C, Li C, Pan C. Utilizing a Rapid Multi-Plug Filtration Cleanup Method for 72 Pesticide Residues in Grape Wines Followed by Detection with Gas Chromatography Tandem Mass Spectrometry. Foods. 2021; 10(11):2731. https://doi.org/10.3390/foods10112731
Chicago/Turabian StyleLiu, Shaowen, Aijuan Bai, Le Song, Nan Zou, Yongtao Han, Li Zhou, Chuanshan Yu, Changjun Li, and Canping Pan. 2021. "Utilizing a Rapid Multi-Plug Filtration Cleanup Method for 72 Pesticide Residues in Grape Wines Followed by Detection with Gas Chromatography Tandem Mass Spectrometry" Foods 10, no. 11: 2731. https://doi.org/10.3390/foods10112731
APA StyleLiu, S., Bai, A., Song, L., Zou, N., Han, Y., Zhou, L., Yu, C., Li, C., & Pan, C. (2021). Utilizing a Rapid Multi-Plug Filtration Cleanup Method for 72 Pesticide Residues in Grape Wines Followed by Detection with Gas Chromatography Tandem Mass Spectrometry. Foods, 10(11), 2731. https://doi.org/10.3390/foods10112731