Abstract
The international journal of neurocomputing (NC) is considered to be one of the most sought out journals in the computer science research fraternity. In this paper, an extensive bibliometric overview of this journal is performed. The bibliometric data is extracted from the Web of Science (WoS) repository. The main objective of this study is to reveal internal structures and hidden inferences, such as highly productive and influential authors, most contributing countries, top institutions, collaborating authors, and so on. The CiteSpace and VOS viewer is used to visualize the graphical mapping of the bibliometric data. Further, the document co-citations network, cluster detection and references with strong citation burst is analyzed to reveal the intellectual base of NC publications.
1. Introduction
Bibliometrics (also referred as Scientometrics) as a research area has received tremendous attention from the scientific fraternity in recent times [1]. Bibliometrics is identified as an efficient technique to build a general outline of a certain scientific research field. There has been a rapid development in the field of bibliometrics in recent times attributing to social developments significantly gaining from the advancement of the internet and computers [2]. Scientometrics therefore gives an aerial view of scientific activity. It basically is a part of library and information science, but it has been judiciously used in numerous other research areas like management [3,4], energy & fuels [5,6], psychology [7,8], Dielectric and bioimpedance research [9], Selfish memes [10], and so on. Bibliometric study is not only celebrated in the field of computer science but is also finding increasing attention in domains such as decision support systems [11,12], bioinformatics [13,14], heuristics [15], big data [16,17,18], and software engineering [19]. Moreover, there has been a quality scientometric research work contribution in last few years, such as Fuzzy decision making [20], fuzzy theory research in China [21], Real-time operating systems [22], Linguistic decision making studies [23], Ordered weighted averaging operators [24], and Atanassov intuitionistic fuzzy sets [25].
Apart from subject specific bibliometric study, there are several journal specific studies, such as Knowledge Based Systems (KBS) [26], International Journal of Intelligent Systems (IJIS) [27], IEEE Transactions on Fuzzy Systems (TFS) [28], European Journal of Operations Research (EJOR) [29], Computers & Industrial Engineering [30], Information Sciences (INS) 1968–2016 [31,32], Medicine [33], Applied Soft Computing [34], and others [35,36,37,38].
Neurocomputing (NC) is one of the most pioneering journals in the field of neurocomputing. Throughout the years it has maintained a high reputation and is widely read by the computer science research fraternity. NC publishes various document types, such as articles, theoretical contributions, literature reviews, conference and workshop meeting reports, short communications, and so on. All these document types cover a wide area of computer science discipline including signal processing, speech processing, image processing, computer vision, control, robotics, optimization, scheduling, resource allocation, and financial forecasting. NC not only covers the theoretical aspects but also focuses on the practical contributions, such as simulation software environments, emulation hardware architectures, models of concurrent computation, neurocomputers, and neurochips (digital, analog, optical, and biodevices) [39]. The popularity of NC journal can be observed from the impact factor this journal has acquired in such short span of time. Impact factor (IF) is the measure of the frequency with which an article of the journal is cited in year. It is a journal metric used for analyzing the rank of a journal. According to the latest Journal Citation Reports of the Web of Science, which is owned by Clarivate Analytics, NC journal has an impact factor of 3.317.
The major contribution of this paper are as follows:
- This paper reports a detailed study of the generic bibliometric impression of the journal of NC publications by examining the most prominent articles, institutions, authors, author collaborations, institute collaborations, country collaborations, etc.
- The purpose of this study is to provide an intrinsic structure of NC publications and the targeted research areas where the contributions are made.
- A detailed study of the NC publication base is also performed to understand the knowledge base of NC publications.
- The top cited articles in this journal are listed to give highlights of the NC publications.
- The data of all the documents considered for this study have been retrieved from the Web of Science (WoS) database which comprises of several document types, such as articles, proceeding papers, letters, editorials, and reviews.
- Statistical techniques and analysis determines the nature of the NC citations and their structure.
The paper is organized as follows: Section 2 explains the data collection methodology, performance indicators, and the visualization tools used in this paper. In Section 3, we have covered the publications and citation structure, most productive and influential authors, top ranked countries in NC, and the best institutions contribution in NC. The visualization of the publication structure of the various entities (authors, countries, institutions, etc.) is shown with the help of the Citespace. Then we have explained the bibliometric landscape and included the document co-citation analysis in Section 4 and Section 5, simultaneously. Finally, a conclusion is drawn in Section 6 followed by the references used in this paper.
2. Methodology and Performance Indicators
The repository of Web of Science (WoS) is utilized for this study, which is a scientific citation indexing service maintained by Clarivate Analytics. WoS is the first multidisciplinary bibliographic index of journal publications designed. It is considered a standard data source for bibliometrics. Other databases such as Scopus by Elsevier are also used by bibliometricians. The first volume of NC came in the year 1989, however, the data for this study has been extracted from WoS where NC’s publications are from the year 1992. Therefore the data span of this study is from 1992 to 2018. The data was collected in December 2017. A total of 10,838 publications were retrieved for the above said period. The query used in the search engine of WoS was “SO = Neurocomputing”. Each record of the data retrieved from WoS comprises a number of fields such as author, author affiliation, title, abstract, citations record, and so on.
This study uses a range of scientometric indicators combined with statistical analysis and visualizations tools. Associations between several entitles/variables (author, organization, or country) have been explored, which are defined as follows:
- (i)
- Co-citation analysis: This is another way to analyze the citation structure and provides a glimpse of the relationships between papers, and through them other entities, inside a research domain. It basically tells us that if two entities are co-cited, i.e., cited together more frequently then there are closer academic or disciplinary ties between them.
- (ii)
- Bibliographic coupling: This is the opposite of co-citation, it is the number of times two or more entities cite the same entity. Both co-citation and bibliographic coupling indicate disciplinary links. The number of co-authored documents identifies collaborative or co-authorship links between two entities, directly linking authors, institutions, or countries. (By entity we mean either an author, an organization, or a country.)
- (iii)
- Document co-citation analysis (DCA): This explores the citation base of publications giving an insight into the inspiration corpus.
Performance Indicators and Visual Tools: Now, we explain the various scientometric indicators used for the analysis.
- (i)
- Total Papers (TP)—the total number of papers from a particular source,
- (ii)
- Total Citations (TC)—the total number of citations generated by a particular publication within the database of WoS.
- (iii)
- Citations per Paper (CPP)—TP divided by TC,
- (iv)
- Hirsch index or h-index—This is equal to the number of papers (N) of an entity that has more than N citations each [40].
Further, two of the widely used graphical mapping software’s are used, namely, VOSviewer and CiteSpace
- (i)
- VOSviewer is a tool for generation and visualization of bibliographic networks. It has been used here for depicting bibliographic coupling and co-authorship between different entities VOSviewer can be used to construct networks of scientific publications, scientific journals, researchers, research organizations, countries, keywords, or terms. Items in VOSviewer are visualized in terms of nodes and edges connecting theses nodes. Items in these networks can be connected by co-authorship, co-occurrence, citation, bibliographic coupling, or co-citation links. Examples are bibliographic coupling links between publications, co-authorship links between researchers, and co-occurrence links between terms. Vosviewer version 1.6.5 has been used for this study.
- (ii)
- CiteSpace [41] has also been used here for visualization and analysis document co-citation of NC publications. It is an open source Java application used for visualizing trends from metadata of scientific literature. Citespace version 5.0 R4 SE has been used for this study.
3. Citation Structure of NC Publications
In the year 1992, NC published 29 research articles. Since 1998, the number of publications never dropped below 100 and the trends of publications are mostly in the increasing order. The maximum number of 1840 articles were published in the year 2016. The years from 2015–2017 account for approximately 40% of the total NC publications. In the year 2017, there were 1118 publications up to the month of November, when the search query was performed, and this count will certainly increase. For 2018, 143 papers are already included in NC. There is a strong possibility that the journal is expected to follow the current increasing trend over the years to come.
Figure 1 shows the distribution of citations of NC publications over the years (1992–2018), which received a total of 106,536 citations. Interestingly, the year 1992 reflects only 30 citations with a total of 29 publications. The year 1998 accounted for a citation count of 3361 with only 108 publications, making this the year with the maximum citations per year. However, the maximum number of citations were attracted in the year 2015, with a total count of 9108. The TC is not shown for 2018 as counting is yet to start. Moreover, the year 2006, with 335 publications, attracted comparable citations (7617) to that which 2016 publications did. On further analysis, this is found to be because of the article by Huang et al. [31] where extreme machine learning is presented along with its theory and applications.
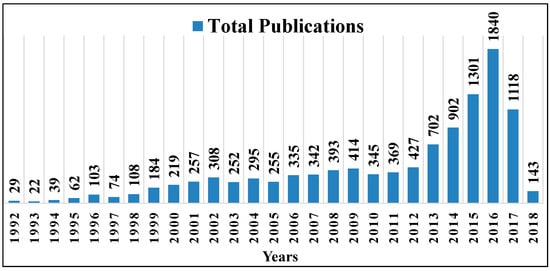
Figure 1.
Neurocomputing (NC) publications/year distribution.
The diversity in the total number of citations with respect to the total number of publications over the years is shown in Figure 2. There has been a gradual increase in the citations over the year. It is at a maximum in 1998 with a value of 31.21 as seven publications have attracted more than 100 citations up to the date that data was collected for this study. It is followed by the publications in the years 2006 and 2003 with CPP of 22.7 and 21.5, respectively. This can also be attributed to the fact that a lot of publications in these years have attracted a good number of citations. However, the citations per year count has degraded in the last few years as shown in Figure 3. This can possibly be because publications in the later years are fairly new and possibly will attract more citations in the times to come.
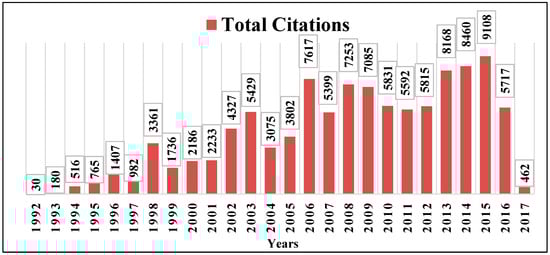
Figure 2.
Citations structure of NC over the years.
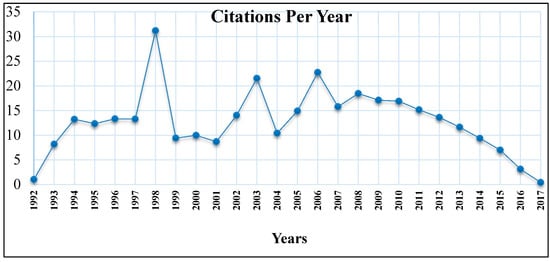
Figure 3.
Citations per year of the NC computing.
Table 1 displays the general citation structure of NC publications from 1992 to 2018. Here, ‘%’ is used to represent the percentage. There are 16 papers which received more than 200 citations, which is 0.14% of the total NC publications. With more than 100 citations, we have 56 publications which account for 0.51% of total publications. There are 2146 papers with no citations at all, which is 19.8% of total publications. Approximately 80% of the publications had at least 1 citation; among them, a major chunk was published in the last five years and thus this number is bound to change as they are fairly young publications. The year 1998 stands at the top position with the CPP. Almost 50% of NC publications have attracted more than five citations which indicates the reach of the journal.

Table 1.
General citation Structure in the Journal: NC (1992–2018).
Neurocomputing journal has been publishing quality and impactful research articles since its induction. Table 2 displays a list of top 40 most cited articles as indexed by WoS. All the papers in this list got more than 100 citations. Huang et al. [42] received the highest citations of 2762 since 2006 for the paper titled “Extreme learning machine: Theory and applications”. It has received citations with increasing speed and has a count of 230.17 citations per year, which is highest in the top 40 list of most cited publications. This research article proposed a novel learning algorithm for single feed forward neural networks where the hidden nodes are randomly chosen and the weights are analytically assigned. The second position is acquired by paper “Time series forecasting using a hybrid ARIMA and neural network model” authored by Zhang [43] where he proposed a hybrid approach containing autoregressive integrated moving average and artificial neural networks for linear and non-linear modelling for forecasting. These two are followed by Suykens et al. [44], Kim [45], and Kohonen [46], for their papers titles as follows: Weighted least squares support vector machines: robustness and sparse approximation; Financial time series forecasting using support vector machines; and The self-organizing map, respectively. The paper by Suykens et al. [44] proposed a method for obtaining robust estimates for regression by applying a weighted version of least squares support vector machine (LS-SVM) along with a sparse approximation procedure for weighted and unweighted LS-SVM. Kim [45] examined the feasibility of support vector machines in financial forecasting. Kohonen [46] gave an overview of the self-organizing map algorithm, namely, a software for visualizing high dimension data.
Table 2.
Top 40 cited publications in NC.
There are six papers which were published before 2000, with the rest of them published after 2000. From the last five years, there are two papers which are in the list of top 40 most cited list. They are “A survey on fall detection: Principles and approaches” and “Weighted extreme learning machine for imbalance learning” from Mubashir et al. [47] and Zong et al. [48], respectively.
Top Authorship, Country, and Institutions
The list of most productive and influential authors is shown in Table 3. The most productive authors are ordered by the maximum number of TP while the most influential authors are accounted by TC. The table also describes authors with total citations, citations per paper and h-index. Cao and Yang both have 74 publications, however, Cao received more citations of 1574 which is higher than Yang’s citation of 510. These two are followed by Wang (TP = 72) and Zhang (TP = 64). Li and Liu published same number of papers with a count of 60.
Table 3.
Most Productive and Influential Authors in NC (1992–2018).
Again, Cao tops the list of most influential authors with TC of 1574. Zhang HG, Liu YR, Wang L and Yuan Y are next in the list with TC of 899, 712, 662, and 615, respectively. The maximum citations per paper (CPP) were attained by Cao (21.27), Liu (16.56), Zhang (14.05), Wang (13.79), and Yuan (11.83).
The h-index is again highest for Cao (23). Zhang (17) and Yuan (15) comes second and third highest in the list. They are followed by Liu YR and Liu Y with same h-index of 14. Figure 4 conveys similar information as in Table 3, for example the circles representing Cao and Zhang are the biggest followed by Wang and Huang. Further, it depicts the author co-citation network and thus describes the disciplinary ties between them.
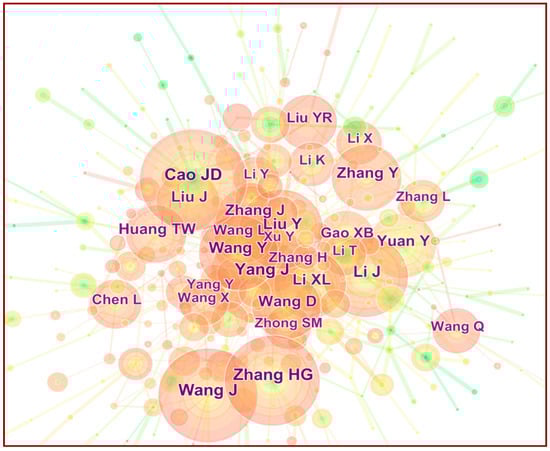
Figure 4.
Author Co-Citation Analysis.
The researchers from various countries are publishing in one of the computer sciences leading journal of neurocomputing. The list of leading 25 countries which are publishing in NC is shown in Table 4. Apart from total papers, the table also mentions other indicators such as: total citations, citations per paper, and h-index. The countries are ordered according to the total number of publications.
Table 4.
Most Productive Countries publishing in NC (1992–2018).
The People’s Republic of China is the most productive country which lies on the first spot with a total publication count of 5179. It is followed by the USA (1498), England (590), Spain (564), and Germany (492). Surprisingly, there is no developing country in the list of top 10 most productive countries. India Ranks 11th in the list, which is a developing nation with 277 publications. The ranking of most influential countries remains the same with respect to the most productive countries for China (TC = 45,688) and the USA (TC = 13,933). Interestingly, then comes Singapore with 8764 citations in only 278 publications. It is then followed by England (6596), Germany (5145), and Spain (4880). The citations per paper shows a different image of the influence of the countries. Singapore tops the list with the highest CPP of 31.53. Then comes Belgium (17.58), Finland (16.34), and The Netherlands (12.7). These three countries were not even in the list of top 10 most productive countries. There is a total of 12 countries whose CPP is more than 10.
With respect to the h-index, China tops the list with a value of 63 followed by USA (46), England (37), Singapore (35), and Spain (31). Then France and Germany share the same h-index value of 30. The dominance of China can also be seen in the Figure 5 which describes the co-citation analysis of countries. The inference from this visualization shows that, almost every time, a paper originating from China is cited along with papers originating from other countries.
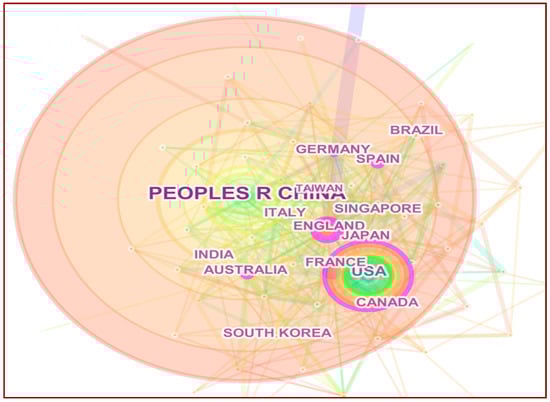
Figure 5.
Countries Co-Citation Analysis.
The institution-wise ordering is displayed in Table 5. This table shows the total publications, total citations, citations per paper and h-index of institutions. Table 5 presents the most productive institutions which have contributed to NC publications. The Chinese Academy of Sciences, China, produced 526 total papers with total citations of 4752. The second spot is taken by Harbin Institute of Technology, also from China, with 219 papers. Southeast University from China takes the third spot with 206 occurrences. The total papers from the institute with total citations and citations per paper (CPP) are also given in the table, along with the h-index of each institution. As can be seen, most of the institutes in the list belong to China. Interestingly, most of the universities in this table are from China.
Table 5.
Most Productive and Influential Institutions in NC (1992–2018).
However in terms of TC, Nanyang technological university, China stands at the top with 6862 citations followed by Chinese Academy of Sciences (4752) and Southeast University (3267). The institutes with the highest average citation per paper (CPP) were Nanyang Technological University, Singapore (46.68), National University of Singapore (27.46), and Southeast University (15.86). There are 11 institutions in this list of top 25 which have a CPP of at least 10.
Two institutes have an h-index of 31, Chinese Academy of Sciences and Southeast University, both are from China. They are followed by the Nanyang Technological University (30), Harbin Institute of Technology, China (23), and Northeastern University, China (23). The dominance of China is also evident here as most of the institutions in Table 5 are from China. However, among the institutions, as shown by the institution co-citation network in Figure 6, the dominance of the Chinese Academy of Sciences can be concluded, which overlaps with almost all the other institutions. This determines that almost every time the publications from Chinese Academy of Sciences are cited along with all other institutions.
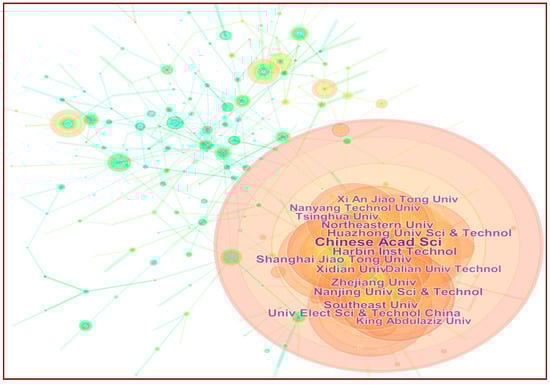
Figure 6.
Institution Co-Citation Analysis.
4. Bibliographic Landscape
This section demonstrates the disciplinary links with the help of bibliographic coupling. The VOSviewer visualization tool is used to show the coupling between the authors, countries and the institutions.
We have first shown the bibliographic coupling between the authors in Figure 7. The authors are connected by the link with different widths. More width shows more intersection or references of these authors, or degree of overlap between the reference lists, and thus more coupling. Moreover, each node representing the authors is also marked with three colors, red, blue and green. Each color consisting of group of countries forms a cluster which represents that these countries in a cluster have cited each other’s paper with more frequency. In the prominent cluster shown in red color, Wang J, Yang J, Yuan Y are the authors whose papers are more cited by the other authors in that cluster. The Other cluster is of a green color with authors such as: Zhang J, Wang D, Zhang HG, Zhang Y, and so on. Hammer B, Chen I, Wang GR, and so on form the third cluster of a blue color. We have mentioned the author’s name, with the last name followed by the initials of the first name as there are many Chinese authors whose names match closely.
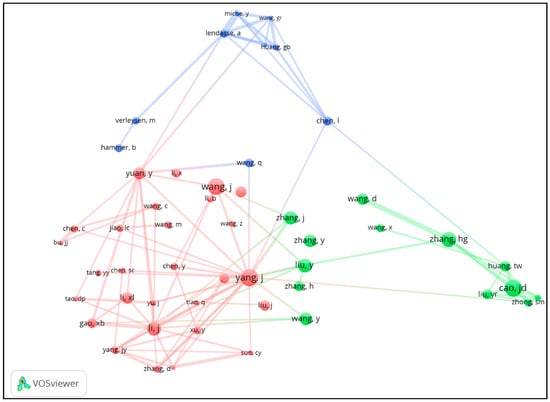
Figure 7.
Bibliographic coupling of the authors in NC.
Figure 8 shows the bibliographic coupling of the top countries/territories publishing in the NC. The countries are denoted by the circular node with different colors. The countries are connected by the link with different widths. More width shows the more intersection or references of these countries, or the degree of overlap between the reference lists, and thus more coupling.
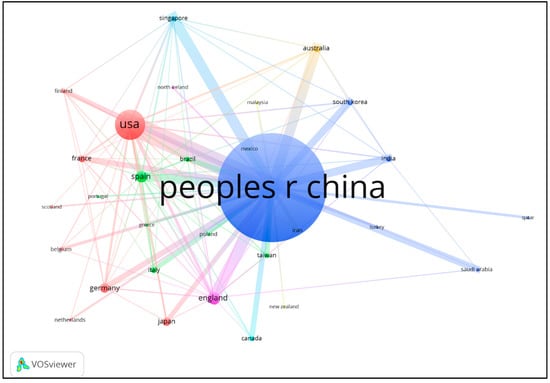
Figure 8.
Bibliographic coupling of the countries publishing in NC.
Two countries are said to be bibliographically coupled if there is intersection between the papers cited by them. Among all the countries, China is shown as the prominent one in Figure 8 which also is the center node of the cluster between the countries such as Singapore, South Korea, India, Turkey, and Saudi Arabia. This suggest that these countries are most likely working on similar research areas and also referencing similar work. Among them, most probably all of other countries in this cluster are citing papers from China. The other visible clusters shown in red color are countries such as the USA, England, Japan, Germany, and France. Spain, Brazil, Italy, Canada, and Taiwan form the third cluster with a green color.
In the last visualization of this section, we have shown the bibliographic coupling among several institutions as shown in Figure 9. The Chinese Academy of sciences is the prominent node (institution) in the red cluster. Other institute in this clusters are Xidian University, National University of Singapore, Peking University, and so on. This strong bibliographic coupling for Chinese Academy of Sciences shows that most of the publications of other institutions in this cluster have cited its paper twice or more. The cluster with the blue color has universities such as South East University, Harbin institute of technology, King Abdulaziz University, and so on. Nanyang technology of university, Northeastern university, University of Granada, and so on form the group of institutes in the third cluster.
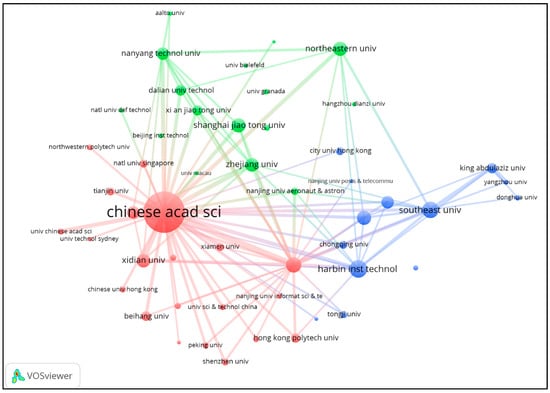
Figure 9.
Bibliographic coupling of the institutions publishing in NC.
5. Document Co-Citation Network
This section uses citescape for visualization of NC publications. Citespace is an open source Java based application software used for visualizing trends from metadata of scientific literature. Furthermore, document co-citation network analysis is studied along with the visualization of different document co-citation clusters and the references with strong citation bursts.
The document co-citation network helps to explore the citation base of NC publications and can be seen in Figure 10. There are nodes and links in the given network. The nodes in Figure 10 represents the cited reference, the highly cited references are labeled with their first author and its year of publication. The size of a node is proportional to its number of citations count.
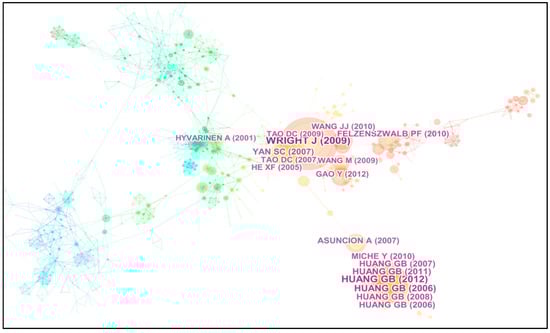
Figure 10.
Document co-citation analysis.
The top 10 most cited references by NC publications from various sources (Journals, conferences, etc.) are tabulated in Table 6. The first is the paper by Huang et al. [49] which proposes a new learning approach called the extreme learning machine (ELM) for regression and multiclass classification. The paper has been cited 1283 times according to WoS. The second paper by Huang et al. [42] discusses the theory and applications of ELM. Third ranked is the paper by Chang et al. [50] which proposes a library for support vector machine (SVM) called LIBSVM. The fourth paper is a survey on ELM by Huang et al. [51]. It is very interesting to note that out of the ten tabulated articles six are by Huang, out of which three are co-authored by Chen.
Table 6.
Top 10 Highly Cited References in NC.
5.1. Cluster Detection and Analysis
The research patterns and emerging trends of NC publications are explored using CiteSpace. Figure 11 displays the document co-citation clusters of NC publications. The title term of each cluster is extracted from the title of the articles cited by NC publications using three methods namely log-likelihood test (LLR), mutual information test (MI), and term-frequency and inverse-document frequency (TF-IDF). For the NC publications there are a total of 187 clusters out of which the top 10 are as in the Table 7 along with the top terms from each of the above-mentioned methods LLI, MI, and TF-IDF. Thereby, if considering LLR labels, then all the members of cluster 0 have spiking neurons as a common research theme and cluster 1 has neural networks in common. This can further be seen graphically in Figure 11 where all the clusters are shown. A total of 91 citing documents form the cluster ID 1 and are labelled neural networks by LLR. It is a fairly young cluster. With a total of 84 citing documents, cluster ID 2 is formed and is labelled Theoretical Results by LLR. Cluster ID 3 is formed of 76 citing documents and is labelled as Face Recognition by LLR. Cluster naming in Figure 11 has been done using LLR, which visualizes these clusters over the document co-citation analysis network.
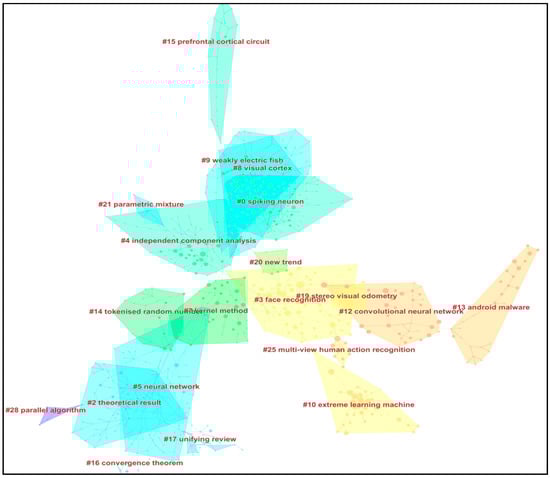
Figure 11.
Document co-citations clusters.
Table 7.
Top 12 clusters in NC publications.
From Figure 11 and Table 7 it is quite evident that the three largest clusters are spiking neurons, neural networks, and face recognition. Neural networks is the oldest cluster and Class is the youngest cluster. The minimum value of silhouettes is 0.889 which shows good clustering. The largest cluster 0 is of size 97 and a silhouette of 0.919 and is labeled spiking neurons by LLR. Figure 12 shows the timeline view of the document co-citations of top 24 largest clusters. All of these clusters are plotted in a horizontal manner. Further, it depicts the sequence of features of every cluster, which includes citation patterns and relationships among the other clusters. The temporal spread of all the cluster can be seen in Figure 12. Spiking neuron was a top research interest from 1992 to 2005 whereas neural networks was from 2002 to 2014. Moreover, a strong connection can be seen between the neural network cluster and convolution neural networks which is also a very obvious relationship. The temporal span of convolutional neural network as shown in Figure 12 is from 2008 and continues until the year 2017.
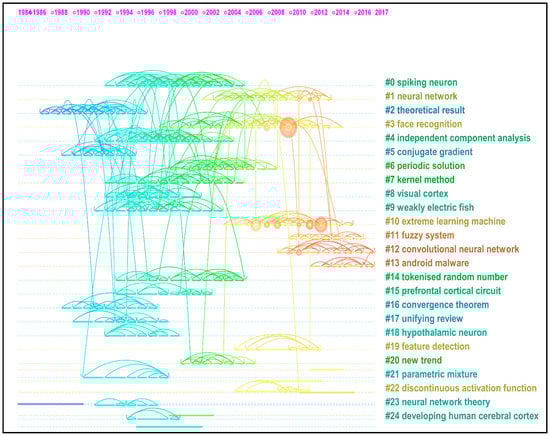
Figure 12.
Timeline view of the document co-citations.
5.2. References with Strong Citation Bursts
Research articles getting a boom of citations in a period of time can give an insight of the emerging developments in the research domain. Citation bursts depict the articles to which the research fraternity pays most attention. The top 30 references with the highest citation bursts are shown in Table 8.
Table 8.
Top 30 References with the Strongest Citation Bursts.
The top rank is taken by hertz [52] with the highest burst strength of 15.3824. The reference is a book titled “Introduction to the theory of neural computation” published in the year 1991. The second article [53] proposed the concept of multilayer feed forward networks as universal approximators. The articles with the longest citation burst is starting in 1996 after two years if its publication in 1994 and ends in the year. The book is titled “Neural Networks: A Comprehensive Foundation” and introduces the concept of neural networks from an engineering perspective.
6. Conclusions
This paper presents an overall insight and the hidden structure of the journal of neurocomputing (NC) through an extensive bibliometric study on the publications and citations history from 1992–2018. Over these years of its publications, NC has emerged as one of the most prominent journals. Table 9 shows the comparison of NC with respect to the several other related journals with respect to the TP, TC, CPP, and IF. The analysis is performed over last 10 years of publications. NC stands at the top in terms of the total number of publications with TP of 7954 and ranks at the 2nd spot in terms of total citations. With respect to the IF, NC (3.317) ranks above the Soft computing (2.472) and Engineering Applications of Artificial Intelligence (2.894).
Table 9.
Comparison of NC with other related Journals.
In this paper, we have explored the publication history using bibliometric methods and techniques. It probed the publication structure and the citation history of the journal. A total of 10,308 papers were analyzed from 1992–2018, which received a total of 106,536 citations (CPP = 10.33). The highest publications came in 2016, while the maximum citations were received in 2015. There are 16 papers which got more than 200 citations and the most cited paper came in 2006, which got 2762 citations to date. The most productive and influential author of NC is Cao. China and USA are the top two nations in publications of NC. Chinese Academy of Sciences, China published the highest number of papers. Interestingly, from the overall compilation of the bibliometric results, it is evident that China has played a prominent role in the publications and citations structure of the NC.
However, one thing to be noted is that there may be certain limitations in the study because of the focus being on the data retrieved from the WoS database. The limitations include the coverage of research publications wherein WoS omits certain research articles, a smaller database of journals which leads to under-reported statistics, and so on. However, the data quality in WoS is tremendous and is thus the most acknowledged source of almost all scientometric studies. Therefore, the major aim of this paper is to reveal the current status of the NC publications by utilizing the results in WoS [54,55].
The other limitation of this study arises from the fact that it is from the metric level, that is, it deals with the number of citations and papers. However, numbers do represent quantity but citations do not represent the quality. Another limitation is that this study creates a profile of the NC journal rather than the area itself, although it can be claimed that NC has been the pioneer in leading the research in this field. Certain limitations arise due to data retrieved from WoS as not all journals are indexed with WoS and thus an array of citations are missed. A comparison with other indexing platforms such as Scopus, Google Scholar can be a good future scope of this study.
In conclusion, the journal of NC has played an important role in shaping academic research since its inception. NC is certainly discovering and developing trends in the domain of soft computing.
Author Contributions
Conceptualization: P.K.M.; Methodology: A.K.S., Data Curation, M.J.; Writing—Original Draft Preparation: M.J.; Writing—Review & Editing: M.J., A.K.S., P.K.M. and A.A.; Supervision: P.K.M. and A.A.
Funding
This research received no external funding.
Acknowledgments
The authors gratefully acknowledge the valuable comments received from the editors and the reviewers, which has helped them in improving the paper significantly.
Conflicts of Interest
The authors declare no conflict of interest.
References
- Garcia-Silvente, Y.A.M. An overview of iris recognition: A bibliometric analysis. Scientometrics 2014, 101, 2003–2033. [Google Scholar]
- Merigó, J.M.; Rocafort, A.; Aznar-Alarcón, J.P. Bibliometric Overview of Business & Economics Research. J. Bus. Econ. Manag. 2016, 17, 397–413. [Google Scholar]
- Du, Y. A Bibliometrics Portrait of Chinese Research through the Lens of China Economic Review. A research proposal. Econ. Manag. Res. Proj. 2012, 1, 79–91. [Google Scholar]
- Hoepner, A.G.F.; Kant, B.; Scholtens, B.; Yu, P.S. Environmental and ecological economics in the 21st century: An age adjusted citation analysis of the influential articles, journals, authors and institutions. Ecol. Econ. 2012, 77, 193–206. [Google Scholar] [CrossRef]
- Kolle, S.R.; Vijayashree, M.S.; Shankarappa, T.H. Highly cited articles in malaria research: A bibliometric analysis. Collect. Build. 2017, 36, 45–57. [Google Scholar] [CrossRef]
- Jiang, H.; Qiang, M.; Lin, P. A topic modeling based bibliometric exploration of hydropower research. Renew. Sustain. Energy Rev. 2016, 57, 226–237. [Google Scholar] [CrossRef]
- Yataganbaba, A.; Kurtbaş, I. A scientific approach with bibliometric analysis related to brick and tile drying: A review. Renew. Sustain. Energy Rev. 2016, 59, 206–224. [Google Scholar] [CrossRef]
- Lee, C.I.S.G.; Felps, W.; Baruch, Y. Toward a taxonomy of career studies through bibliometric visualization. J. Vocat. Behav. 2014, 85, 339–351. [Google Scholar] [CrossRef]
- El Khaled, D.; Novas, N.; Gazquez, J.A.; Manzano-Agugliaro, F. Dielectric and bioimpedance research studies: A Scientometric approach using the scopus database. Publications 2018, 6, 6. [Google Scholar] [CrossRef]
- Aaen-Stockdale, C. Selfish Memes: An Update of Richard Dawkins’ Bibliometric Analysis of Key Papers in Sociobiology. Publications 2017, 5, 12. [Google Scholar] [CrossRef]
- Vanleeuwen, T. Letter to the editor Publication trends in social psychology journals: A long-term bibliometric analysis. Eur. J. Soc. Psychol. 2013, 11, 9–11. [Google Scholar] [CrossRef]
- Arnott, D.; Pervan, G. A critical analysis of decision support systems research. Formul. Res. Methods Inf. Syst. 2015, 20, 127–168. [Google Scholar]
- Arnott, D.; Pervan, G. A Critical Analysis of Decision Support Systems Research Revisited: The Rise of Design Science. In Enacting Research Methods in Information Systems; Palgrave Macmillan: Cham, Switzerland, 2016; Volume 29, pp. 43–103. [Google Scholar]
- Kim, M.C.; Jeong, Y.K.; Song, M. Investigating the integrated landscape of the intellectual topology of bioinformatics. Scientometrics 2014, 101, 309–335. [Google Scholar] [CrossRef]
- Song, M.; Kim, S.; Zhang, G.; Ding, Y.; Chambers, T. Productivity and influence in bioinformatics: A biliographic analysis using PubMed central. J. Am. Soc. Inf. Sci. Technol. 2014, 65, 352–371. [Google Scholar] [CrossRef]
- Loock, M.; Hinnen, G. Heuristics in organizations: A review and a research agenda. J. Bus. Res. 2015, 68, 2027–2036. [Google Scholar] [CrossRef]
- Huang, Y.; Schuehle, J.; Porter, A.L.; Youtie, J. A systematic method to create search strategies for emerging technologies based on the Web of Science: Illustrated for ‘Big Data’. Scientometrics 2015, 105, 2005–2022. [Google Scholar] [CrossRef]
- Prathap, G. Big data and false discovery: Analyses of bibliometric indicators from large data sets. Scientometrics 2014, 98, 1421–1422. [Google Scholar] [CrossRef]
- Garousi, V. A bibliometric analysis of the Turkish software engineering research community. Scientometrics 2015, 105, 23–49. [Google Scholar] [CrossRef]
- Blanco-Mesa, F.; Merigó, J.M.; Gil-Lafuente, A.M. Fuzzy decision making: A bibliometric-based review. J. Intell. Fuzzy Syst. 2017, 32, 2033–2050. [Google Scholar] [CrossRef]
- Yu, D.; Xu, Z.; Wang, W. Bibliometric analysis of fuzzy theory research in China: A 30-year perspective. Knowl.-Based Syst. 2018, 141, 188–199. [Google Scholar] [CrossRef]
- Shukla, A.K.; Sharma, R.; Muhuri, P.K. A Review of the Scopes and Challenges of the Modern Real-Time Operating Systems. Int. J. Embed. Real-Time Commun. Syst. 2018, 9, 66–82. [Google Scholar] [CrossRef]
- Yu, D.; Li, D.F.; Merigó, J.M.; Fang, L. Mapping development of linguistic decision making studies. J. Intell. Fuzzy Syst. 2016, 30, 2727–2736. [Google Scholar] [CrossRef]
- Emrouznejad, M.M.A. Ordered weighted averaging operators 1988–2014: A citation based literature survey. Int. J. Intell. Syst. 2014, 29, 994–1014. [Google Scholar] [CrossRef]
- Yu, D.; Shi, S. Researching the development of Atanassov intuitionistic fuzzy set: Using a citation network analysis. Appl. Soft Comput. 2015, 32, 189–198. [Google Scholar] [CrossRef]
- Cobo, M.J.; Martínez, M.A.; Gutiérrez-Salcedo, M.; Fujita, H.; Herrera-Viedma, E. 25years at Knowledge-Based Systems: A bibliometric analysis. Knowl.-Based Syst. 2015, 80, 3–13. [Google Scholar] [CrossRef]
- Merigó, J.M.; Blanco-Mesa, F.; Gil-Lafuente, A.M.; Yager, R.R. Thirty years of the International Journal of Intelligent Systems: A bibliometric review. Int. J. Intell. Syst. 2017, 32, 526–554. [Google Scholar] [CrossRef]
- Xu, Z.; Yu, D.; Kao, Y.; Lin, C.T. The structure and citation landscape of IEEE Transactions on Fuzzy Systems (1994–2015). IEEE Trans. Fuzzy Syst. 2018, 26, 430–442. [Google Scholar]
- Laengle, S.; Merigó, J.M.; Miranda, J.; Słowiński, R.; Bomze, I.; Borgonovo, E.; Dyson, R.G.; Oliveira, J.F.; Teunter, R. Forty years of the European Journal of Operational Research: A bibliometric overview. Eur. J. Oper. Res. 2017, 262, 803–816. [Google Scholar] [CrossRef]
- Cancino, C.; Merigó, J.M.; Coronado, F.; Dessouky, Y.; Dessouky, M. Forty years of Computers & Industrial Engineering: A bibliometric analysis. Comput. Ind. Eng. 2017, 113, 614–629. [Google Scholar]
- Yu, D.; Xu, Z.; Pedrycz, W.; Wang, W. Information Sciences 1968–2016: A retrospective analysis with text mining and bibliometric. Inf. Sci. 2017, 418–419, 619–634. [Google Scholar] [CrossRef]
- Merigó, J.M.; Pedrycz, W.; Weber, R.; De la Sotta, C. Fifty years of Information Sciences: A bibliometric overview. Inf. Sci. 2018, 432, 245–268. [Google Scholar] [CrossRef]
- Wakeling, S.; Willett, P.; Creaser, C.; Fry, J.; Pinfield, S.; Spezi, V. Transitioning from a Conventional to a ‘Mega’ Journal: A Bibliometric Case Study of the Journal Medicine. Publications 2017, 5, 7. [Google Scholar] [CrossRef]
- Muhuri, P.K.; Shukla, A.K.; Janmaijaya, M.; Basu, A. Applied Soft Computing: A Bibliometric Analysis of the Publications and Citations during (2004–2016). Appl. Soft Comput. 2018, 69, 381–392. [Google Scholar] [CrossRef]
- Amiguet, L.; Gil-Lafuente, A.M.; Kydland, F.E.; Merigó, J.M. One hundred and twenty-five years of the Journal of Political Economy: A bibliometric overview. J. Political Econ. 2017, 125, 6. [Google Scholar]
- Martínez-López, F.J.; Merigó, J.M.; Valenzuela, L.; Nicolás, C. Fifty years of the European Journal of Marketing: A bibliometric analysis. Eur. J. Mark. 2018, 52, 439–468. [Google Scholar] [CrossRef]
- Wang, W.; Laengle, S.; Merigó, J.M.; Yu, D.J.; Herrera-Viedma, E.; Cobo, M.J.; Bouchon-Meunier, B. A bibliometric analysis of the first twenty-five years of the International Journal of Uncertainty, Fuzziness and Knowledge-Based Systems. Int. J. Uncertain. Fuzziness Knowl.-Based Syst. 2018, 26, 169–193. [Google Scholar] [CrossRef]
- Tur-Porcar, A.; Mas-Tur, A.; Merigó, J.M.; Roig-Tierno, N.; Watt, J. A bibliometric history of the Journal of Psychology between 1936 and 2015. J. Psychol. 2018, 152, 199–225. [Google Scholar] [CrossRef] [PubMed]
- Neurocomputing. Available online: https://www.journals.elsevier.com/neurocomputi-ng (accessed on 21 February 2018).
- Hirsch, J.E. An index to quantify an individual’s scientific research output. Proc. Natl. Acad. Sci. USA 2005, 102, 16569–16572. [Google Scholar] [CrossRef] [PubMed]
- Chen, C. CiteSpace II: Detecting and visualizing emerging trends and transient patterns in scientific literature. J. Assoc. Inf. Sci. Technol. 2006, 57, 359–377. [Google Scholar] [CrossRef]
- Huang, G.B.; Zhu, Q.Y.; Siew, C.K. Extreme learning machine: Theory and applications. Neurocomputing 2006, 70, 489–501. [Google Scholar] [CrossRef]
- Zhang, G.P. Time series forecasting using a hybrid ARIMA and neural network model. Neurocomputing 2003, 50, 159–175. [Google Scholar] [CrossRef]
- Suykens, J.A.K.; Brabanter, J.D.; Lukas, L.; Vandewalle, J. Weighted least squares support vector machines: Robustness and sparse approximation. Neurocomputing 2002, 48, 85–105. [Google Scholar] [CrossRef]
- Kim, K. Financial time series forecasting using support vector machines. Neurocomputing 2003, 55, 307–319. [Google Scholar] [CrossRef]
- Kohonen, T. The self-organizing map. Neurocomputing 1998, 21, 1–6. [Google Scholar] [CrossRef]
- Mubashir, M.; Shao, L.; Seed, L. A survey on fall detection: Principles and approaches. Neurocomputing 2013, 100, 144–152. [Google Scholar] [CrossRef]
- Zong, W.; Huang, G.B.; Chen, Y. Weighted extreme learning machine for imbalance learning. Neurocomputing 2013, 101, 229–242. [Google Scholar] [CrossRef]
- Huang, G.B.; Zhou, H.; Ding, X.; Zhang, R. Extreme learning machine for regression and multiclass classification. IEEE Trans. Syst. Man Cybern. Part. B Cybern. 2012, 42, 513–529. [Google Scholar] [CrossRef] [PubMed]
- Chang, C.C.; Lin, C.J. LIBSVM: A library for support vector machines. ACM Trans. Intell. Syst. Technol. 2011, 3, 27. [Google Scholar] [CrossRef]
- Huang, G.B.; Wang, D.H.; Yuan, L. Extreme learning machines: A survey. Int. J. Mach. Learn. Cybern. 2011, 2, 107–122. [Google Scholar] [CrossRef]
- John, H.; Krogh, A.; Palmer, R.G. Introduction to the Theory of Neural Computation; Addison-Wesley: Boston, MA, USA, 1991. [Google Scholar]
- Haykin, S. Neural Networks: A Comprehensive Foundation; Macmillan Publishers: New York, NY, USA, 2004; p. 41. [Google Scholar]
- Fiala, D.; Tutoky, G. Computer Science Papers in Web of Science: A Bibliometric Analysis. Publications 2017, 5, 23. [Google Scholar] [CrossRef]
- Arik, B.T.; Arik, E. “Second Language Writing” Publications in Web of Science: A Bibliometric Analysis. Publications 2017, 5, 4. [Google Scholar] [CrossRef]
© 2018 by the authors. Licensee MDPI, Basel, Switzerland. This article is an open access article distributed under the terms and conditions of the Creative Commons Attribution (CC BY) license (http://creativecommons.org/licenses/by/4.0/).