Article

Exploring the Hjif-Index, an Analogue to the H-Like Index for Journal Impact Factors

by
William Cabos
and
Juan Miguel Campanario
*
Departamento de Física y Matemáticas, Universidad de Alcalá, 28871 Alcalá de Henares, Spain
*
Author to whom correspondence should be addressed.
Publications 2018, 6(2), 14; https://doi.org/10.3390/publications6020014
Submission received: 17 January 2018 / Revised: 16 March 2018 / Accepted: 28 March 2018 / Published: 4 April 2018
(This article belongs to the Special Issue Bibliometrics, Measurements and Research Evaluation)

Abstract

:
We used the Journal Impact Factor (JIF) to develop the hjif-index, calculated in a similar way to h-like indices. To this end, we mapped the JIFs of one JCR group to natural numbers, and evaluated the degree of correspondence between the interval from zero to the highest JIF in the group and a set of natural numbers. Next, we plotted the straight line y = x to obtain the group’s hjif-index as the JIF corresponding to the journal immediately above the straight line. We call the set of journals above the straight line the hjif-core. We calculated hjif-indices corresponding to the 2-year JIF (hjif2-index) and 5-year JIF (hjif5-index) windows for all 176 JCR groups listed in the 2014 Science edition. We also studied derived indicators such as the distribution of journals in JCR groups according to their hjif-indices, the distribution of journals and JIFs in the hjif-core, and other variables and indicators. We found that the hjif2- and hjif5-index behaved in a similar way, and that in general their distribution showed a peak followed by a relatively long tail. The hjif-index can be used as a tool to rank journals in a manner that better reflects the variable number of journals within a given JCR group and in each group’s hjif-core as an alternative to the more arbitrary JCR-based percentile ranking.

1. Introduction and Objectives

We used the Journal Impact Factor (JIF) to develop the hjif-index, calculated in a similar way to h-like indices. In this Introduction we summarize the usual definition and interpretation of the h-index, describe some of the many variants of the h-index, and then focus in the problem of h-like indicators defined with non-natural numbers.
In 2005 Hirsch proposed the h-index [1] for individual researchers. According to the usual definition, a scientist’s h-index is the number of his/her articles (N) that have received at least h citations each. Of all articles published by a given author, N − h indicates those that have received fewer than h citations each [1,2]. This index is often assumed to combine “quantity” (number of publications) and “quality” (citations) factors. Thus, to increase ones h-index, a scientist should produce as many articles as possible, and as many different publications should be cited as many times as possible. This popular index is now used as an indicator by both Scopus and Web of Science.
The scope of this index can easily be expanded and applied to journals, institutions, countries or disciplines [3]. For example, Braun, Glänzel and Schubert developed an h-type index for journals [2] by ranking journals in JCR groups according to the number of citations they received. These authors also published a systematic analysis of Hirsch-type indices for journals [4]. They proposed a theoretical relationship between the h-index, the number of journals (n) and the JIF based in a Paretian model of citation distribution within journals. Their approach fit well with the empirical data obtained for a given year of publication with a 3-year citation window. In addition to this approach, an alternative theoretical model for the h-index (based on the geometric distribution) was recently studied by Bertoli-Barsotti and Lando [5]. In addition, Iglesias and Pecharromán proposed a method to scale the h-index across different fields. Their goal was to avoid misuse of the h-index when comparing different research areas with different publication and citation dynamics [6].
Other authors have suggested several other h-type indices including the g-index [7], H(2)-index [8], success index [9], A- and AR-indices [10] and R-index [11]. Additional studies have proposed new h-type indices or related them to research evaluation methods [12,13,14,15,16].
The notion of the h-index implies the notion of an h-core. For example, the h-core of an individual journal includes all its “h” articles cited h or more times. The rest of the articles form the h-tail [17]. Thus, the h-core comprises the journal’s most cited articles, and takes into account the variable numbers of articles within a given journal. Given the definition of the h-index, inclusion of a new article in the h-core requires this article to increase the impact (received citations) of the set of articles already in the h-core. Items included in the h-core thus become increasingly relevant as the h-index increases.
The real-valued h-index and g-index were introduced by Rousseau, who conceived these real indices as a generalization of the original ones [18]. In accordance with the above definition of the h-index, Mahbuba and Rousseau suggested the use of year-based h-type indicators calculated from sources obtained for each year, with items comprising publications, citations received or citations per publication [19]. The real h-index was defined as the abscissa of the intersection of the y = x lines and the observed interpolation function P(x). This piecewise linear function connects the points [r, P(r)], where r denotes rank (r = 1, 2, …). These authors also suggested the use of the average number of citations. Another variation of the h-index, named the rational h-index, was used by Ruane and Tol to rank economics departments in Ireland [20]. The properties of the real and rational h-index were studied by Guns and Rousseau [21].
One of the most widely used scientometric indicators, the JIF is calculated by Clarivate Analytics for each year (Y) according to the following equation [22]:
J I F ( Y ) = C i t a t i o n s _ i n _ Y _ t o _ d o c u m e n t s _ p u b l i s h e d _ i n _ Y 1 _ a n d _ Y 2 C i t a b l e _ i t e m s _ p u b l i s h e d _ i n _ Y 1 _ a n d _ Y 2
where Y1 and Y2 are the two years before Y. There is a vast body of literature on the JIF (see for example [23,24,25,26,27]). Yang and Zhang proposed a new JIF, calculated with the h-index as one of the variables, as an alternative to the traditional JIF published by ISI–Thomson Reuters [28]. Egghe, Liang and Rousseau studied the theoretical relationship between the JIF and the h-index, and reported that the data confirmed the validity of their model [29].
Boell and Wilson studied cancer-related publications from the Science Citation Index and Social Science Citation Index authored by Australian researchers between 1999 and 2006. They ranked articles in decreasing order of the journals’ JIFs, and then calculated several h-like indicators with this ranked list of publications. Obviously, values for the h-like index were expected to be non-integer numbers [30]. These authors introduced the idea of h-like indices to distinguish between Hirsch-type indices based on citations (natural numbers) and indices based on JIFs (non-integer numbers).
In this article we calculate the hjif-index by determining the correspondence between JIFs (non-integer numbers) and natural numbers. We then explore the main characteristics of the hjif-index, and construct derived indicators to study academic journals.
In this article we explore a new approach to the problem of ranking journals with an h-like index within JCR groups. In particular, our aims are:
(a)
To calculate a hjif-index defined in a manner similar to the h-index. This indicator was obtained for each JCR group with two versions of the JIF: the usual one calculated with a 2-year window (JIF2), and a newer one calculated with a five-year window (JIF5).
(b)
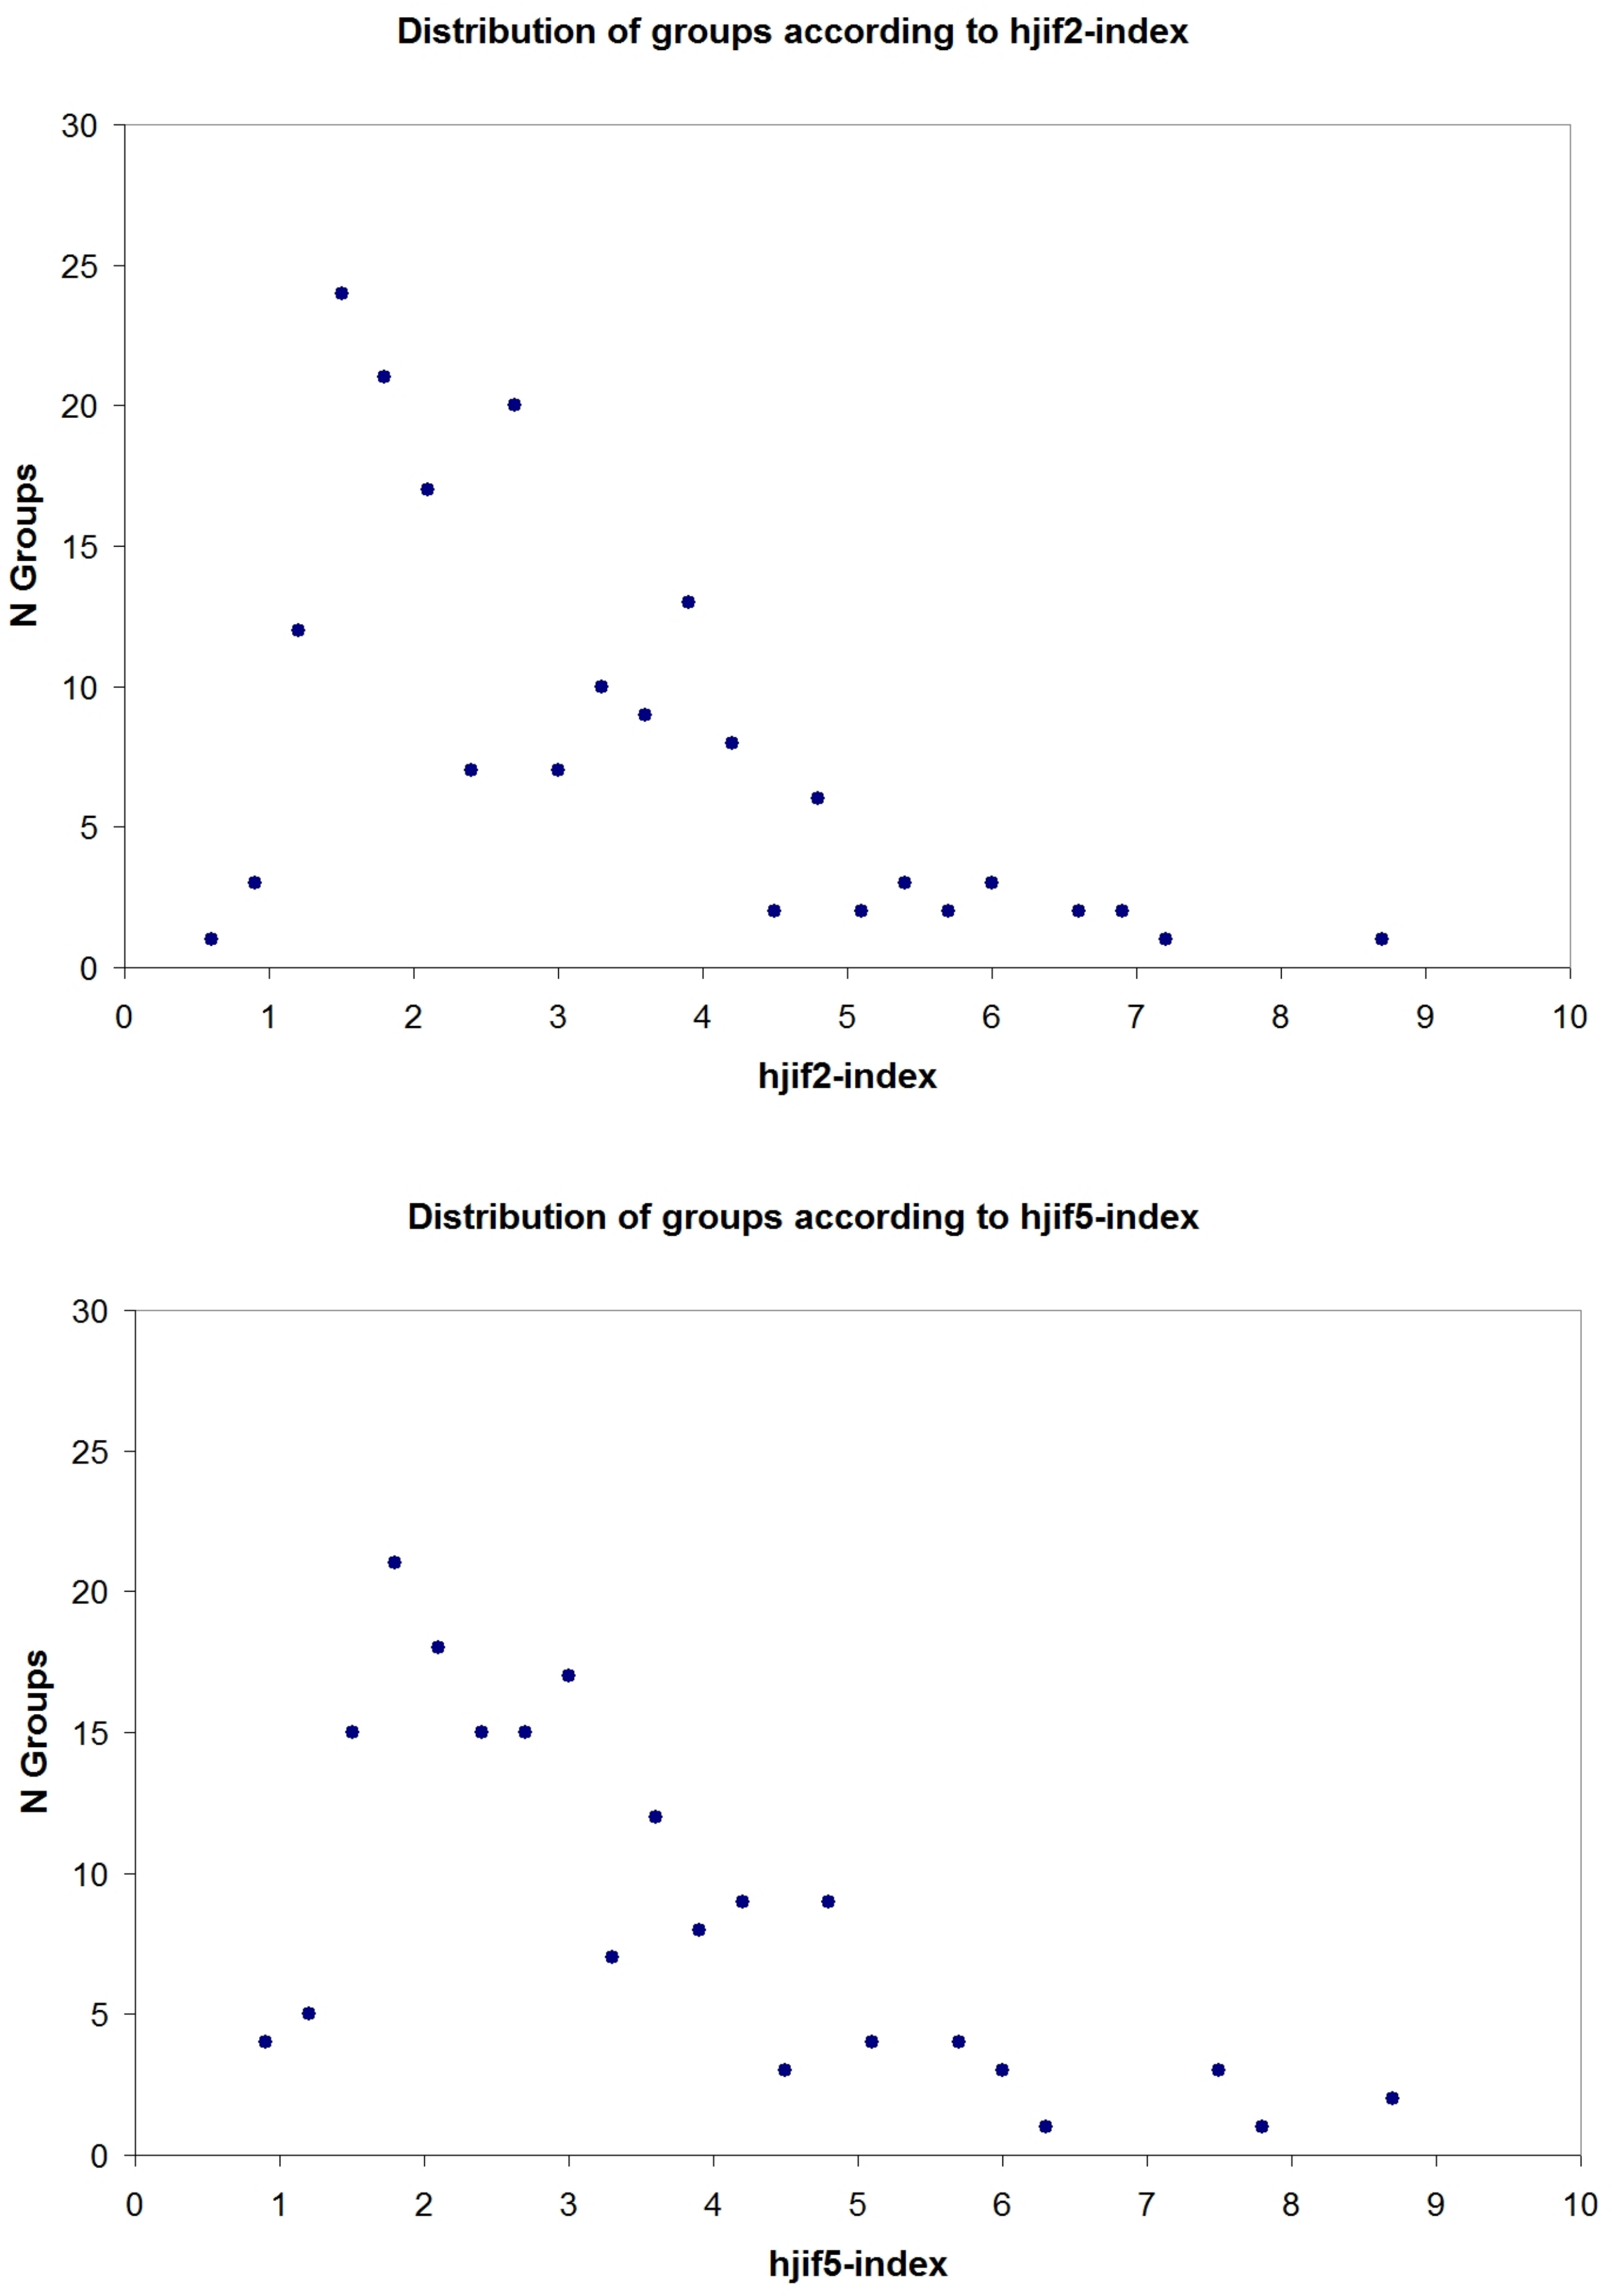
To explore the distribution of JCR groups according to the two hjif-indices calculated here.
(c)
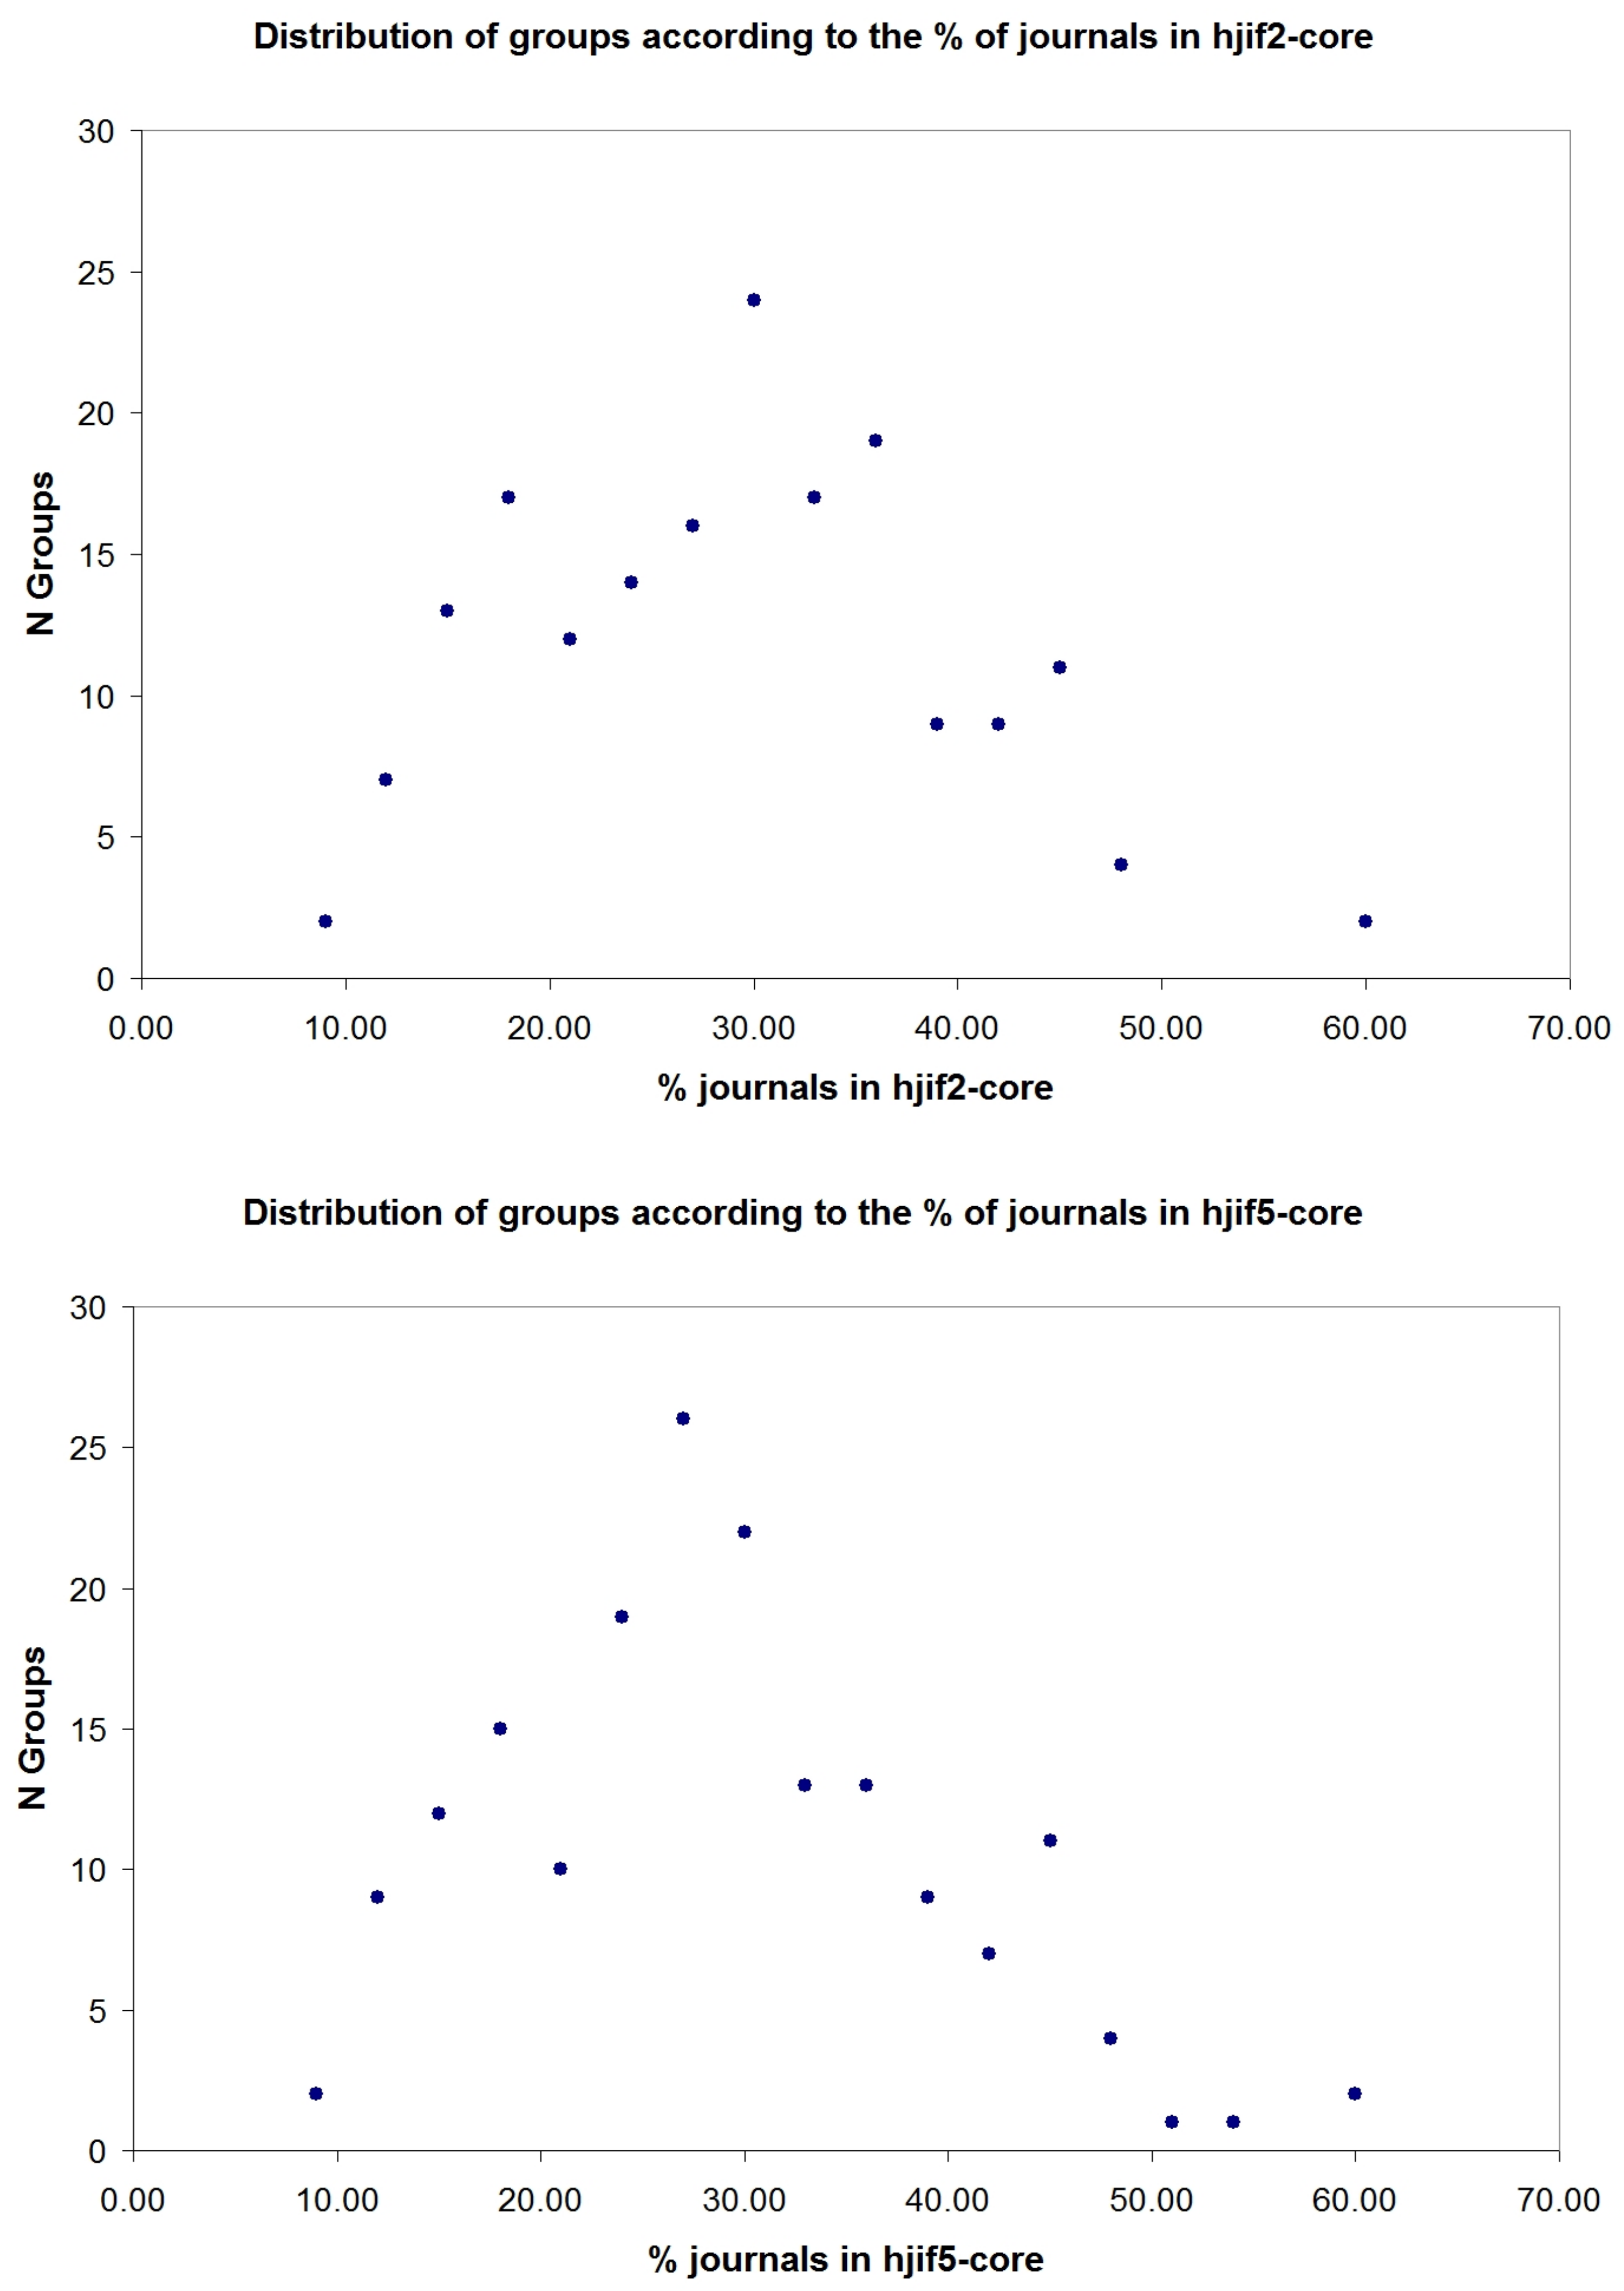
To explore the distribution of JCR groups according to the percentage of journals included in the hjif-core (see below).
(d)
To compare the behavior of the hjif-indices based on the JIF2 and the JIF5.

2. Method

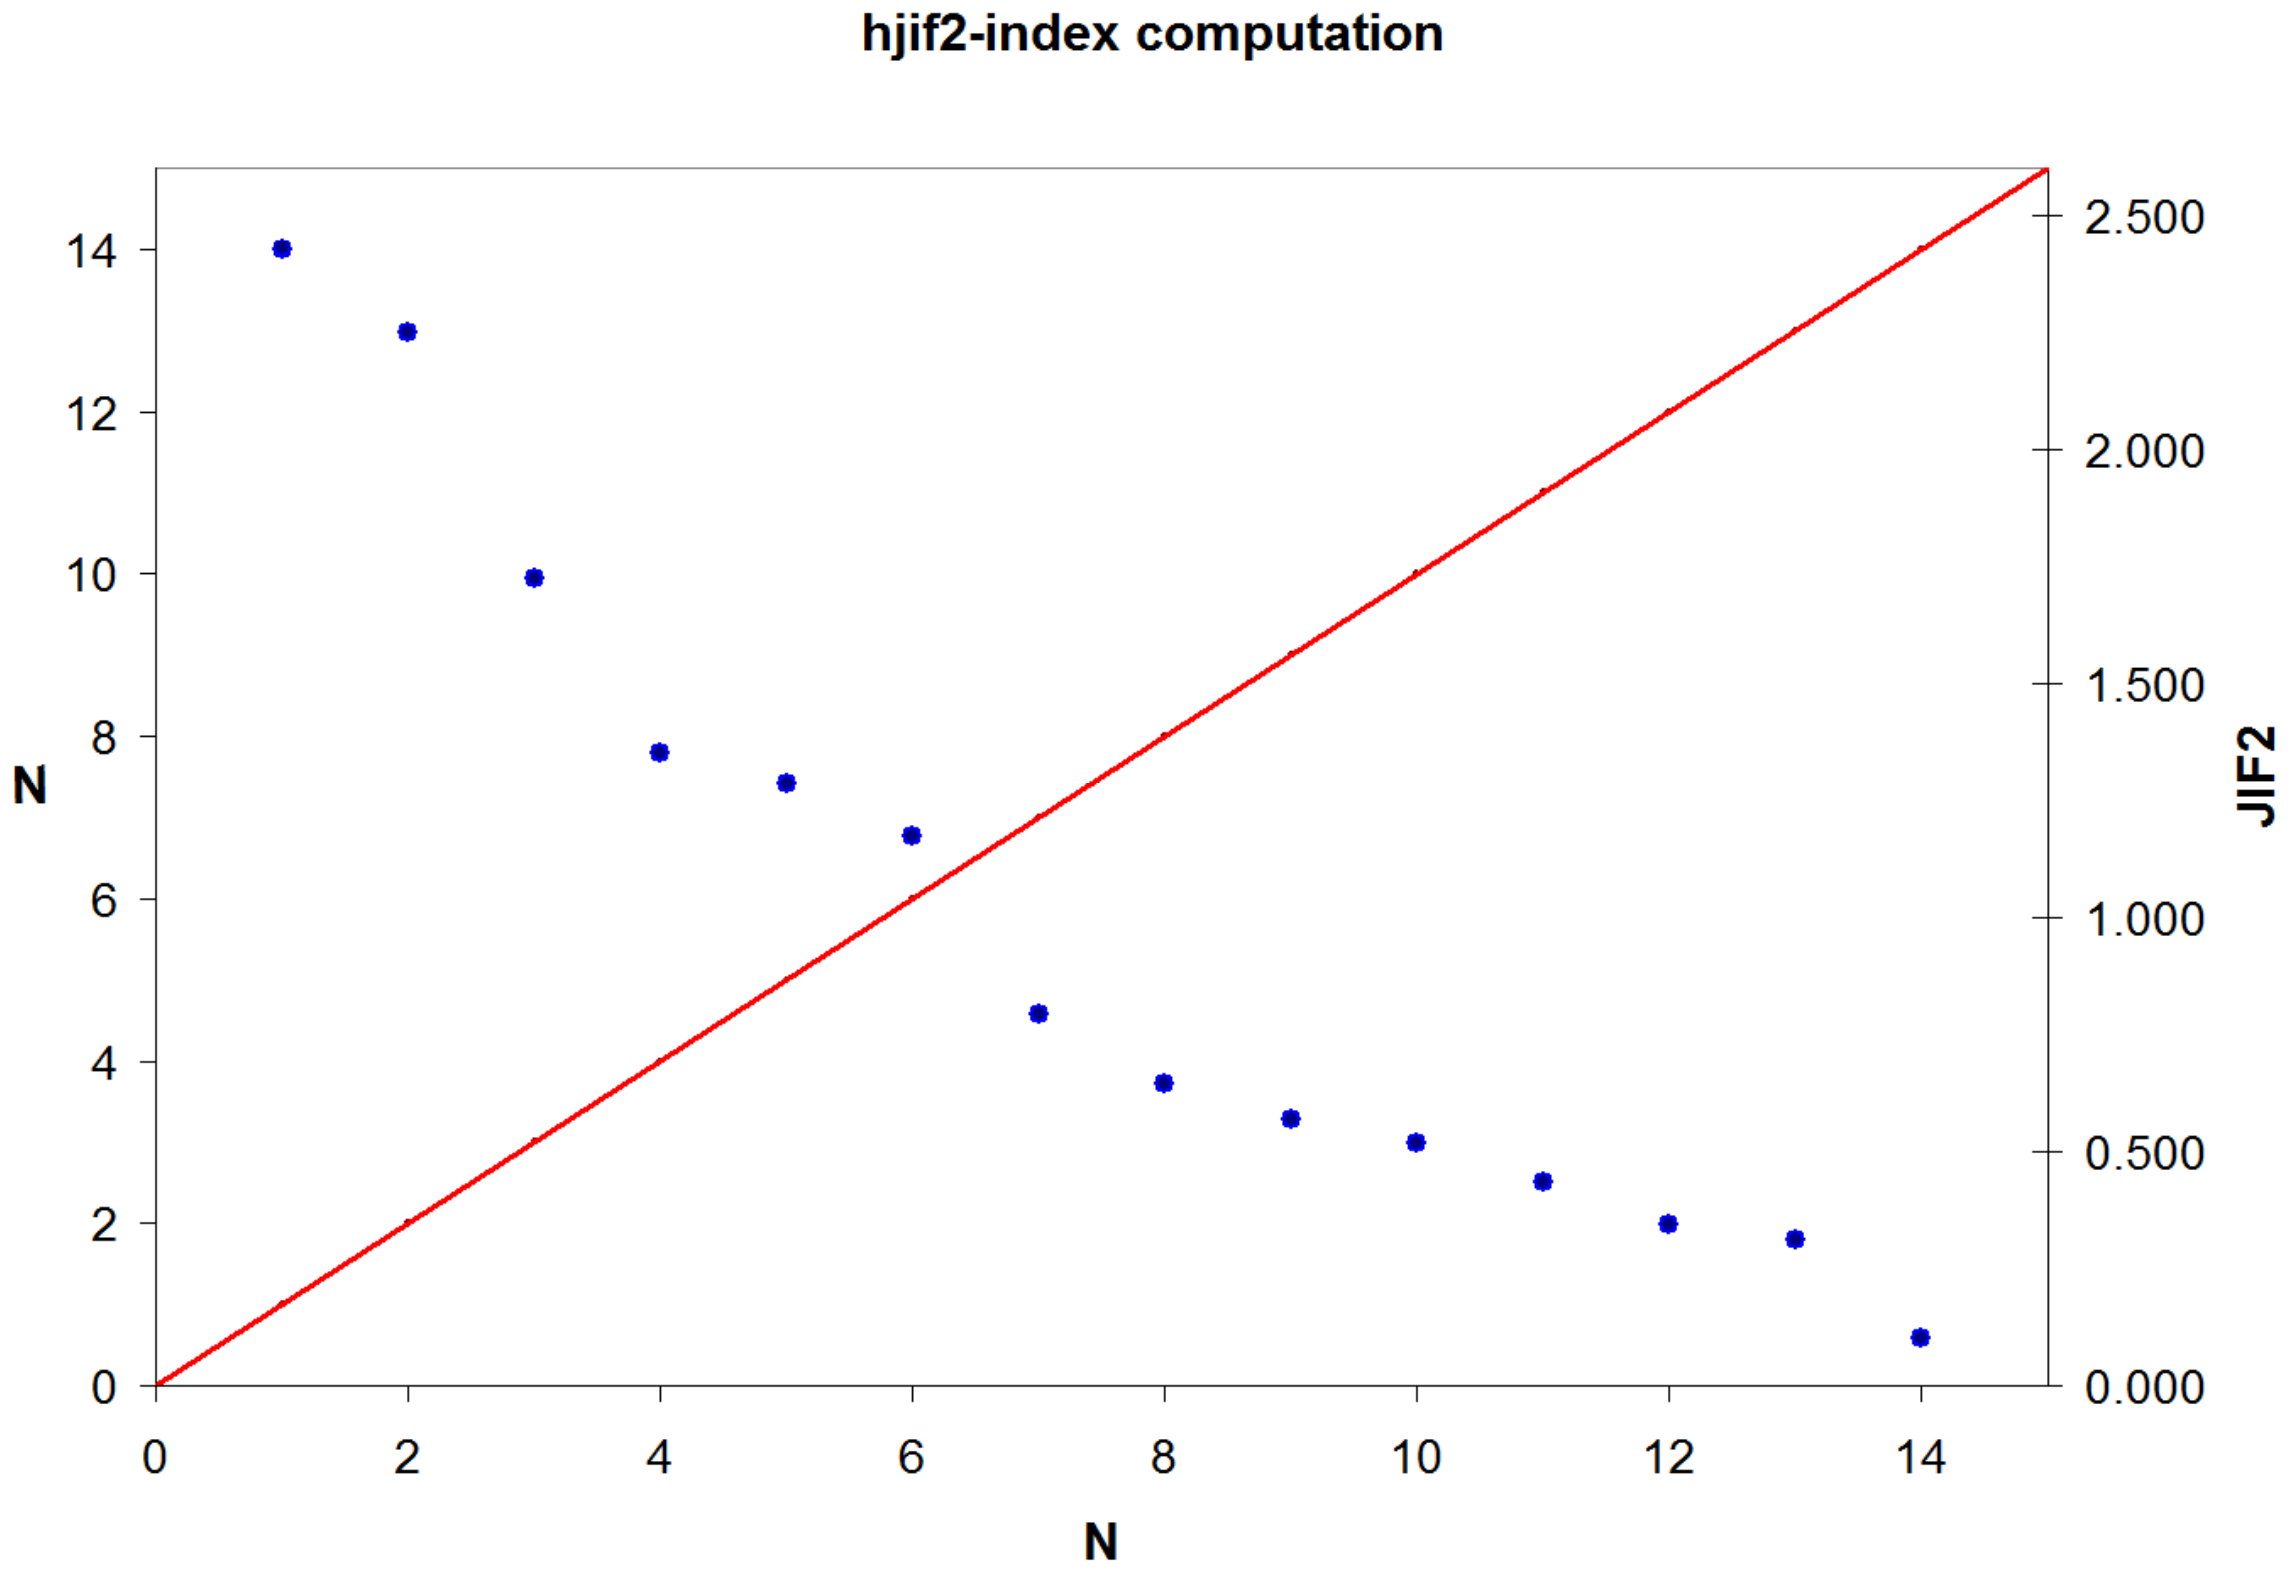
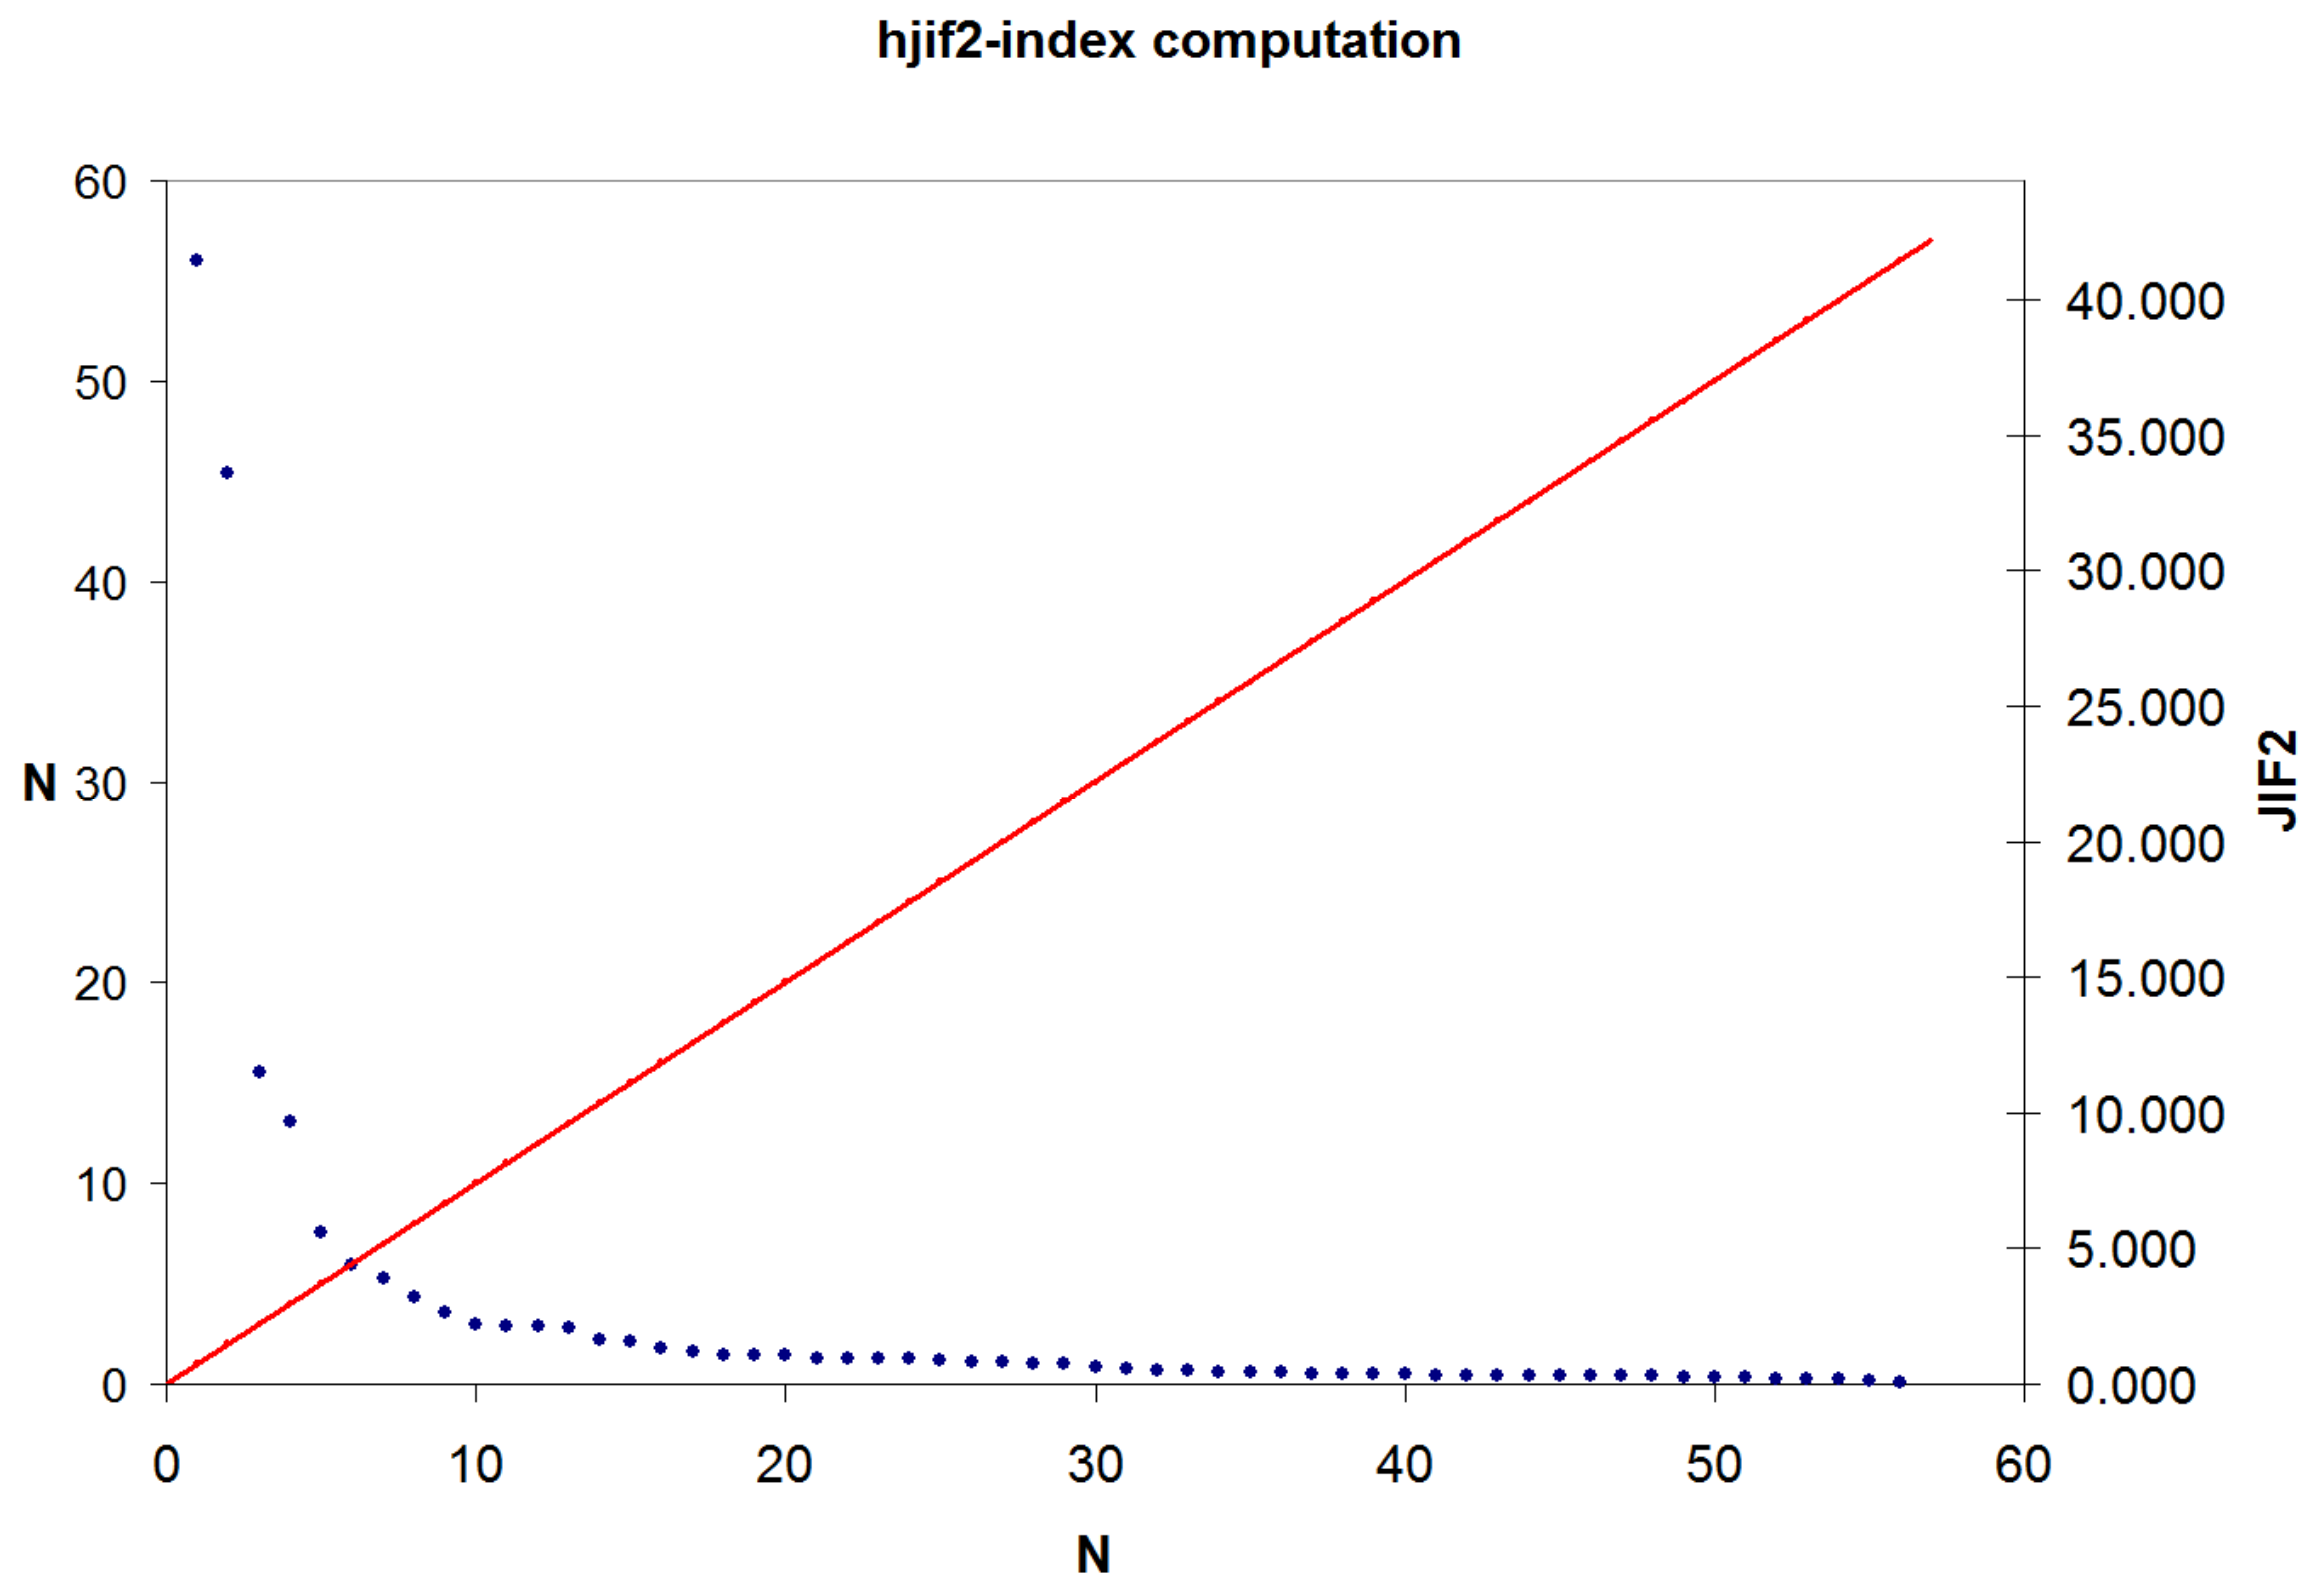
2.1. Calculation of Hjif-Indices and Hjif-Core

We used the whole JCR (Science edition) as our data source. To the best of our knowledge, this is the first wide-scale study to focus on a non-integer h-like index. In our calculations, we used data corresponding to the 2014 JCR Science edition. We downloaded JIF2 and JIF5 data corresponding to all 176 JCR groups. Many journals are listed by Clarivate Analytics in two or more groups. We considered these journals in every group in which they appeared.
Table 1 and Figure 1 (top) illustrate our approach to calculating the hjif-index with data corresponding to the ENGINEERING, OCEAN group. We sorted the journals included in this group in descending order according to their JIF2s, plotted in Figure 1 on the secondary y-axis (right). Next, the interval between zero and the highest JIF2 was divided into n integer intervals on the main y-axis (left). Next, we plotted the usual straight line y = x to obtain the hjif2-index for the ENGINEERING, OCEAN group as the JIF2 corresponding to the journal with the lowest JIF2 above the straight line. In this case, the hjif2-index for this group was 1.175 corresponding to the journal IEEE J OCEANIC ENG.
The following is a formal mathematical definition of the hjif-index: Let JIF[1] ≥ ... ≥ JIF[T] where T is the number of journals. The hjif-index is defined by min {JIF[i] | JIF[i] ≥ α i} where α = JIF[1]/n, and n ≤ T is the number of different JIFs1.
Note that our definition differs from that of Mahbuba and Rousseau for the real h-index [19]. We did not interpolate the function describing JIF succession, because these successions can be highly irregular and we did not use citations. In addition, we were not interested in the exact intersect between the interpolated function and the straight line y = x. We simply defined the hjif2-index as the JIF2 of the last journal included in the hjif2-core.
Our approach also differs from the method used by Boell and Wilson [30]. We used mapping from non-integer numbers (JIFs) to real numbers bounded by n, where n was the maximum number of different JIFs. However, the hjif-index was not defined here by rank (integer or natural number), but by the JIF related to a given n. There were no upper bounds to the hjif-index because it was defined by the maximum JIF and not by the number of publications.
Our definition is compatible with the hα-index as developed by van Eck and Waltman [31]. In our case, citations are replaced by JIFs. Thus, our formalization is similar, but not identical, to the approach studied by these authors.
The six journals that plotted to points above the straight line y = x form the hjif2-core (42.9% of all journals in this particular group). Journals with the same JIF2 were counted only once to calculate the hjif2-index and the hjif2-core. However, for all other calculations they were counted as different journals.
The definition of the hjif-index for a given JCR group depends on the highest JIF and of the number and distribution of different JIFs in the category. When journals included in the group have JIFs similar to the highest one, a significant fraction of journals are included in the hjif-core (Figure 1, top). However, when the difference between the highest JIF and the other JIFs was large, few journals are included in the hjif-core (Figure 1, bottom). We believe that the above properties are intuitive and desirable. Assume, for example, that in a given JCR group, in the following year, the JIF of the second-ranked journal increases to double the previous leader’s JIF. Any index used to describe this situation should preferably reflect this behavior. The new hjif-index described here is sensitive to this change. Because of the sharp increase in the group hjif-index, some journals would be excluded from the hjif-core: They can no longer be considered to belong to the same elite category as before, because the new lead journal defines a new reference level for impact.
As noted by Guns and Rousseau, the original h-index is insensitive to exceptional publications, because as soon as a highly cited publication becomes part of the h-core, its actual number of citations no longer matters [21]. In our case, the main determinant of the hjif-index is the highest JIF. It is well known that within a given JCR group, JIFs are unevenly distributed. Thus, the highest JIFs in a given group tend to be disproportionately greater than the following JIFs (see Figure 1, bottom). Once the highest standard is set by the most prominent journal, the status of the remaining journals can be associated to their differences from the hjif-index. Of course, a journal’s JIF can improve to the point where it joins the hjif-core without changing the group’s overall hjif-index. Thus, two different JCR groups may have a similar hjif-index but a different number and/or percentage of journals in their hjif-core. We thus consider that the index we propose plays the role of a filter which selects some journals from any JCR group: The h-core. The filter value depends on the journal with the highest JIF, the number of journals in the group, and the distribution of JIFs within the group. Therefore, this filter behaves in a way that reflects the JIFs within each group while also considering the total number of journals within each group. This is a notable difference with regard to the usual h-type indices, and we believe that this is a desirable feature, because different scientific fields can have different dynamics.

2.2. Distribution of JCR Groups

We calculated the hjif2-index and the hjif5-index with the JIF2 and the JIF5 impact factors corresponding to the usual 2-year window and to the new 5-year window. Once the hjif2-index and hjif5-index were obtained for each group, we scaled them by comparing them with the highest JIF2 and JIF5 in each group. We then studied the correlation between the hjif5-index and hjif2-index, and the difference between the two indicators in each group.
We also calculated the number of journals included in the hjif-core in each JCR group. However, the total number of journals included in different groups can differ considerably. This makes it more informative to calculate the percentage of journals included in the hjif-core in each JCR group. For example, in Table 1 the percentage of journals included in the hjif-core was 42.9%. We also studied the relationship between hjif-indices and these percentages.

3. Results and Discussion

3.1. Distribution of JCR Groups According Their Hjif-Index

Figure 2 shows the distribution of the total number of JCR groups according to their hjif2-index (top) and hjif5-index (bottom). The two distributions are very similar. Values of the hjif2-index ranged from 0.541 (LOGIC) to 8.459 (ONCOLOGY), whereas those for the hjif5-index ranged from 0.603 (LOGIC) to 8.532 (PHYSICS, CONDENSED MATTER). In 138 categories (about 78%) the hjif2-index ranged from 1.5 to 4.5, and in 140 groups (79.5%) the hjif5-index values were within the same interval.
Note that the range of hjif-index values was small, as a direct consequence of the small range of values for the JIFs. To solve this problem, the values can be rescaled. Regardless of the small range, the hjif-index yielded more precise values than the usual h-index, because the former is based on non-integer numbers.

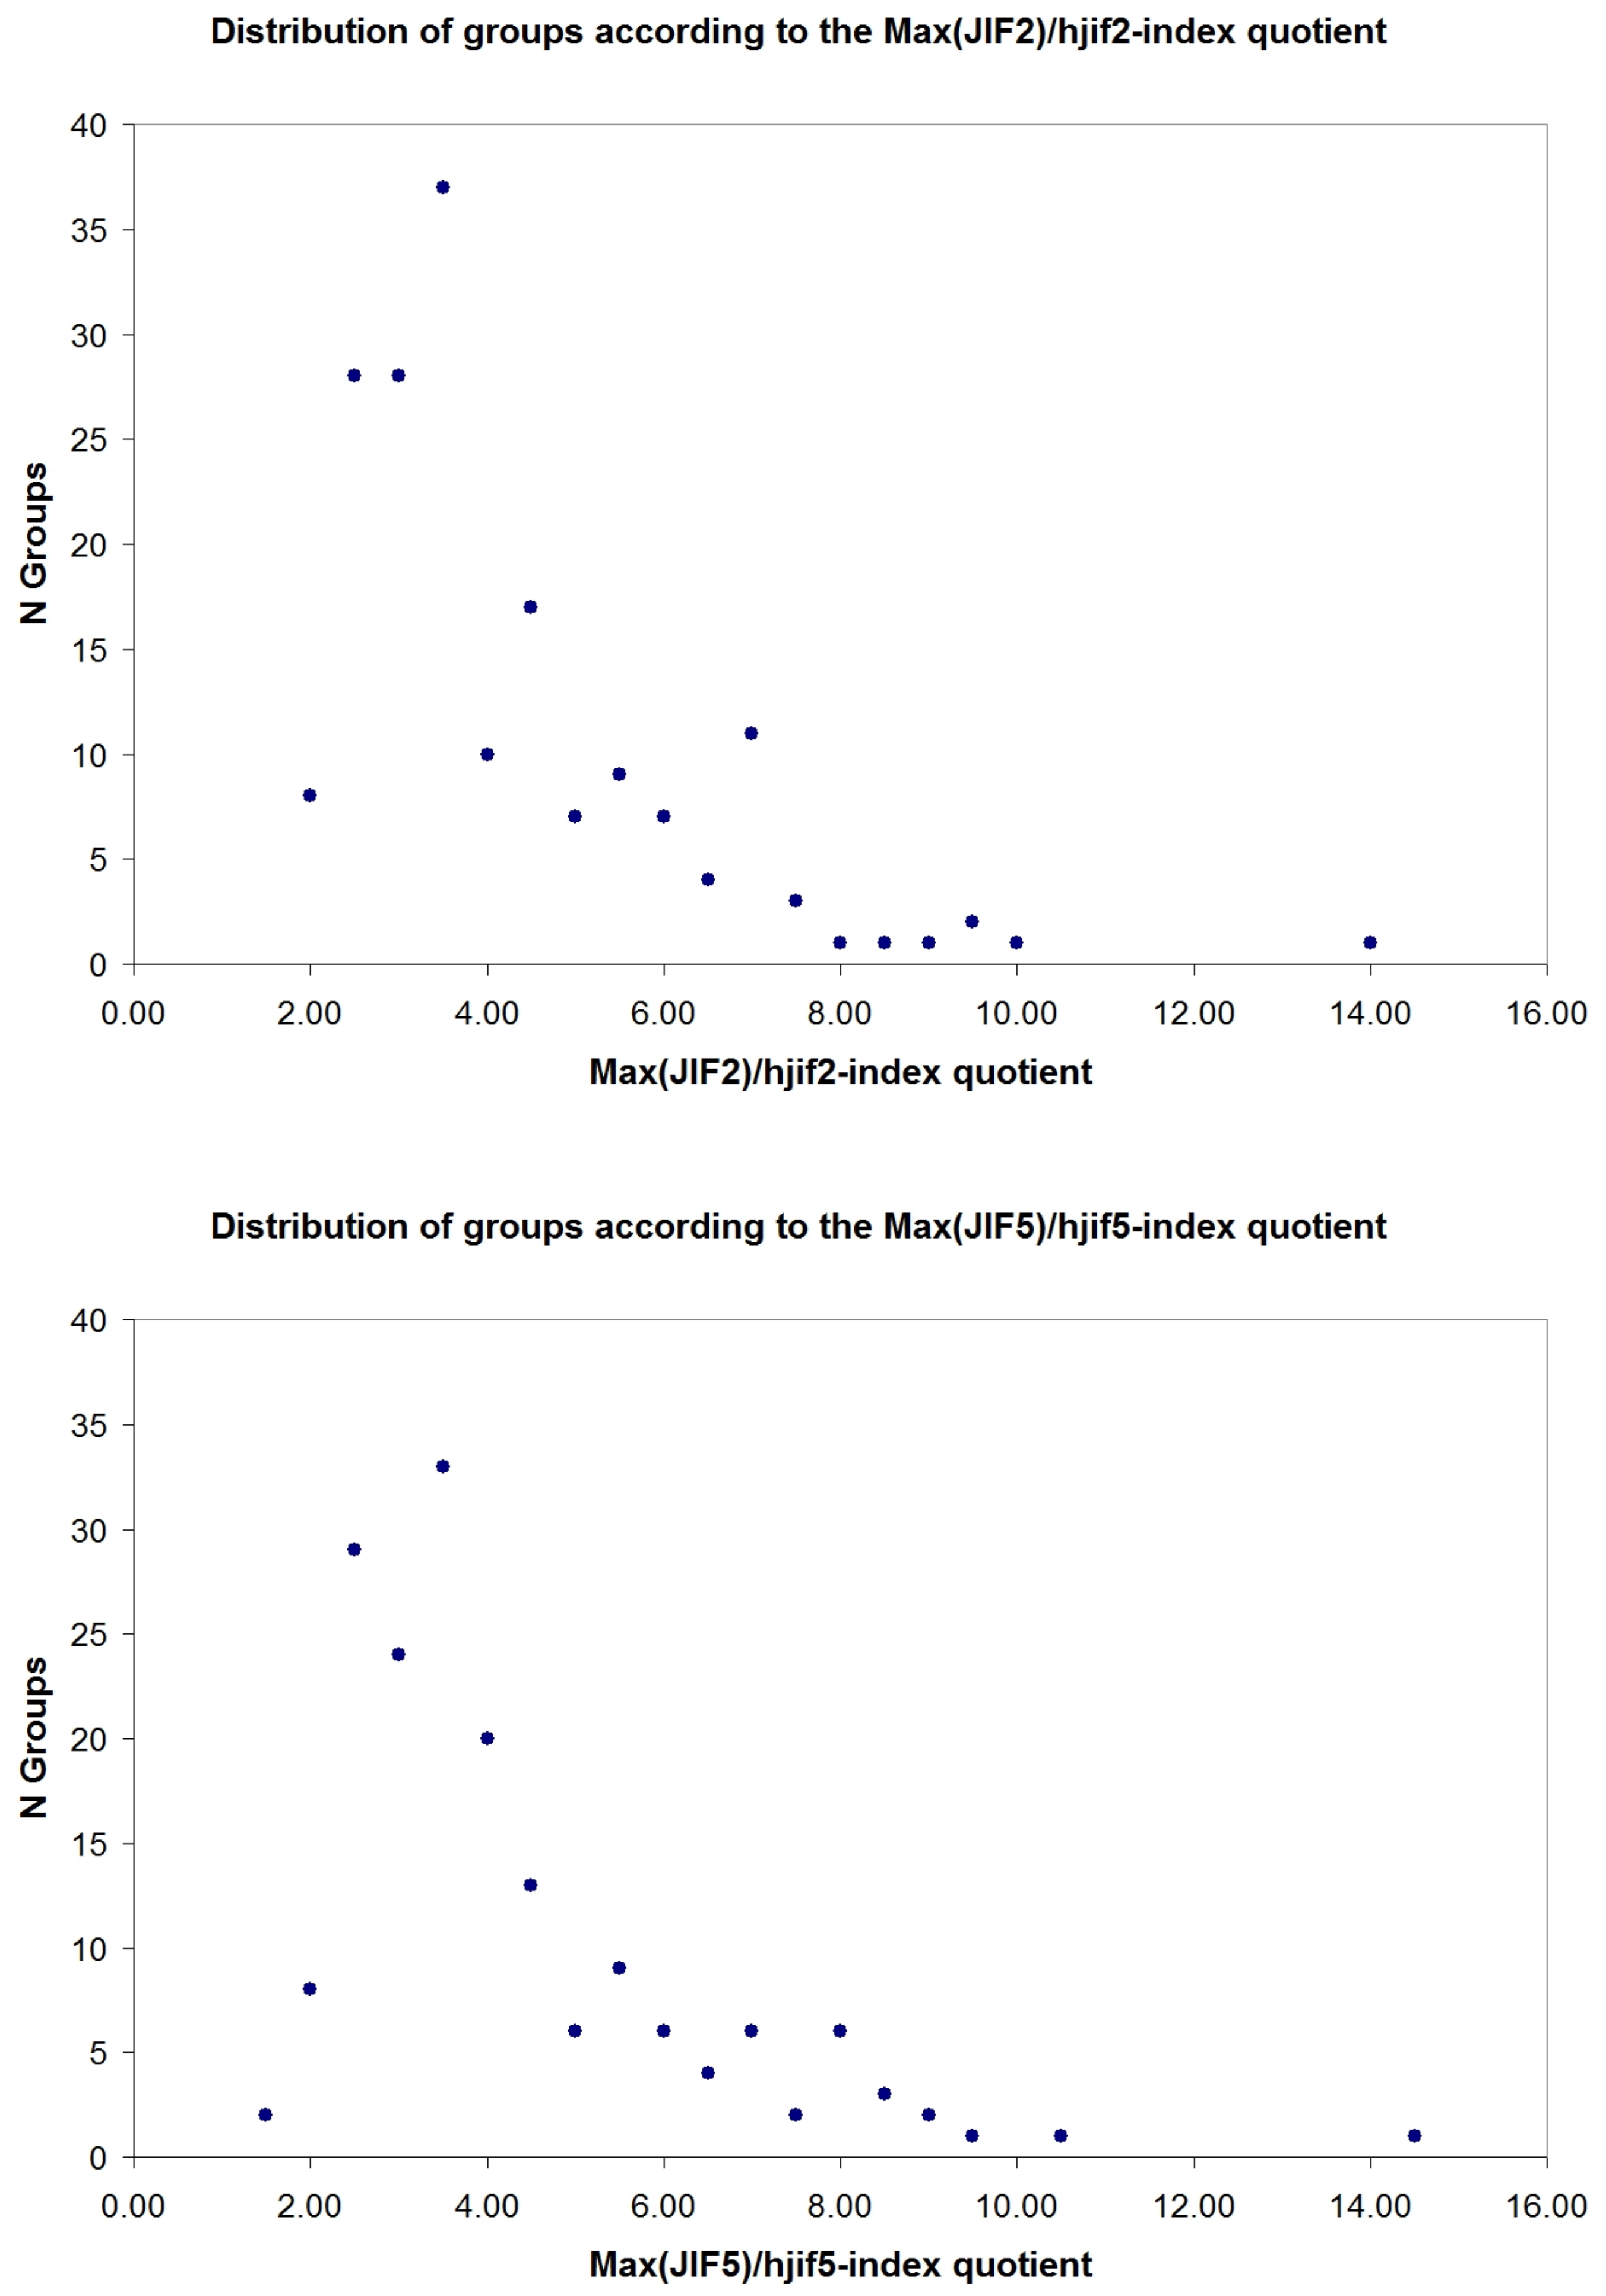
3.2. Quotient Max(JIF)/Hjif-Index

It is well known that JIFs can differ substantially across subject groups. Thus, for each group we scaled the hjif-index by calculating the Max(JIF)/hjif-index quotient, which represents the relative value of the hjif-index within the context of the group. Figure 3 shows the distribution of groups according these quotients. Again, the two distributions were very similar. In 127 groups (about 72%) the Max(JIF2)/hjif2-index quotient was between 2.5 and 5.0, and for the hjif5-index, 125 groups (about 71%) were within the same range—a remarkable degree of similarity.

3.3. Relationship between Hjif5-Index and Hjif2-Index

We calculated the correlation between the hjif5-index and the hjif2-index. The two indicators were very similar for each group, and the relationship between them was clearly linear (r2 = 0.95). For each JCR group, we calculated the hjif5-index—hjif2-index difference. As expected from the above correlation, the distribution of the differences was narrow, with most groups falling within a small range of values. For example, in 153 groups (about 87%) the differences between JI5-index and hjif2-index ranged between −0.100 and 0.600. These results illustrate once again the similarities between the JIF2 and JIF5.

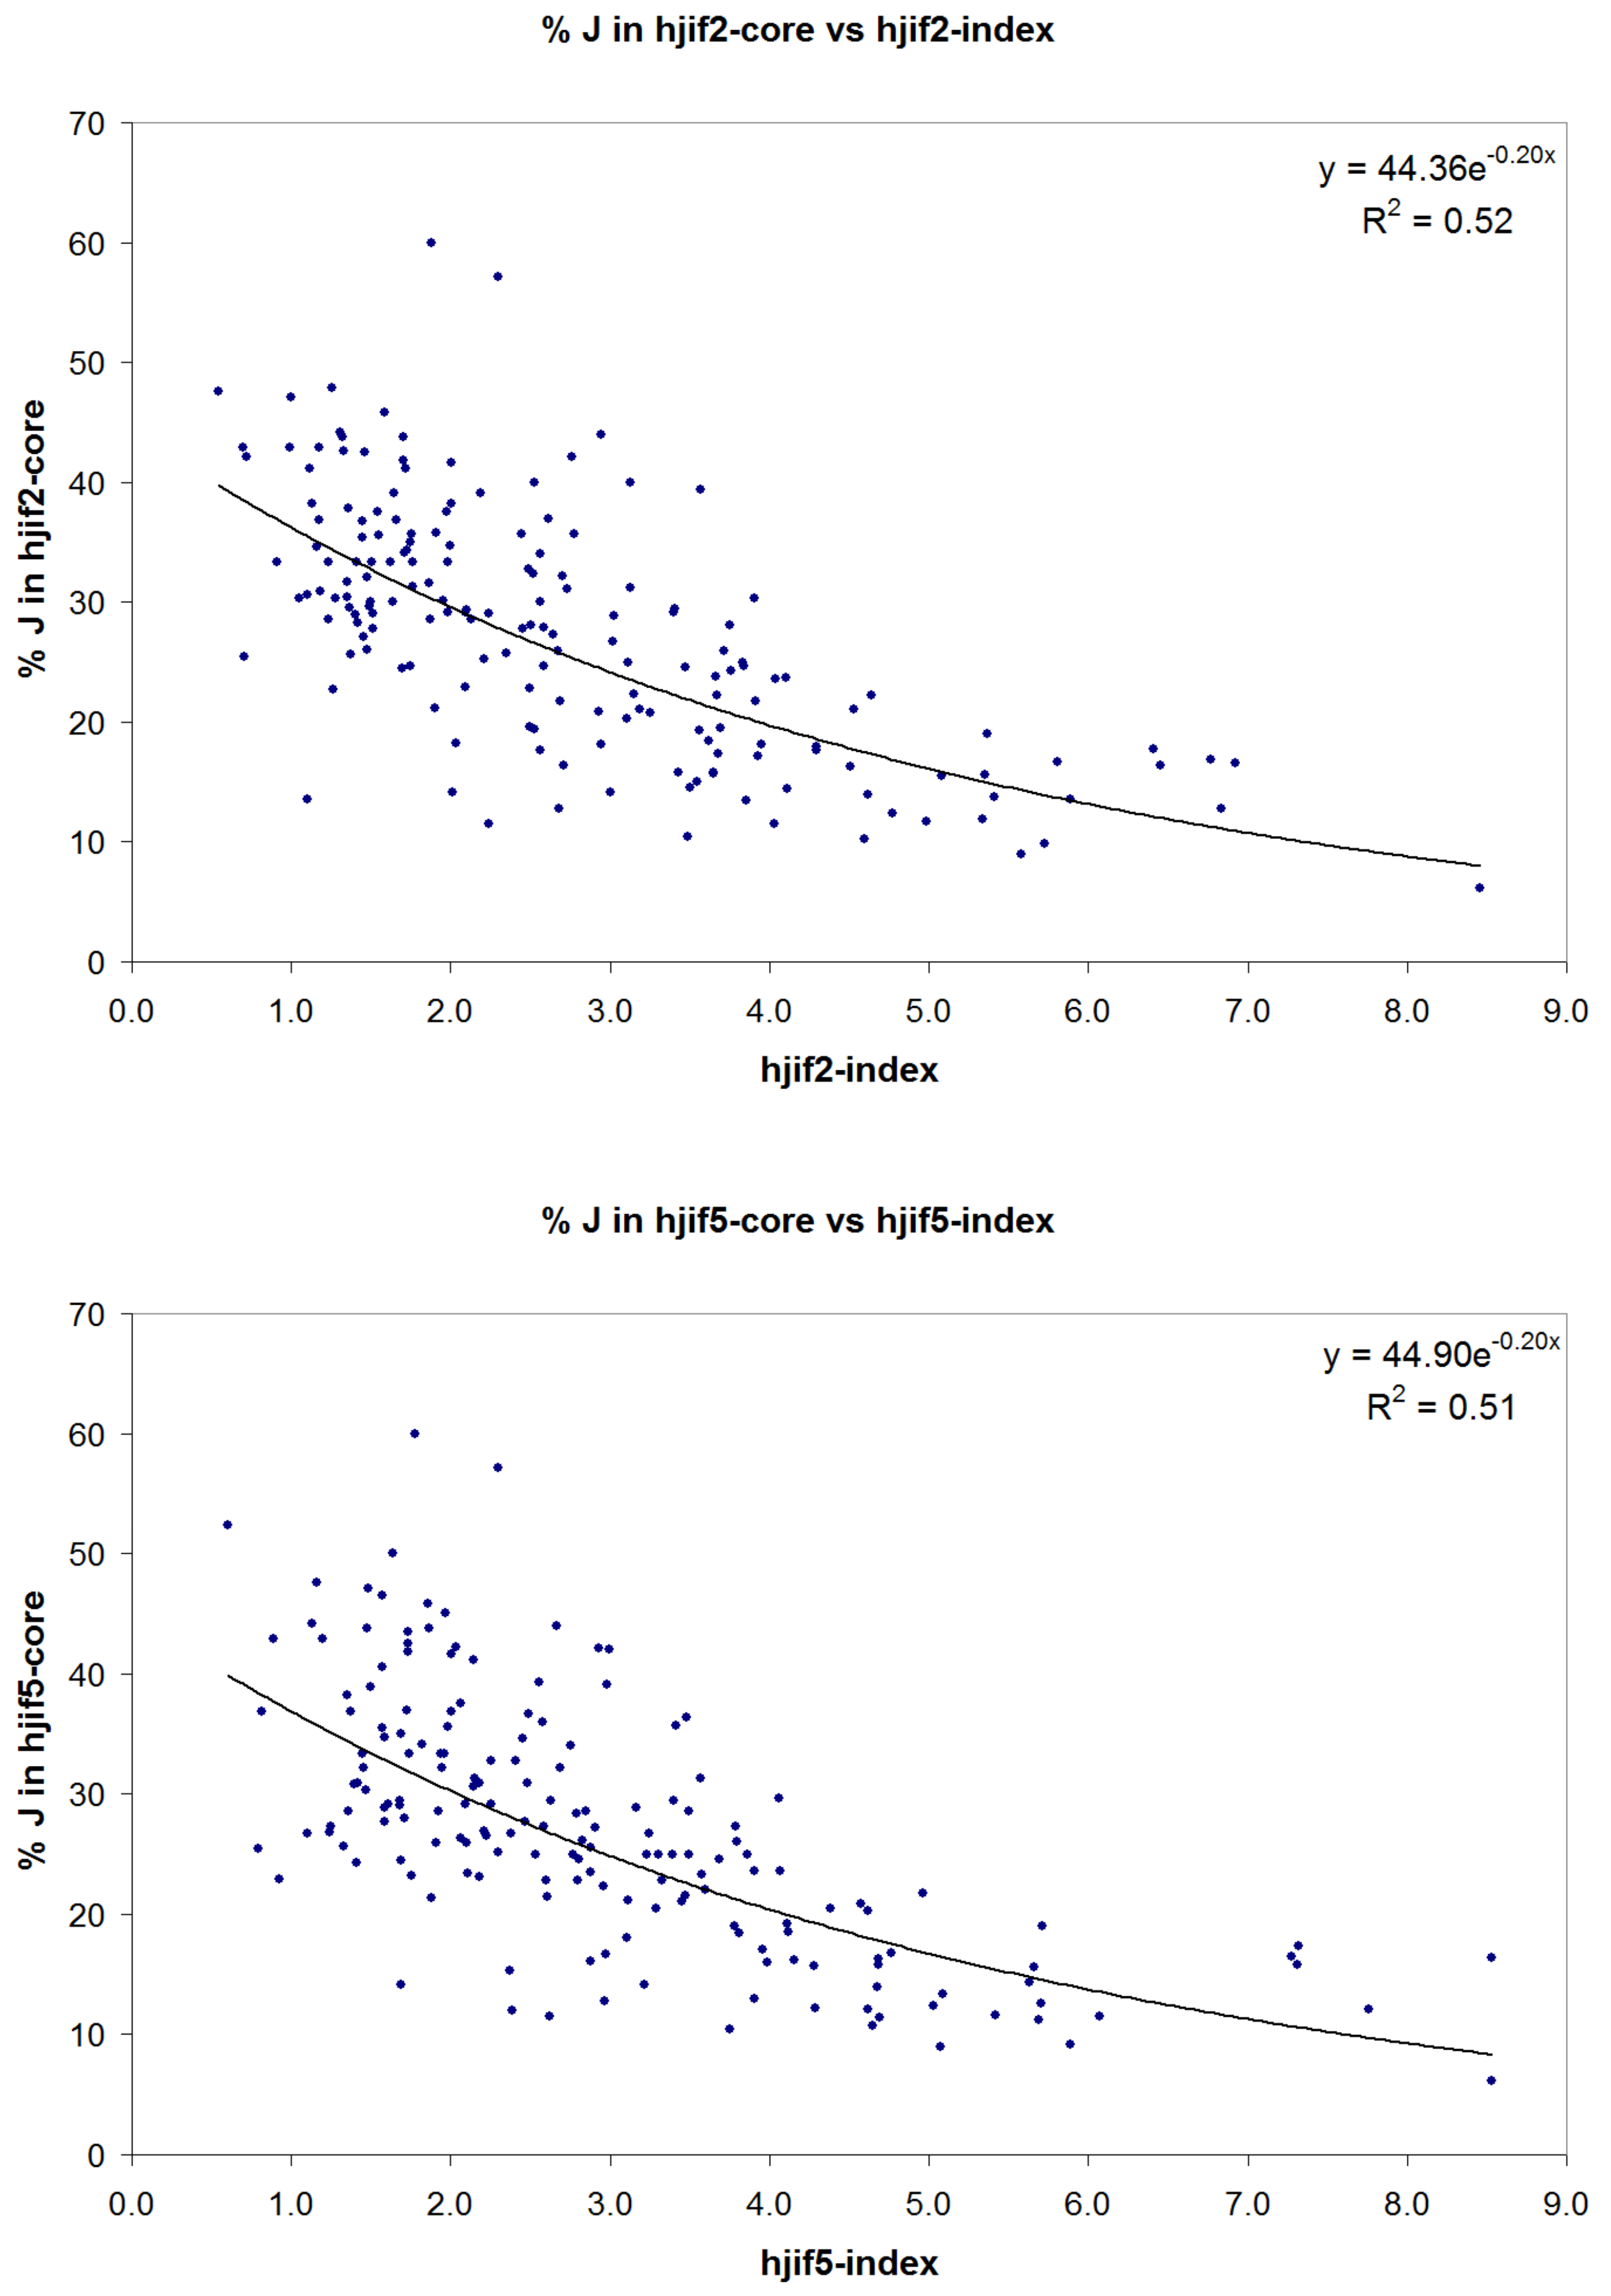
3.4. Distribution of JCR Groups According to the Percentage of Journals in the Hjif-Core

As explained above, the hjif-core includes all journals in a given JCR group with a JIF equal to or greater than the group hjif-index. We studied the distribution of groups according to the percentage of journals included in the hjif-core (Figure 4). This derived indicator estimates the size of the hjif-core relative to the size of the group.
Based on the hjif2-index, the hjif-core included from 15 to 39% of journals in 141 groups (about 80%). Based on the hjif5-index, the hjif5-core included this range in 139 groups (79%). Again, the two indices were markedly similar.
Figure 5 shows the relationship between the percentage of journals in the hjif-core and the hjif-indices. These plots show that when the hjif-index increased, the percentage of journals included in the hjif-core tended to decrease. This is a desirable feature of the hjif-indices, because it reflects the nature of inter-journal relationships in science. For example, in a JCR group with only one or two very influential journals, only a few journals would be considered relevant, while the others would be excluded from the hjif-core. Because of how the hjif-index is calculated, the journals that remain outside the hjif-core are determined in a self-defining way. In other words, the hjif-core is defined by, and specific to, each group.

4. Conclusions

The behavior of the JIF, one of the most widely used scientometric indicators, has been studied extensively. In addition, much research has been published about h-type indices, and some authors even speak of an “h-bubble” [32]. Other authors have questioned different aspects of h-like indices [33,34].
We describe a method to calculate the hjif-index for JCR groups as an analogue to the h-index. As noted by Egghe, the h-index is not an average, not a percentile, and not a fraction [15]. Our approach is based on JIFs as fractions that relate citations to publications. The hjif-index is thus an extension of the well-known h-index, and can be conceptualized as a natural marker of highly relevant journals within a given JCR group. In addition, we have explored some derived indicators that can be used to study academic journals.
The hjif-index is a single number, and therefore reduces the entire set of journals included in each JCR group to a one-dimensional measurement. We believe that the indicators and variables we used complement the hjif-indices, and can moreover provide an overall picture of impact across JCR groups. We calculated the hjif2-index and hjif5-index, and analyzed how journals in different JCR groups were distributed according to these indices.
The JIF is well known to depend on the citing and publication window used. However, we found that all distributions analyzed here were similar in the hjif2-index and hjif5-index. A previous study in fact found that the two JIFs behave in a very similar way [35]. It is thus unsurprising that indices derived from JIF2 and JIF5 also behave similarly. Most of the distributions consisted of a peak followed by a tail, whereas most JCR groups tend to cluster in a relatively small region.
To illustrate the difference in the behavior of the hjif-index compared to the usual h-type index, we note that two different JCR groups can have similar hjif-indices but different numbers and/or percentages of journals included in their hjif-core. Furthermore, when the hjif-index increases, the percentage of journals included in the hjif-core tends to decrease. When a given JCR group contains a few very influential journals with high JIFs, only a small set of journals in this group can be considered relevant (see, for example, Figure 1). The other journals are excluded from the hjif-core, and the proportion of excluded journals vs. included journals naturally varies across groups.
The indices we tested here could create new areas for research in evaluative scientometrics. We believe that the usual ways to rank journals according to arbitrary percentiles should be replaced with less artifactual intervals that may vary across groups. As with the h-core when the h-index is used, the hjif-core is a promising tool in that it depends on the number and distribution of different JIFs in a given group and also on the highest JIF. Thus, the hjif-core identifies the journals that have the greatest impact within a given JCR group in a self-defining way.

Acknowledgments

We thank K. Shashok for improving the use of English in the manuscript and three anonymous referees for their comments. Some of these comments have been included in the text.

Author Contributions

William Cabos: Conception and design of the work, interpretation of data. Juan Miguel Campanario: Acquisition, analysis and interpretation of data.

Conflicts of Interest

The authors declare no conflict of interest.

References

  1. Hirsch, J.E. An Index to quantify an individual’s scientific output. Proc. Natl. Acad. Sci. USA 2005, 102, 16569–16572. [Google Scholar] [CrossRef] [PubMed] [Green Version]
  2. Braun, T.; Glänzel, W.; Schubert, A. A Hirsch-type index for journals. Scientometrics 2006, 69, 169–173. [Google Scholar] [CrossRef]
  3. Bar-Ilan, J. The h-index of h-index and of other informetric topics. Scientometrics 2008, 75, 591–605. [Google Scholar] [CrossRef]
  4. Schubert, A.; Glänzel, W. A systematic analysis of Hirsch-type indices for journals. J. Informetr. 2007, 1, 179–184. [Google Scholar] [CrossRef]
  5. Bertoli-Barsotti, L.; Lando, T.A. Theoretical model of the relationship between the h-index and other simple citation indicators. Scientometrics 2017, 111, 1415–1448. [Google Scholar] [CrossRef] [PubMed]
  6. Iglesias, J.E.; Pecharromán, C. Scaling the h-index for different scientific ISI fields. Scientometrics 2007, 73, 303–320. [Google Scholar] [CrossRef]
  7. Egghe, L. Theory and practice of the g-index. Scientometrics 2006, 69, 131–152. [Google Scholar] [CrossRef]
  8. Kosmulski, M. A new Hirsch-type index saves time and works equally well as the original h-index. ISSI Newsl. 2006, 2, 4–6. [Google Scholar]
  9. Franceschini, F.; Galetto, M.; Maisano, D.; Mastrogiacomo, L. The success-index: An alternative approach to the h-index for evaluating an individual's research output. Scientometrics 2011, 92, 621–641. [Google Scholar] [CrossRef]
  10. Jin, B.H.; Liang, L.M.; Rousseau, R.; Egghe, L. The R- and AR-indices: Complementing the h-index. ISSI Newsl. 2007, 52, 855–863. [Google Scholar] [CrossRef]
  11. Jin, B.H.; Liang, L.; Rousseau, R.; Egghe, L. The R- and AR-indices: Complementing the h-index. Chin. Sci. Bull. 2007, 52, 855–863. [Google Scholar] [CrossRef]
  12. Bornmann, L.; Daniel, H.D. The state of h index research. EMBO Rep. 2009, 10, 2–6. [Google Scholar] [CrossRef] [PubMed]
  13. Alonso, S.; Cabrerizo, F.J.; Herrera-Viedma, E.; Herrera, F. h-Index: A review focused in its variants, computation and standardization for different scientific fields. J. Informetr. 2009, 3, 273–289. [Google Scholar] [CrossRef]
  14. Panaretos, J.; Malesios, C. Assessing scientific research performance and impact with single indices. Scientometrics 2009, 81, 635–670. [Google Scholar] [CrossRef]
  15. Egghe, L. The Hirsch index and related impact measures. Annu. Rev. Inf. Sci. Technol. 2010, 44, 65–114. [Google Scholar] [CrossRef]
  16. Schreiber, M.; Malesios, C.C.; Psarakis, S. Exploratory factor analysis for the Hirsch index, 17 h-type variants, and some traditional bibliometric indicators. J. Informetr. 2012, 6, 347–358. [Google Scholar] [CrossRef]
  17. Ye, F.; Rousseau, R. Probing the h-core: An investigation of the tail–core ratio for rank distributions. Scientometrics 2009, 84, 431–439. [Google Scholar] [CrossRef]
  18. Rousseau, R. Simple Models and the Corresponding h- and g-Index. Available online: https://doclib.uhasselt.be/dspace/bitstream/1942/944/1/Rousseau%20Dalian.pdf (accessed on 3 April 2018).
  19. Mahbuba, D.; Rousseau, R. Year-based h-type indicators. Scientometrics 2013, 96, 785–797. [Google Scholar] [CrossRef]
  20. Ruane, F.; Tol, R. Rational (successive) h-indices: An application to economics in the Republic of Ireland. Scientometrics 2008, 75, 395–405. [Google Scholar] [CrossRef]
  21. Guns, R.; Rousseau, R. Real and rational variants of the h-index and the g-index. J. Informetr. 2009, 3, 64–71. [Google Scholar] [CrossRef]
  22. Glänzel, W.; Moed, H.F. Journal impact measures in bibliometric research. Scientometrics 2002, 53, 171–193. [Google Scholar] [CrossRef]
  23. Bensman, S.J. Garfield and the impact factor. Annu. Rev. Inf. Sci. Technol. 2007, 41, 93–155. [Google Scholar] [CrossRef]
  24. Waltman, L. A review of the literature on citation impact indicators. J. Informetr. 2016, 10, 365–391. [Google Scholar] [CrossRef]
  25. Bornmann, L.; Marx, W. The journal impact factor and alternative metrics. EMBO Rep. 2016, 17, 1094–1097. [Google Scholar] [CrossRef] [PubMed]
  26. Yang, D.H.; Li, X.; Sun, X.; Wan, J. Detecting impact factor manipulation with data mining techniques. Scientometrics 2016, 109, 1989–2005. [Google Scholar] [CrossRef]
  27. Archambault, E.; Larivière, V. History of the journal impact factor: Contingencies and consequences. Scientometrics 2009, 79, 635–649. [Google Scholar] [CrossRef]
  28. Yang, Z.G.; Zhang, C.T. A proposal for a novel impact factor as an alternative to the JCR impact factor. Sci. Rep. 2013, 3. [Google Scholar] [CrossRef] [PubMed]
  29. Egghe, L.; Liang, L.; Rousseau, R. A relation between h-index and impact factor in the power-law model. J. Am. Soc. Inf. Sci. Technol. 2009, 60, 2362–2365. [Google Scholar] [CrossRef]
  30. Boell, S.; Wilson, C. Journal impact factors for evaluating scientific performance: Use of h-like indicators. Scientometrics 2010, 82, 613–626. [Google Scholar] [CrossRef]
  31. Van Eck, N.J.; Waltman, L. Generalizing the h-and g-indices. J. Informetr. 2008, 2, 263–271. [Google Scholar] [CrossRef]
  32. Rousseau, R.; García-Zorita, C.; Sanz-Casado, E. The h-bubble. J. Informetr. 2013, 7, 294–300. [Google Scholar] [CrossRef]
  33. Barnes, C.S. The construct validity of the h-index. J. Doc. 2016, 72, 878–895. [Google Scholar] [CrossRef]
  34. Bornmann, L. h-index research in scientometrics: A summary. J. Informetr. 2014, 8, 749–750. [Google Scholar] [CrossRef]
  35. Campanario, J.M. Empirical study of journal impact factors obtained using the classical two-year citation window versus a five-year citation window. Scientometrics 2011, 87, 189–204. [Google Scholar] [CrossRef]
1
We are indebted to an anonymous referee for this definition.
Figure 1. Top: Calculation of the hjif2-index for the ENGINEERING, OCEAN group (see Table 1). JIFs (secondary y-axis, right) were plotted versus each JIF2 ordinal number (1, 2, 3, ... n). Next, on the primary y-axis (left), the space between zero and the highest JIF2s was divided into n intervals (n = 14). The straight line y = x was plotted and used to obtain the hjif2-index. This hjif2-index is the lowest JIF2 above the line (hjif2-index = 1.175). The hjif2-core includes all journals located above the line. Bottom: Calculation of the hjif2-index for the MULTIDISCIPLINARY SCIENCES group.
Publications 06 00014 g001aPublications 06 00014 g001b
Figure 2. Distribution of JCR groups according to the hjif2-index (top) and hjif5-index (bottom).
Publications 06 00014 g002
Figure 3. Distribution of JCR groups according to the Max(JIF2)/hjif2-index (top) and Max(JIF5)/hjif5-index quotient (bottom).
Publications 06 00014 g003
Figure 4. Distribution of JCR groups according to the percentage of journals included in the hjif2-core (top) and hjif5-core (bottom).
Publications 06 00014 g004
Figure 5. Relationship between the percentage of journals included in the hjif2-core and the hjif2-index (top), and between the percentage of journals included in the hjif5-core and hjif5-index (bottom).
Publications 06 00014 g005
Table 1. Journal Impact Factor (JIF)2s for journals in the JCR group ENGINEERING, OCEAN.
JournalJIFNDifference from the hjif2-IndexH-Core
COAST ENG2.42811.253Yes
COAST ENG J2.25021.075Yes
J ATMOS OCEAN TECH1.72530.550Yes
OCEAN ENG1.35140.176Yes
APPL OCEAN RES1.28750.112Yes
IEEE J OCEANIC ENG1.17560.000Yes
J WATERW PORT COAST0.7927−0.383
MAR GEORESOUR GEOTEC0.6448−0.531
J OFFSHORE MECH ARCT0.5709−0.605
INT J OFFSHORE POLAR0.51710−0.658
MAR TECHNOL SOC J0.43411−0.741
CHINA OCEAN ENG0.34412−0.831
P I CIVIL ENG-MAR EN0.31213−0.863
SEA TECHNOL0.10114−1.074

