Article

2,2′-Azobisphenolate Ligand Bearing Electron-Donating Methoxy Substituents: Spin-Crossover Ligand Field for a Fe(III) Complex and Stabilization of Ligand-Centered Oxidation Species Due to Its Resonance Effect


1
Department of Chemistry, Graduate School of Science, Kobe University, 1-1, Rokkodai-cho, Nada-ku, Kobe 657-8501, Hyogo, Japan
2
Research Facility Center for Science and Technology, Kobe University, 1-1, Rokkodai-cho, Nada-ku, Kobe 657-8501, Hyogo, Japan
3
Molecular Photoscience Research Center, Kobe University, 1-1, Rokkodai-cho, Nada-ku, Kobe 657-8501, Hyogo, Japan
*
Author to whom correspondence should be addressed.
Present address: Core Facility Center, The University of Osaka, 2-1, Yamadaoka, Suita 565-0871, Osaka, Japan.
Present address: Center for Life Photonic Innovation, Kobe University, 1-1, Rokkodai-cho, Nada-ku, Kobe 657-8501, Hyogo, Japan.
Inorganics 2026, 14(9), 223; https://doi.org/10.3390/inorganics14090223
Submission received: 28 July 2026 / Revised: 12 August 2026 / Accepted: 20 August 2026 / Published: 23 August 2026
(This article belongs to the Section Coordination Chemistry)

Abstract

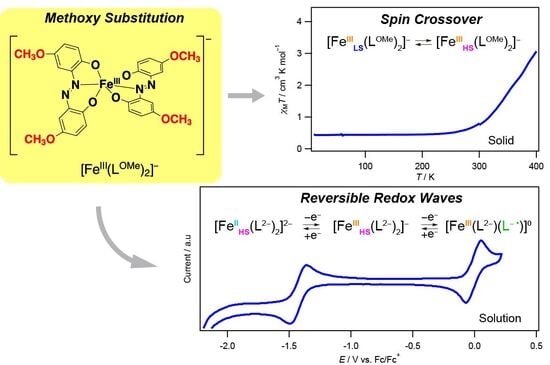
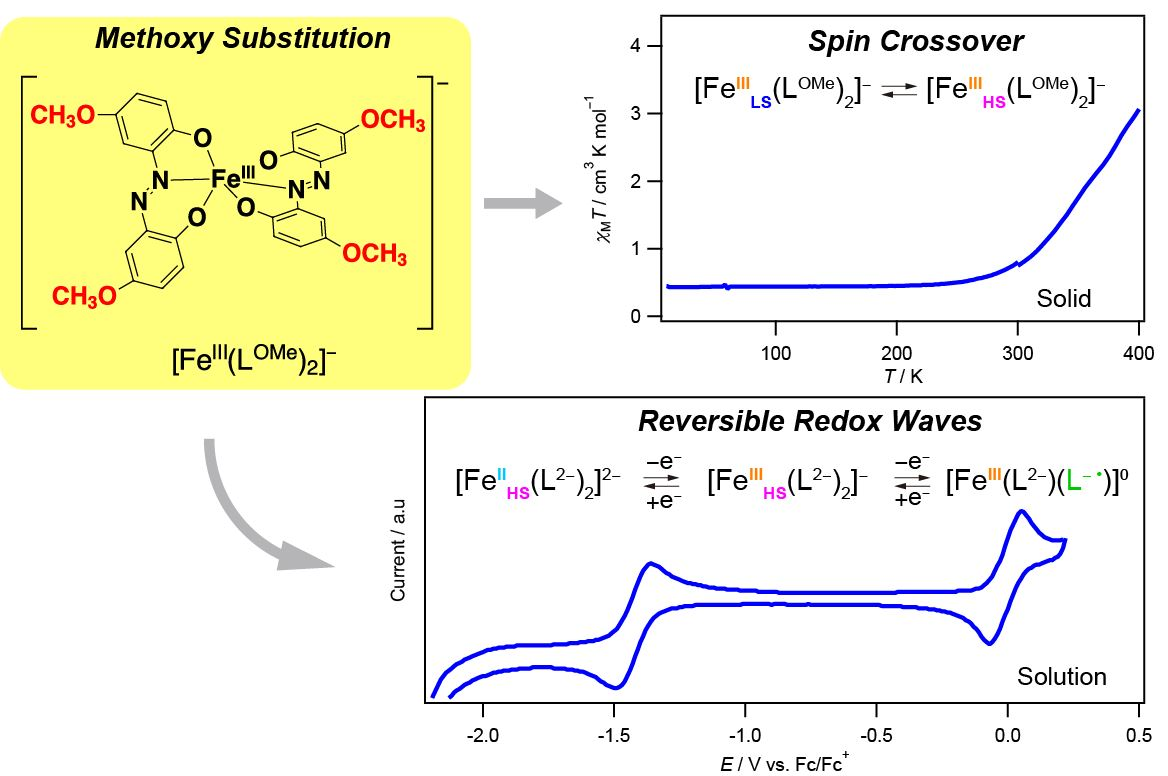
To investigate the electron-donating substitution effect on spin crossover (SCO) and electrochemical behaviors for homoleptic trivalent metal complexes with 2,2′-azobisphenolate (azp) ligands, the known 2,2′-azobisphenol with 5,5′-dimethyoxy substituents (H2LOMe) was synthesized and characterized by NMR spectroscopy and single-crystal X-ray diffraction (SCXRD). The homoleptic FeIII and AlIII complexes 1-OMe and 2-OMe were prepared along with the homoleptic FeIII complex with 5,5′-dimethyl-substituted azp ligands 1-Me. The temperature dependence of magnetic susceptibility and SCXRD revealed that 1-OMe exhibits incomplete gradual SCO with the rotational motion of the ligands. Cyclic voltammograms and their simulations revealed that both the FeIII complex 1-OMe and the AlIII complex 2-OMe exhibit reversible one-electron oxidation waves, indicating that the introduction of the methoxy group enhances the stability of the oxidized species of the complexes. DFT calculations revealed that the oxidation waves for both the FeIII and AlIII complexes are ligand-centered, while the reduction wave for the FeIII complexes 1-OMe and 1-Me is metal-centered. In addition, the stability of the oxidized complex species arises from the resonance effect of the methoxy group.

Graphical Abstract

1. Introduction

The phenomenon where molecular structure and/or electronic states switch in response to external stimuli such as temperature, pressure, or light has attracted interest across a wide range of molecular materials fields [1]. Among the molecular switching phenomena exhibited by metal complexes, several are well-known as spin crossover (SCO) [2,3,4,5,6,7], which involves a change in the spin state of a central metal ion between a low-spin (LS) and high-spin (HS) states; valence tautomerism (VT) [8,9,10], an electron transfer reaction between the central metal ion and redox-active ligands; and charge-transfer-induced spin transition (CTIST) [8,9,10], an electron transfer reaction between metal ions in multinuclear metal complexes. In recent years, attempts to control electrical conductivity [11,12,13,14,15], magnetism [16,17,18,19,20], optical properties [21,22,23], polarization [24,25,26], and mechanical properties [27,28,29] using these switching phenomena in metal complexes have also been actively pursued.
If a redox-active ligand gives a SCO complex, SCO or VT can be selectively prepared by either ligand substitution or metal ion exchange. It has been known that tetraoxolene-bridged dinuclear Co and Fe complexes exhibit VT [30] and SCO [31], respectively. Recently, Sato et al. reported SCO at low temperature followed by VT at higher temperature in a tetraoxolene-bridged hetero-dinuclear [FeCo] complex [32]. This suggests that competition between SCO and VT is expected to lead to the development of multi-stage switching or new types of switching phenomena.
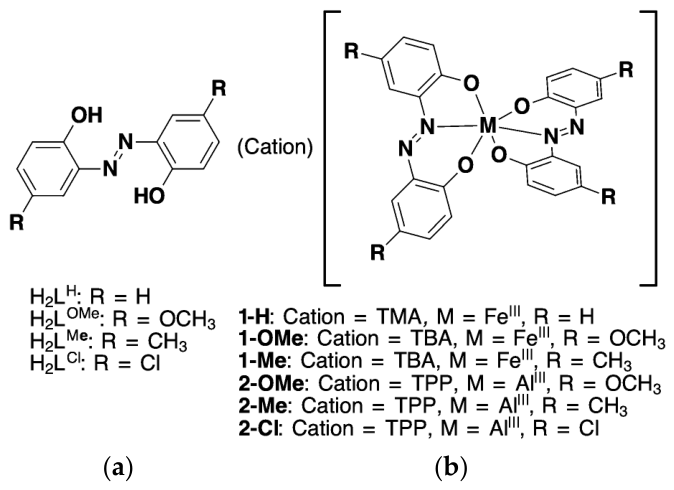
2,2′-azobisphenol (H2LH) and its derivatives (Figure 1a) are known as intense coloring and fluorometric reagents for various metal ions. We hereafter refer to the deprotonated 2,2′-azobisphenolate dianion (LR) as the azp ligand. Recently, we discovered that the homoleptic FeIII complex TMA[FeIII(LH)2] 1-H (TMA = tetramethylammonium) showed a gradual SCO transition (Figure 1b) [33]. After this discovery, we developed the homoleptic SCO FeIII complexes with the π-extended azp ligand [34] and halogen-substituted azp ligands [35]. Furthermore, the neutral heteroleptic [FeIII(LH)(qsal)] complex (qsal = N-(8-quinolyl)salicylaldiminate) [36] and its derivatives [37,38] exhibited cooperative SCO transitions. Other groups have also reported the SCO transitions in the [FeIII(LH)2] complexes with various cations [39,40,41]. Although the halogen substitution effect on the SCO behavior in the FeIII complexes with the azp ligands has been reported very recently [35], there is no report on the electron-donating substituent effect on SCO behavior in the FeIII complexes with the azp ligands.
In addition, recent investigations into the electrochemical properties of redox-innocent AlIII complexes derived from azp ligands with alkyl- and chloro-substituents revealed that the azp ligands are redox-active with substituent effects on their redox potentials [42]. Thus, we intended to investigate the possibility of VT by introducing electron-donating substituents into the SCO complex.
To investigate the electron-donating substituent effect on SCO behaviors and the redox properties in the homoleptic azp complexes, we focused on the methoxy-substituted azp ligand (LOMe). Schetty and Steiner reported the synthesis of H2LOMe but described only the chemical shift of the methoxy substituent in the 1H NMR spectrum and elemental analysis [43]. In this study, we synthesized the methoxy-substituted derivative H2LOMe and its homoleptic FeIII and AlIII complexes, 1-OMe and 2-OMe, along with the homoleptic FeIII complex with the methyl-substituted azp ligands, 1-Me. We fully characterized H2LOMe using the 1H and 13C NMR spectra and single-crystal X-ray structure analysis. We investigated the crystal structures and magnetic properties of the FeIII complexes 1-OMe and 1-Me. The FeIII complex 1-OMe showed an incomplete gradual SCO transition, which is confirmed by the temperature variations in crystal structures. We also investigated the electrochemical properties of the FeIII complexes 1-OMe and 1-Me, as well as the AlIII complex 2-OMe. The methoxy-substituted complexes 1-OMe and 2-OMe exhibited reversible oxidation waves, whereas the methyl-substituted complex 1-Me showed partially reversible oxidation waves. On the other hand, the FeIII complexes 1-OMe and 1-Me exhibited a reversible reduction wave at similar potentials, whereas the AlIII complex 2-OMe showed an irreversible reduction wave at the substitution-dependent potentials. The density functional theory (DFT) calculations revealed that all the oxidation waves in the FeIII and AlIII complexes are ascribed to the ligand center, while the reduction wave for the FeIII complexes is ascribed to the metal center, and that for the AlIII complexes is ascribed to the ligand center. Furthermore, the resonance effect from the introduction of a methoxy group may contribute to the stability of the oxidized species of metal complexes.

2. Results and Discussion

2.1. Synthesis and Characterization of H2LOMe

2.1.1. Synthesis of H2LOMe

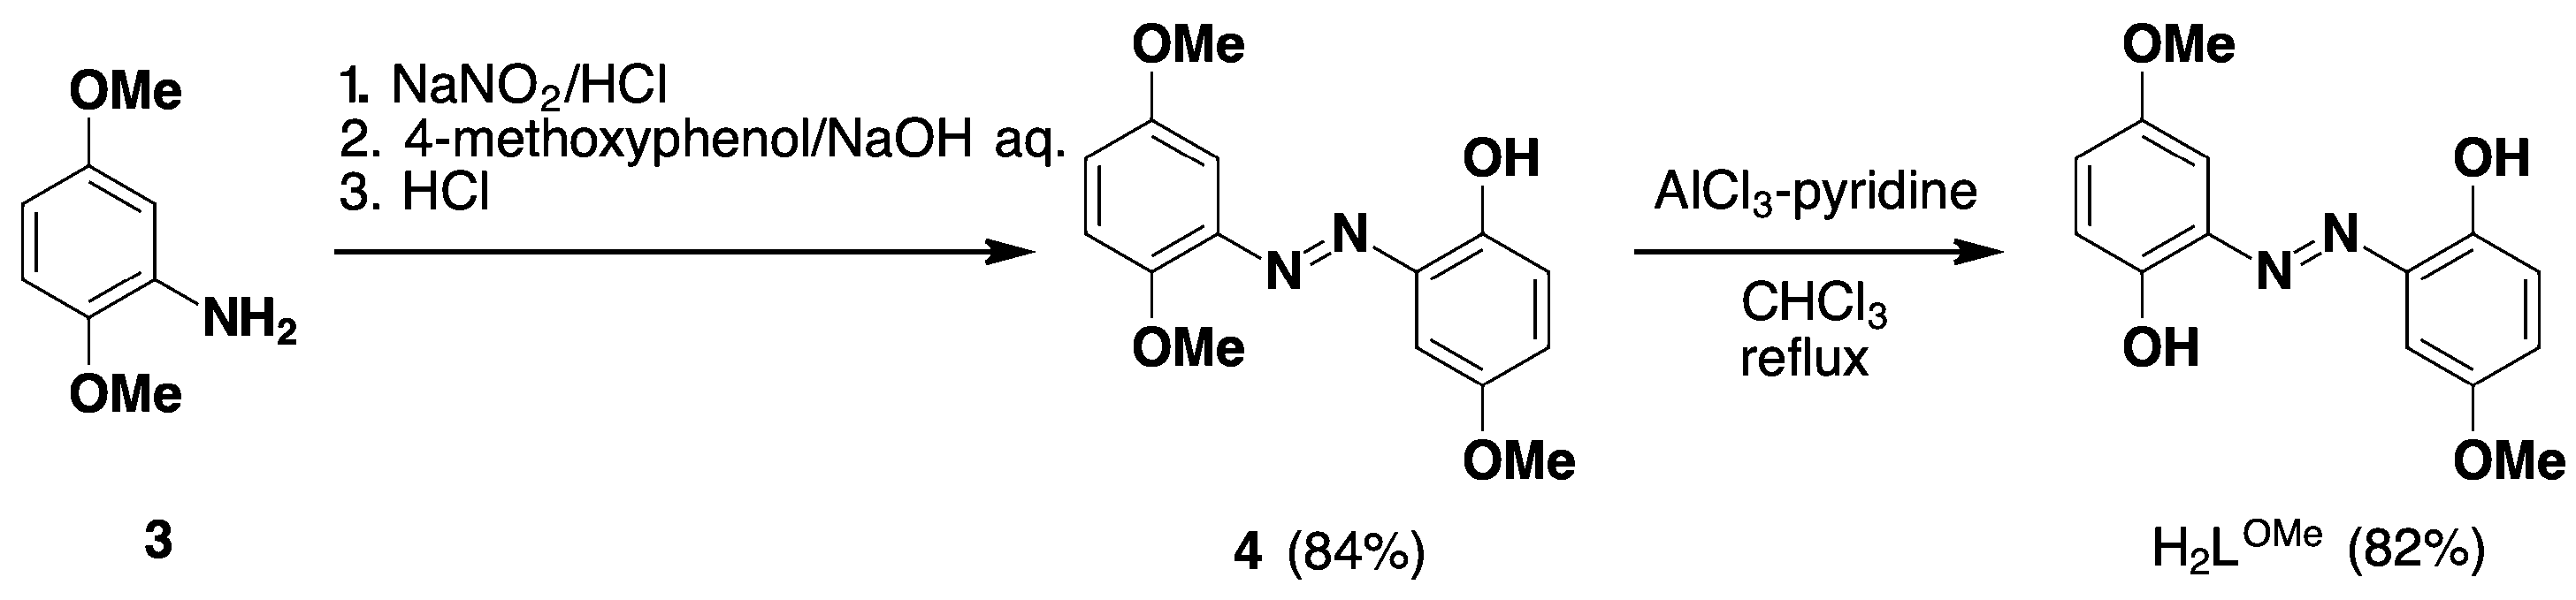
The azp derivative H2LOMe was synthesized according to the method described in the literature [42]. The synthesis scheme is shown in Scheme 1. The azo coupling reaction of the diazonium cation obtained from 2,5-dimethoxyaniline 3 with 4-methoxyphenol gave azobenzene derivative 4 in good yield. The selective demethylation at the ortho position of the azo group in 4 occurred by the reaction with AlCl3–pyridine, affording the target 5,5′-dimethoxy derivative H2LOMe in high yield.

2.1.2. NMR Spectra of 4 and Ligand H2LOMe

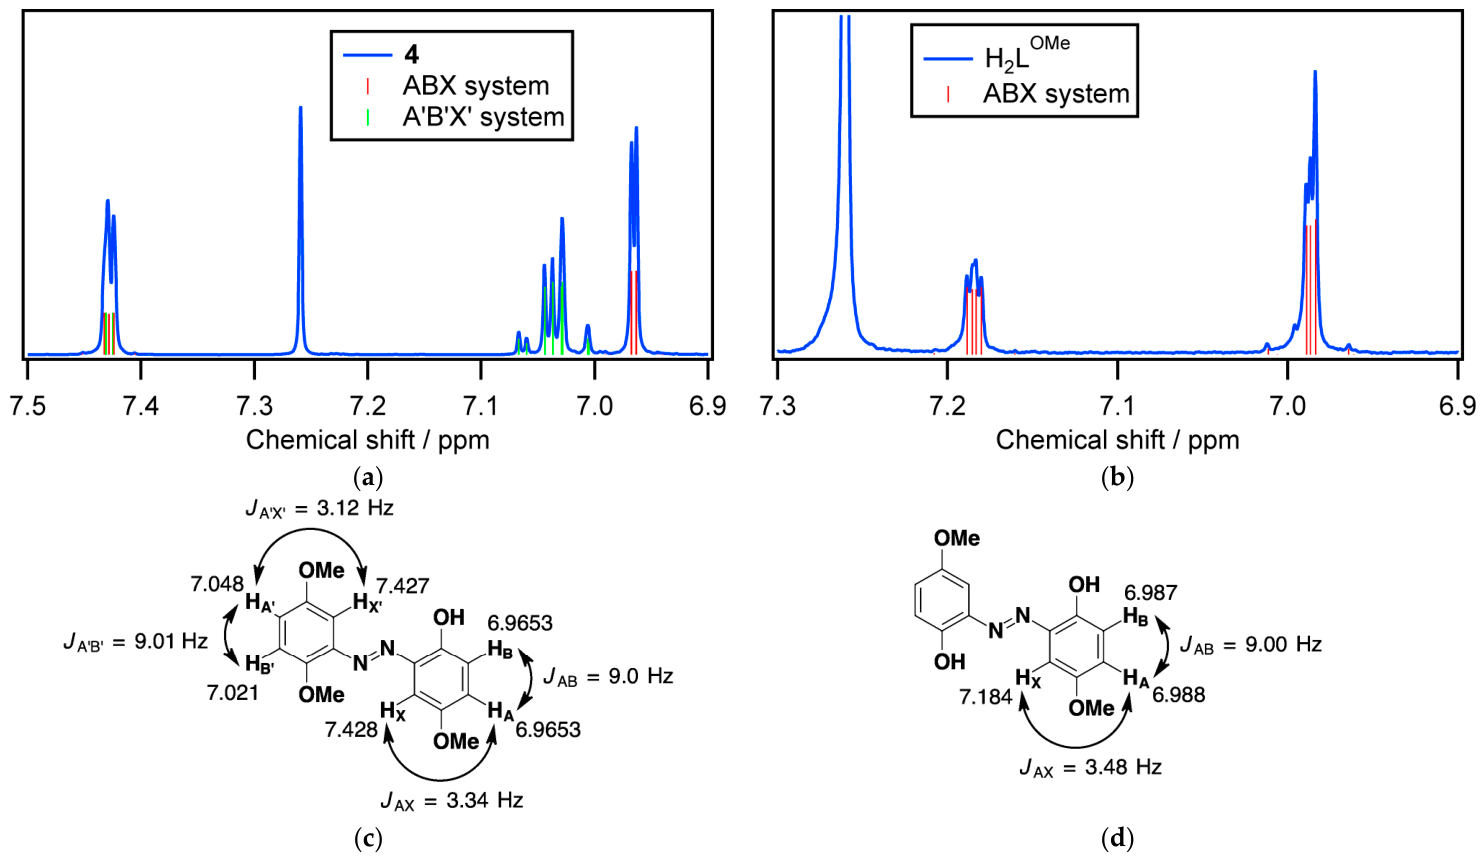
The 1H NMR spectra for 4 and H2LOMe are shown in Figure 2a and Figure S1, and Figure 2b and Figure S3, respectively. The spectrum of H2LOMe in the aromatic region seems to be two anomalous double-doublet signals with very small coupling constants. On the other hand, the spectrum of 4 shows very complex signals. Assuming the number of methyl protons in one methoxy group is set to 3, the integrations of each region are 2, 2, and 2 protons, respectively, which are consistent with the number of aromatic protons in 4. These anomalous spectra can be observed when the frequency difference between two signals is close to their coupling constant. In the present case, these patterns are known as an ABX system [44]. By performing a least-squares fitting of the ABX system using the observed frequencies of each signal for 4 and H2LOMe, we can obtain reasonable chemical shifts, relative intensities, and coupling constants for 4 and H2LOMe (Figure 2c,d, and Tables S1 and S2).
The 13C NMR spectra for 4 and H2LOMe are shown in Figures S2 and S4, respectively. The spectrum of H2LOMe consists of one and six signals in the alkyl and aromatic regions, respectively, whereas that of 4 consists of three and twelve signals in the alkyl and aromatic regions, respectively. The numbers of signals for each compound are in good agreement with those expected by the chemical structure.

2.1.3. Crystal Structure of H2LOMe

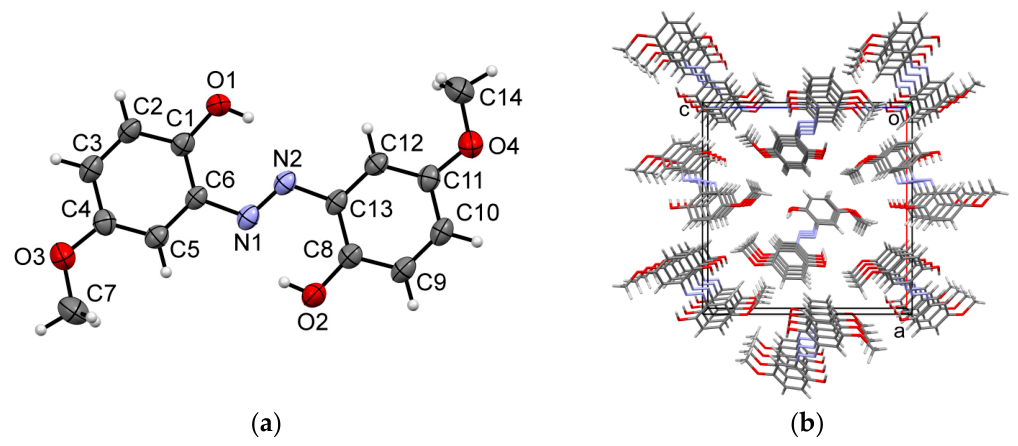
In order to confirm the molecular structure of H2LOMe, single-crystal X-ray structure analysis was performed. The crystallographic data are listed in Table S3. The crystal structure of H2LOMe belongs to orthorhombic Pca21. The asymmetric unit of H2LOMe contains one molecule. Figure 3a shows the asymmetric unit at 290 K. The C-C bond lengths on the benzene rings are 1.370(6)–1.414(6) Å, and no remarkable bond alternation is observed. The N-N bond length is 1.278(2) Å, which is typical of the N=N double bond. The intramolecular distances of O1···N2 and O2···N1 are 2.600(4) and 2.585(5) Å, respectively, indicating the existence of strong hydrogen bonds. Since the dihedral angle between the two benzene rings is 1.1(2) °, the molecule has an almost planar structure.
The H2LOMe molecules are uniformly stacked in a face-to-face manner, forming one-dimensional columns along the b axis (Figure 3b). From the overlap of the two molecules, the azo group is in proximity to the phenyl ring (Figure S5). The intermolecular π-plane distances between the benzene rings in the one-dimensional column are 3.296(4) and 3.266(4) Å, and notable short intermolecular distances between C3 and C6, C6 and C13, and C13 and C10 are 3.323(5), 3.312(3), and 3.299(5) Å, respectively, which are shorter than the sum of van der Waals radii of carbon (1.70 Å) [45], indicative of the existence of strong π-stacking interactions. There are weak C-H···π interactions between one-dimensional columns along the a axis, whereas there is no short contact between one-dimensional columns along the c axis.

2.2. Synthesis and Characterization of MIII Complexes (MIII = FeIII and AlIII) with Electron-Donating Ligands

2.2.1. Synthesis of MIII Complexes with H2LOMe and H2LMe (MIII = FeIII and AlIII)

The homoleptic FeIII and AlIII complexes were prepared by the reaction of corresponding metal salts with 2 equivalents of azp ligands LOMe or LMe, followed by the addition of corresponding onium bromides. Recrystallization in appropriate solvents gave the homoleptic FeIII complexes 1-OMe and 1-Me as black platelets, and the AlIII complex 2-OMe as black rods, respectively. The single-crystal X-ray structure analysis described below revealed that 1-Me and 2-OMe were obtained as solvate crystals. The compositions of 1-OMe, 1-Me, and 2-OMe were also confirmed by elemental analysis. On the other hand, the thermogravimetry measurements of the air-dried samples 1-Me and 2-OMe suggested that desolvation occurred even at room temperature (Figure S6). In contrast to the 1H NMR spectra for 4 and H2LOMe, 2-OMe gave well-defined signals attributed to the two trisubstituted benzenes, with the signals of the tetraphenylphosphonium ion in the aromatic region (Figure S7).

2.2.2. Magnetic Susceptibility of the FeIII Complexes 1-OMe and 1-Me

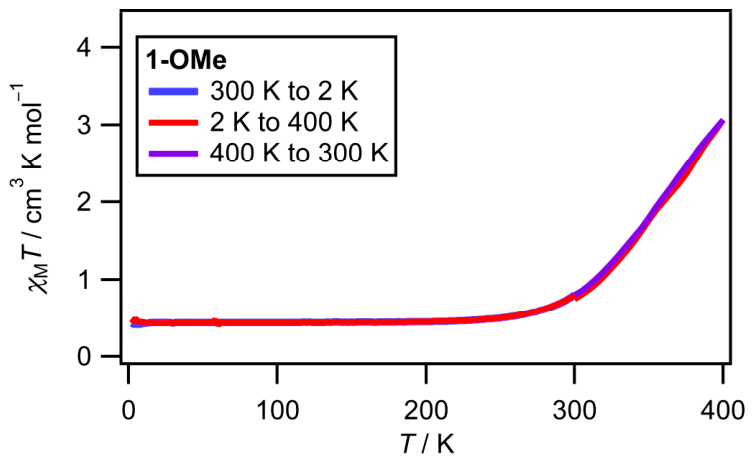
The temperature variation in magnetic susceptibility for 1-OMe is shown in Figure 4. The χMT value for 1-OMe at 90 K is 0.45 cm3 K mol−1, indicative of the LS state. On heating, the χMT value increases around 250 K. Then, the χMT values gradually increase and reach 3.12 cm3 K mol−1 at 400 K. Since the spin-only χMT value for the HS FeIII ion is 4.375 cm3 K mol−1, 1-OMe exhibits an incomplete gradual SCO conversion. No thermal hysteresis is observed for 1-OMe. As the temperature dependence of the magnetic susceptibility of 1-OMe was fitted using the modified regular-solution model [46], the best-fit parameters were ΔH = 26.1 kJ mol−1, ΔS = 70.0 J K−1 mol−1, and Γ = 0.6 kJ mol−1. The fitted and measured curves are shown in Figure S8. Based on these thermodynamic parameters, the transition temperature T1/2 is 372 K. The thermodynamic parameters closely resemble those of 1-H [33]. Note that there is almost no cooperative behavior.
The temperature variation in magnetic susceptibility for the air-dried sample of 1-Me is shown in Figure S9. The χMT value for 1-Me at 300 K is 2.62 cm3 K mol−1, which is an intermediate value between the LS and HS states. This is inconsistent with the crystal structure described below, indicating that 1-Me at 296 K is in the HS state. The elemental analysis of the air-dried sample revealed that the solvent ratio was 0.5 molecule of acetone. Thus, desolvation could induce a change in the spin state. In the subsequent temperature scan, no reversible changes were observed. This suggests that the structure changes as the solvent is removed. Although single-crystal structure analysis is not possible, these results suggest that the desolvated sample of 1-Me may show possible SCO. Further experiments using a different recrystallization solvent or a different counter cation are required to confirm that the [Fe(LMe)2] anion exhibits SCO.

2.2.3. Single-Crystal Structure Analysis

The single-crystal X-ray structure analysis was performed for 1-OMe, 1-Me, and 2-OMe. Since 1-OMe exhibited the SCO transition, temperature variations in crystal structure for 1-OMe were carried out. All the crystallographic data are listed in Table S4.
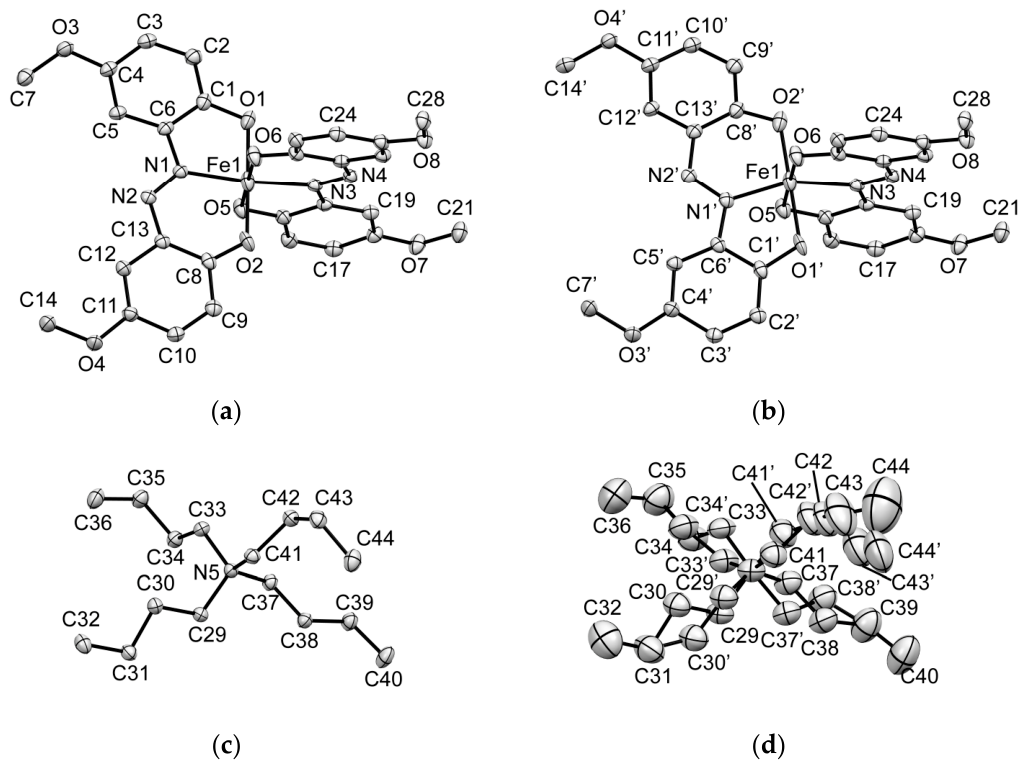
The crystal structures of 1-OMe at all temperatures belong to isostructural monoclinic P21/c, indicating no structural phase transition accompanying the SCO transition. The asymmetric unit of 1-OMe contains one TBA cation and one [FeIII(LOMe)2] anion. Figure 5a–c show the asymmetric unit of 1-OMe at 90 K. The two ligands in the [FeIII(LOMe)2] anion exhibit an orientation disorder. We hereafter refer to the major-oriented ligands with C1 to C14 and C15 to C28 atoms in 1-OMe at 90 K as ligands L1 and L2, respectively. The ligands with the opposite minor-oriented ligands and their atoms are labeled with a prime symbol, such as L1′ and C1′. For the TBA cation, the butyl-group orientation is ordered at 90 K (Figure 5c), whereas positional disorder of the butyl groups is observed at 296 and 400 K (Figure 5d). The coordination bond lengths, distortion parameters of the coordination octahedron, and occupancies of L1, L2, and major-positioned cation are listed in Table 1. The coordination bond lengths and distortion parameters of 1-OMe at 90 and 296 K are very similar to those of 1-H in the LS state [33]. On the other hand, most coordination bond lengths at 296 K are slightly longer than those at 90 K, which is consistent with the observation of a slight increase in the χMT value as described in the magnetic susceptibility section. The coordination bond lengths of 1-OMe at 400 K are longer than those at 90 and 293 K, while they are shorter than those of 1-H in the HS state [33]. The distortion parameters at 400 K are also smaller than those in the HS state. These are in good agreement with the occurrence of an incomplete SCO transition at 400 K. Note that the occupancies of both ligands L1 and L2 in 1-OMe are definitely changed from 90 to 373 K. These observations are reminiscent of a SCO-induced pedal-like rotational motion of the azp ligand [35,38].
The crystal structure of 1-Me belongs to monoclinic C2/c. The asymmetric unit of 1-Me contains half of a TBA cation, half of the [FeIII(LMe)2] anion, and two halves of an acetone molecule. The Fe1 in the complex anion and N3 atoms in the TBA cation are on the two-fold axis. The alkyl chains in the TBA cation show an orientational disorder, whose occupancy is almost 50% (Figure S10). The carbonyl group of one of the acetone molecules is also on the two-fold axis, whereas the other acetone molecule is close to the two-fold axis. Thus, occupancy of the latter acetone molecule is 50%. The coordination bond lengths and distortion parameters of 1-Me are very similar to those of the [FeIII(LH)2] anion in the HS state [33], suggesting the crystal of 1-Me was in the HS state. Since acetone molecules are present in a one-dimensional channel along the a axis, this is the reason why desolvation occurs even at room temperature.
The crystal structure of 2-OMe belongs to monoclinic P21/n. The asymmetric unit of 2-OMe contains one TPP cation, one [AlIII(LOMe)2] anion, one diethyl ether molecule, and one methanol molecule. The ligand L1 exhibits an orientational disorder, whereas the orientation of the ligand L2 is ordered (Figure S11). The coordination bond lengths are quite similar to those in the AlIII complexes with the azp derivatives reported in the literature [42], and are shorter than those of the FeIII complex due to the smaller effective ion radii of the Al ion [47].

2.2.4. Cyclic Voltammetry

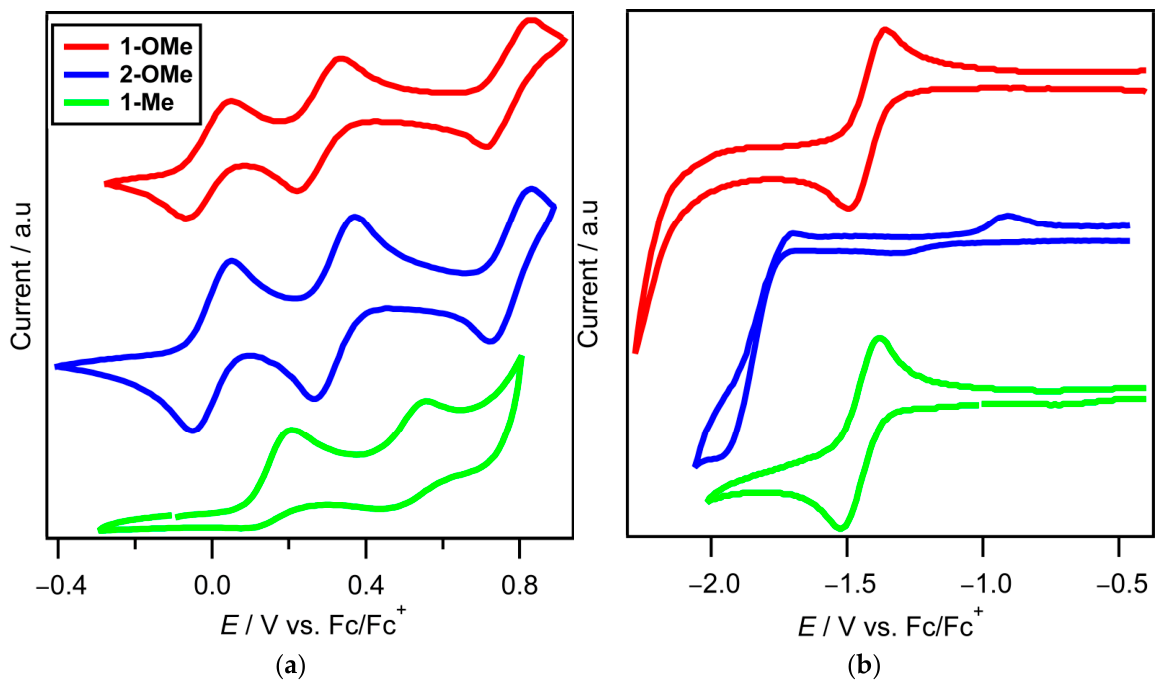
To investigate the redox properties of 1-OMe, 1-Me, and 2-OMe, the cyclic voltammograms were recorded at a scan rate of 100 mV s−1 in a 0.1 M Bu4NPF6 dichloromethane solution. The voltammograms for all the complexes are shown in Figure 6 and Figure S12. The redox potentials are summarized in Table 2.
For the methoxy-substituted complexes 1-OMe and 2-OMe, each showed two well-defined reversible waves with oxidation and re-reduction peaks, as well as a slightly ill-defined reversible wave (Figure 6a). As is also seen in the figure, the methyl-substituted complex 1-Me showed two couples of oxidation and re-reduction waves similar to those of the AlIII complex with methyl substituents 2-Me [42]. However, their re-reduction peaks were somewhat smaller than the corresponding oxidation peaks. This indicates that the oxidation forms of the methyl-substituted complexes are relatively unstable. Although additional oxidation waves in 1-OMe and 2-OMe were observed in the further anodic scan, the re-reduction waves coupled to the oxidation waves for 1-OMe and 2-OMe became small after the anodic scan exceeded the third oxidation wave (Figure S12). The oxidation potentials of the first to third oxidation waves in 1-OMe and 2-OMe are almost the same values, indicating that the oxidations are ligand-centered and have no significant effect on the central metal ions. A similar observation applies to the oxidation potentials of 1-Me and 2-Me. Therefore, the Fe ion remains trivalent during these oxidation processes. The ligand-centered oxidations of the azp complexes are also supported by a distinct substituent effect on the oxidation potentials between the methoxy and methyl substituents.
To determine the number of electrons responsible for the redox processes, the digital simulation analysis of cyclic voltammograms [48,49] was performed for two well-defined redox waves of 1-OMe and 2-OMe. In this simulation, it has been postulated that the redox mechanism for the voltammetric behaviors of interest can be explained in terms of a two-step electron transfer mechanism:
R n 1 e   O 1
O 1 n 2 e   O 2
where R is the original reduced form of the complex, O1 and O2 are the electrochemically produced one- and two-step oxidized species, respectively, and n1 and n2 are the number of electrons for each oxidation step. In this study, we have used conventional, i.e., Butler–Volmer-type kinetic equations for describing the forward rate constant ( k f 1 or k f 2 ) and backward rate constant ( k b 1 or k b 2 ) for the respective redox reactions:
k f 1 = k 1 ° exp 1 α 1 n 1 F R T ( E E 1 ) ,   k b 1 = k 1 ° exp α 1 n 1 F R T ( E E 1 )
k f 2 = k 2 ° exp 1 α 2 n 2 F R T ( E E 2 ) ,   k b 2 = k 2 ° exp α 2 n 2 F R T ( E E 2 )
where k 1 or k 2 is the standard rate constant, α 1 or α 2 is the transfer coefficient, E 1 or E 2 is the formal potential, and R, T, and F have their usual meanings. The observed and simulated voltammograms are shown in Figure S13, and the simulated parameters are listed in Table S5. It has thus been revealed that the two successive waves observed for 1-OMe and 2-OMe can be thoroughly elucidated in terms of a simple reversible electron transfer by one-electron steps (n1 = n2 = 1). Then, the two oxidation species, [MIII(LOMe)2]0 and [MIII(LOMe)2]+, have been shown to be sufficiently stable. It is known that the introduction of bulky substituents improves the stability of oxidation species by kinetic control. On the other hand, since the methoxy group is not bulky, we will investigate why the oxidation species are stabilized with theoretical calculations below.
In view of exploring the reductive behaviors of the FeIII complexes 1-OMe and 1-Me, and the AlIII complex 2-OMe, the potential scan was started in the cathodic direction as shown in Figure 6b. The FeIII complexes 1-OMe and 1-Me showed one well-defined reversible wave with reduction and re-oxidation peaks. The first reduction waves for 1-OMe and 1-Me appeared at a similar potential around −1.5 V, and thus, there is no significant substituent effect on the first reduction potentials for the FeIII complexes. Regarding 2-OMe, the voltammogram was ill-defined, probably because of the instability of the reduced species of the complex. When the reduction peak potential of the AlIII complex 2-OMe is compared with those of 2-Me and 2-Cl [42], a distinct substitution effect is observed, which may exhibit a ligand-centered reduction. These observations suggest that the first reduction wave in the FeIII complexes 1-OMe and 1-Me is metal-centered.

2.2.5. Density Functional Theory Calculations

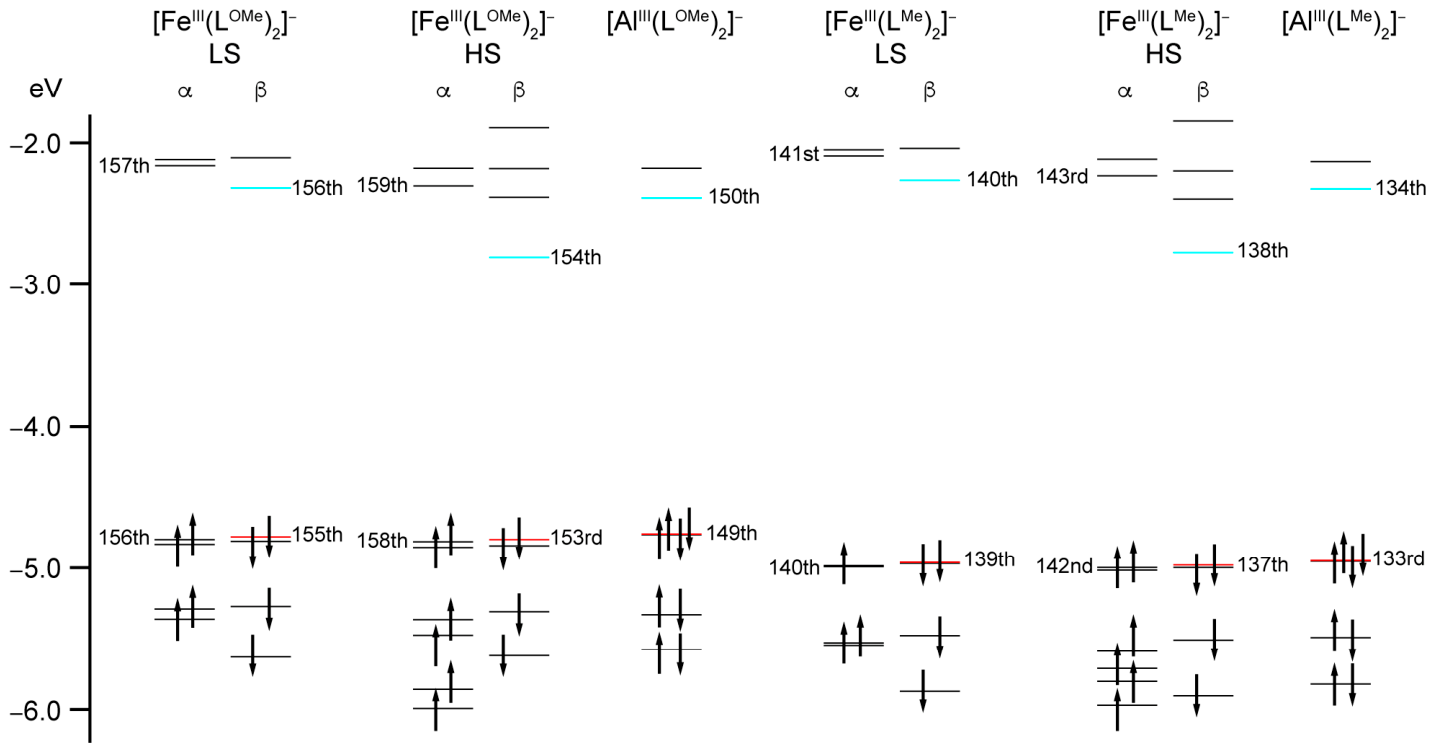
To give an insight into the origin of the first oxidation and reduction waves, the density functional theory (DFT) calculations were carried out for the [FeIII(LR)2] anions in the LS and HS states and the [AlIII(LR)2] anions. All the molecules in CH2Cl2 could be fully optimized at the B3LYP/6-311+G(d,p) level of theory using the polarizable continuum model (PCM) [50]. The energy level diagram near the frontier molecular orbitals is shown in Figure 7, and their energies are listed in Table 3.
DFT calculations revealed that for the [FeIII(LR)2] anions, the highest occupied molecular orbital (HOMO) was the β spin orbital, and the lowest unoccupied molecular orbital (LUMO) was also the β spin orbital. These will henceforth be referred to as β-HOMO and β-LUMO.
The β-HOMO energy levels of the [FeIII(LR)2] anions are similar to the HOMO energy levels of the [AlIII(LR)2] anions with identical ligands. The difference in the β-HOMO energy level between the methoxy and methyl substituents is considered a substituent effect. Indeed, the first oxidation potentials in both FeIII and AlIII complexes follow this trend.
The β-LUMO energy levels for the [FeIII(LR)2] anions vary significantly depending on the spin states: the β-LUMO energy levels of the [FeIII(LR)2] anions in the LS state are close to the LUMO energy levels of the [AlIII(LR)2] anions with identical ligands. On the other hand, the β-LUMO energy levels of the [FeIII(LR)2] anions in the HS state are significantly lower than those in the LS state. Since the FeIII complexes 1-OMe and 1-Me are more easily reduced than the AlIII complexes 2-OMe and 2-Me [42] with identical ligands, the [FeIII(LR)2] anions in solution should be in the HS state. To confirm the assumption, the magnetic susceptibility of the CDCl3 solution of the FeIII complexes was determined using the Evans method [51]. The χMT products of 1-OMe and 1-Me are 4.28 and 4.03 cm3 K mol−1, respectively. These values support each FeIII complex solution in the HS state, because the spin-only χMT value for the FeIII complex in the HS state is 4.38 cm3 K mol−1.
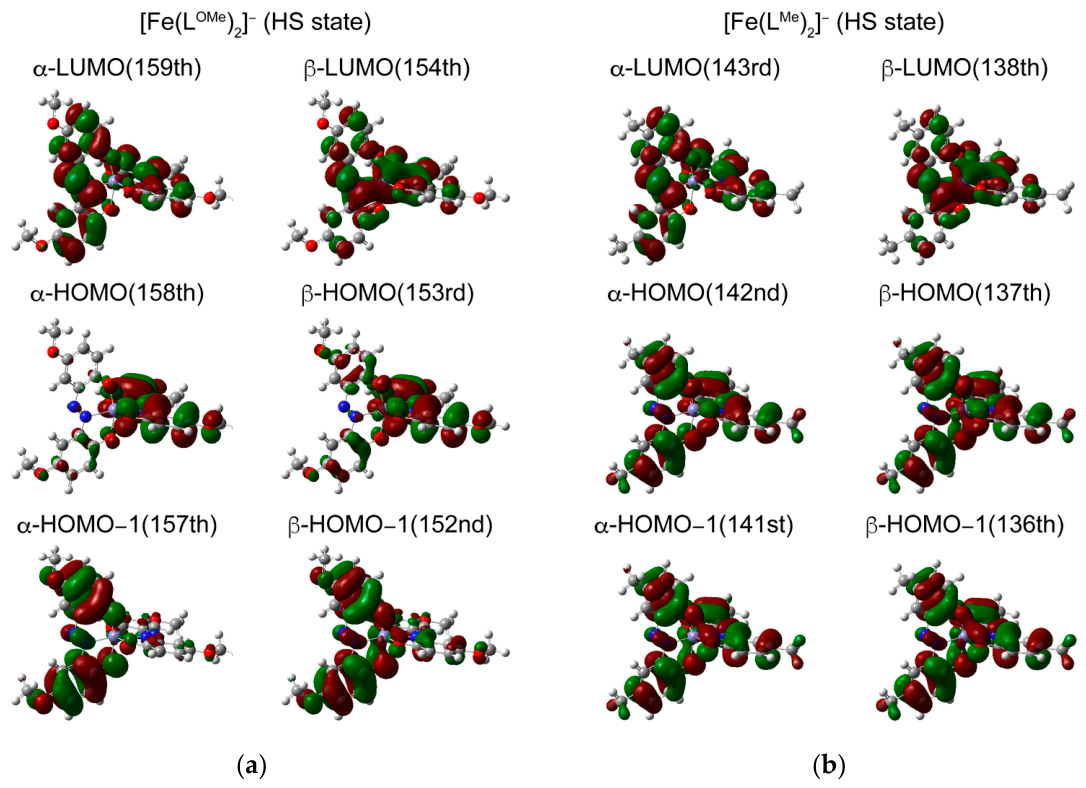
The MO surfaces near the frontier orbitals of the [FeIII(LOMe)2] and [FeIII(LMe)2] anions in the HS state are shown in Figure 8. The MO coefficients of β-HOMO for the FeIII complexes are relatively large on the ligands. Therefore, the first oxidation wave involves oxidation at the ligand center. On the other hand, the MO coefficients of β-LUMO for the FeIII complexes are relatively large on the FeIII ion, whereas those of LUMO for the AlIII complexes are nearly absent on the AlIII ion [42]. Therefore, the first reduction wave in the FeIII complexes originates from the metal center.
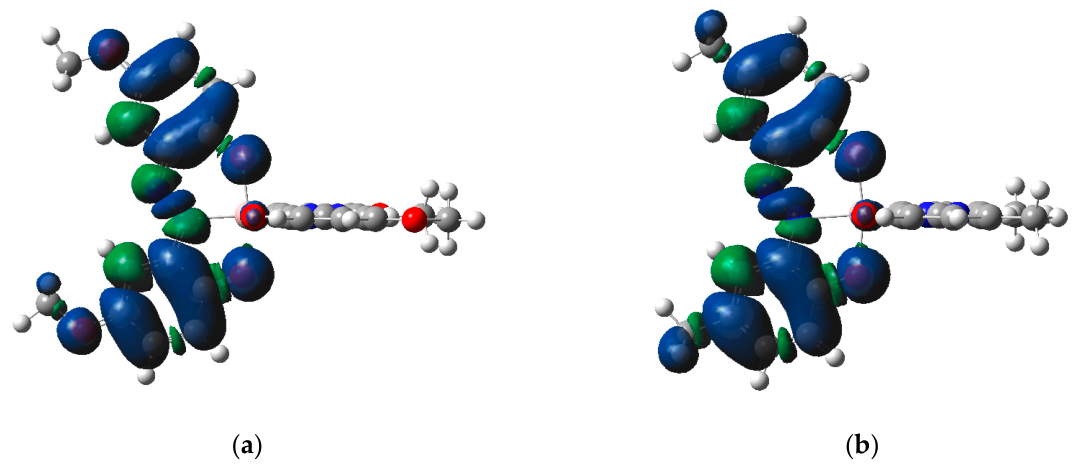
To investigate a reason to stabilize the one-electron oxidation species of the methoxy complexes, DFT calculations were carried out for the neutral one-electron oxidized [AlIII(LOMe)2] and [AlIII(LMe)2] molecules in CH2Cl2. The spin density surfaces of the one-electron oxidized neutral [AlIII(LOMe)2] molecule along with the neutral [AlIII(LMe)2] molecule [42] are shown in Figure 9. The difference in spin density between the [AlIII(LOMe)2] and [AlIII(LMe)2] molecules is a large spin density distribution on the oxygen atom in the methoxy substituent. Accompanying this change, the spin density on the entirety of the phenolate moiety has relatively decreased. On the other hand, the spin density of the [AlIII(LMe)2] molecule is distributed mainly on the hydrogen atom of the methyl substituent, suggesting that the [AlIII(LMe)2] molecule may readily induce intermolecular radical reactions. Therefore, stabilization of the radical species of the methoxy-substituted complexes may originate from the resonance effect of the methoxy substituent.

3. Discussion

We summarize the results obtained so far. The FeIII complexes containing the azp ligands with the methoxy and methyl substituents exhibit SCO in the solid state. These results indicate that the introduction of electron-donating groups into azp ligands can also afford ligand fields that can induce SCO. On the other hand, the FeIII complexes in solution are in the HS state at room temperature.
The cyclic voltammogram and its digital simulation for the FeIII complex with the methoxy-substituted azp ligands reveal that it undergoes a reversible one-electron reduction and a reversible two-step one-electron oxidation. The reversible one-electron reduction in the FeIII complexes with the methoxy- and methyl-substituted azp ligands shows no significant substituent effects, in contrast to the distinct substitution effect on the AlIII complexes. Thus, the one-electron reduction in the FeIII complexes is metal-centered.
Note that the DFT calculations of the FeIII complexes reveal that the differences in spin state strongly influence the one-electron reduction behavior. When considering the electrochemical redox reactions of the [FeIII(LR)2] anions in solution at room temperature, it is necessary to discuss the ligand field in each redox species. In general, FeII complexes exhibit a weaker ligand field than FeIII complexes. In other words, if a FeIII complex with ligands is in the HS state, it is reasonable to assume that the FeII complex with the identical ligands is also in the HS state. This situation applies to the reduction process from the [FeIII(LR)2] anions in the HS state to the [FeII(LR)2]2− dianions, suggesting that the [FeII(LR)2]2− dianions are in the HS state.
In the two-step one-electron oxidation process, the ligand substitution effect and DFT calculations indicate that the two-step one-electron oxidation occurs at the HOMO of ligands. Thus, it is presumed that the effect on the ligand field is due solely to the charge of a ligand. However, the spin states of the oxidized FeIII ion remain unclear and require future investigation. Note that the oxidized species of the methoxy-substituted FeIII and AlIII complexes are more stable due to the resonance effect of the methoxy group compared to the AlIII complexes with the other azp ligand derivatives [42].
Based on the above considerations, the electrochemical redox process in this study can be represented by the following electrochemical reaction equilibria:
Fe HS II L 2 2 2 e + e Fe HS III L 2 2 e + e Fe III L 2 L · 0 e + e Fe III L · 2 +
Al III L 3 · L 2 2 e + e Al III L 2 2 e + e Al III L 2 L · 0 e + e Al III L · 2 +
where L3−·, L2−, and L−· are the formal charges and spin states of ligands for tri-anion radical, dianion, and anion radical, respectively. Note that the possibility arises that the neutral trivalent metal complex, M III L 2 L · 0 , may exhibit a mixed-valence (MV) state due to two ligands with different valences. The MV state is responsible for various chemical and physical properties such as conductivity, magnetism, dielectrics, optics, catalysis, and so on; therefore, the substitution of metal ions and/or ligands is expected to lead to diverse functionalities among SCO, VT, and MV.

4. Materials and Methods

All the chemicals were purchased and used without further purification. 1,2-bis(5-methyl-2-hydroxyphenyl)diazene (H2LMe) was prepared according to the literature [42]. 1H and 13C NMR spectra were recorded on a Bruker Avance 400 spectrometer. Elemental analyses were performed on a Yanaco CHN corder MT-5 elemental analyzer. Thermogravimetry was performed using a Rigaku TG8120 simultaneous thermal analyzer.

4.1. Synthesis of Ligand

4.1.1. 1-(2-Hydroxy-5-methoxyphenyl)-2-(2,5-dimethoxyphenyl)diazene (4)

A solution of 2,5-dimethoxyaniline 3 (5.00 g, 32.6 mmol) in 25 mL of water, 25 mL of methanol, and 8.0 mL of conc. HCl was stirred and cooled to 0 °C. A solution of NaNO2 (2.48 g, 36.0 mmol) was added dropwise to the solution in 7.0 mL of water. The mixture became a dark red solution and was kept below 5 °C. After confirming the existence of HNO2 using a KI-starch paper, the solution was quickly transferred to a solution of 4-methoxyphenol (4.05 g, 32.6 mmol) in 25 mL of an aqueous solution of NaOH (2.13 g, 53.2 mmol) under N2 atmosphere. The reaction mixture was stirred for 2 h below 5 °C and then warmed to room temperature. To this suspension, we added 2 mL of 35% HCl and then extracted with ethyl acetate five times. The solution was dried over MgSO4 and evaporated. Silica gel chromatography using CH2Cl2 as an eluent gave 4 as a brown powder (7.90 g, 84%).
1H NMR (400 MHz, CDCl3) δ 13.30 (s, 1H), 7.43 (d, J = 3.34 Hz, HX), 7.43 (d, J = 3.12 Hz, HX′), 7.05 (dd, J = 9.01, 3.12 Hz, HA′), 7.02 (d, J = 9.01 Hz, HB′), 6.97 (dd, J = 9.0, 3.34 Hz, HA), 6.97 (d, J = 9.0 Hz, HB), 3.97 (s, 3H), 3.87 (s, 3H), and 3.85 (s, 3H) ppm. 13C NMR (100 MHz, CDCl3) δ 154.14, 152.64, 151.05, 148.01, 138.90, 137.64, 121.41, 119.93, 119.18, 114.35, 113.62, 99.41, 56.51, 55.92, and 55.87 ppm. Anal. Calcd. for C15H16N2O4: C, 62.49; H, 5.59; N, 9.72%. Found: C, 62.30; H, 5.58; N, 9.74%.

4.1.2. 1,2-bis(2-Hydroxy-5-methoxyphenyl)diazene (H2LOMe)

To a stirred solution of 4 (7.90 g, 27.4 mmol) in 160 mL of chloroform under N2 atmosphere, we added portionwise a finely powdered AlCl3 (14.7 g, 110 mmol). The resulting dark red solution was warmed to 30 °C and then 57 mL of pyridine was added. The solution became purple. The mixture was heated to reflux for 2 h and then cooled to room temperature. After reducing the volume of the solution to about a quarter of its original volume using an evaporator, it was acidified by adding a mixture of 50 mL of 36% HCl and 75 g of ice. The mixture was heated to reflux for 2 h. The resulting precipitate was filtered and dried in vacuo. Recrystallization from ethyl acetate gave H2LOMe as reddish-purple needles (6.21 g, 83%).
1H NMR (400 MHz, CDCl3) δ 11.93 (s, 2H), 7.18 (d, J = 3.48 Hz, 2H), 6.99 (dd, J = 9.00, 3.48 Hz, 2H), 6.99 (d, J = 9.00 Hz, 2H), and 3.86 (s, 6H) ppm. 13C NMR (100 MHz, CDCl3) δ 153.13, 147.31, 134.72, 121.52, 119.29, 112.99, and 56.01 ppm. Anal. Calcd. for C14H14N2O4: C, 61.31; H, 5.15; N, 10.21%. Found: C, 61.26; H, 5.13; N, 10.21%.

4.2. Synthesis of Trivalent Metal Complexes

4.2.1. TBA[FeIII(LOMe)2] (1-OMe)

To a suspension of H2LOMe (200 mg, 0.730 mmol) in 12 mL of methanol under N2 atmosphere, we added a 28% methanol solution of sodium methoxide (0.9 mL, 4.41 mmol) dropwise. The suspension was heated to reflux and stirred for 30 min, to become a dark red solution. To this solution was added a solution of FeCl3 (59 mg, 0.365 mmol) in 5 mL of methanol. Then the solution was heated to reflux for 1.5 h. To the solution, we added tetrabutylammonium bromide (351 mg, 1.09 mmol) in 18 mL of methanol. The solution was heated again and stirred for 30 min, then cooled to room temperature. After evaporating the solution to a few mL, water was added. The precipitate was filtered and washed with water and dried in vacuo. Recrystallization from acetonitrile–diethyl ether gave 1-OMe as black platelets (276 mg, 89%).
Anal. Calcd. for C44H60FeN5O8 (1-OMe): C, 62.70; H, 7.18; N, 8.31%. Found: C, 62.57; H, 7.21; N, 8.45%.

4.2.2. TBA[FeIII(LMe)2]·2acetone (1-Me·2acetone)

To a suspension of H2LMe (500 mg, 2.06 mmol) in 13 mL of methanol under N2 atmosphere, we added a 28% methanol solution of sodium methoxide (0.9 mL, 4.56 mmol) dropwise. The suspension was heated to reflux and stirred for 30 min, to become a dark red solution. To this solution was added a solution of FeCl3 (167 mg, 1.03 mmol) in 5 mL of methanol. Then the solution was heated to reflux for 1.5 h. To the solution, we added tetrabutylammonium bromide (832 mg, 2.58 mmol) in 10 mL of methanol. The solution was heated again and stirred for 30 min, then cooled to room temperature. After evaporating the solution to a few mL, water was added. The precipitate was filtered and washed with water and dried in vacuo. Recrystallization from acetone–hexane gave 1-Me as black platelets (612 mg, 66%).
Anal. Calcd. for C50H72FeN5O6 (1-Me·2acetone): C, 67.10; H, 8.11; N, 7.83%. Found: C, 67.04; H, 8.12; N, 7.98%.
The formula of the air-dried sample for magnetic susceptibility measurement was also confirmed by elemental analysis.
Anal. Calcd. for C45.5H63FeN5O4.5 (1-Me·0.5acetone): C, 67.65; H, 7.86; N, 8.67%. Found: C, 67.28; H, 7.76; N, 8.92%.

4.2.3. TPP[AlIII(LOMe)2]·Et2O·CH3OH (2-OMe·Et2O·CH3OH)

To a suspension of H2LOMe (200 mg, 0.730 mmol) in 10 mL of methanol under N2 atmosphere, we added a 28% methanol solution of sodium methoxide (0.9 mL, 4.41 mmol) dropwise. The suspension was heated to reflux and stirred for 30 min, to become a dark red solution. To this solution was added a solution of Al(NO3)3·9H2O (137 mg, 0.365 mmol) in 5 mL of methanol. Then the solution was heated to reflux for 2 h. To the solution, we added tetraphenylphosphonium bromide (457 mg, 1.09 mmol) in 3.0 mL of methanol. The solution was heated again and stirred for 1 h, then cooled to room temperature. After evaporating the solution to a few mL, water was added. The precipitate was filtered and washed with water and dried in vacuo. Recrystallization from methanol–diethyl ether gave 2-OMe as black rod-shaped crystals (302 mg, 81%). The elemental analysis was performed using a completely desolvated sample.
1H NMR (400 MHz, CDCl3) δ 7.79–7.75 (m, 4H), 7.66–7.61 (m, 8H), 7.48–7.43 (m, 8H), 7.23 (d, J = 3.2 Hz, 2H), 7.04 (d, J = 3.3 Hz, 2H), 6.57 (dd, J = 9.0, 3.1 Hz, 2H), 6.55 (dd, J = 9.1, 3.3 Hz, 2H), 6.35 (d, J = 9.0 Hz, 2H), 6.27 (d, J = 9.2 Hz, 2H), 3.75 (s, 6H), and 3.74 (s, 6H) ppm. Anal. Calcd. for C52H44AlN4O8P (2-OMe): C, 68.57; H, 4.87; N, 6.15%. Found: C, 68.40; H, 4.81; N, 6.17%.

4.3. NMR Spectrum Fitting

Theoretical expressions for the energies (Hz) and relative intensities of the 14 allowed transitions in the ABX-spin system are described in the book [44]. The sum of the squares of the differences between the observed signal energies and the corresponding calculated energies is minimized using Excel’s Solver. Since the signals from the protons HX and HX′ in 4 overlap with each other, all the energies (νA′, νB′, νX′) and coupling constants (JA′B′, JA′X′, JB′X′) are fitted with 8 observed signal energies derived from the protons HA′ and HB′ in 4. On the other hand, the energy differences between the protons HA and HB for H2LOMe and 4 are too small and become zero after minimization. Thus, their energies νA and νB are fixed as the coefficient of determination would be as high as possible. The energy νX and coupling constants (JAB, JAX, JBX) are fitted with 6 observed signal energies in H2LOMe. Since the available signals derived from the protons HA and HB in 4 are limited, the energy (νX) and coupling constant (JAX) are fitted with 4 observed signal energies derived from the protons HA and HB in 4.

4.4. Magnetic Susceptibility Measurements

Variable-temperature direct-current magnetic susceptibilities of polycrystalline samples were measured on a Quantum Design MPMS-XL magnetometer under a field of 0.5 T in the temperature range of 2 or 5 to 400 K. The magnetic susceptibilities were corrected for diamagnetic contributions estimated by Pascal constants [52].
Magnetic susceptibilities of a ca. 0.47 mM chloroform-d solution of 1-OMe and 1-Me at room temperature were determined by the Evans method [51] using a Bruker Avance 400 spectrometer. The solution samples were prepared using a Wilmad® 517-COMPLETE coaxial tube.

4.5. Crystal Structure Determinations

A crystal was mounted on a MiTeGen MicroMountsTM. All data except H2LOMe were collected on a Bruker APEX II CCD area detector with monochromated Mo-Kα radiation generated by a Bruker Turbo X-ray Source coupled with Helios multilayer optics. A Nihon Thermal Engineering nitrogen gas flow temperature controller was used for the temperature variable measurements. All data collections except H2LOMe were performed using the APEX2 crystallographic software package (Bruker AXS). The APEX3 crystallographic software package (v2019.1-0, Bruker AXS) was used to determine the unit cell parameters. Data were integrated by using SAINT. Numerical absorption correction was applied by using SADABS. Diffraction data of H2LOMe were collected on a Rigaku XtaLAB Synergy X-ray diffractometer using multi-layer mirror monochromated Cu-Kα radiation generated by a PhotonJet microfocus X-ray source and a HyPix detector. The CrysAlisPro software (v1.171.43.144a, Rigaku Oxford Diffraction) was used to control the diffractometer and to integrate and correct the data. All the structures were solved by direct methods and refined by full-matrix least-squares methods based on F2 using the SHELXTL program (v2019/3). All non-hydrogen atoms were refined anisotropically. Hydrogen atoms were generated by calculation and refined using the riding model. CCDC 2575300–2575305 contains the supplementary crystallographic data for this paper. These data can be obtained free of charge via https://www.ccdc.cam.ac.uk/structures/? (accessed on 23 July 2026) (or from the CCDC, 12 Union Road, Cambridge CB2 1EZ, UK; Fax: +44 1223 336033; E-mail: deposit@ccdc.cam.ac.uk).

4.6. Cyclic Voltammetry

Cyclic voltammograms were recorded using an Ivium Technologies CompactStat.h standard electrochemical interface. A conventional three-electrode electrolytic cell was used. Platinum wires were used as the working and counter electrodes. A BAS RE-7 nonaqueous reference electrode (Ag/Ag+) was used as the reference electrode. A few mg of the complexes were dissolved in a 0.1 M Bu4NPF6 dichloromethane solution. Nitrogen gas was bubbled through the solution before the measurement. Ferrocene (Fc) was used as an internal reference to correct the potential axis by using the midpoint potential for the Fc/Fc+ redox couple. The calculation of cyclic voltammograms was performed by the normal explicit finite difference digital simulation technique [48,49].

4.7. Density Functional Theory (DFT) Calculations

The geometry optimizations for the FeIII and AlIII complex anions were performed at the B3LYP level [53,54] using the Gaussian 16 program package [55]. The 6-311+G(d,p) basis sets for H, C, O, N [56,57], and Al [58,59,60] atoms were used. The Wachters–Hay [61,62] basis sets were used for the Fe atom. The atomic coordinates for the [FeIII(LOMe)2] anion in the LS and HS states were taken from the major component of the disordered ligands in the crystal structure of 1-OMe at 90 and 400 K, respectively. The atomic coordinates for the [FeIII(LMe)2] anion in the HS state were taken from the major component of the disordered ligands in the crystal structure of 1-Me at 296 K, whereas those for the [FeIII(LMe)2] anion in the LS state were obtained by methyl substitution of the optimized coordinates for the [FeIII(LH)2] anion from the major component of the disordered ligands in the crystal structure of 1-H at 90 K [33]. The atomic coordinates for the [AlIII(LOMe)2] anion were taken from the major component of the disordered ligands in the crystal structure of 2-OMe. The atomic coordinates for the neutral one-electron oxidized AlIII complexes were taken from the optimized [AlIII(LOMe)2] anion under vacuum. After the geometry optimization under vacuum, the geometry optimizations in the presence of CH2Cl2 were performed using the polarizable continuum model (PCM) [50]. No imaginary frequencies were found for any of the calculated optimized structures. Cartesian coordinates of all the complex anions calculated at the B3LYP level of theory are summarized in Tables S6–S11.

5. Conclusions

We synthesized and characterized the azp derivative bearing electron-donating methoxy groups, H2LOMe, and elucidated the structures, magnetic properties, and electrochemical properties of its homoleptic FeIII and AlIII complexes, 1-OMe and 2-OMe, along with the methyl derivative 1-Me. The FeIII complex composed of the methoxy-substituted azp ligands, 1-OMe, exhibited SCO, revealing that the azp ligand provides a ligand field that induces SCO regardless of any substituents introduced. Note that cyclic voltammograms for both the FeIII complex 1-OMe and the AlIII complex 2-OMe exhibit reversible oxidation waves, indicating that the introduction of the methoxy group enhances the stability of the oxidized species of the complexes. This is the first observation of stable oxidized complex species from the azp complexes. DFT calculations revealed that the oxidation waves for both the FeIII and AlIII complexes, 1-OMe and 2-OMe, are ligand-centered, while the reduction wave for the FeIII complexes 1-OMe and 1-Me is metal-centered. In addition, the stability of the oxidized complex species originates from the resonance effect of the methoxy group. The stabilization of the oxidized complex species by the methoxy substitution opens the potential of the chemistry of metal complexes with azp ligands to exhibit not only SCO and VT phenomena but also a new functionality derived from MV. Further progress in research along this line is expected.

Supplementary Materials

The following supporting information can be downloaded at: https://www.mdpi.com/article/10.3390/inorganics14090223/s1, Figure S1: 1H NMR spectrum of 4 in CDCl3; Figure S2: 13C NMR spectrum of 4 in CDCl3; Figure S3: 1H NMR spectrum of H2LOMe in CDCl3; Figure S4: 13C NMR spectrum of H2LOMe in CDCl3; Figure S5: top and side views of molecular stacking in H2LOMe; Figure S6: TG-DTA curves for 1-Me and 2-OMe; Figure S7: 1H NMR spectrum of 2-OMe in CDCl3; Figure S8: the measured and fitted χMT product vs. T plot for 1-OMe; Figure S9: the χMT product vs. T plot for 1-Me; Figure S10: ORTEP drawings of 50% probability with selected atomic numbering for the [FeIII(LMe)2] anion in 1-Me; Figure S11: ORTEP drawings of 50% probability with selected atomic numbering for the [AlIII(LOMe)2] anion in 2-OMe at 90 K; Figure S12: cyclic voltammograms for 1-OMe and 2-OMe; Figure S13: simulated and observed voltammograms for 1-OMe and 2-OMe; Table S1: ABX system simulated and observed transition energies and intensities for 4; Table S2: ABX system simulated and observed transition energies and intensities for H2LOMe; Table S3: Crystallographic data for H2LOMe; Table S4: crystallographic data for 1-OMe, 1-Me, 2-OMe; Table S5: fitting parameters in the regression analysis of cyclic voltammograms for 1-OMe and 2-OMe; Table S6: Cartesian coordinates of the [FeIII(LOMe)2] anion in the LS state; Table S7: Cartesian coordinates of the [FeIII(LOMe)2] anion in the HS state; Table S8: Cartesian coordinates of the [AlIII(LOMe)2] anion; Table S9: Cartesian coordinates of the [FeIII(LMe)2] anion in the LS state; Table S10: Cartesian coordinates of the [FeIII(LMe)2] anion in the HS state; Table S11: Cartesian coordinates of the neutral [AlIII(LOMe)2] molecule.

Author Contributions

Conceptualization, K.T.; methodology, K.T.; validation, T.K. and K.T.; formal analysis, K.T.; investigation, T.K., S.T., K.U., A.M. and S.M.; resources, K.T., T.S., and H.O.; data curation, T.K., S.T., K.U., A.M., S.M. and K.T.; writing—original draft preparation, K.T.; writing—review and editing, K.T. and T.O.; visualization, K.T.; supervision, K.T.; project administration, K.T.; funding acquisition, K.T. All authors have read and agreed to the published version of the manuscript.

Funding

This work was partially supported by a Grant-in-Aid for Scientific Research (C) (Nos. 25K08590 and 19K05402) from the Ministry of Education, Culture, Sports, Science, and Technology of Japan and the Masuyakinen Basic Research Foundation.

Data Availability Statement

The crystallographic data can be obtained free of charge via https://www.ccdc.cam.ac.uk/structures/? (accessed on 23 July 2026) (or from the CCDC, 12 Union Road, Cambridge CB2 1EZ, UK; Fax: +44 1223 336033; E-mail: deposit@ccdc.cam.ac.uk).

Acknowledgments

K.T. is grateful to Yoshito Furuie at Kobe University for performing the elemental analysis. This work was carried out by the joint research program of the Molecular Photoscience Research Center, Kobe University.

Conflicts of Interest

The authors declare no conflicts of interest.

References

  1. Sato, O. Dynamic Molecular Crystals with Switchable Physical Properties. Nat. Chem. 2016, 8, 644–656. [Google Scholar] [CrossRef] [Scilit] [PubMed]
  2. Gütlich, P.; Goodwin, H.A. (Eds.) Spin Crossover in Transition Metal Compounds I–III; Springer: Berlin/Heidelberg, Germany, 2004. [Google Scholar]
  3. Halcrow, M.A. (Ed.) Spin-Crossover Materials; John Wiley & Sons, Ltd.: Oxford, UK, 2013. [Google Scholar]
  4. Gütlich, P.; Gaspar, A.B.; Garcia, Y. Spin State Switching in Iron Coordination Compounds. Beilstein J. Org. Chem. 2013, 9, 342–391. [Google Scholar] [CrossRef] [Scilit] [PubMed]
  5. Nicolazzi, W.; Bousseksou, A. Thermodynamical Aspects of the Spin Crossover Phenomenon. Comptes Rendus Chim. 2018, 21, 1060–1074. [Google Scholar] [CrossRef] [Scilit]
  6. Takahashi, K. (Ed.) Spin-Crossover Complexes; MDPI: Basel, Switzerland, 2018. [Google Scholar]
  7. Kitazawa, T. (Ed.) Synthesis and Applications of New Spin Crossover Compounds; MDPI: Basel, Switzerland, 2019. [Google Scholar]
  8. Tezgerevska, T.; Alley, K.G.; Boskovic, C. Valence Tautomerism in Metal Complexes: Stimulated and Reversible Intramolecular Electron Transfer between Metal Centers and Organic Ligands. Coord. Chem. Rev. 2014, 268, 23–40. [Google Scholar] [CrossRef] [Scilit]
  9. Chegerev, M.G.; Starikova, A.A. Electronic Lability of Quinonoid-Bridged Dinuclear 3d-Metal Complexes with Tetradentate N-Donor Bases. Eur. J. Inorg. Chem. 2021, 2021, 2684–2695. [Google Scholar] [CrossRef] [Scilit]
  10. Nadurata, V.L.; Boskovic, C. Switching metal complexes via intramolecular electron transfer: Connections with solvatochromism. Inorg. Chem. Front. 2021, 8, 1840–1864. [Google Scholar] [CrossRef] [Scilit]
  11. Takahashi, K.; Cui, H.-B.; Okano, Y.; Kobayashi, H.; Einaga, Y.; Sato, O. Electrical Conductivity Modulation Coupled to a High-Spin−Low-Spin Conversion in the Molecular System [FeIII(qsal)2][Ni(dmit)2]3·CH3CN·H2O. Inorg. Chem. 2006, 45, 5739–5741. [Google Scholar] [CrossRef] [Scilit] [PubMed]
  12. Takahashi, K.; Cui, H.-B.; Okano, Y.; Kobayashi, H.; Mori, H.; Tajima, H.; Einaga, Y.; Sato, O. Evidence of the Chemical Uniaxial Strain Effect on Electrical Conductivity in the Spin-Crossover Conducting Molecular System: [FeIII(qnal)2][Pd(dmit)2]5·Acetone. J. Am. Chem. Soc. 2008, 130, 6688–6689. [Google Scholar] [CrossRef] [Scilit] [PubMed]
  13. Phan, H.; Benjamin, S.M.; Steven, E.; Brooks, J.S.; Shatruk, M. Photomagnetic Response in Highly Conductive Iron(II) Spin-Crossover Complexes with TCNQ Radicals. Angew. Chem. Int. Ed. 2015, 54, 823–827. [Google Scholar] [CrossRef] [Scilit] [PubMed]
  14. Ishikawa, R.; Ueno, S.; Nifuku, S.; Horii, Y.; Iguchi, H.; Miyazaki, Y.; Nakano, M.; Hayami, S.; Kumagai, S.; Katoh, K.; et al. Simultaneous Spin-Crossover Transition and Conductivity Switching in a Dinuclear Iron(II) Coordination Compound Based on 7,7′,8,8′-Tetracyano-p-Quinodimethane. Chem. Eur. J. 2020, 26, 1278–1285. [Google Scholar] [CrossRef] [Scilit] [PubMed]
  15. Wang, M.; Li, Z.Y.; Ishikawa, R.; Yamashita, M. Spin Crossover and Valence Tautomerism Conductors. Coord. Chem. Rev. 2021, 435, 213819. [Google Scholar] [CrossRef] [Scilit]
  16. Nihei, M.; Tahira, H.; Takahashi, N.; Otake, Y.; Yamamura, Y.; Saito, K.; Oshio, H. Multiple Bistability and Tristability with Dual Spin-State Conversions in [Fe(dpp)2][Ni(mnt)2]2·MeNO2. J. Am. Chem. Soc. 2010, 132, 3553–3560. [Google Scholar] [CrossRef] [Scilit] [PubMed]
  17. Ohkoshi, S.; Imoto, K.; Tsunobuchi, Y.; Takano, S.; Tokoro, H. Light-Induced Spin-Crossover Magnet. Nat. Chem. 2011, 3, 564–569. [Google Scholar] [CrossRef] [Scilit] [PubMed]
  18. Ababei, R.; Pichon, C.; Roubeau, O.; Li, Y.-G.; Bréfuel, N.; Buisson, L.; Guionneau, P.; Mathonière, C.; Clérac, R. Rational Design of a Photomagnetic Chain: Bridging Single-Molecule Magnets with a Spin-Crossover Complex. J. Am. Chem. Soc. 2013, 135, 14840–14853. [Google Scholar] [CrossRef] [Scilit] [PubMed]
  19. Fukuroi, K.; Takahashi, K.; Mochida, T.; Sakurai, T.; Ohta, H.; Yamamoto, T.; Einaga, Y.; Mori, H. Synergistic Spin Transition between Spin Crossover and Spin-Peierls-like Singlet Formation in the Halogen-Bonded Molecular Hybrid System: [Fe(Iqsal)2][Ni(dmit)2]⋅CH3CN⋅H2O. Angew. Chem. Int. Ed. 2014, 53, 1983–1986. [Google Scholar] [CrossRef] [Scilit] [PubMed]
  20. Jiang, Y.; Hayes, S.; Bittmann, S.; Sarracini, A.; Liu, L.C.; Müller-Werkmeister, H.M.; Miyawaki, A.; Hada, M.; Nakano, S.; Takahashi, R.; et al. Direct Observation of Photoinduced Sequential Spin Transition in a Halogen-Bonded Hybrid System by Complementary Ultrafast Optical and Electron Probes. Nat. Commun. 2024, 15, 4604. [Google Scholar] [CrossRef] [Scilit] [PubMed]
  21. Ohkoshi, S.I.; Takano, S.; Imoto, K.; Yoshikiyo, M.; Namai, A.; Tokoro, H. 90-Degree Optical Switching of Output Second-Harmonic Light in Chiral Photomagnet. Nat. Photonics 2014, 8, 65–71. [Google Scholar] [CrossRef] [Scilit]
  22. Lochenie, C.; Schötz, K.; Panzer, F.; Kurz, H.; Maier, B.; Puchtler, F.; Agarwal, S.; Köhler, A.; Weber, B. Spin-Crossover Iron(II) Coordination Polymer with Fluorescent Properties: Correlation between Emission Properties and Spin State. J. Am. Chem. Soc. 2018, 140, 700–709. [Google Scholar] [CrossRef] [Scilit] [PubMed]
  23. Egger, C.; Piguet, C. Spin-Crossover Modulated Luminescence in Materials and Molecular Complexes. Helv. Chim. Acta 2026, 109, e00180. [Google Scholar] [CrossRef] [Scilit]
  24. Jornet-Mollá, V.; Duan, Y.; Giménez-Saiz, C.; Tang, Y.-Y.Y.; Li, P.-F.F.; Romero, F.M.; Xiong, R.-G.G. A Ferroelectric Iron(II) Spin Crossover Material. Angew. Chem. Int. Ed. 2017, 56, 14052–14056. [Google Scholar] [CrossRef] [Scilit] [PubMed]
  25. Akiyoshi, R.; Hirota, Y.; Kosumi, D.; Tsutsumi, M.; Nakamura, M.; Lindoy, L.F.; Hayami, S. Ferroelectric Metallomesogens Composed of Achiral Spin Crossover Molecules. Chem. Sci. 2019, 10, 5843–5848. [Google Scholar] [CrossRef] [Scilit] [PubMed]
  26. Wu, S.-Q.; Su, S.-Q.; Kanegawa, S.; Sato, O. Active Polarization Engineering between Symmetry Inequivalent Polar States Using Electron Transfer: A Nonferroelectric Approach. Acc. Chem. Res. 2025, 58, 1284–1295. [Google Scholar] [CrossRef] [Scilit] [PubMed]
  27. Shepherd, H.J.; Gural’Skiy, I.A.; Quintero, C.M.; Tricard, S.; Salmon, L.; Molnár, G.; Bousseksou, A. Molecular Actuators Driven by Cooperative Spin-State Switching. Nat. Commun. 2013, 4, 2607. [Google Scholar] [CrossRef] [Scilit] [PubMed]
  28. Manrique-Juarez, M.D.; Rat, S.; Mathieu, F.; Saya, D.; Séguy, I.; Leïchlé, T.; Nicu, L.; Salmon, L.; Molnár, G.; Bousseksou, A. Microelectromechanical Systems Integrating Molecular Spin Crossover Actuators. Appl. Phys. Lett. 2016, 109, 061903. [Google Scholar] [CrossRef] [Scilit]
  29. Manrique-Juarez, M.D.; Mathieu, F.; Shalabaeva, V.; Cacheux, J.; Rat, S.; Nicu, L.; Leïchlé, T.; Salmon, L.; Molnár, G.; Bousseksou, A. A Bistable Microelectromechanical System Actuated by Spin-Crossover Molecules. Angew. Chem. Int. Ed. 2017, 56, 8074–8078. [Google Scholar] [CrossRef] [Scilit] [PubMed]
  30. Dei, A.; Gatteschi, D.; Pardi, L.; Russo, U. Tetraoxolene Radical Stabilization by the Interaction with Transition-Metal Ions. Inorg. Chem. 1991, 30, 2589–2594. [Google Scholar] [CrossRef] [Scilit]
  31. Min, K.S.; DiPasquale, A.; Rheingold, A.L.; Miller, J.S. Room-Temperature Spin Crossover Observed for [(TPyA)FeII(DBQ2− )FeII(TPyA)]2+ [TPyA = Tris(2-pyridylmethyl)amine; DBQ2- = 2,5-Di-tert-butyl-3,6-dihydroxy-1,4-benzoquinonate]. Inorg. Chem. 2007, 46, 1048–1050. [Google Scholar] [CrossRef] [Scilit] [PubMed]
  32. Sadhukhan, P.; Wu, S.Q.; Long, J.I.; Nakanishi, T.; Kanegawa, S.; Gao, K.; Yamamoto, K.; Okajima, H.; Sakamoto, A.; Baker, M.L.; et al. Manipulating Electron Redistribution to Achieve Electronic Pyroelectricity in Molecular [FeCo] Crystals. Nat. Commun. 2021, 12, 4836. [Google Scholar] [CrossRef] [Scilit] [PubMed]
  33. Takahashi, K.; Kawamukai, K.; Okai, M.; Mochida, T.; Sakurai, T.; Ohta, H.; Yamamoto, T.; Einaga, Y.; Shiota, Y.; Yoshizawa, K. A New Family of Anionic FeIII Spin Crossover Complexes Featuring a Weak-Field N2O4 Coordination Octahedron. Chem. Eur. J. 2016, 22, 1253–1257. [Google Scholar] [CrossRef] [Scilit] [PubMed]
  34. Murata, S.; Takahashi, K.; Sakurai, T.; Ohta, H.; Yamamoto, T.; Einaga, Y.; Shiota, Y.; Yoshizawa, K. The Role of Coulomb Interactions for Spin Crossover Behaviors and Crystal Structural Transformation in Novel Anionic Fe(III) Complexes from a π-Extended ONO Ligand. Crystals 2016, 6, 49. [Google Scholar] [CrossRef] [Scilit]
  35. Hirota, M.; Murata, S.; Sakurai, T.; Ohta, H.; Takahashi, K. The Relationship Between Spin Crossover (SCO) Behaviors, Cation and Ligand Motions, and Intermolecular Interactions in a Series of Anionic SCO Fe(III) Complexes with Halogen-Substituted Azobisphenolate Ligands. Molecules 2024, 29, 5473. [Google Scholar] [CrossRef] [Scilit] [PubMed]
  36. Murata, S.; Takahashi, K.; Mochida, T.; Sakurai, T.; Ohta, H.; Yamamoto, T.; Einaga, Y. Cooperative Spin-Crossover Transition from Three-Dimensional Purely π-Stacking Interactions in a Neutral Heteroleptic Azobisphenolate FeIII Complex with a N3O3 Coordination Sphere. Dalton Trans. 2017, 46, 5786–5789. [Google Scholar] [CrossRef] [Scilit] [PubMed]
  37. Miyawaki, A.; Mochida, T.; Sakurai, T.; Ohta, H.; Takahashi, K. The Impact of the Next-Nearest Neighbor Dispersion Interactions on Spin Crossover Transition Enthalpy Evidenced by Experimental and Computational Analyses of Neutral π-Extended Heteroleptic Fe(III) Complexes. Inorg. Chem. 2020, 59, 12295–12303. [Google Scholar] [CrossRef] [Scilit] [PubMed]
  38. Miyawaki, A.; Eda, K.; Mochida, T.; Sakurai, T.; Ohta, H.; Nakajima, T.; Takahashi, K. Spin-Crossover-Triggered Linkage Isomerization by the Pedal-like Motion of the Azobenzene Ligand in a Neutral Heteroleptic Iron(III) Complex. Inorg. Chem. 2021, 60, 12735–12739. [Google Scholar] [CrossRef] [Scilit] [PubMed]
  39. Phonsri, W.; Lewis, B.A.I.; Jameson, G.N.L.; Murray, K.S. Double Spin Crossovers: A New Double Salt Strategy to Improve Magnetic and Memory Properties. Chem. Commun. 2019, 55, 14031–14034. [Google Scholar] [CrossRef] [Scilit] [PubMed]
  40. Smékal, Z.; Novák, P.; Zeller, M.; Antal, P.; Čižmár, E.; Herchel, R. Synthesis, Crystal Structure, 57Fe Mössbauer Spectroscopy and Magnetic Properties of High-Spin Iron(III) Anionic Complexes [Fe(azp)2]- (H2azp = 2,2′-dihydroxyazobenzene) with Organic Cations. Polyhedron 2022, 212, 115586. [Google Scholar] [CrossRef] [Scilit]
  41. Fan, Z.-X.; Lian, K.-T.; Liao, P.-Y.; Ruan, Z.-Y.; Ni, Z.-P.; Tong, M.-L. Synergetic Spin Crossover and Fluorescence in a Mononuclear Iron(III) Complex. Chem. Commun. 2024, 60, 13227–13230. [Google Scholar] [CrossRef] [Scilit] [PubMed]
  42. Takahashi, K.; Noguchi, T.; Ueda, K.; Miyawaki, A.; Murata, S. Molecular Structures and Redox Properties of Homoleptic Aluminum(III) Complexes with Azobisphenolate (Azp) Ligands. Inorganics 2022, 10, 84. [Google Scholar] [CrossRef] [Scilit]
  43. Schetty, G.; Steiner, E. Untersuchungen Der Symmetrieverhältnisse in Äquatorial Koordinierten 2:1-Arylazo-CoIII-Komplexen Mit Hilfe Der Protonenresonanz. Helv. Chim. Acta 1972, 55, 1509–1532. [Google Scholar] [CrossRef] [Scilit]
  44. Pople, J.A.; Schneider, W.G.; Bernstein, H.J. High-Resolution Nuclear Magnetic Resonance; McGraw-Hill Book Company, Inc.: New York, NY, USA; Toronto, ON, Canada; London, UK, 1959; pp. 132–138. [Google Scholar]
  45. Bondi, A. van der Waals Volumes and Radii. J. Phys. Chem. 1964, 68, 441–451. [Google Scholar] [CrossRef] [Scilit]
  46. Martin, J.P.; Zarembowitch, J.; Bousseksou, A.; Dworkin, A.; Haasnoot, J.G.; Varret, F. Solid State Effects on Spin Transitions: Magnetic, Calorimetric, and Möessbauer-Effect Properties of [FexCo1-x(4,4′-Bis-1,2,4-Triazole)2(NCS)2]·H2O Mixed-Crystal Compounds. Inorg. Chem. 1994, 33, 6325–6333. [Google Scholar] [CrossRef] [Scilit]
  47. Shannon, R.D. Revised Effective Ionic Radii and Systematic Studies of Interatomic Distances in Halides and Chalcogenides. Acta Cryst. 1976, A32, 751–767. [Google Scholar] [CrossRef] [Scilit]
  48. Feldberg, S.W. Electroanalytical Chemistry, Volume 3; Bard, A.J., Ed.; Marcel Dekker, INC.: New York, NY, USA, 1969; pp. 199–296. [Google Scholar]
  49. Bard, A.J.; Faulkner, L.R. Electrochemical Methods, Fundamentals and Applications, 2nd ed.; Appendix B; Wiley: New York, NY, USA, 2000. [Google Scholar]
  50. Tomasi, J.; Mennucci, B.; Cammi, R. Quantum mechanical continuum solvation models. Chem. Rev. 2005, 105, 2999–3093. [Google Scholar] [CrossRef] [Scilit] [PubMed]
  51. Schubert, E.M. Utilizing the Evans Method with a Superconducting NMR Spectrometer in the Undergraduate Laboratory. J. Chem. Educ. 1992, 69, 62. [Google Scholar] [CrossRef] [Scilit]
  52. König, E. Landolt-Börnstein Neue Serie Gruppe II; Hellwege, K.-H., Hellwege, A.M., Eds.; Springer: Berlin/Heidelberg, Germany, 1966; Volume 2, pp. 1-16–1-18. [Google Scholar]
  53. Becke, A.D. Density-functional thermochemistry. III. The role of exact exchange. J. Chem. Phys. 1993, 98, 5648–5652. [Google Scholar] [CrossRef] [Scilit]
  54. Lee, C.; Yang, W.; Parr, R.G. Development of the Colle-Salvetti Correlation-Energy Formula into a Functional of the Electron Density. Phys. Rev. B 1988, 37, 785–789. [Google Scholar] [CrossRef] [Scilit] [PubMed]
  55. Frisch, M.J.; Trucks, G.W.; Schlegel, H.B.; Scuseria, G.E.; Robb, M.A.; Cheeseman, J.R.; Scalmani, G.; Barone, V.; Petersson, G.A.; Nakatsuji, H.; et al. Gaussian 16, Revision C.01; Gaussian, Inc.: Wallingford, CT, USA, 2016. [Google Scholar]
  56. Krishnan, R.; Binkley, J.S.; Seeger, R.; Pople, J.A. Self-consistent Molecular Orbital Methods. XX. A Basis Set for Correlated Wave Functions. J. Chem. Phys. 1980, 72, 650–654. [Google Scholar] [CrossRef] [Scilit]
  57. Clark, T.; Chandrasekhar, J.; Spitznagel, G.W.; Schleyer, P.V.R. Efficient Diffuse Function-Augmented Basis Sets for Anion Calculations. III. The 3-21+G Basis Set for First-Row Elements. Li-F. J. Comput. Chem. 1983, 4, 294–301. [Google Scholar] [CrossRef] [Scilit]
  58. McLean, A.D.; Chandler, G.S. Contracted Gaussian Basis Sets for Molecular Calculations. I. Second Row Atoms, Z =11–18. J. Chem. Phys. 1980, 72, 5639–5648. [Google Scholar] [CrossRef] [Scilit]
  59. Francl, M.M.; Pietro, W.J.; Hehre, W.J.; Binkley, J.S.; Gordon, M.S.; DeFrees, D.J.; Pople, J.A. Self-consistent Molecular Orbital Methods. XXIII. A Polarization-type Basis Set for Second-row Elements. J. Chem. Phys. 1982, 77, 3654–3665. [Google Scholar] [CrossRef] [Scilit]
  60. Spitznagel, G.W.; Clark, T.; von Ragué Schleyer, P.; Hehre, W.J. An Evaluation of the Performance of Diffuse Function-Augmented Basis Sets for Second Row Elements, Na-Cl. J. Comput. Chem. 1987, 8, 1109–1116. [Google Scholar] [CrossRef] [Scilit]
  61. Wachters, A.J.H. Gaussian Basis Set for Molecular Wavefunctions Containing Third-Row Atoms. J. Chem. Phys. 1970, 52, 1033–1036. [Google Scholar] [CrossRef] [Scilit]
  62. Hay, P.J. Gaussian Basis Sets for Molecular Calculations. The Representation of 3 d Orbitals in Transition-metal Atoms. J. Chem. Phys. 1977, 66, 4377–4384. [Google Scholar] [CrossRef] [Scilit]
Figure 1. (a) Structural formula of substituted 2,2′-azobisphenol H2LR; (b) structural formula of FeIII complexes 1-R and AlIII complexes 2-R. TMA = tetramethylammonium, TBA = tetrabutylammonium, TPP = tetraphenylphosphonium.
Inorganics 14 00223 g001
Scheme 1. Synthesis of H2LOMe.
Inorganics 14 00223 sch001
Figure 2. The NMR spectra in the aromatic region for 4 (a) and H2LOMe (b). The red and green bars indicate the relative signal intensity obtained by fitting the ABX system. Chemical structural formulas with the obtained chemical shifts (ppm) and coupling constants (J) of 4 (c) and H2LOMe (d).
Inorganics 14 00223 g002
Figure 3. (a) ORTEP drawings of 50% probability with atomic numbering of H2LOMe; (b) Perspective view of the packing structure along the b axis.
Inorganics 14 00223 g003
Figure 4. The χMT product vs. T plot for 1-OMe.
Inorganics 14 00223 g004
Figure 5. ORTEP drawings of 50% probability with selected atomic numbering for the asymmetric unit of 1-OMe. (a) The [FeIII(L1)(L2)] anion at 90 K; (b) the [FeIII(L1′)(L2)] anion at 90 K; (c) the TBA cation at 90 K; (d) the TBA cation at 296 K. Hydrogen atoms are omitted for clarity.
Inorganics 14 00223 g005
Figure 6. Cyclic voltammograms of the FeIII complex 1 and AlIII complex 2 in a 0.1 M Bu4NPF6 dichloromethane solution. The scan rate was 100 mV s−1. (a) The anodic and successive cathodic scans showing three or two couples of redox waves for each complex in the higher potential range. (b) The cathodic and successive anodic scans showing a couple of redox waves.
Inorganics 14 00223 g006
Figure 7. Energy level diagram near the frontier orbitals for the [FeIII(LR)2] and [AlIII(LR)2] anions in CH2Cl2. Electrons occupying orbitals are indicated by up- and down-arrows. The highest occupied and lowest unoccupied energy levels are indicated by red and cyan, respectively. The orbital numbers are indicated for the highest occupied and lowest unoccupied MO levels.
Inorganics 14 00223 g007
Figure 8. MO surfaces near the frontier orbitals of the [FeIII(LOMe)2] (a) and [FeIII(LMe)2] anions (b) in the HS state.
Inorganics 14 00223 g008
Figure 9. Spin density surfaces of the one-electron oxidized neutral AlIII complexes [AlIII(LOMe)2]0 (a) and [AlIII(LMe)2]0 (b).
Inorganics 14 00223 g009
Table 1. Coordination bond lengths and distortion parameters Σ and Θ of the complex anion with major-oriented ligands, and occupancies of major-oriented cation and ligands.
Complex1-OMe1-Me2-OMe1-H
Temp. (K)902964002969090293
M1-O1 (Å)1.941(2)1.982(5)1.978(5)1.997(4)1.942(3)1.9233(15)1.975(2)
M1-O2 (Å)1.842(2)1.829(5)1.889(5)1.945(4)1.807(5)1.8593(16)1.947(2)
M1-N1 (Å)1.920(2)1.943(4)2.083(5)2.168(3)2.005(3)1.9523(16)2.166(2)
M1-O5 (Å)1.9312(16)1.954(4)1.967(4)1.997(4) a1.896(2)1.9217(13)1.9836(19)
M1-O6 (Å)1.8586(16)1.854(3)1.898(4)1.945(4) a1.845(2)1.8898(13)1.942(2)
M1-N3 (Å)1.9153(17)1.941(4)2.087(4)2.168(3) a2.005(2)1.9220(14)2.1537(19)
Σ (°) b31.4(4)39.5(8)65.1(9)86.2(6)34.4(5)39.4(3)89.6(3)
Θ (°) c42.4(4)40.3(9)104.8(10)170.5(7)74.4(6)53.2(3)169.6(4)
L1 occupancy74.6(3)%68.8(5)%64.4(6)%82.5(5)%72.8(5)%86.7%86.7%
L2 occupancy91.9(3)%83.2(5)%81.9(6)%82.5(5)% a100%100%100%
Cation
occupancy
100%85.5(3)%58.0(3)%50.4(3)%100%100%100%
Spin-stateLSLSHSHSLSHS
ReferenceThis workThis workThis workThis workThis work[33][33]
a The values in the table are the same due to a 2-fold rotation relation to the L1 ligand. b The sum of absolute deviations of 12 bite angles from 90°. c The sum of absolute deviations of 24 angles of 8 surface triangles of the coordination octahedron from 60°.
Table 2. Anodic and cathodic peak potentials a (Epa and Epc in V vs. Fc/Fc+) and the midpoint potentials (Emid) for the cyclic voltammograms obtained for the complexes 1 and 2.
ComplexFirst Cathodic CoupleFirst Anodic CoupleSecond Anodic CoupleThird Anodic Couple
EpaEpcEmid bEpaEpcEmid bEpaEpcEmid bEpaEpcEmid b
1-OMe−1.36−1.50−1.430.05−0.07−0.010.340.220.280.830.710.77
2-OMe−1.70 c−1.93 d−1.820.05−0.050.000.370.270.320.830.720.78
1-Me−1.38−1.53−1.450.210.08 c0.140.560.45 c0.50
2-Me e−1.73 c−1.96−1.850.240.110.180.600.500.55
2-Cl e−1.50−1.62−1.560.570.40 c0.490.90 d
a The scan rate was 100 mV s−1. b Emid = (Epa + Epc)/2. c Broad peaks. d Shoulder peak. e Reference [42].
Table 3. Energy level (eV) near the frontier orbitals for the [FeIII(L)2] and [AlIII(L)2] anions.
Anion[FeIII(LOMe)2][AlIII(LOMe)2][FeIII(LMe)2][AlIII(LMe)2]− a
Spin-StateLSHSLSHS
αβαβ αβαβ
LUMO + 1−2.117−2.105−2.179−2.382−2.178−2.050−2.039−2.116−2.395−2.132
LUMO−2.161−2.315−2.303−2.805−2.388−2.128−2.262−2.231−2.770−2.324
HOMO−4.796−4.777−4.811−4.795−4.757−4.985−4.959−4.997−4.979−4.946
HOMO − 1−4.830−4.810−4.852−4.841−4.762−4.992−4.967−5.016−4.998−4.953
a Reference [42].
Disclaimer/Publisher’s Note: The statements, opinions and data contained in all publications are solely those of the individual author(s) and contributor(s) and not of MDPI and/or the editor(s). MDPI and/or the editor(s) disclaim responsibility for any injury to people or property resulting from any ideas, methods, instructions or products referred to in the content.