Article

Metal Complexes and AuNP Formulations of a Moxifloxacin–Salicylaldehyde Hydrazone: Synthesis, Coordination Features, and Biological Evaluation


by
Adel Sayed Orabi
1,
Sara Reda Fisal
1,
Ibrahim Ahmed Ibrahim Ali
1,
W. Christopher Boyd
2,
Haitham Kalil
3,* and
Abbas Mamdoh Abbas
1,*
1
Department of Chemistry, Faculty of Science, Suez Canal University, Ismailia 41522, Egypt
2
Department of Chemistry, College of Arts and Sciences, Cleveland State University, Cleveland, OH 44115, USA
3
Department of Chemistry & Biochemistry, California Polytechnic State University, San Luis Obispo, CA 93407, USA
*
Authors to whom correspondence should be addressed.
Inorganics 2026, 14(6), 143; https://doi.org/10.3390/inorganics14060143
Submission received: 12 April 2026 / Revised: 6 May 2026 / Accepted: 21 May 2026 / Published: 23 May 2026

Abstract

Moxifloxacin-based Schiff-base ligands provide a useful platform for tuning the coordination and biological properties of fluoroquinolone derivatives. Here, a moxifloxacin–salicylaldehyde hydrazone ligand (MOX-S) was prepared and coordinated with cobalt(II), nickel(II), copper(II), oxovanadium(IV), and gadolinium(III) ions to obtain a series of metal complexes. Citrate-stabilized gold nanoparticles (AuNPs) were also prepared and functionalized with MOX-S and the Cu(II) complex to evaluate the effect of nanoformulation on biological performance. The compounds were characterized using complementary analytical, spectroscopic, magnetic, thermal, and microscopic techniques. The combined data support 1:2 metal-to-ligand formulations for the complexes and indicate coordination mainly through the azomethine nitrogen and oxygen donor sites of MOX-S. In antimicrobial screening, the activity was strongly metal- and organism-dependent. Cu–MOX-S and VO–MOX-S showed the most pronounced activity against Gram-positive bacteria, with inhibition zones of up to 30 mm, while Cu–MOX-S displayed MIC values of 19.53 and 39.06 µg mL−1 against Bacillus subtilis and Staphylococcus aureus, respectively. Cytotoxicity assays showed that MOX-S was more active than moxifloxacin against MCF-7 and HepG2 cells, while Cu–MOX-S showed enhanced potency, particularly toward HepG2 cells, with an IC50 of 0.98 µM and a selectivity index of 5.97. AuNP formulations further increased the apparent antiproliferative potency in the tested cancer cell lines, giving sub-micromolar IC50 values. Computational analyses, including DFT-based electronic descriptors and molecular docking, provided qualitative support for the experimentally observed coordination and cytotoxicity trends. Overall, metal coordination and AuNP formulations provide complementary strategies for modulating the physicochemical and in vitro biological behavior of this moxifloxacin-derived hydrazone scaffold.

1. Introduction

Antimicrobial resistance remains a major challenge to the effective treatment of bacterial infections and continues to stimulate the development of modified antimicrobial scaffolds with improved potency, selectivity, and physicochemical behavior [1,2]. Fluoroquinolones are among the most widely used synthetic antibacterial agents because they inhibit bacterial DNA gyrase and topoisomerase IV, thereby disrupting DNA replication and transcription [3,4]. Nevertheless, the emergence of pathogens with reduced susceptibility to these agents, together with safety- and resistance-related limitations, has encouraged the structural modification of clinically used fluoroquinolones as a strategy to modulate their biological and pharmacokinetic profiles [5,6].
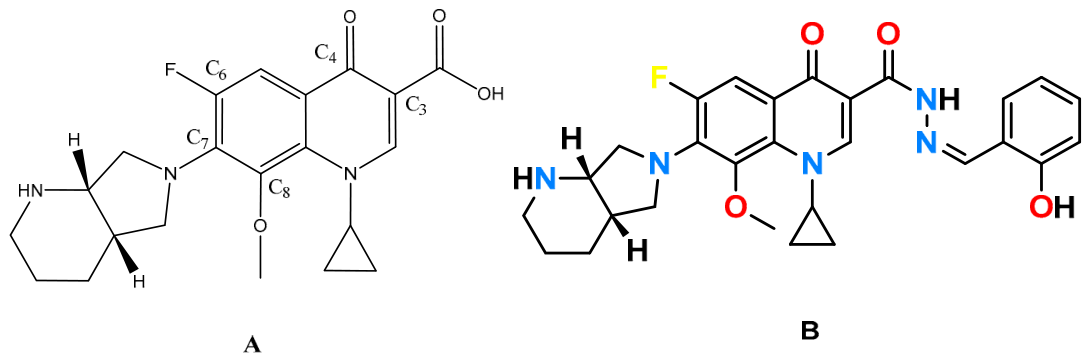
Moxifloxacin is a fourth-generation fluoroquinolone with broad-spectrum antibacterial activity and favorable tissue penetration [7]. Its quinolone core contains several structurally important positions, including the C-3 carboxylic acid, C-4 oxo group, C-6 fluoro substituent, C-7 diazabicyclonyl moiety, and C-8 methoxy group, which collectively influence antibacterial activity, lipophilicity, target interaction, and pharmacological behavior (Figure 1) [8,9]. These structural features also make moxifloxacin a suitable scaffold for chemical derivatization and for the preparation of hybrid systems with modified physicochemical and biological properties [10].
Among the available derivatization strategies, hydrazone and Schiff-base formation provides a practical route for introducing additional donor atoms while preserving the quinolone pharmacophore [11,12]. Condensation of a hydrazide precursor with an aldehyde generates an azomethine functionality, which can participate in coordination through the imine nitrogen and adjacent oxygen-containing groups [11,12,13,14]. In particular, incorporation of a salicylaldehyde fragment introduces a phenolic oxygen donor adjacent to the azomethine group, generating an N/O-donor environment suitable for chelation with transition-metal and lanthanide ions [15,16,17].
Metal coordination can substantially modify the properties of bioactive ligands by altering charge distribution, lipophilicity, redox behavior, molecular geometry, and interaction with biological targets [18,19]. For fluoroquinolone- and Schiff-base-derived ligands, these changes may influence membrane permeability, DNA/protein binding, oxidative stress pathways, and solution speciation under biological assay conditions [20,21]. However, the resulting biological activity is typically metal-, ligand-, and assay-dependent; therefore, such systems require careful interpretation using both physicochemical characterization and biological evaluation [22,23,24].
Transition-metal ions such as Co(II), Ni(II), Cu(II), and oxovanadium(IV) are particularly relevant in this context because of their variable coordination preferences, accessible electronic structures, and ability to interact with N/O-donor ligands [21]. Cu(II) complexes are frequently investigated in medicinal coordination chemistry because of their redox activity and possible involvement in DNA/protein interactions and oxidative pathways [25]. Oxovanadium (IV) complexes are also of interest because the vanadyl unit provides a distinctive axial coordination environment and biologically relevant redox chemistry [26,27,28]. In contrast, Gd(III) complexes offer different electronic and magnetic characteristics; however, their biological behavior depends strongly on ligand binding, coordination stability, and medium-dependent speciation [29,30].
In parallel with coordination chemistry, nanoparticle-based formulation has emerged as a complementary strategy for modifying the apparent biological performance of small molecules and metal complexes. Gold nanoparticles are attractive for this purpose because they can be prepared reproducibly by citrate reduction, display a characteristic surface plasmon resonance band, and interact with heteroatom-rich ligands at the nanoparticle surface. Functionalization of AuNPs with drug-derived ligands or metal complexes may influence dispersion, local concentration, cellular interaction, and apparent antiproliferative potency. Nevertheless, biological results obtained with nanoparticle formulations should be interpreted cautiously because the observed effects may reflect combined contributions from the active compound, nanoparticle surface, uptake behavior, and assay conditions [31,32,33].
Despite extensive literature on fluoroquinolone derivatives, Schiff-base ligands, and metal complexes, integrated studies combining a moxifloxacin–salicylaldehyde hydrazone ligand, multiple metal ions, and AuNP-based formulations remain limited. Moreover, the relationship between coordination features, solid-state/solution behavior, and biological activity is often insufficiently explored. This gap motivated the present study, which aims to evaluate whether hydrazone formation, metal coordination, and AuNP formulation can provide complementary routes for modulating the physicochemical and in vitro biological behavior of a moxifloxacin-derived scaffold.
In this work, a moxifloxacin–salicylaldehyde hydrazone ligand (MOX-S) was synthesized and coordinated with Co(II), Ni(II), Cu(II), oxovanadium(IV), and Gd(III) ions. In addition, citrate-stabilized AuNPs were prepared and functionalized with MOX-S and the Cu(II) complex to assess the influence of nanoformulation on biological response. The ligand, complexes, and AuNP-based systems were characterized using complementary analytical, spectroscopic, magnetic, thermal, microscopic, and computational methods. Their antimicrobial activity was evaluated against representative Gram-positive, Gram-negative, and fungal strains, while cytotoxicity was assessed against cancer and non-malignant cell lines. This study was designed to clarify how ligand derivatization, metal coordination, and AuNP formulation affect the coordination features and in vitro biological profile of this moxifloxacin-derived hydrazone system.

2. Results and Discussion

2.1. Characterization of the Moxifloxacin Schiff-Base Ligand (MOX-S)

The Schiff-base derivative MOX-S was obtained as a white powder. Thin-layer chromatography (TLC) showed a single major spot with R f = 0.74 , indicating formation of a single predominant component under the applied conditions. MOX-S displayed good solubility in polar organic solvents (ethanol, methanol, DMSO, and DMF), consistent with the presence of multiple heteroatom-containing functional groups and an overall polar character.
Elemental analysis (Table S1) was compared with calculated values for the proposed composition C28H30FN5O4. The measured values are in acceptable agreement with theoretical percentages and support the assigned composition of MOX-S.
Mass spectrometry provided further confirmation of MOX-S formation. The spectrum (Figure S1; Table S1) displays a prominent molecular-ion signal at m/z = 519, consistent with the expected molecular mass of the synthesized ligand. The absence of dominant unexpected high-intensity signals supports the formation of MOX-S as the major product under the employed conditions.
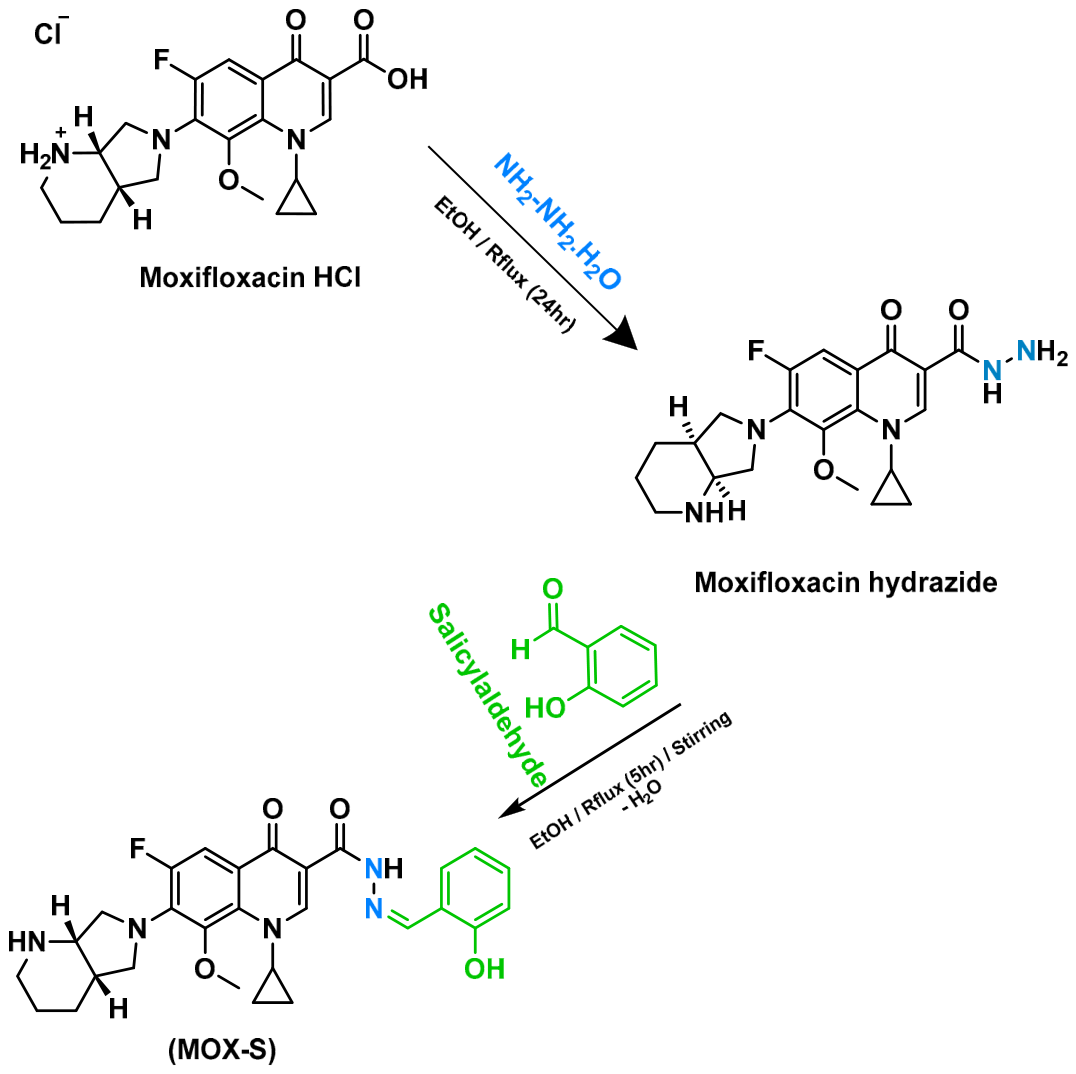
The 1H NMR spectrum of MOX-S (DMSO-d6; Figure S2; Table S1) supports successful Schiff-base (hydrazone) formation and retention of the moxifloxacin framework. Two diagnostic downfield singlets at δ 13.20 (s, 1H) and δ 11.29 (s, 1H) are assigned to the phenolic OH and NH protons, respectively; the strongly deshielded OH signal is consistent with intramolecular hydrogen bonding in the salicylidene fragment. The appearance of an imine-region singlet at δ 8.69 (s, 1H) is attributed to the azomethine (CH=N) proton, confirming condensation. Aromatic protons resonate in the expected range δ 7.64–6.95 (salicylidene/quinolone-related signals). In the aliphatic region, the methoxy group appears at δ 3.58 (s, 3H), while the remaining N/O-adjacent and saturated framework protons appear as multiplets and signals between δ 4.41 and 0.83, consistent with the modified moxifloxacin skeleton [34,35].
The FT-IR spectrum provides complementary evidence for Schiff-base formation. Relative to the hydrazide precursor, MOX-S shows diagnostic changes in the carbonyl and azomethine regions (Figures S3 and S4), including the appearance/shift in the ν(C=N) band and changes in the ν(C=O) region, consistent with condensation and electronic redistribution within the conjugated hydrazone framework. These spectral changes, together with the NMR and MS data, support successful conversion of the hydrazide precursor into the MOX-S Schiff-base ligand [35,36,37].
PXRD patterns of MOX-S (Figure S5; Table S2) exhibit moderately intense, broadened reflections at 2θ = 8.3°, 11.3°, 13.0°, 18.3°, 21.1°, 25.5°, and 30.1°, consistent with a semi-crystalline material with limited coherent domain size. Indexing and semi-empirical refinement (Expo2014, version 271122; Figure S6 and Table S3) suggest a monoclinic lattice with the reported space group P1211 (standard setting may be written as P21 depending on convention). The refined cell parameters are a = 11.49 Å, b = 21.52 Å, c = 5.83 Å, β = 91.66°, with unit-cell volume V = 1691 Å3.
Scherrer analysis of selected broadened reflections yielded an average crystallite size of ζ = 7.95 nm, consistent with nanoscale coherent scattering domains [38,39]. Dislocation density values were reported as δ = 1.06 × 10⁻² to 8.98 × 10⁻²; the corresponding units should be stated explicitly (e.g., if δ was calculated using δ = 1/ζ2 with ζ in nm, then δ is in nm−2, equivalent to 1016–1017 m−2). The nanoscale crystallite size and semi-crystalline character may contribute to increased surface area relative to fully crystalline materials.

2.2. Characterization of Metal Complexes

2.2.1. Analytical Evidence, Molar Conductivity, and Proposed Formulations

Reaction of MOX-S with Co(II), Ni(II), Cu(II), VO(IV), and Gd(III) salts in ethanol afforded a series of colored solid complexes in good yields (65–85%). The proposed 1:2 (metal/ligand) compositions are supported by metal content (Table 1), molar conductivity in DMSO, and consistent spectroscopic changes relative to the free ligand (FT-IR, UV–Vis; EPR for Cu/VO), together with thermal behavior from TGA/DTG. Collectively, the data support coordination through the azomethine nitrogen and oxygen donor sites of MOX-S, with metal-dependent solution behavior, as reflected by conductivity measurements.
The molar conductivities (10−3 M in DMSO) fall in the range of 31–74 Ω−1 cm2 mol−1 (Table 1). The Co(II), Ni(II), and Cu(II) complexes show comparatively lower Λm values (31–39 Ω−1 cm2 mol−1), consistent with weaker electrolytic behavior in DMSO, whereas the VO(IV) and Gd(III) complexes exhibit higher Λm values (50 and 74 Ω−1 cm2 mol−1, respectively), indicating a greater ionic contribution under the measurement conditions. These results support the presence of counterions in the formulated complexes and emphasize that solution behavior may differ from the solid-state stoichiometry. Finally, the experimentally determined metal contents from complexmetry analysis (and thermogravimetric) were in good agreement with the calculated values, supporting the proposed stoichiometries and molecular formulae for the complexes.

2.2.2. FT-IR Spectra

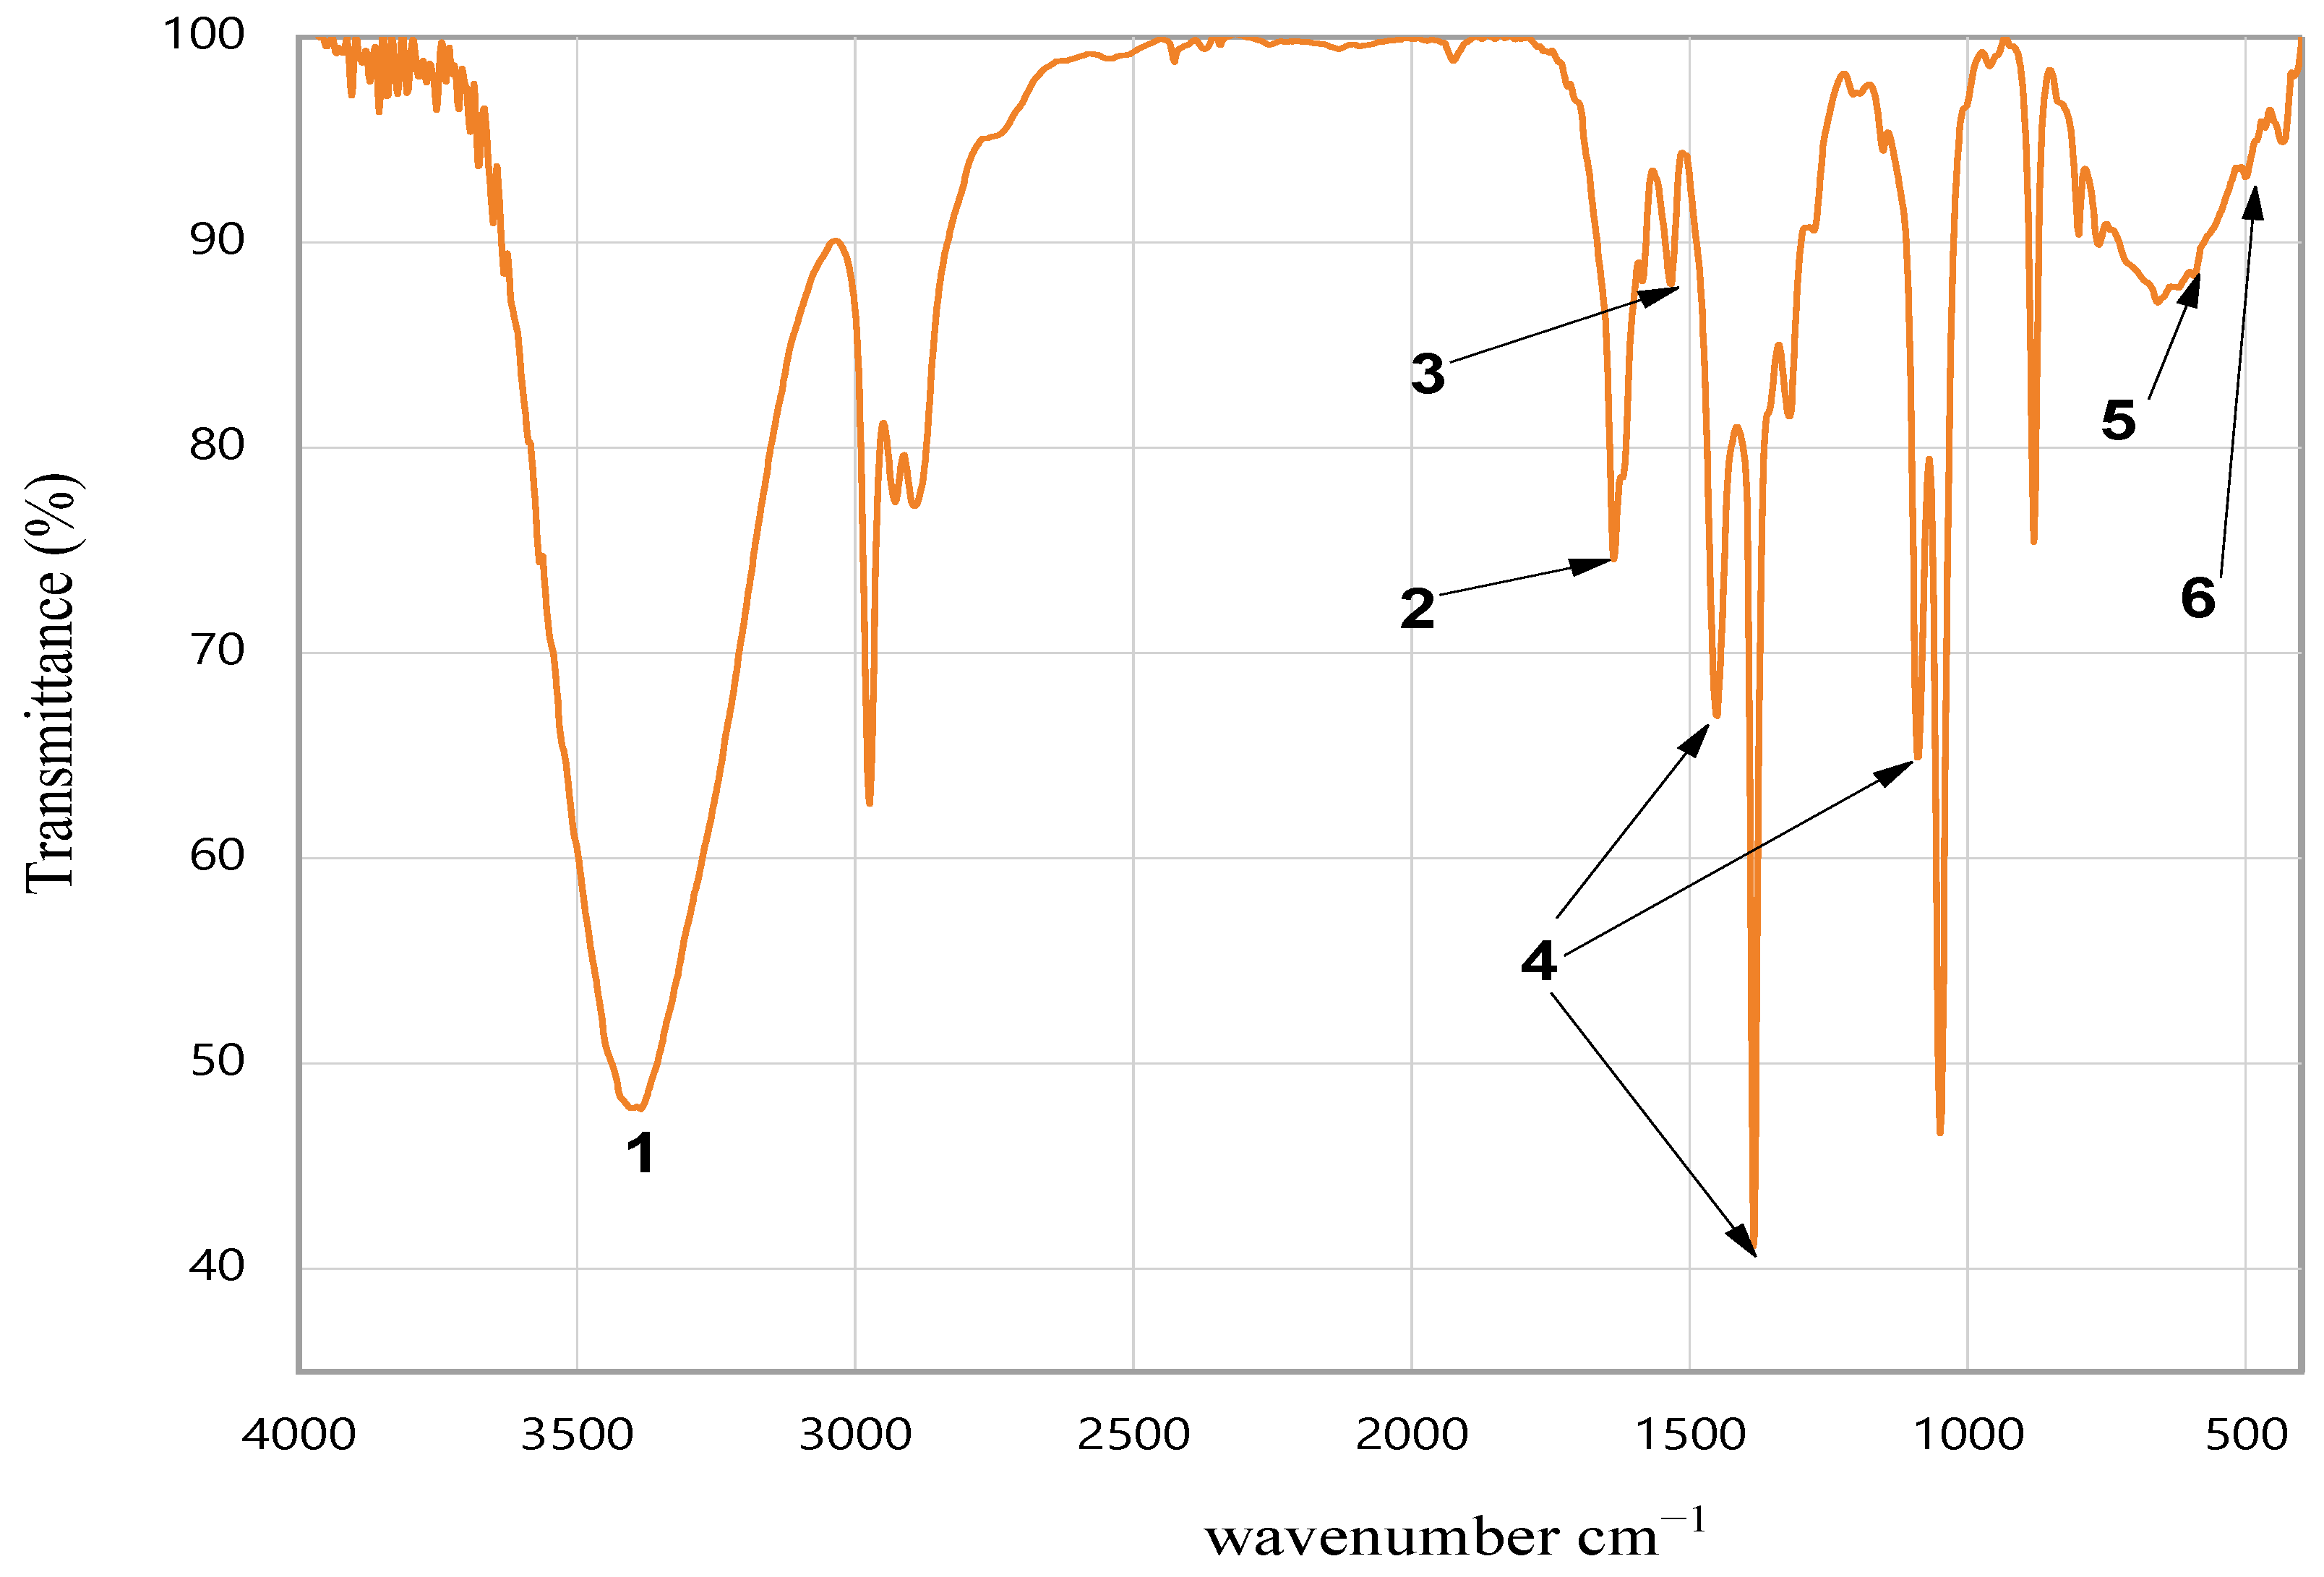
Complex formation is supported by systematic changes in the FT-IR spectra relative to free MOX-S (Table 2; Figure 2 and Figures S7–S10). Upon coordination, the azomethine band ν(C=N) and oxygen-associated bands of the ligand show metal-dependent shifts, consistent with participation of the imine nitrogen and oxygen donor sites in bonding. In all complexes, new bands appear in the 400–600 cm−1 region, attributable to ν(M–N) and ν(M–O) vibrations, which are absent in the free ligand.
Upon complexation, several diagnostic trends are observed. First, the amide-related ν ( C = O ) band (1675 cm−1, very weak in MOX-S) is not observed in any complex, which is consistent with coordination involving this carbonyl oxygen and/or substantial perturbation of its local environment upon metal binding. Second, the quinolone-associated carbonyl band remains in a narrow range across the series—1622 cm−1 (Co), 1626 cm−1 (Ni), 1620 cm−1 (Cu), 1620 cm−1 (VO), and 1635 cm−1 (Gd)—indicating that the quinolone C = O group is largely retained and is less affected by coordination than the amide/imine region under the present conditions [40,41]. Third, the azomethine ν ( C = N ) vibration shifts to higher wavenumber upon complex formation where it remains observable (1561 cm−1 for Co, 1579 cm−1 for Ni, and 1584 cm−1 for Gd), consistent with involvement of the imine nitrogen in coordination. For the Cu(II) and oxovanadium (IV) complexes, the ν ( C = N ) band is not resolved in the reported region, which can occur due to band weakening, overlapping with neighboring modes, and/or broadening in these paramagnetic systems [42].
The appearance of new bands in the low-frequency region of the FT-IR spectra, assigned to ν ( M O ) and ν ( M N ) stretching vibrations, provides additional spectroscopic evidence for metal–ligand bond formation [43]. The complexes display ν ( M O ) bands at 552 (Co), 540 (Ni), 597 (Cu), 512 (VO), and 592 cm−1 (Gd), together with ν ( M N ) bands at 419 (Co), 473 (Ni), 464 (Cu), 464 (VO), and 499 cm−1 (Gd). These features are absent in the free ligand and are therefore consistent with coordination through oxygen and nitrogen donor atoms.
In addition, all complexes exhibited broad bands in the 3385–3447 cm−1 region, attributable to overlapping ν(O–H)/ν(N–H) stretching vibrations from coordinated/lattice water and ligand N–H/O–H groups. This assignment is consistent with the proposed hydrated formulations, particularly when considered together with the thermal-decomposition data [44,45].
In addition to the ligand-based coordination markers, metal/anion-specific bands further support the assigned formulations. The oxovanadium(IV) complex displays a characteristic terminal ν ( V = O ) stretching vibration at 879 cm−1, consistent with a vanadyl ( V O 2 + ) moiety. The free sulfate ion belongs to the highly symmetrical point group Td, and of the four vibrational frequencies, only ν3 and ν4 are active in the IR. For the Gd(III) complex, a strong nitrate-associated band at 1384 cm−1 indicates the presence of nitrate in the complex; the persistence and intensity of this feature are consistent with nitrate acting as a counterion and/or a coordinated ligand [46], with the precise binding mode best distinguished by the full set of nitrate bands and their splitting patterns in the 1300–1500 cm−1 region in combination with conductivity data.
Overall, the FT-IR data support coordination of MOX-S through the azomethine nitrogen and oxygen donor site(s), in line with the observed perturbations in the imine/carbonyl region and the emergence of ν ( M O ) / ν ( M N ) modes.

2.2.3. Magnetic Moment, UV–Visible and EPR Analysis

The room-temperature magnetic moments and UV–Vis spectral data of the synthesized MOX-S metal complexes are summarized in Table S6 and illustrated in Figure 3 and Figure 4 and Figures S11–S15. The free MOX-S ligand exhibits characteristic intra-ligand absorptions in the UV region, showing an intense π→π* band at 307 nm and an n→π* transition at 336 nm. Upon coordination, the absorption profiles change and/or shift, consistent with metal–ligand interaction and formation of distinct coordination compounds.
The Co(II)–MOX-S complex displays a magnetic moment of 4.19 BM, consistent with a high-spin d7 electronic configuration. Its UV–visible spectrum shows d–d transitions compatible with a distorted octahedral environment, in line with literature assignments for Co(II) in N/O-donor ligand fields [46,47]. The Co(II) complex shows a broad, weak X-band EPR response with no resolved hyperfine structure, which is commonly observed for high-spin Co(II) systems due to strong spin–orbit coupling, large zero-field splitting, and rapid relaxation; therefore, the spectrum is used qualitatively to support paramagnetic behavior rather than for definitive geometric assignment (Figure S16) [48,49].
The Ni(II)–MOX-S complex exhibits a magnetic moment of 3.15 BM, consistent with a paramagnetic Ni(II) (d8) center in an approximately octahedral ligand field. The observed electronic transitions are assignable to a distorted octahedral environment. Ligand-field analysis provided a Racah parameter of B = 989.20 cm−1 and a nephelauxetic ratio of β = 0.91, indicating appreciable covalent character in the metal–ligand bonding [47,50].
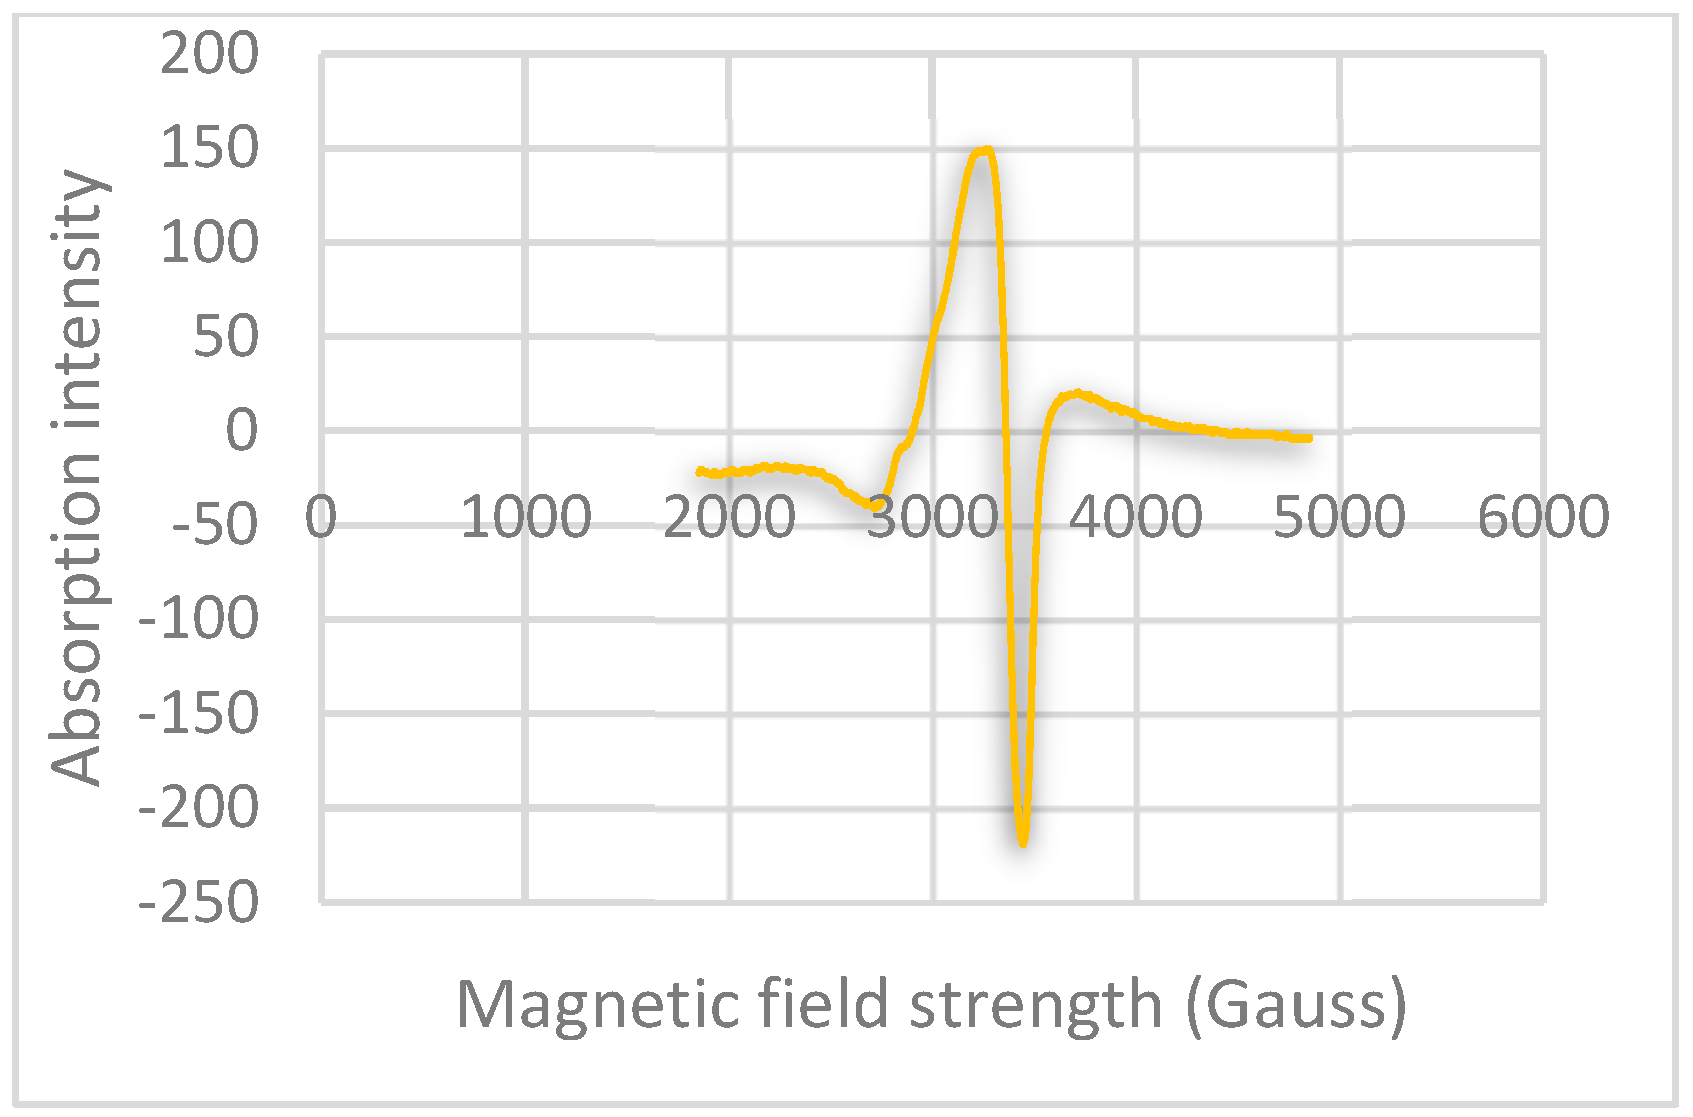
The Cu(II)–MOX-S complex shows spectral and magnetic features typical of a Jahn–Teller-distorted octahedral d9 system [51,52,53,54,55]. EPR The X-band EPR spectrum of Cu–MOX-S (Figure 5) displays axial anisotropy with g∥ = 2.158 and g⊥ = 2.017. The relationship g∥ > g⊥ > 2.0023 is characteristic of a tetragonally distorted Cu(II) (d9) center with a d x 2 y 2 ground state 2B1g, commonly associated with square-planar/square-pyramidal or elongated-octahedral coordination in N/O-donor environments. The exchange interaction parameter, given by G = (g∥ − 2)/(g⊥ − 2) = 9.29, exceeds 4, indicating a negligible exchange coupling between Cu(II) centers in the examined sample. Overall, the EPR parameters support a tetragonally distorted Cu(II) environment consistent with the proposed coordination mode [56].
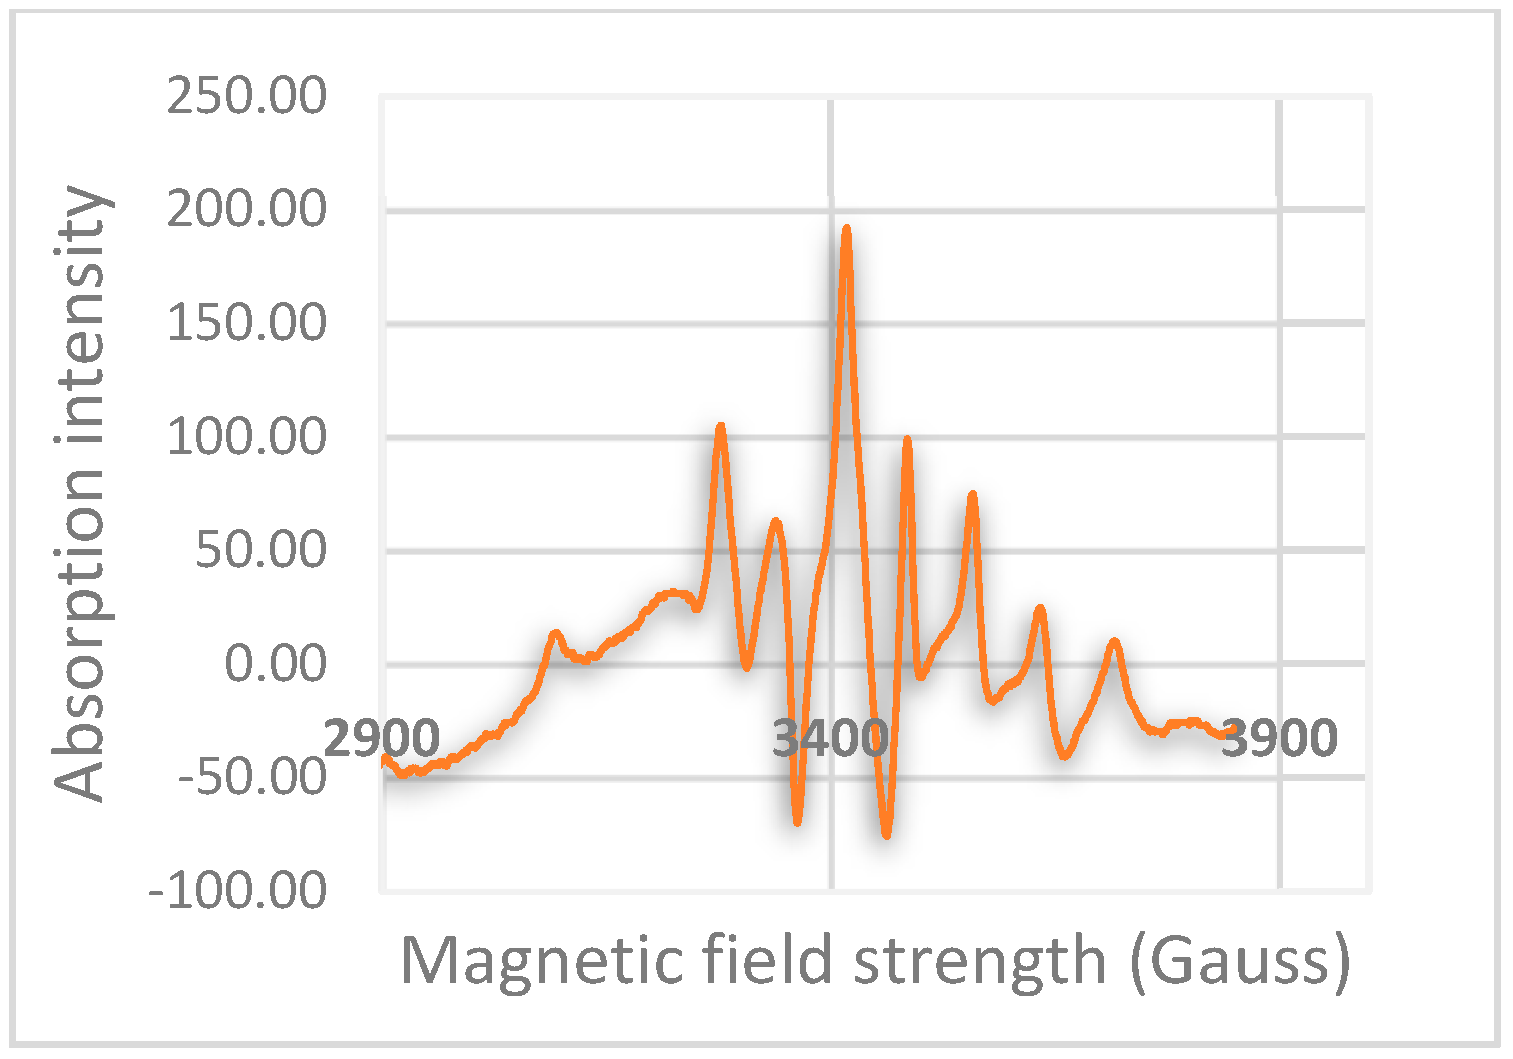
The VO–MOX-S complex exhibits paramagnetic behavior expected for vanadyl VO2+ (V(IV), d1). Its effective magnetic moment ( μ e f f = 2.78 BM, Table S6) is appreciably higher than the spin-only value expected for an isolated d 1 oxidovanadium(IV) center (1.73 BM). Given that magnetically dilute mononuclear vanadyl complexes typically display magnetic moments close to this benchmark, the elevated value may reflect incomplete quenching of the orbital contribution through spin–orbit coupling and, possibly, weak solid-state magnetic interactions between neighboring vanadyl centers, which are not uncommon in crystalline vanadyl systems [57]. In the UV–Vis spectrum, the VO(IV) complex shows ligand-centered bands in the UV region together with a low-energy transition typical of vanadyl species in an axially distorted ligand field; this is commonly discussed in terms of d–d/LMCT contributions for VO2+, in which the strong V=O bond defines the axial direction and stabilizes an equatorial electronic structure compatible with square-pyramidal coordination. Most decisively, the X-band EPR spectrum (Figure 6) displays the characteristic vanadyl signal with axial anisotropy and g < g , a hallmark of VO2+ in an axially symmetric environment in which the unpaired electron is largely associated with an equatorial d x y -type orbital. Importantly, the spectrum retains a discernible hyperfine structure attributable to 51V (I = 7/2), indicating that any V···V exchange coupling is not strong enough to collapse/broaden the hyperfine pattern. Therefore, while the magnetic moment suggests the possibility of weak association in the solid state, the EPR data are more consistent with mononuclear-like VO2+ centers under the measurement conditions and do not, by themselves, confirm a binuclear or polymeric electronic structure [58,59,60,61].
The Gd(III)–MOX-S complex displays a magnetic moment of 8.27 BM, consistent with the 4f7 electronic configuration expected for Gd(III). Its UV–Vis spectrum is dominated by ligand-centered and charge-transfer transitions, as commonly observed for lanthanide complexes where f–f bands are weak in intensity.
UV–visible spectra for all complexes recorded from 1 to 72 h showed no observable shifts or changes in spectral features, indicating stability in solution over this period.

2.2.4. Thermal Analysis

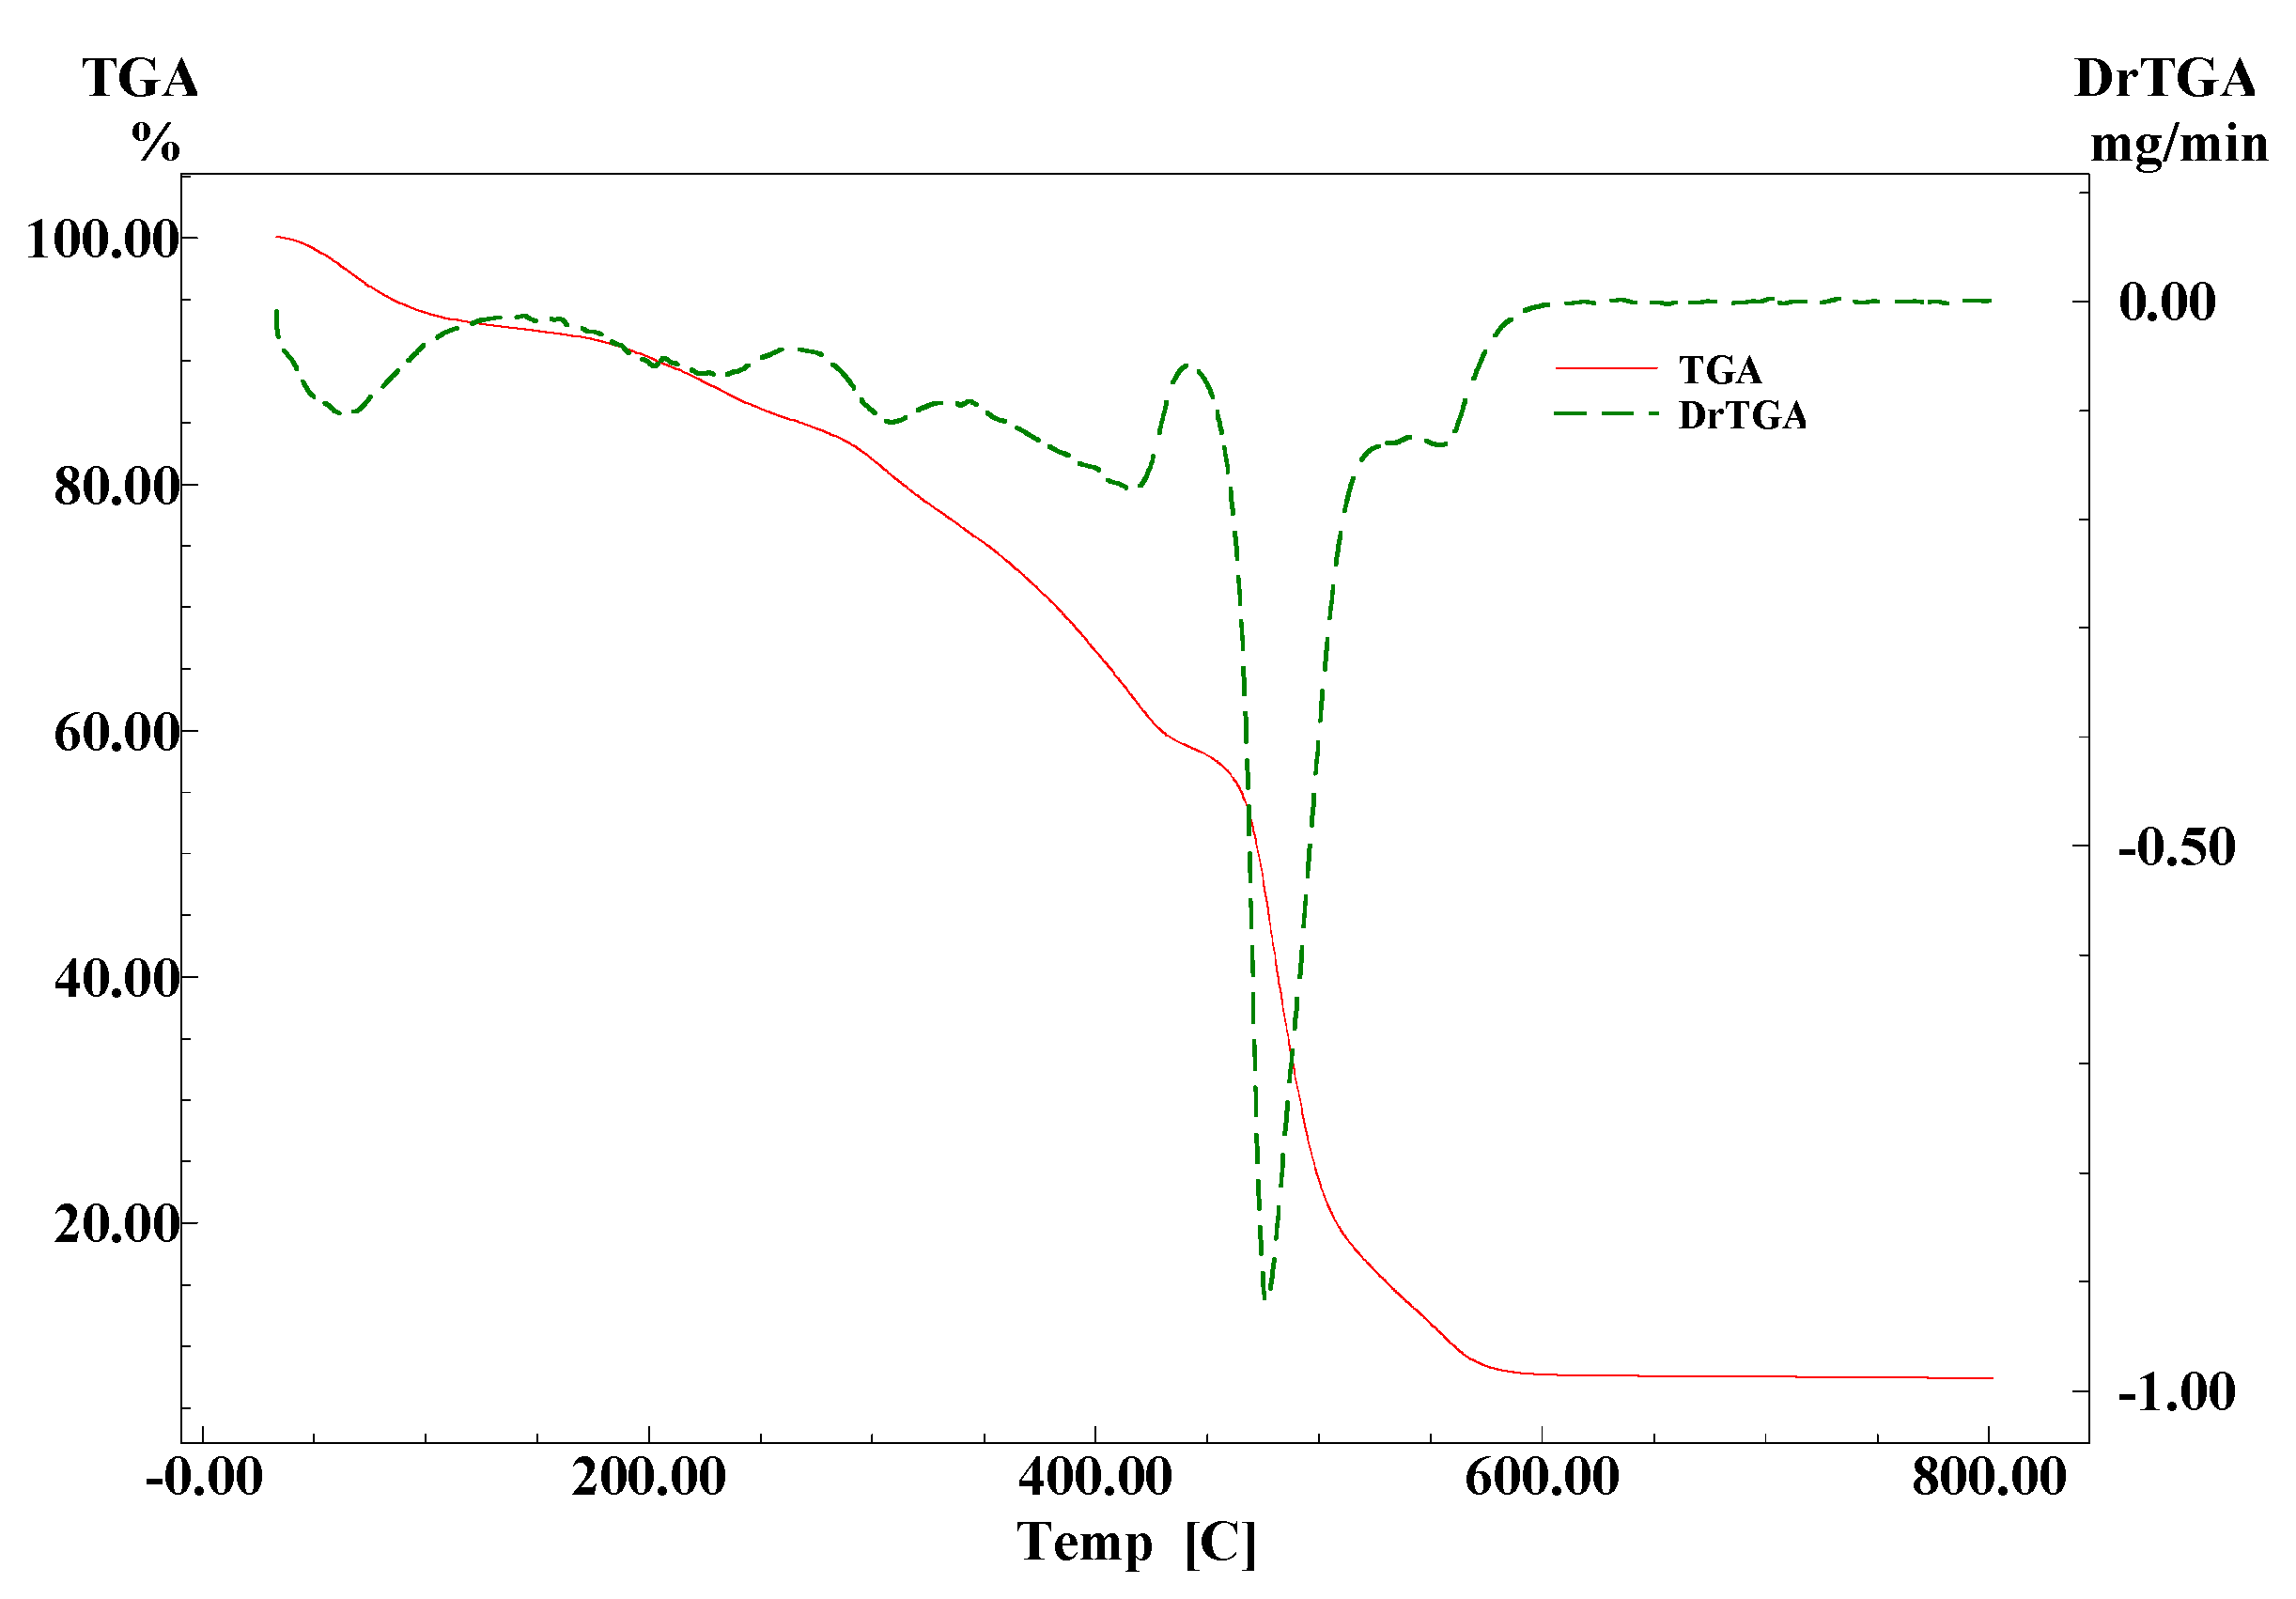
Thermal stability and decomposition behavior of MOX-S and its metal complexes were evaluated by thermogravimetric analysis (TGA) and derivative thermogravimetry (DTG) (Figure 7 and Figures S17–S21; Table S4). Where available, reference is made to DTA features to support the assignment of major decomposition events.
MOX-S Ligand
MOX-S undergoes multi-step decomposition in three main stages. An initial low-temperature mass-loss event is attributed to loss of weakly held moisture/solvent [62]. A second stage, assigned to partial degradation of the ligand framework, occurs over 143–472 °C with a mass loss of 31.9% (calcd. 30.86%) and is accompanied by an exothermic DTA signal centered at 338 °C. The final stage corresponds to extensive oxidative decomposition of the remaining organic residue over 472–610 °C, with a mass loss of 59.70% (calcd. 59.85%), showing a DTG maximum at 554 °C and a corresponding exothermic DTA peak at 550 °C, consistent with combustion of the remaining organic framework.
Metal Complexes
All complexes exhibit dehydration followed by progressive decomposition of the coordinated ligand framework and associated components (Figure 5 and Figures S11–S15; Table S4) [63]. The first decomposition step corresponds to loss of hydration (lattice) water and occurs in the ranges of 33–150 °C (Co), 33–141 °C (Ni), 30–146 °C (Cu), 36–141 °C (VO), and 32–120 °C (Gd), with DTG maxima at 67, 67, 82, 63, and 48 °C, respectively. The corresponding mass losses (found/calculated) are 5.50/5.63% (Co), 7.46/7.15% (Ni), 4.40/4.30% (Cu), 3.70/3.60% (VO), and 3.80/3.70% (Gd), consistent with removal of approximately 4, 5, 3, 2.5, and 3 water molecules of crystallization, respectively.
At higher temperatures, decomposition proceeds through additional steps associated with oxidative breakdown of the coordinated organic ligand. The second decomposition stage is attributed to degradation of the Schiff-base ligand framework, accompanied by elimination of other coordinated moieties. This step occurs over 208–454 °C (Co), 141–441 °C (Ni), 146–205 °C (Cu), 141–397 °C (VO), and 120–447 °C (Gd). The recorded mass losses (found/calculated) are 28.80/28.24% (Co), 33.98/33.34% (Ni), 26.20/26.66% (Cu), 56.80/55.45% (VO), and 40.40/40.45% (Gd), supporting the proposed formulations.
A third, high-temperature stage is observed for Co(II), Ni(II), Cu(II), VO(IV), and Gd(III) complexes and is assigned to continued degradation of the residual organic content with formation of thermally stable inorganic residues. These events occur over 454–644 °C (Co), 441–800 °C (Ni), 454–800 °C (Cu), 397–800 °C (VO), and 447–600 °C (Gd), with reported DTG maxima at 500, 477, 589, 460, and 491 °C, respectively. The residual masses at the end of the thermal program are consistent with formation of metal-containing residues (e.g., metal oxides and/or mixed inorganic remnants), in agreement with calculated metal contents summarized in Table S4.

2.2.5. Kinetic and Thermodynamic Parameters

Thermogravimetric data for MOX-S and its metal complexes were analyzed using the Coats–Redfern integral method to estimate the apparent kinetic and activation parameters for the selected ligand-decomposition step, including the activation energy (Ea), reaction order (n), pre-exponential factor (A or Z), and activation thermodynamic parameters (ΔS‡, ΔH‡, and ΔG‡) (Table S5) [64,65]. The linear Coats–Redfern plots (Figure S22) showed good correlation coefficients (R2 = 0.978–0.997), indicating satisfactory internal consistency of the fitted model within the selected decomposition interval; however, these values should be interpreted as model-dependent kinetic estimates rather than definitive proof of a unique decomposition mechanism [66].
Activation Energy and Apparent Kinetic Stability
A strong metal-dependent trend is observed in Ea (Table S5; Figure S23). The Co–MOX-S and Ni–MOX-S complexes display very high apparent activation energies (695.22 and 666.70 kJ mol−1, respectively), indicating the greatest resistance to thermal degradation within the fitted region. The free ligand MOX-S shows an intermediate Ea = 210.93 kJ mol−1. In contrast, Cu–MOX-S and Gd–MOX-S exhibit lower barriers (129.45 and 127.29 kJ mol−1), while VO–MOX-S presents the lowest value (9.73 kJ mol−1), corresponding to the smallest apparent barrier under the model assumptions. Accordingly, the apparent kinetic stability trend (based on Ea) may be summarized as follows:
Co–MOX-S ≈ Ni–MOX-S ≫ MOX-S > Cu–MOX-S ≈ Gd–MOX-S ≫ VO–MOX-S.
The pre-exponential factor (Z) varies markedly across the series and is exceptionally large for Co–MOX-S (1.16 × 1047) and Ni–MOX-S (2.71 × 1046), indicating substantial differences in the fitted decomposition kinetics relative to the other systems [36,67].
Entropy of Activation and Character of the Activated State
The sign and magnitude of ΔS provide qualitative information on the relative organization of the activated state during the fitted decomposition step. The slightly negative ΔS value of MOX-S (−2.44 J K−1 mol−1) suggests only a marginal decrease in configurational freedom in the activated state relative to the initial state. More negative values obtained for Cu–MOX-S (−108.54 J K−1 mol−1) and VO–MOX-S (−253.57 J K−1 mol−1) indicate these are associated with a more ordered or constrained activated state, which is commonly a slower and more organized decomposition process. By contrast, Gd–MOX-S shows a very slightly positive value (0.67 J K−1 mol−1), whereas Co–MOX-S (648.25 J K−1 mol−1) and Ni–MOX-S (636.43 J K−1 mol−1) exhibit unusually large positive apparent ΔS values. These positive values may indicate a less ordered transition state or greater configurational freedom during the fitted decomposition step; however, their large magnitude should be interpreted cautiously because Coats–Redfern-derived activation entropies are model-dependent and strongly influenced by the calculated pre-exponential factor and the selected decomposition interval [68].
Thermodynamic Activation Functions and Reporting Caution
The activation functions ΔH and ΔG listed in Table S5 are those obtained directly from the Coats–Redfern treatment for the selected decomposition interval. Because thermal decomposition is multi-step and model-dependent, Coats–Redfern-derived activation quantities can exhibit atypical magnitudes and/or signs and should be interpreted as apparent parameters describing the fitted region rather than values of absolute thermodynamic state functions. Within this context, the reported ΔG values vary substantially across the series (Table S5), underscoring that the apparent energetic and decomposition pathways are strongly influenced by metal identity and the assumptions of the kinetic model [69].
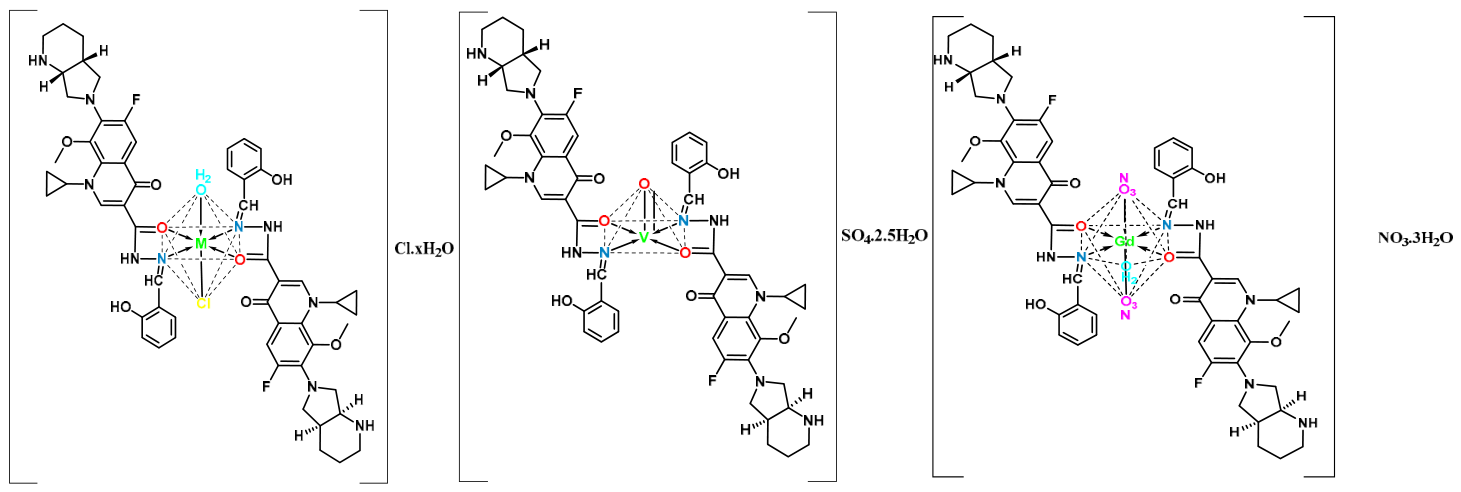
Overall, the combined UV–Vis, EPR, magnetic, thermal, conductivity, and elemental analysis data support the proposed molecular formulas and coordination geometries of the MOX-S complexes, as depicted in Figure 8.

2.3. Characterization of Gold Nano Particles (AuNPs)

Gold nanoparticles were characterized by UV–visible spectroscopy (surface plasmon resonance, SPR) and transmission electron microscopy (TEM, JEOL JEM-1400 Akishima, Tokyo, Japan) to confirm nanoparticle formation, assess dispersion, and estimate particle size. In addition, UV–visible spectra of the functionalized systems (MOX-S@AuNPs and Cu–MOX-S@AuNPs) were used to qualitatively verify surface loading through retention of ligand-centered absorptions and SPR band shifts.

2.3.1. UV–Visible Spectra of AuNPs

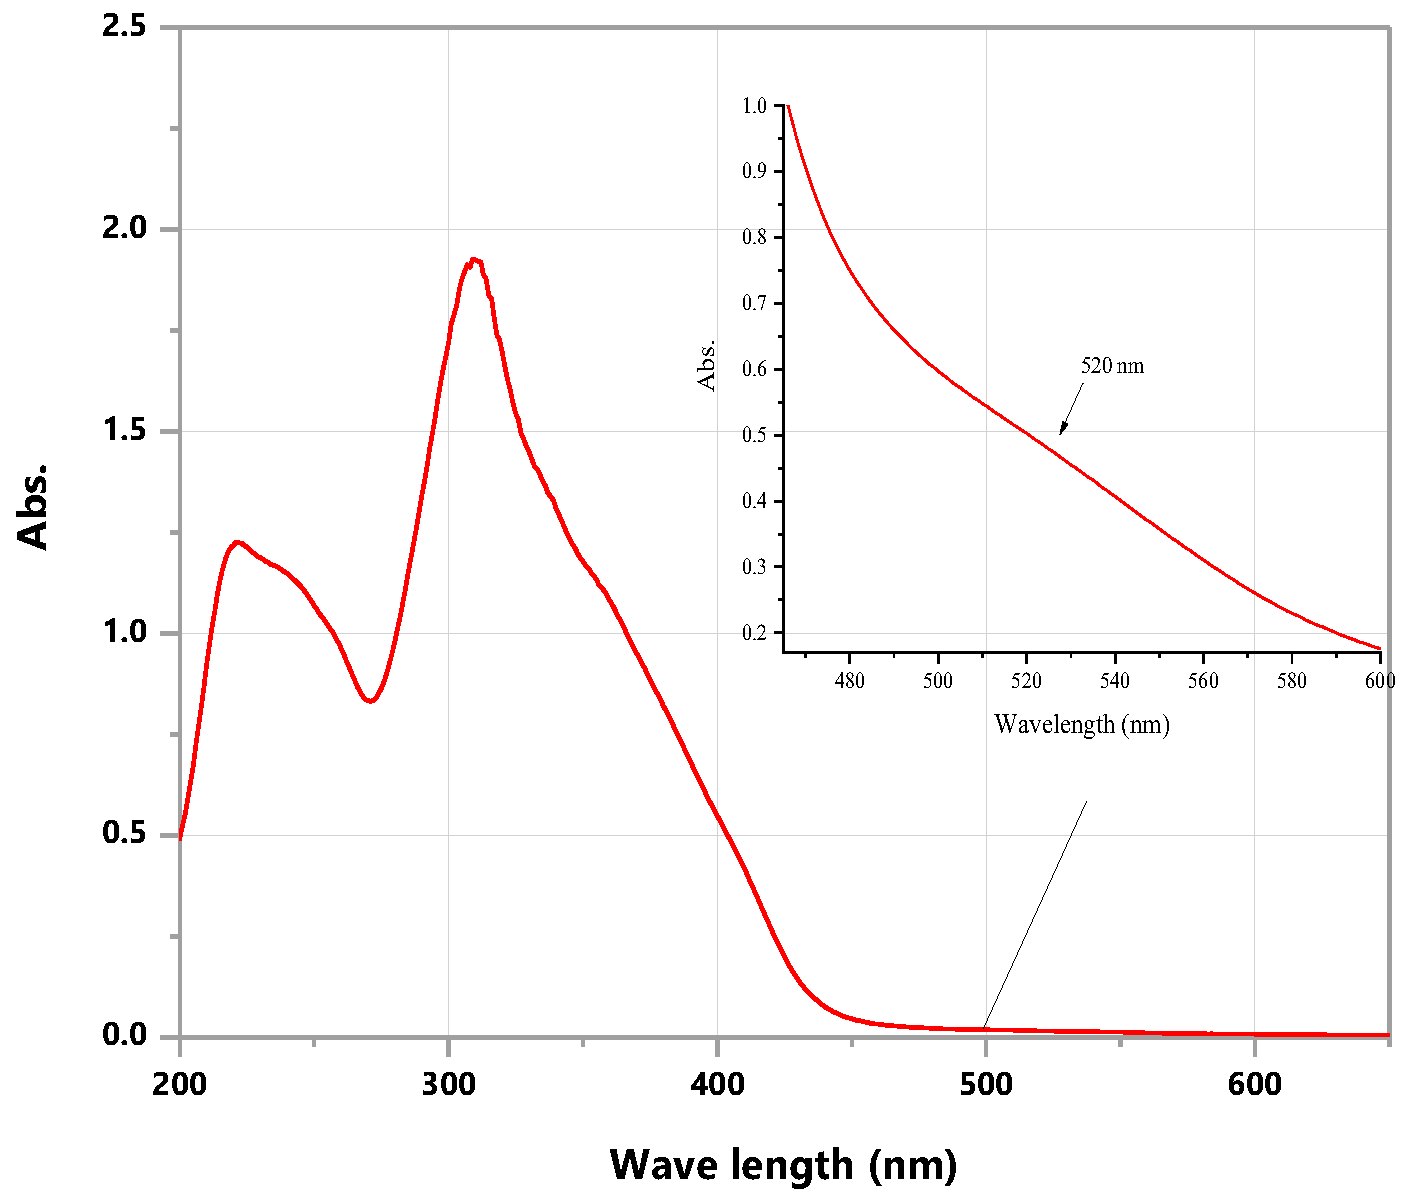
Colloidal AuNPs exhibit a diagnostic SPR absorption band in the visible region, which serves as a primary indicator of nanoparticle formation and dispersion. The UV–visible spectrum of the as-prepared AuNP colloid shows a sharp, intense SPR band centered at 520 nm (Figure S24), consistent with well-dispersed, predominantly spherical AuNPs. The AuNP concentration was estimated using the Beer–Lambert law, employing a reported molar extinction coefficient of ε = 2.43 × 10⁸ M−1 cm−1 at λ = 520 nm for ~10 nm spherical AuNPs (path length = 1.00 cm). Using the absorbance at λmax, the AuNP concentration was calculated to be approximately 15 nM [70,71].
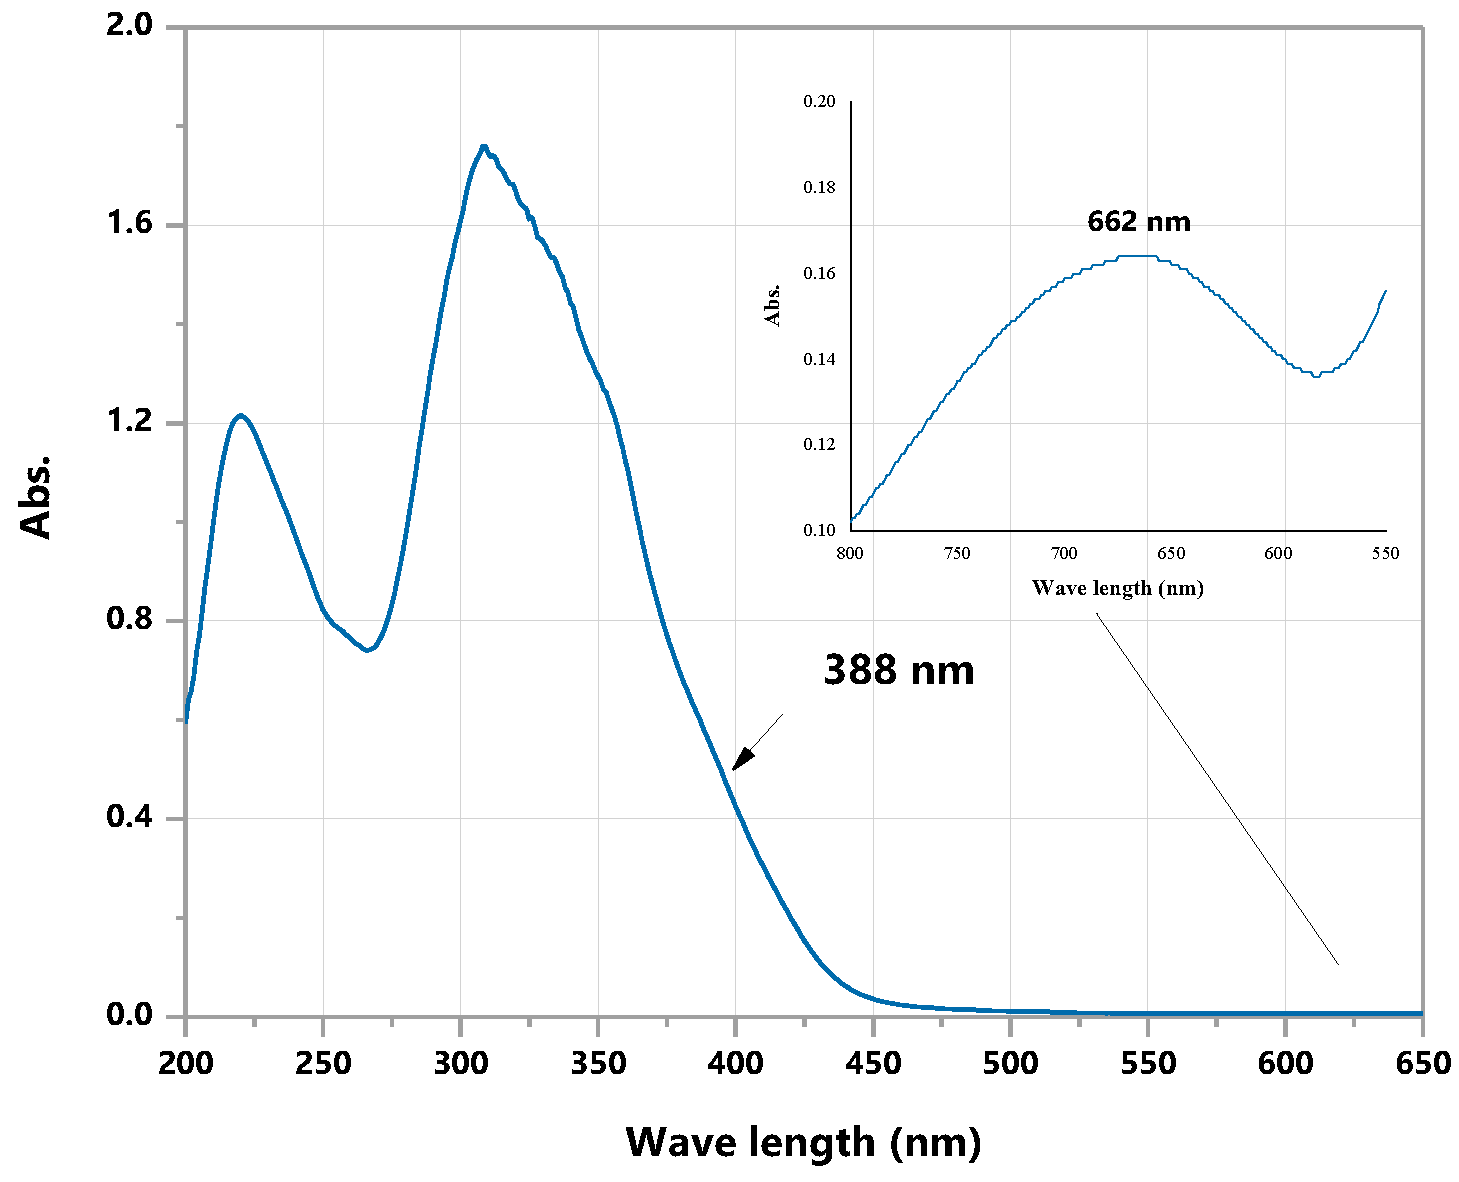
Electronic absorption spectra of the functionalized AuNP systems support interaction of MOX-S and its Cu(II) complex with the nanoparticle surface (Figures S25 and S26; Table S8). For MOX-S@AuNPs, absorption bands appear at 211, 307, and 535 nm, while Cu–MOX-S@AuNPs shows corresponding bands at 211, 309, and 537 nm. Relative to the parent AuNPs, the modest SPR red shift from 520 nm to 535–537 nm, together with persistence of ligand-centered UV absorptions, is consistent with successful surface functionalization and changes in the local dielectric environment at the AuNP interface.

2.3.2. Transmission Electron Microscopy (TEM) of AuNPs

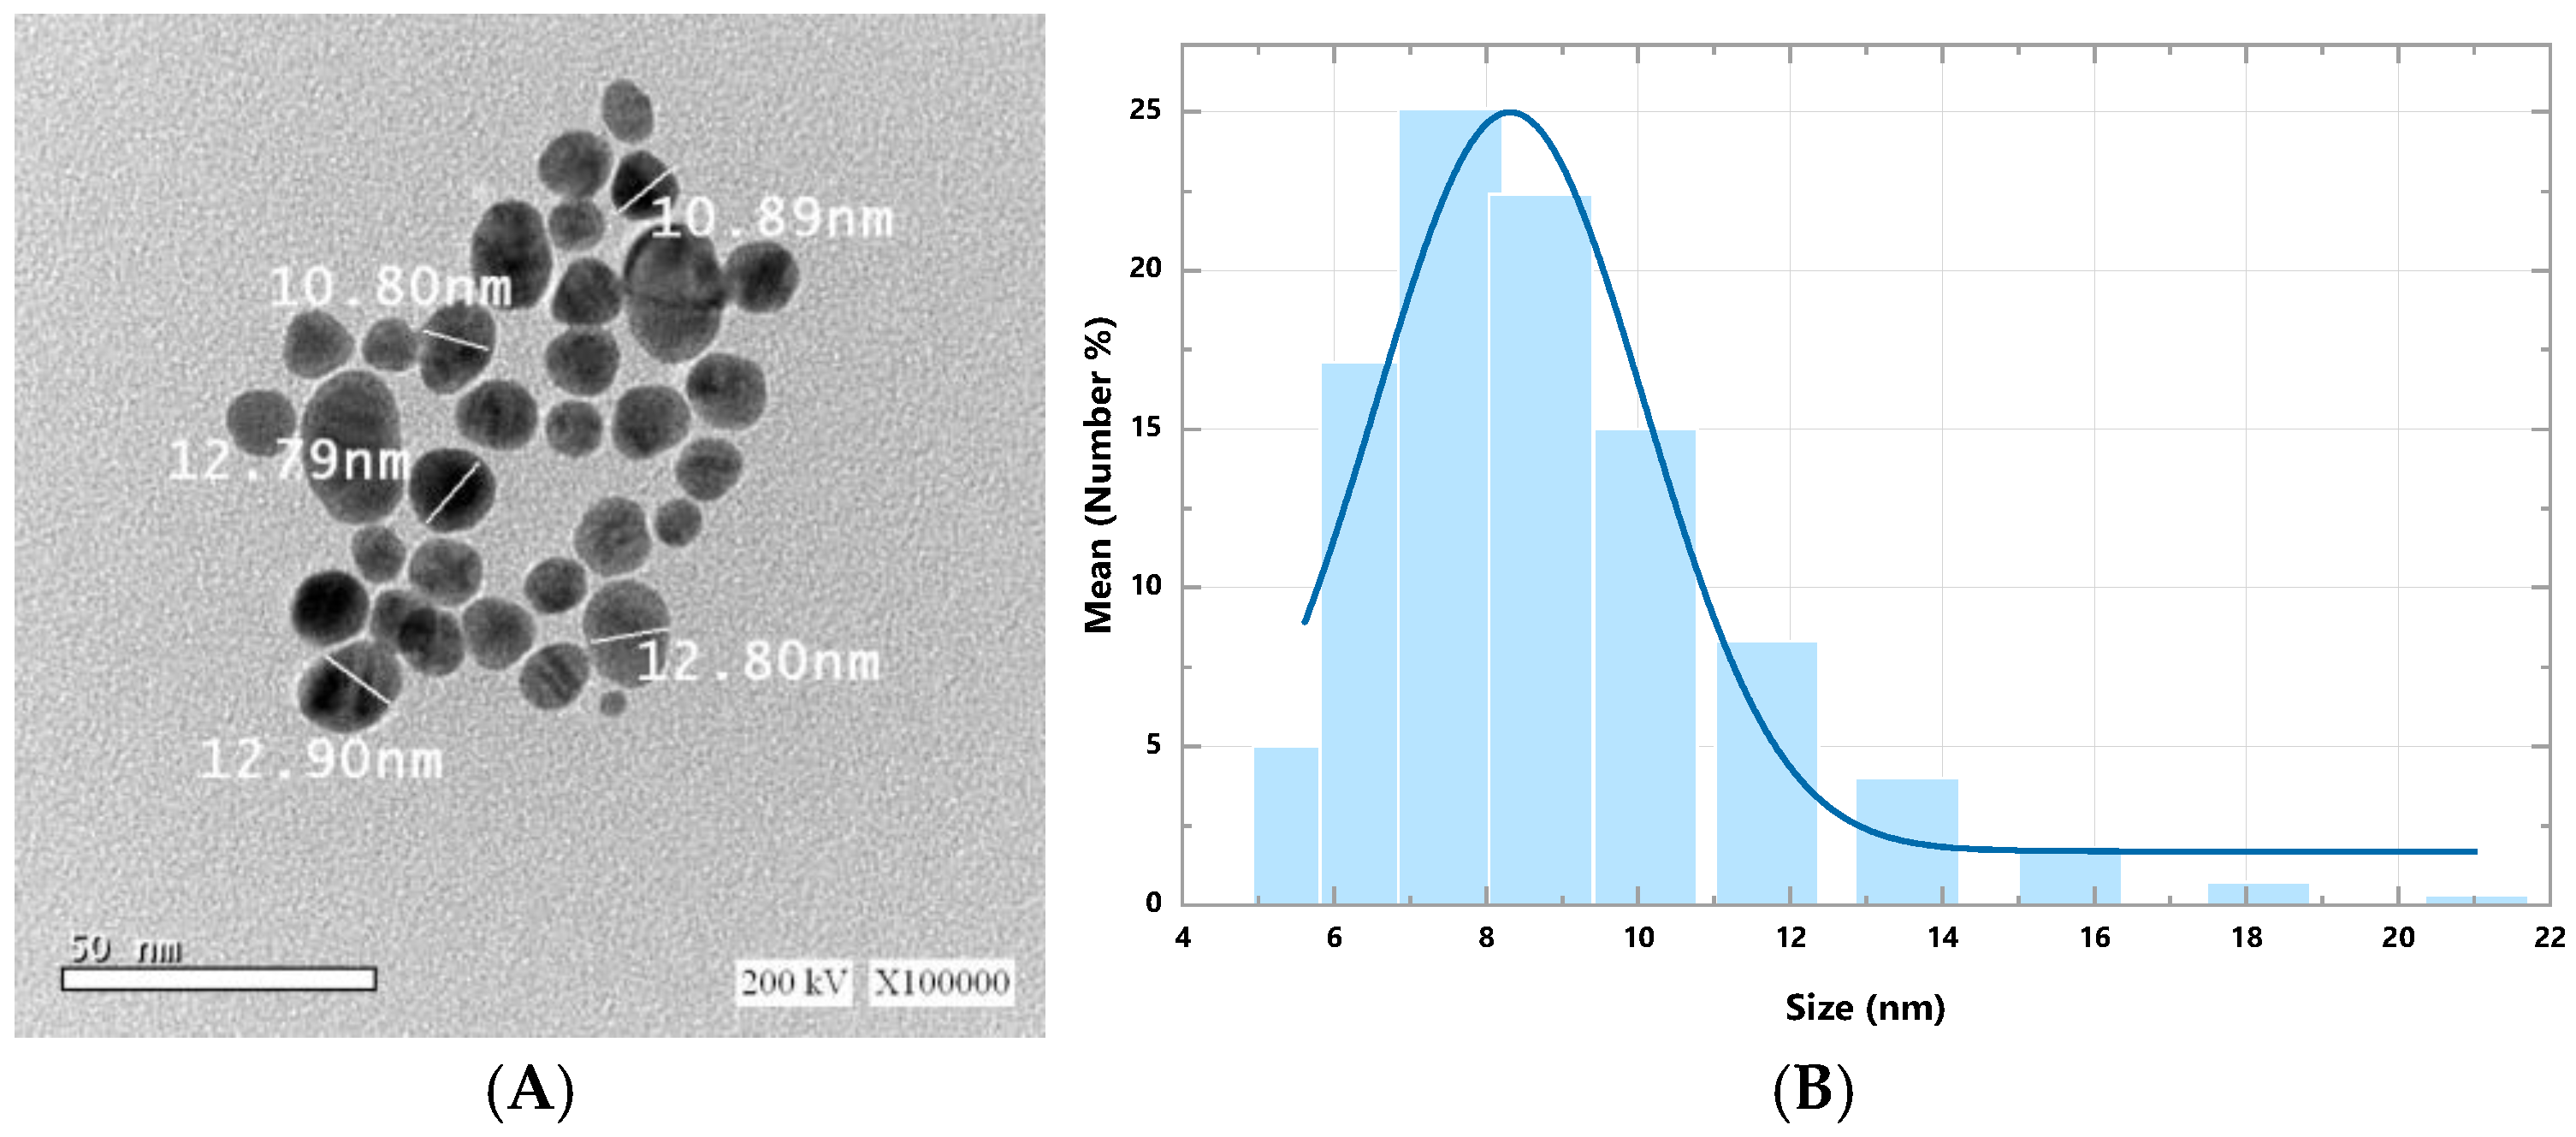
Transmission electron microscopy (TEM) was used to evaluate AuNP morphology and size distribution (Figure 9). The TEM image (Figure 9A) shows well-defined, nearly spherical nanoparticles with good dispersion and limited aggregation. The corresponding size histogram (Figure 9B) indicates a relatively narrow size distribution centered around the expected nanometer range, supporting controlled and reproducible nanoparticle preparation under the applied conditions [70].

2.4. Computational Assessment

2.4.1. DFT, Vibrational, Electronic, and Surface Characterization of MOX-S

The molecular structure of MOX-S was examined using density functional theory (DFT) and compared with the experimental FT-IR results (Table S9, Figures S27 and S28). Geometry optimization was performed at the B3LYP/6-31G(d) level in the gas phase, followed by harmonic vibrational frequency calculations to confirm a true minimum (no imaginary frequencies). The optimized structure supports successful condensation to the Schiff-base form, as evidenced by the establishment of the azomethine linkage and the absence of structural features consistent with an unreacted terminal –NH2 group. The calculated vibrational spectrum reproduces key experimental trends associated with Schiff-base formation, including the downward shift in the azomethine stretching mode (experimental 1587 → 1549 cm−1) and attenuation of the carbonyl-related band intensity near 1675 cm−1, consistent with electron-density redistribution within the conjugated framework.
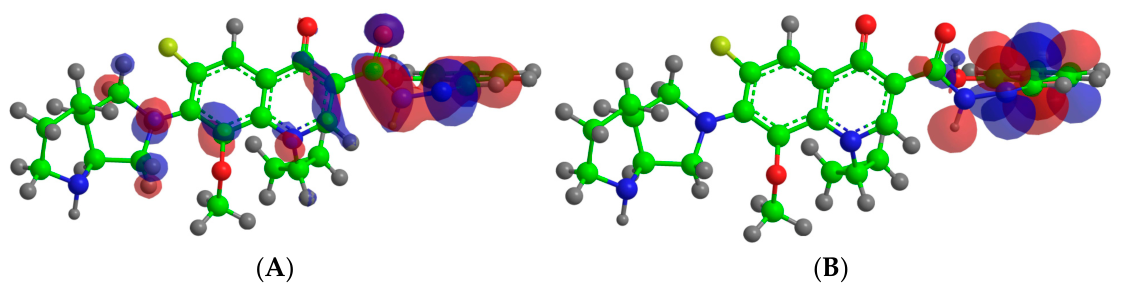
Frontier molecular orbitals and global reactivity descriptors were computed to probe electronic properties (Figure 10; Table S10). MOX-S shows EHOMO = −0.211 au and ELUMO = −0.067 au, giving a HOMO–LUMO gap of ΔE = 0.144 au (3.92 eV), and a calculated dipole moment of 13.76 D (Table S10). The derived conceptual-DFT descriptors include ionization potential I = 0.211 au, electron affinity A = 0.067 au, absolute electronegativity χ = 0.139, hardness η = 0.072, softness σ = 13.88, global softness S = 6.94, electrophilicity ω = 0.134, chemical potential μ = −0.139, and ΔNmax = 1.93 (Table S10). These computed features provide a physicochemical basis for interpreting noncovalent recognition and solvent-dependent behavior rather than direct proof of biological performance.
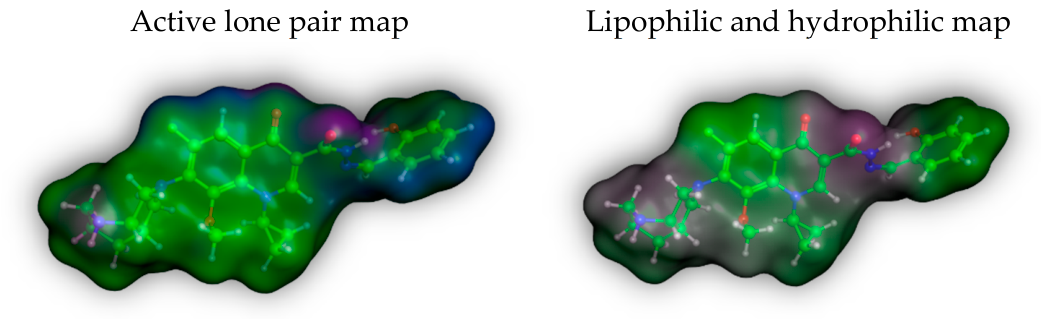
Finally, surface analyses (Figure 11) were used to visualize regions of potential intermolecular interaction. Lone pair mapping highlights multiple heteroatom-centered donor/acceptor sites across the salicylaldehyde-derived fragment and quinolone framework, while lipophilic/hydrophilic surface mapping indicates an extended hydrophobic envelope interspersed with localized polar regions, consistent with amphiphilic behavior that can influence partitioning and molecular recognition [72,73].

2.4.2. In Silico Drug Likeness, Surface Properties, Toxicity Prediction and QSAR Analysis

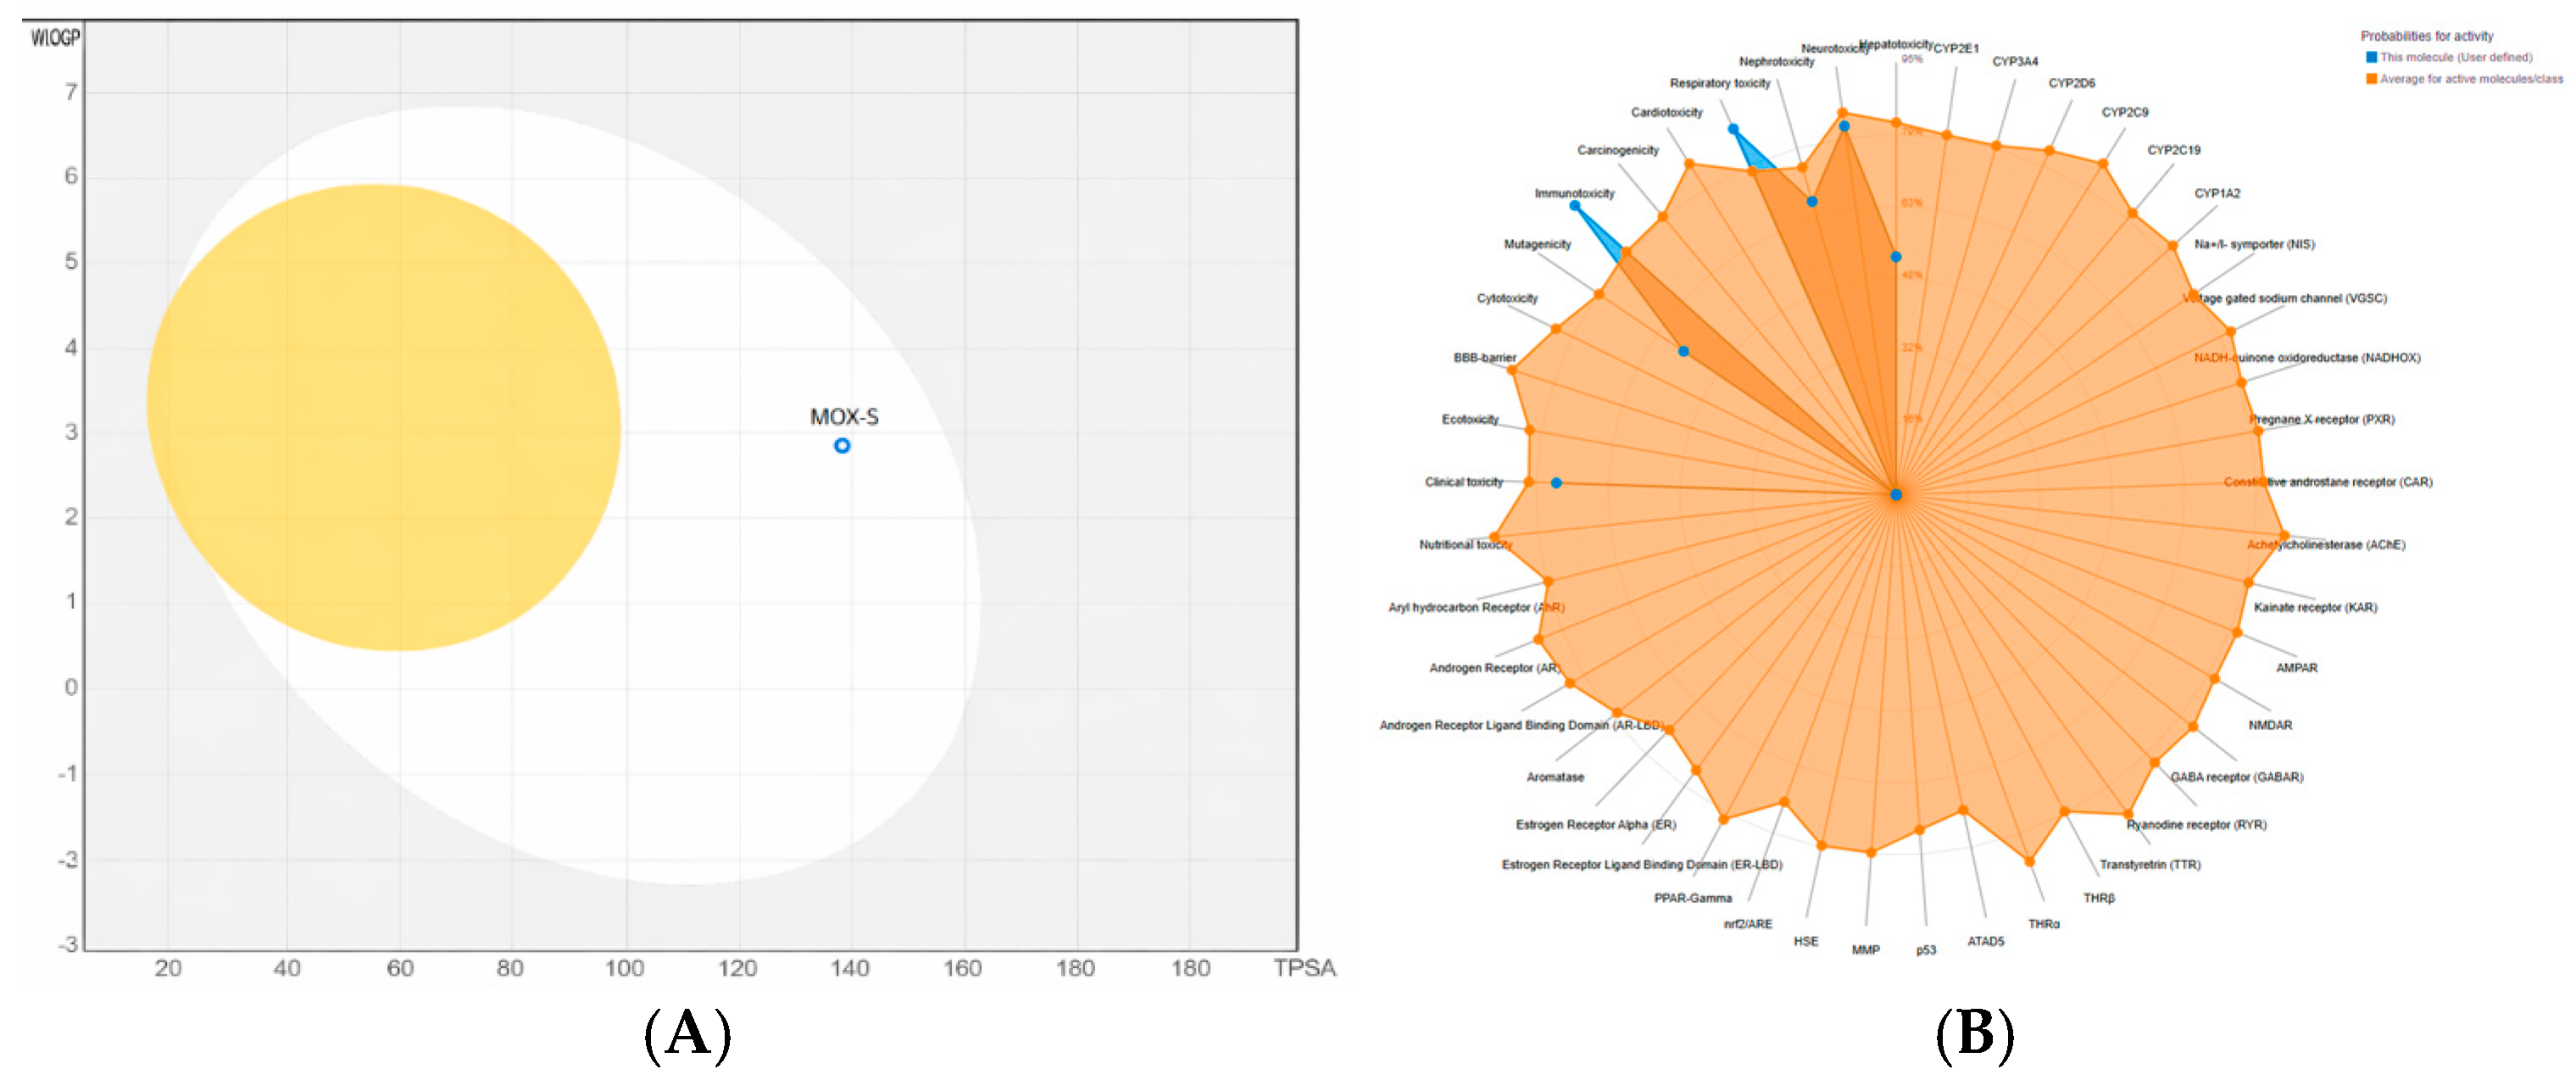
In silico assessments of drug likeness, physicochemical properties, pharmacokinetics, and toxicity for MOX-S were performed using SwissADME, MolSoft, pkCSM, and ProTox-II (v3.0), with outputs summarized in Tables S11 and S12 and visualized in Figure 12 ((A) BOILED-Egg and (B) toxicity radar). SwissADME descriptors indicate that MOX-S presents a balanced polarity–lipophilicity profile. The TPSA = 108.19 Å2 and the reported rotatable-bond count support consistency with Veber-type considerations for oral drug candidates (Tables S11 and S12). Lipinski compliance is reported as provided by the SwissADME output rather than asserted independently, as rule-based categorization depends on molecular weight and the selected LogP model.
Toxicity prediction outputs suggest a comparatively favorable profile within the limitations of in silico screening: MOX-S is predicted to be non-mutagenic (AMES) and not classified as a hERG I inhibitor, while ProTox assigns MOX-S to toxicity class IV with predicted LD50 = 2000 mg kg−1. These results should be interpreted cautiously because categorical outcomes depend on model applicability domains and training-set coverage.
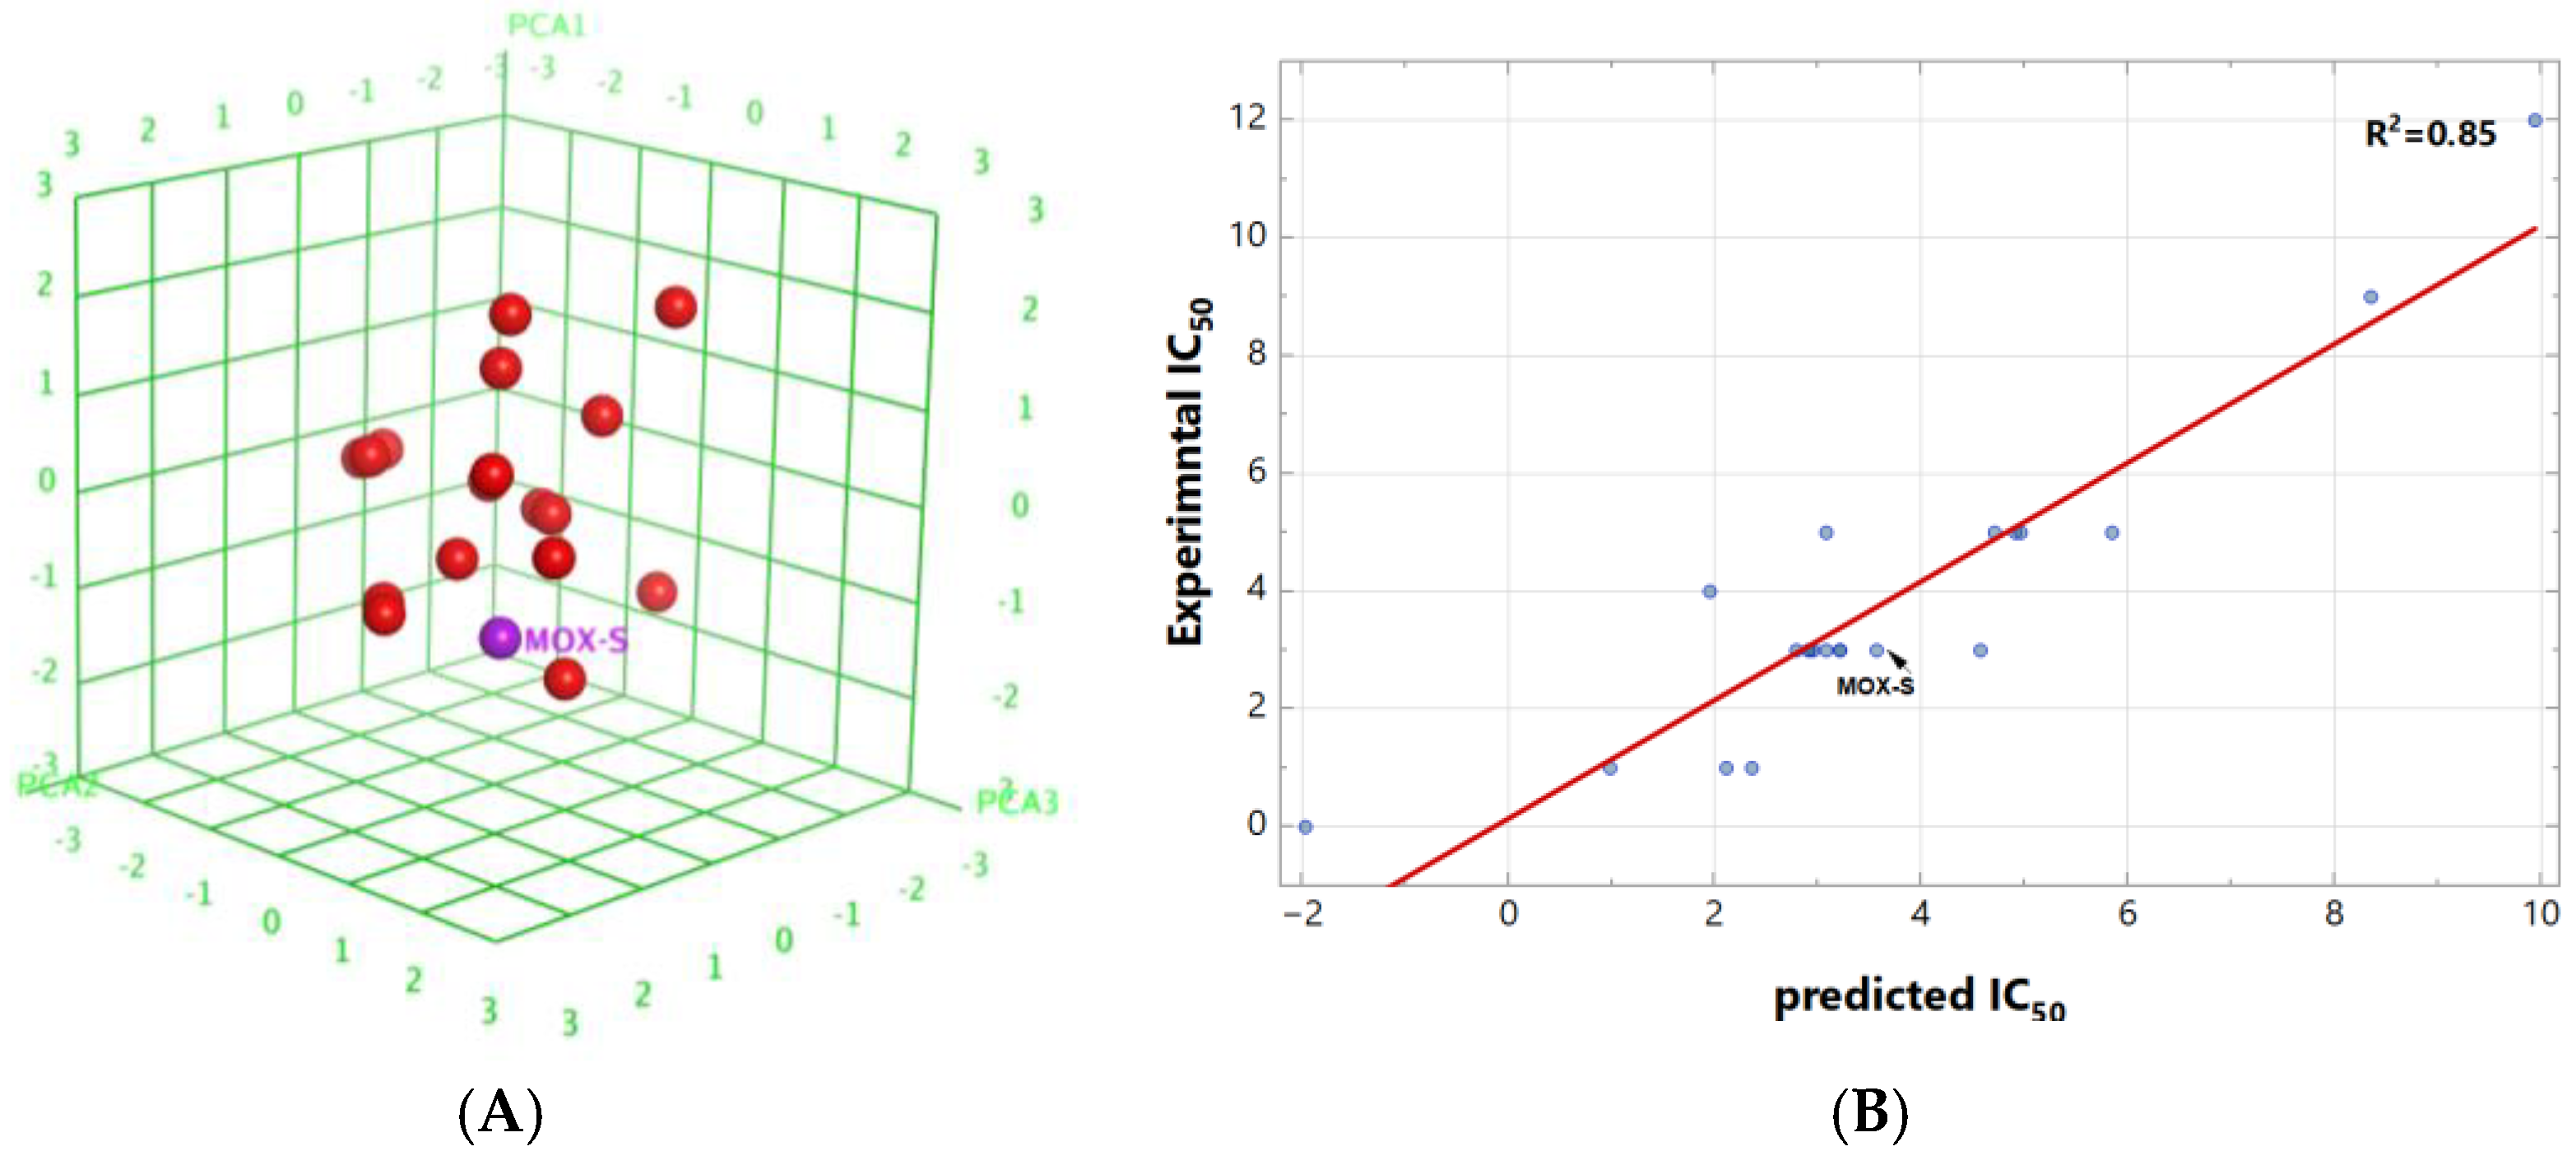
For QSAR, a model was constructed using a dataset of 25 structurally diverse fluoroquinolone derivatives with reported IC50 values. Molecular descriptors were calculated in MOE and partial least squares (PLS) regression was applied; the internal dataset structure was evaluated by PCA (Figure 13A), and the resulting PLS model showed R2 = 0.85 (Figure 13B). Within this framework, the predicted IC50 for MOX-S (3.5 µM) is in reasonable agreement with the experimental value (3.0 µM), supporting internal predictive consistency for this compound, while acknowledging limitations associated with dataset size and model dependence.

2.4.3. Molecular Docking Studies

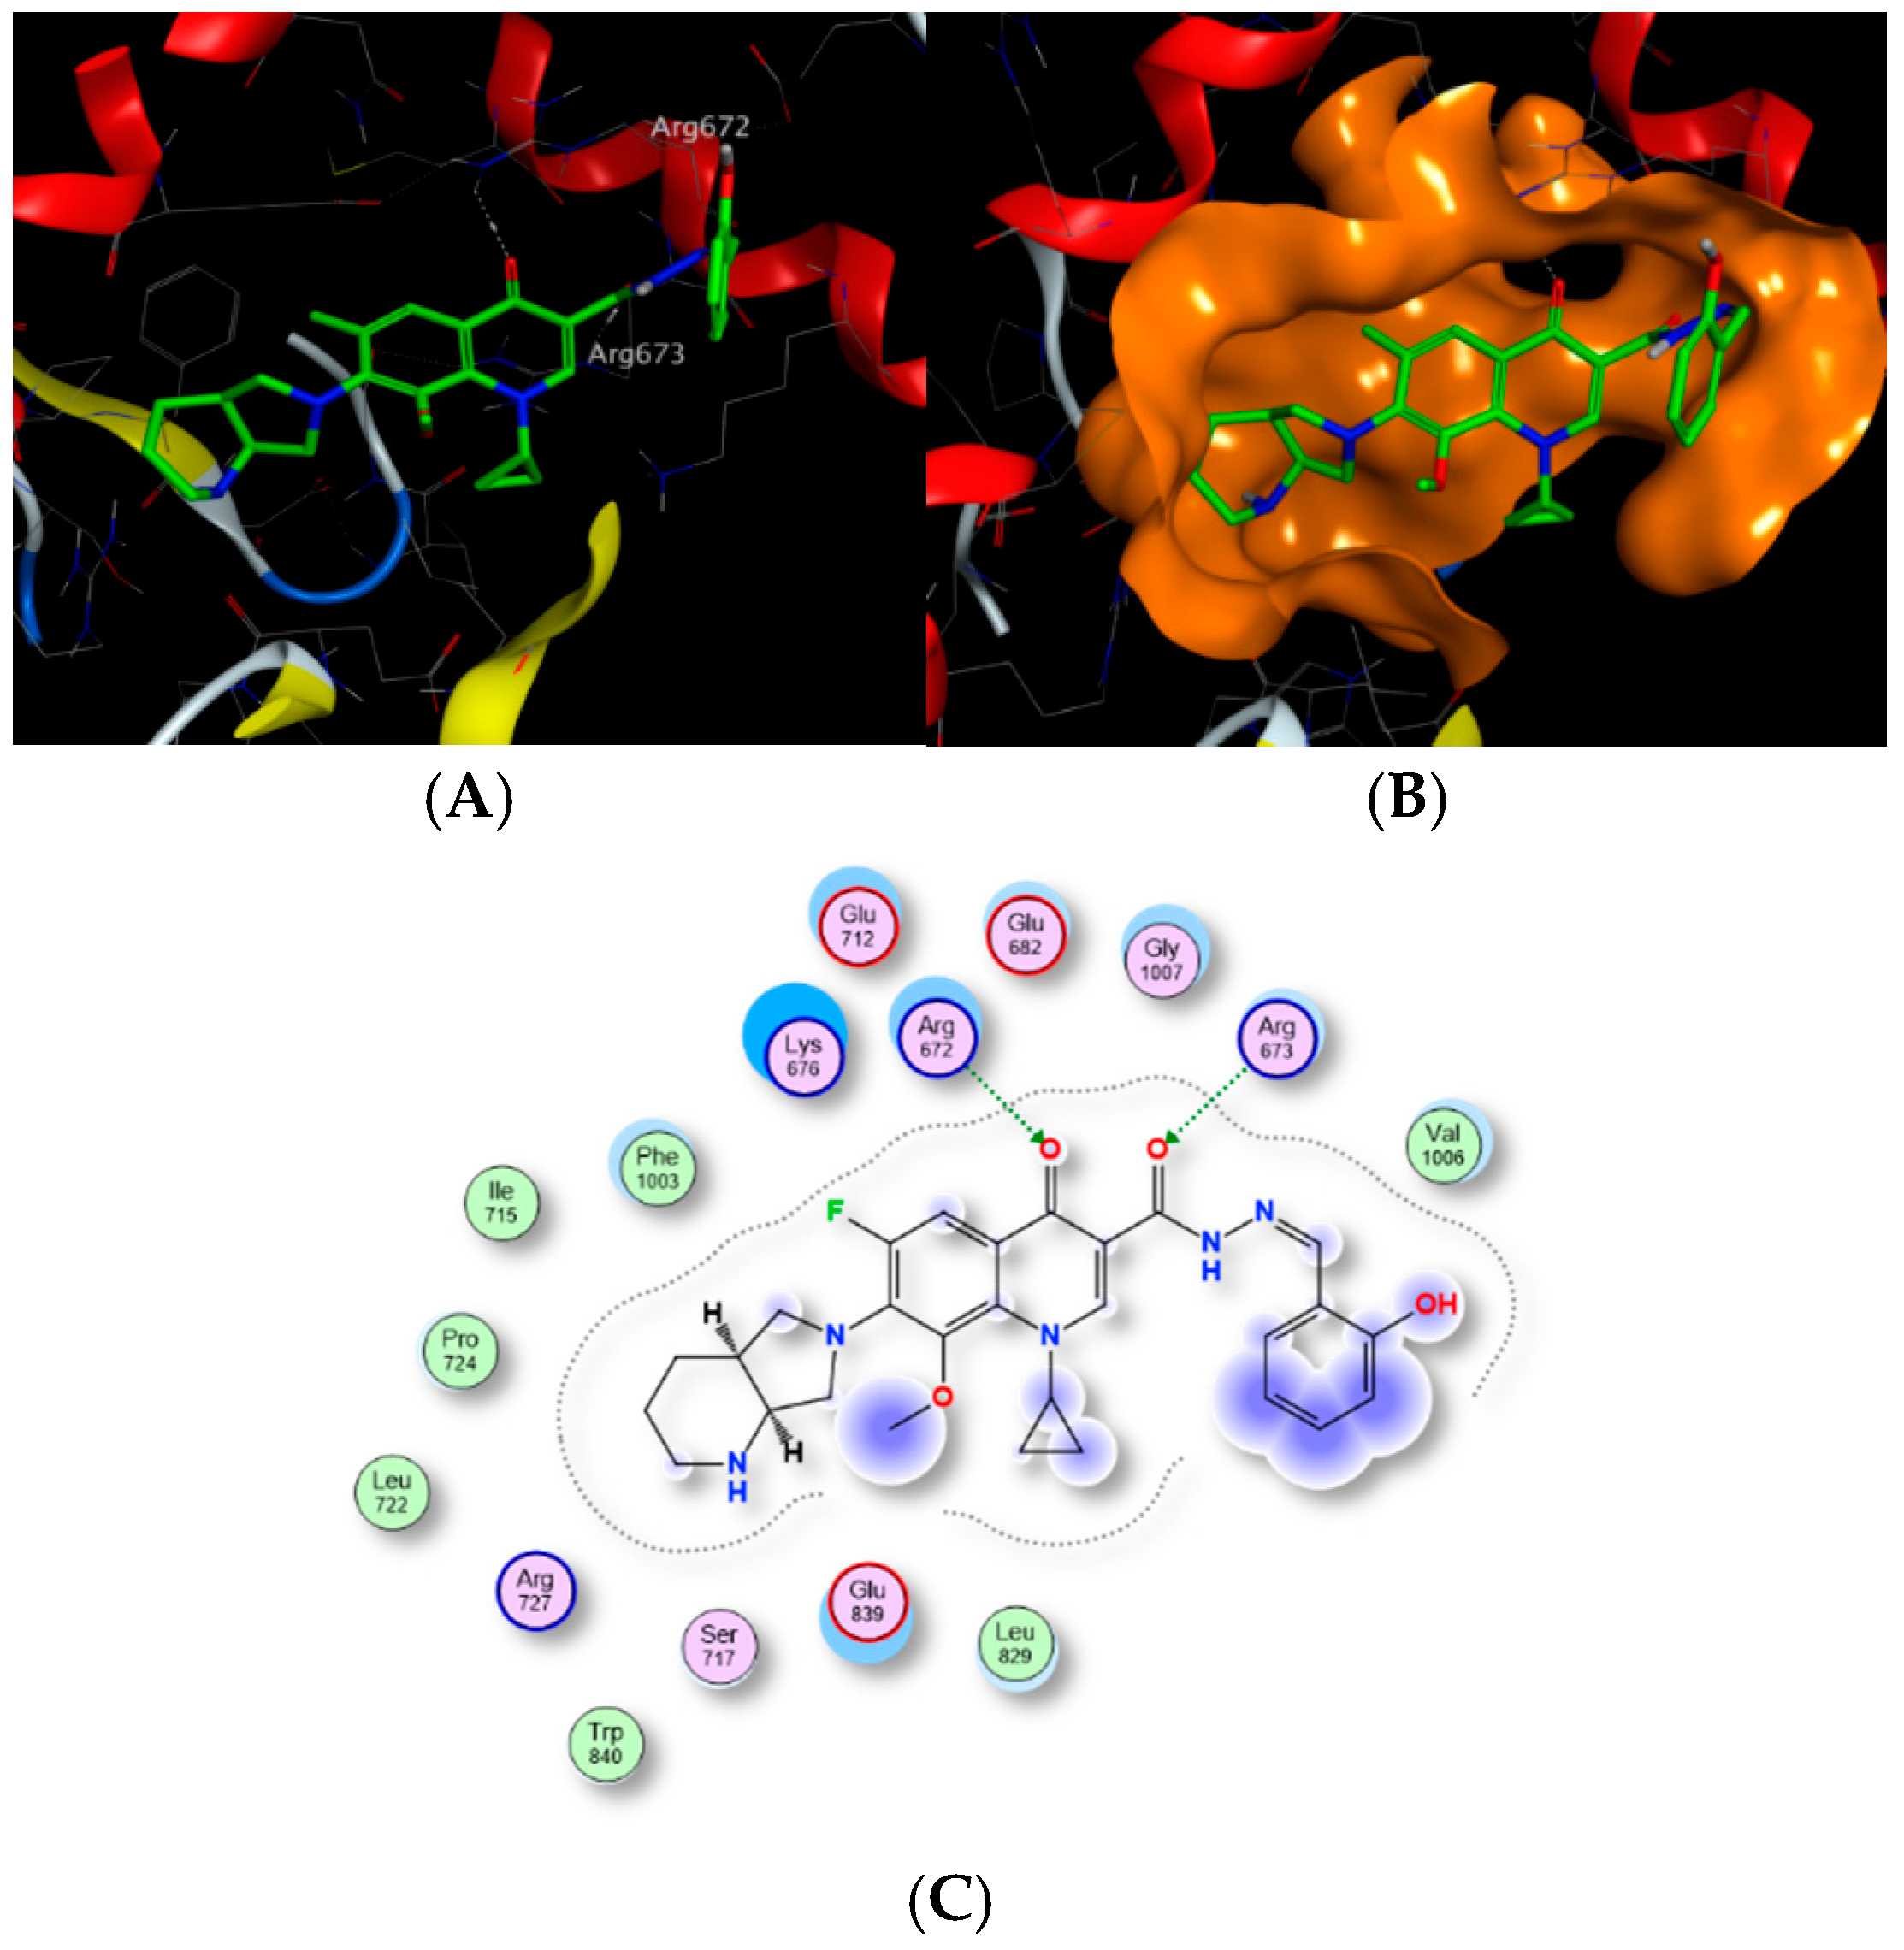
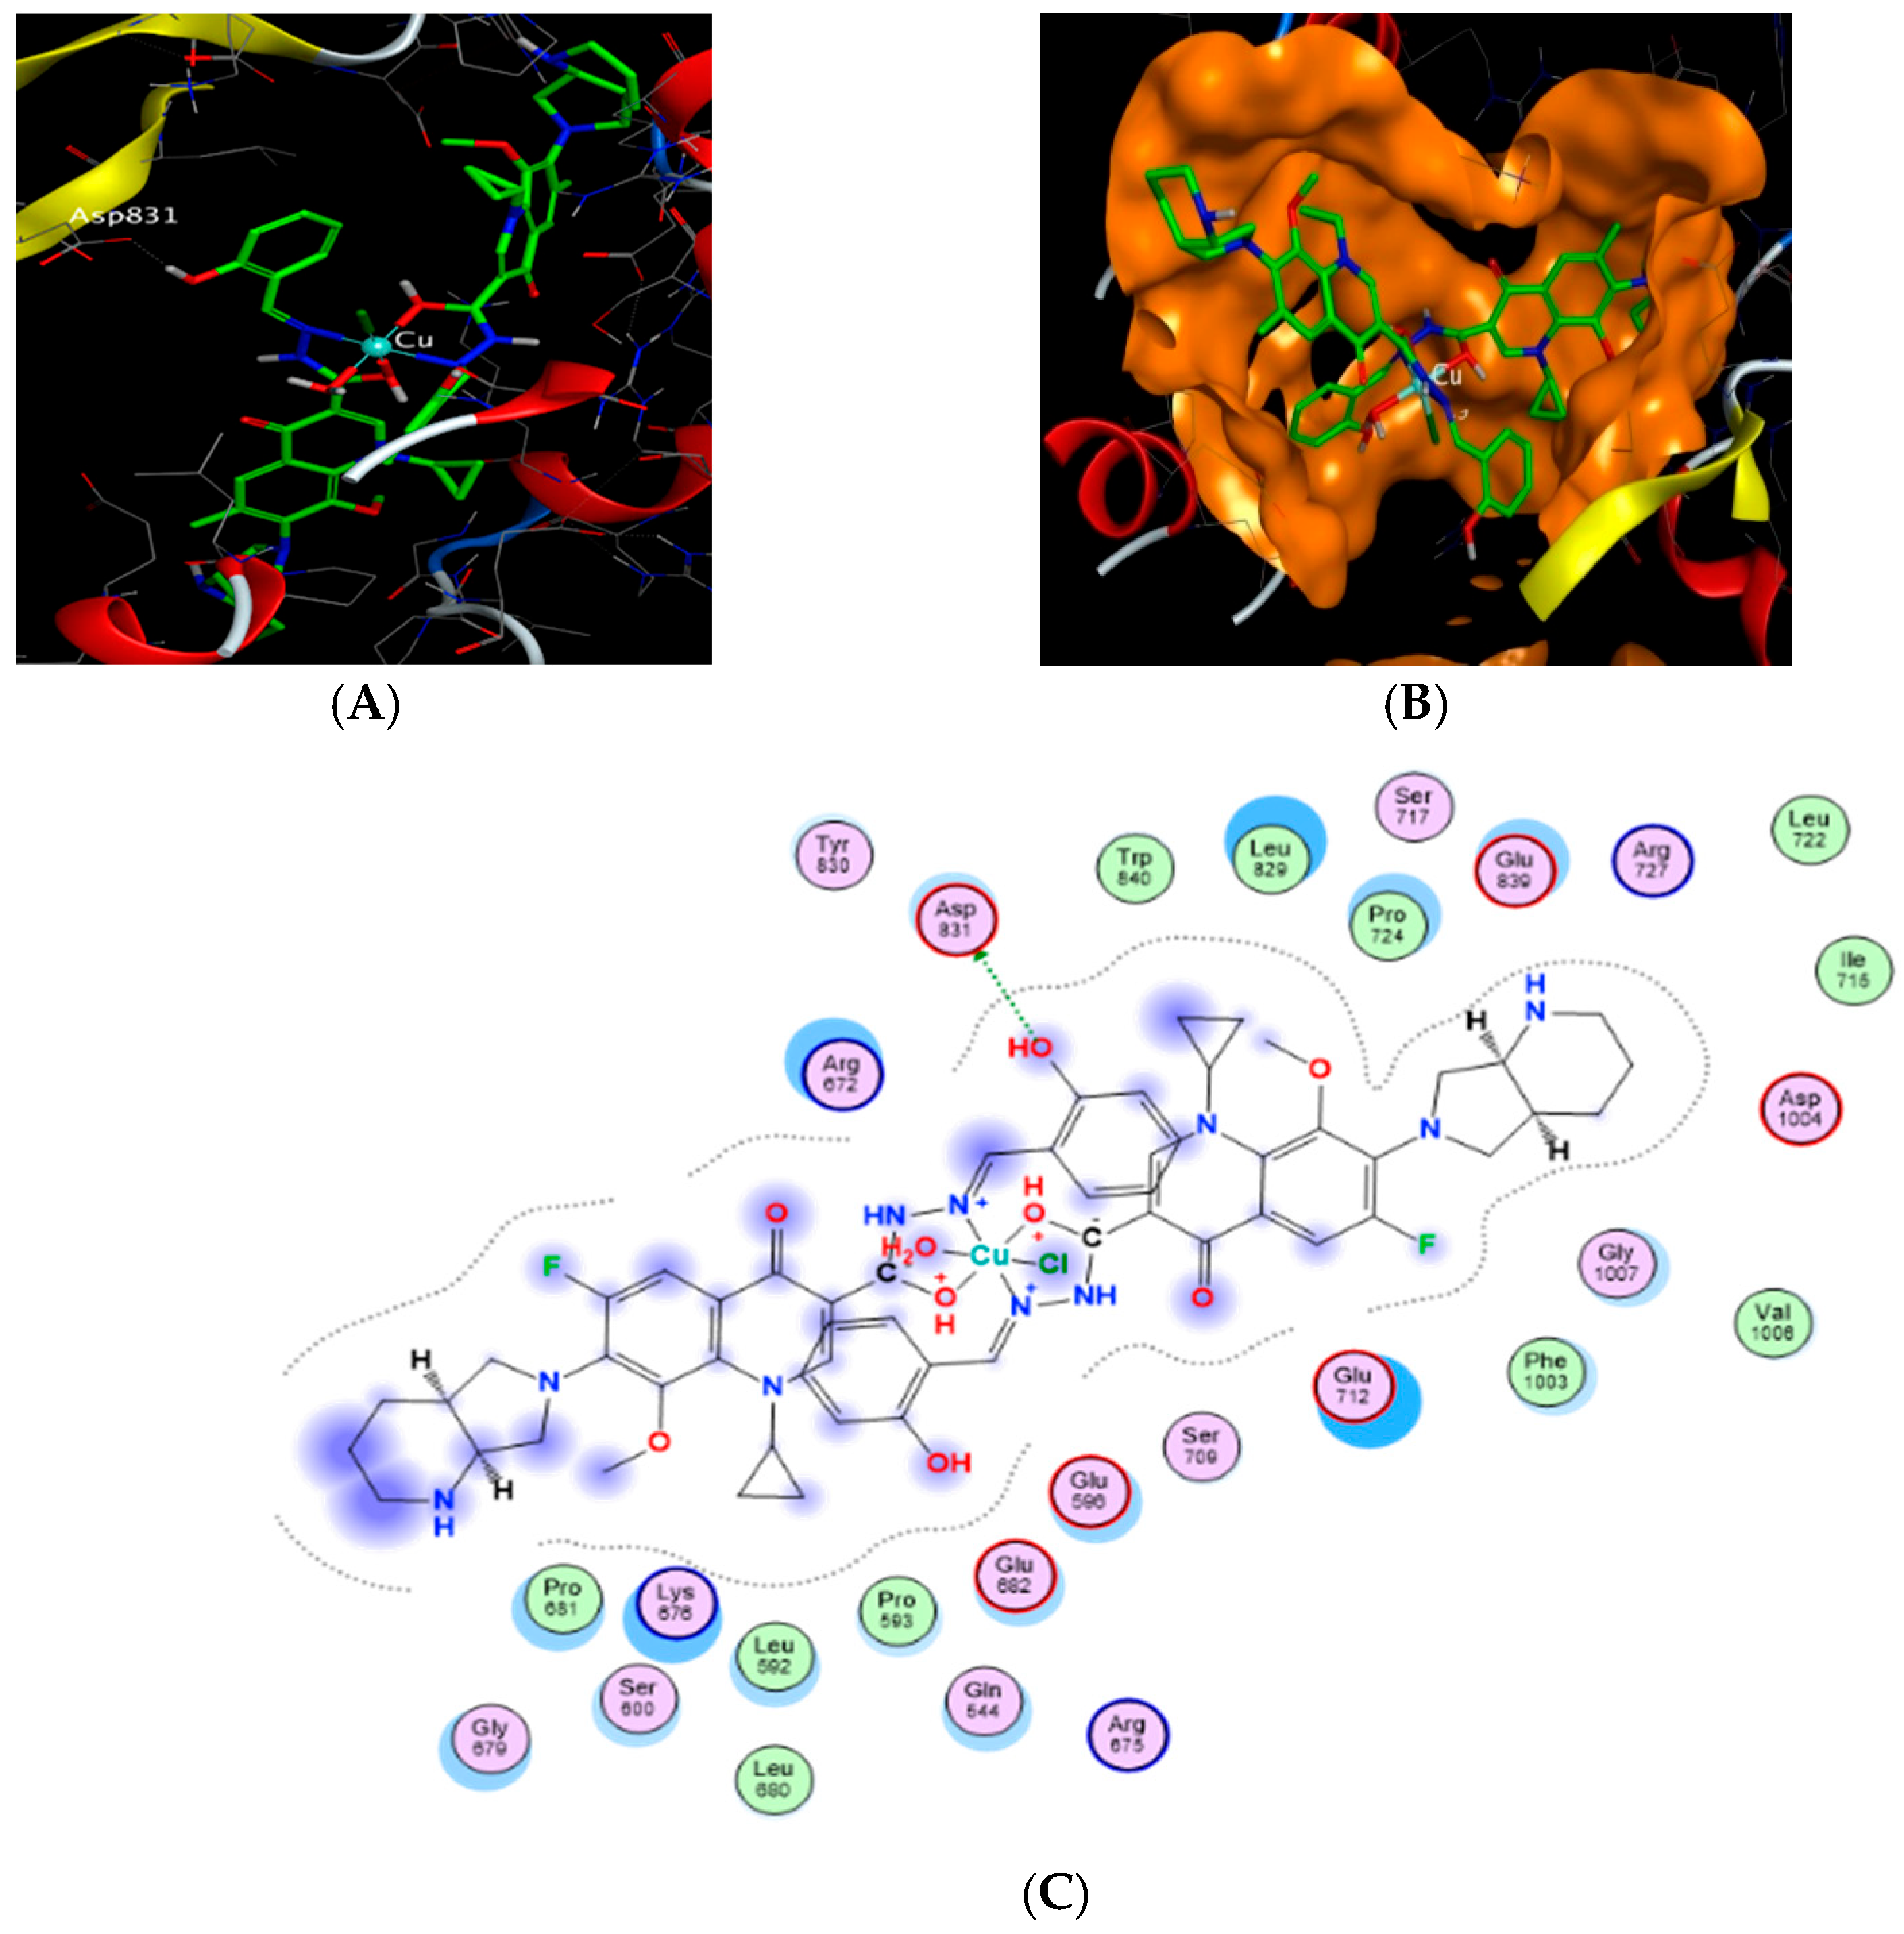
Molecular docking simulations were performed to examine putative binding modes of MOX-S and its Cu(II) complex (Cu–MOX-S) toward human DNA topoisomerase IIα (PDB ID: 5GWK) using PyRx–AutoDock Vina (v1.2.3). Docking outcomes are summarized in Table 3 and visualized in Figure 14 and Figure 15. MOX-S yielded a docking score of −7.5 kcal mol−1 (RMSD 1.72 Å), whereas Cu–MOX-S showed a more favorable score of −10.24 kcal mol−1 (RMSD 2.04 Å). The MOX-S pose includes polar contacts involving ligand oxygen atoms with Arg residues (e.g., Arg673/Arg672), while Cu–MOX-S displays an additional interaction involving ligand oxygen O42 with Asp831 (distance 3.31 Å) (Table 3). These docking results are presented as structural hypotheses that complement the experimental cytotoxicity trends; importantly, docking does not establish inhibitory potency and should be interpreted in conjunction with experimental bioassays.

2.5. Antimicrobial Activity

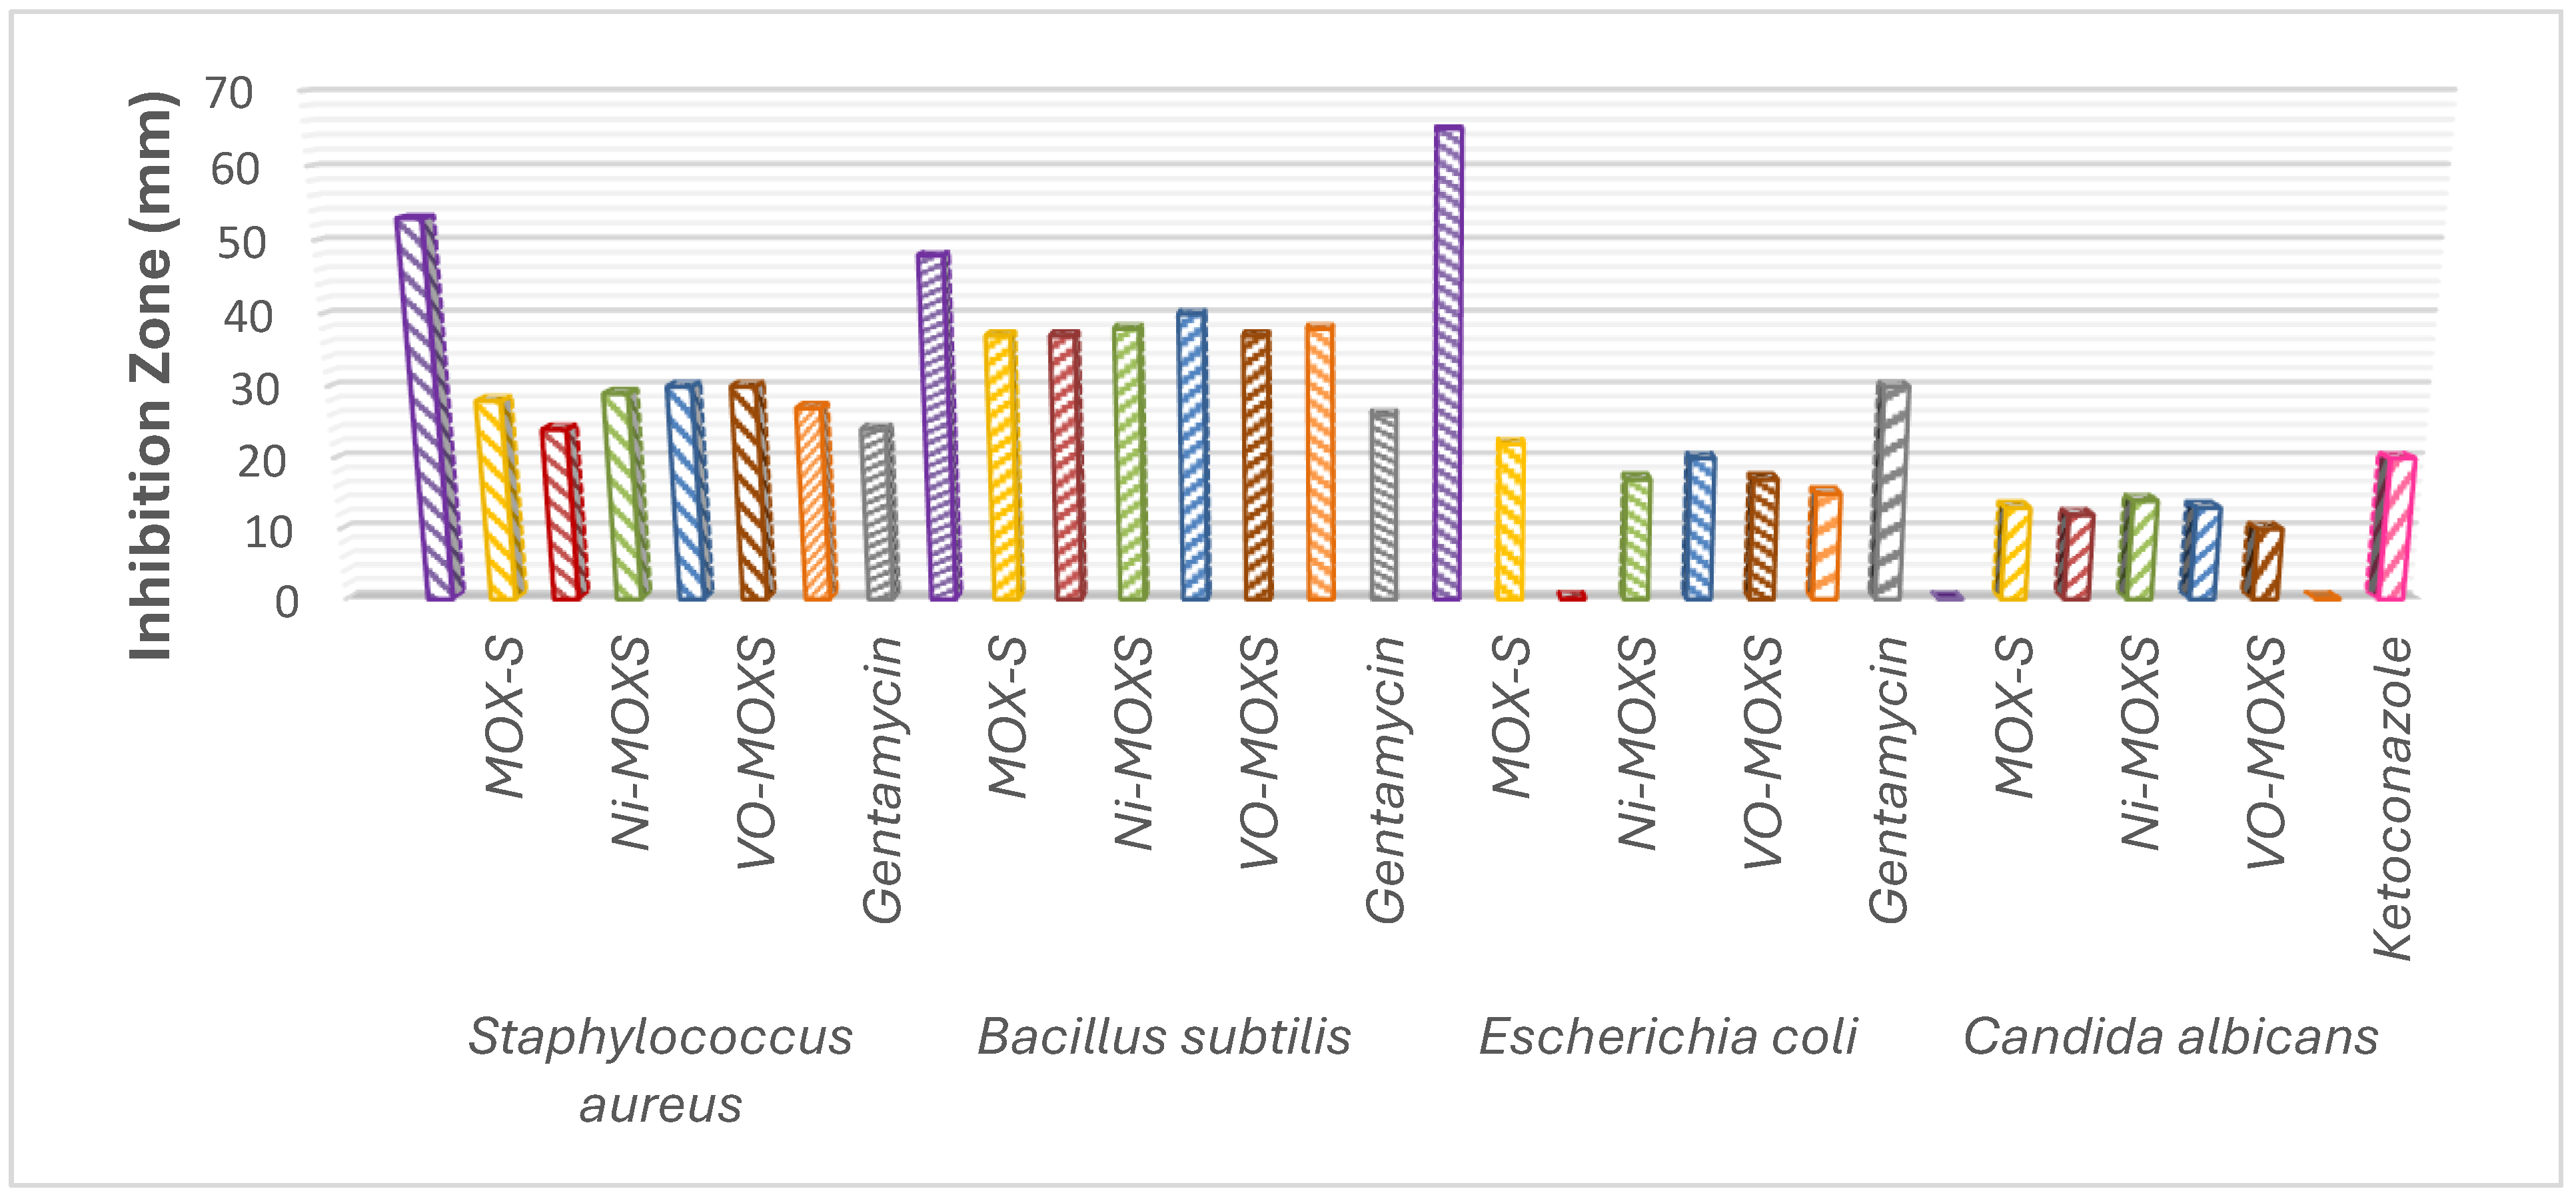
The antimicrobial activities of MOX-S and its metal complexes were evaluated against a representative panel of Gram-positive and Gram-negative bacteria and Candida albicans using the agar diffusion assay, and the results are summarized in Table S13 and Figure 16 and Figure S29. Overall, the dataset shows a clear trend of enhanced activity upon metal coordination for several derivatives, evidenced by larger inhibition zones relative to the free ligand under identical assay conditions.
Antibacterial activity (Gram-positive): All tested derivatives exhibited notable inhibitory effects against Staphylococcus aureus. The Cu–MOX-S and VO–MOX-S complexes produced the largest inhibition zones (30 mm), followed by Ni–MOX-S (29 mm) and the free ligand MOX-S (28 mm). Under the diffusion assay conditions, these values exceeded the inhibition zone observed for the reference antibiotic gentamicin (24 mm), indicating strong anti-S. aureus performance in this screening format. Against Bacillus subtilis, all complexes showed considerable activity, with Cu–MOX-S producing the most pronounced inhibition. Compared with gentamicin, most MOX-S complexes displayed equal or greater inhibition zones, supporting the conclusion that coordination can favorably modulate activity against Gram-positive organisms.
Antibacterial activity (Gram-negative): In contrast, MOX-S and its derivatives showed only moderate-to-low activity against Escherichia coli. The free ligand MOX-S showed the largest inhibition zone (22 mm), followed by Cu–MOX-S (20 mm). The Co–MOX-S complex was inactive (NA), while the remaining complexes produced inhibition zones in the 15–17 mm range. This reduced activity toward E. coli is consistent with the intrinsic permeability barrier of Gram-negative bacteria, where the outer membrane and associated efflux mechanisms can limit intracellular accumulation of antimicrobial agents.
Antifungal activity: MOX-S exhibited moderate activity against Candida albicans (13 mm), comparable to the Cu(II) and Co(II) complexes (12–13 mm). In contrast, Gd–MOX-S showed no detectable activity under the assay conditions, indicating that antifungal performance is strongly metal-dependent and not uniformly enhanced by coordination.
Based on the diffusion screening results, MIC testing was performed for Cu–MOX-S and revealed organism-dependent potency. The complex showed good activity against B. subtilis (MIC = 19.53 µg/mL) and moderate activity against S. aureus (MIC = 39.06 µg/mL), whereas activity against E. coli was substantially weaker (MIC = 625 µg/mL). Against C. albicans, Cu–MOX-S exhibited mild activity (MIC = 2500 µg/mL). These MIC results align with the inhibition-zone trends and reinforce the metal- and organism-dependent nature of the antimicrobial response within this series.
Because inhibition zones are influenced by both potency and diffusion/solubility behavior, the diffusion assay results are interpreted as comparative screening outcomes under the tested conditions, with MIC values providing the more direct potency measure for Cu–MOX-S in this study.
Overall, the antimicrobial results indicate a metal- and organism-dependent response rather than broad-spectrum enhancement for all complexes. The most notable activity was observed against Gram-positive bacteria, particularly for Cu–MOX-S and VO–MOX-S, whereas activity against E. coli and C. albicans was comparatively weaker. Therefore, the antimicrobial data should be interpreted as preliminary screening evidence showing modulation of activity upon coordination, rather than as proof of uniformly superior antimicrobial potency.

2.6. Cytotoxicity and Selectivity

The antiproliferative activities of moxifloxacin (MOX-F), the Schiff-base ligand MOX-S, and the copper (II) complex Cu–MOX-S were evaluated by the MTT assay against MCF-7 (breast adenocarcinoma) and HepG2 (hepatocellular carcinoma) cell lines, with Vero cells included as a non-malignant model to assess selectivity. In addition, AuNP-loaded formulations (MOX-S@AuNPs and Cu–MOX-S@AuNPs) were assessed to examine the influence of nanoformulation on apparent potency (Tables S14 and S15; Figures S30–S41).

2.6.1. MTT-Derived Potency and Selectivity (Free Ligands and Cu Complex)

Relative to the parent drug MOX-F, Schiff-base derivatization markedly enhanced cytotoxic potency. MOX-S exhibited strong antiproliferative activity with IC50 = 3.08 ± 0.05 µM (MCF-7) and 5.16 ± 0.14 µM (HepG2), compared with MOX-F (69.50 ± 0.045 µM and 45.33 ± 0.187 µM, respectively). Against Vero cells, MOX-S showed IC50 = 14.56 ± 0.09 µM, corresponding to selectivity indices SI = IC50(Vero)/IC50(cancer) of 4.73 (MCF-7) and 2.82 (HepG2), indicating preferential cytotoxicity toward cancer cells under the assay conditions.
Copper(II) coordination further increased potency, most prominently against HepG2. Cu–MOX-S yielded IC50 = 2.95 ± 0.02 µM (MCF-7) and 0.98 ± 0.01 µM (HepG2) while showing IC50 = 5.85 ± 0.02 µM against Vero cells. Consequently, Cu–MOX-S exhibited enhanced selectivity against HepG2 (SI = 5.97) but lower selectivity against MCF-7 (SI = 1.98), highlighting that metal coordination can substantially improve potency while shifting the selectivity window in a cell-line-dependent manner. For completeness, MOX-H also improved potency relative to MOX-F (IC50 = 8.61 ± 0.07 µM (MCF-7); 30.37 ± 0.08 µM (HepG2); 42.69 ± 0.09 µM (Vero)), giving SI = 4.96 (MCF-7) and 1.41 (HepG2).

2.6.2. Effect of AuNP Nanoformulation

AuNP loading produced a pronounced enhancement in apparent potency against both cancer cell lines. MOX-S@AuNPs exhibited IC50 = 0.311 µM (MCF-7) and 0.152 µM (HepG2), representing an order-of-magnitude improvement compared with free MOX-S (3.08 and 5.16 µM, respectively). Cu–MOX-S@AuNPs likewise showed high activity with IC50 = 0.357 µM (MCF-7) and 0.346 µM (HepG2) (Tables S13 and S14). However, quantitative conclusions regarding the selectivity of AuNP formulations require matched Vero-cell IC50 values measured under identical conditions; therefore, statements regarding improved therapeutic window for nanoformulations should be framed cautiously pending these controls.
The cytotoxicity results should also be interpreted cautiously. Although Cu–MOX-S and the AuNP formulations showed enhanced apparent antiproliferative potency in selected cancer cell lines, these data represent preliminary in vitro findings and do not by themselves establish anticancer efficacy. The observed responses may reflect combined effects of the ligand framework, metal coordination, nanoparticle formulation, cellular uptake, and assay conditions. Further mechanistic studies, including apoptosis/necrosis analysis, ROS generation, cell-cycle evaluation, target-engagement studies, and broader selectivity assessment against additional non-malignant cell lines, would be required to clarify the biological relevance of these findings.

2.6.3. Image-Based Validation

To complement the MTT-derived IC50 values, ImageJ (v1.54f)-based cell counting was used as an independent image-derived metric of antiproliferative effect. In MCF-7 cells, ImageJ quantification showed a concentration-dependent reduction in cell number consistent with the MTT trends, supporting the ranking inferred from IC50 values. A comparable image-based assessment in HepG2 cells likewise showed a concentration-dependent decline in cell density (Figure S41), corroborating the MTT-derived potency trends. Because colored coordination complexes and nanoparticle dispersions can influence optical readouts, the MTT results are interpreted as phenotypic viability outcomes under the assay conditions and are supported here by image-based cell counting.

3. Materials and Methods

3.1. Chemicals, Instrumentation, Physical Measurement, and Calculations

All reagents were of analytical grade (Sigma-Aldrich, Burlington, MA, USA) and used as received unless otherwise stated. Moxifloxacin was purchased/obtained from Medical Union Pharmaceuticals (MUP, Ismailia, Egypt) and used as received. Instrumentation and experimental conditions used for structural characterization and measurements (FT-IR, UV–visible, NMR, mass spectrometry, EPR), thermal analysis (TGA/DTG), magnetic susceptibility, and powder X-ray diffraction (PXRD), together with calculation details, are provided in the Supplementary Materials.

3.2. Synthesis

3.2.1. Moxifloxacin Schiff-Base Derivative (MOX-S)

Moxifloxacin hydrazide, previously prepared according to our reported procedure [43], was used as the precursor for the synthesis of the moxifloxacin–salicylaldehyde hydrazone Schiff-base (MOX-S). Subsequently, salicylaldehyde (1.0 mmol; 0.122 mL, 0.1403 g) was added dropwise to moxifloxacin hydrazide ethanolic solution (1.0 mmol/30 mL). The reaction mixture was stirred under reflux for 5 h, as shown in Scheme 1, during which the color gradually changed to pale brown. After completion of the reaction, the solvent volume was reduced to approximately half under reduced pressure, affording a creamy-white precipitate. The solid product was collected by filtration, washed successively with cold ethanol and diethyl ether, and dried in a desiccator over anhydrous CaCl2.
MOX-S was obtained as a creamy-white solid in 94% yield; m.p. 120 °C. Elemental analysis was calculated for C28H30FN5O4: C, 60.53%; H, 6.17%; N, 12.61%. Found: C, 60.12%; H, 6.10%; N, 12.46%. MS: m/z = 519, consistent with the proposed molecular formula. FT-IR selected bands, cm−1: 3441–3120 br, ν(O–H/N–H); 1675 w, ν(C=O); 1617 m, quinolone ν(C=O); 1549 m, ν(C=N). 1H NMR (DMSO-d6, δ ppm): 13.20 (s, 1H), 11.29 (s, 1H), 8.69 (s, 1H), 8.59 (s, 1H), 7.64 (d, 1H), 7.53 (dd, 1H), 7.33 (t, 2H), 6.95 (dd, 1H), 4.41–4.09 (m, 1H), 3.92–3.78 (m, 3H), 3.58 (s, 3H), 3.51–3.35 (m, 3H), 3.02 (d, 2H), 2.72–2.66 (m, 1H), 2.38 (m, 1H), 1.91 (s, 2H), 1.73–1.47 (m, 4H), and 1.26–0.83 (m, 4H).

3.2.2. Synthesis of Metal Complexes

The metal complexes were synthesized by reacting MOX-S with the corresponding metal salts in a 2:1 ligand-to-metal molar ratio. In a typical procedure, MOX-S (0.20 mmol) was dissolved in hot ethanol (20 mL) with continuous stirring. A hot ethanolic solution of the appropriate metal salt (0.10 mmol) was then added dropwise to the ligand solution under reflux. The reaction mixture was refluxed with continuous stirring for 3 h, and then cooled to room temperature. The resulting precipitate was collected by filtration, washed thoroughly with cold ethanol to remove unreacted ligand or metal salt, and air-dried. The obtained complexes were stored in airtight containers prior to characterization.
The metal salts used were CoCl2·6H2O, NiCl2·6H2O, CuCl2·2H2O, VOSO4·5H2O, and Gd(NO3)3·6H2O, corresponding to masses of 0.0238, 0.0237, 0.0170, 0.0240, and 0.0541 g, respectively. The complexes were obtained as colored solids in 65–85% isolated yield. Repeated crystallization attempts using different solvent systems did not afford single crystals suitable for single-crystal X-ray diffraction analysis.

3.2.3. Synthesis of Gold Nanoparticles (AuNPs; Turkevich Method)

Gold nanoparticles (AuNPs) were prepared by the citrate reduction method of Turkevich. All glassware was precleaned with nitric acid and thoroughly rinsed with double-distilled water. An aqueous HAuCl4 solution (2 mL of 1% HAuCl4 in 125 mL deionized water) was heated to boiling under stirring. Sodium citrate (10 mL, 0.05 M) was then added dropwise with continuous stirring and heating until the solution color changed from pale yellow to deep red (~10 min), indicating AuNP formation. The colloid was cooled to room temperature and stored at 4 °C. AuNP stability was monitored by UV–Vis spectroscopy over 1–10 days by following the λmax and Δλ of the surface plasmon resonance band [74].

3.2.4. Preparation of MOX-S@AuNP and Cu–MOX-S@AuNP Composites

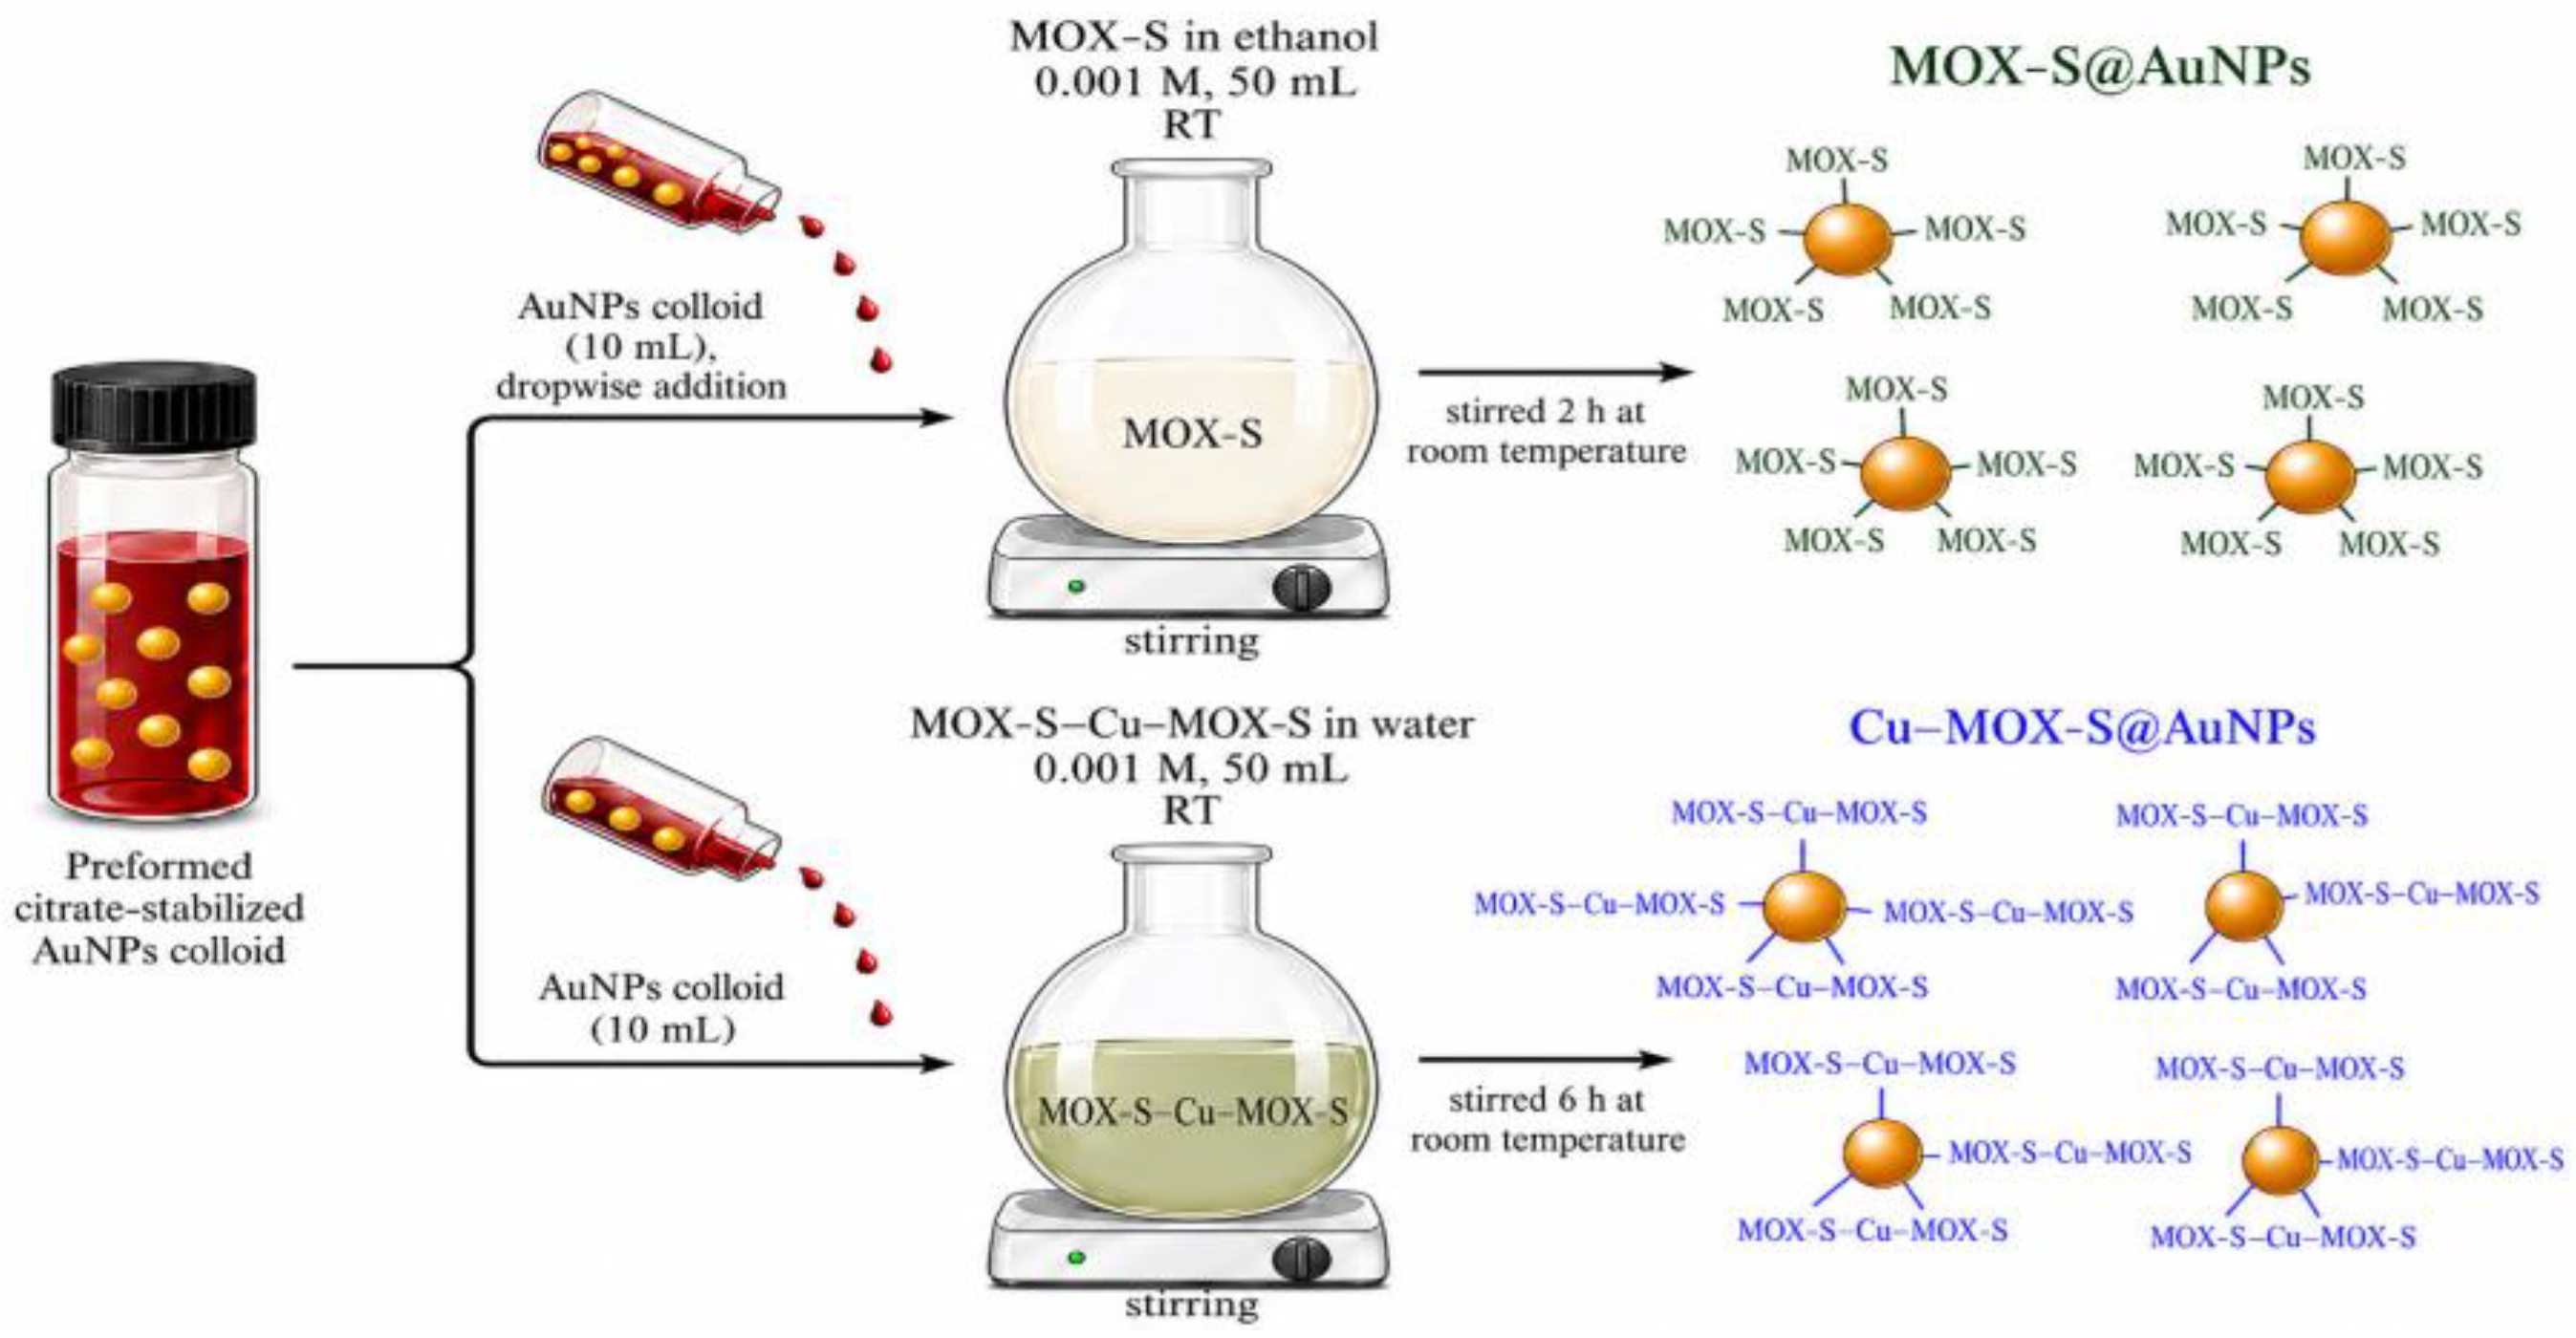
MOX-S@AuNPs and Cu–MOX-S@AuNPs were prepared by mixing the preformed citrate-stabilized AuNP colloid with either MOX-S or the Cu–MOX-S complex under controlled stirring conditions (Scheme 2). For MOX-S@AuNPs, an ethanolic solution of MOX-S (0.001 M, 50 mL) was stirred at room temperature, followed by dropwise addition of AuNP colloid (10 mL). The mixture was stirred for 2 h to allow for interaction of MOX-S with the AuNP surface. For Cu–MOX-S@AuNPs, an aqueous solution of the Cu–MOX-S complex (0.001 M, 50 mL) was mixed with AuNP colloid (10 mL) and stirred for 6 h at room temperature.

3.3. In Silico Predictions of Physicochemical Properties, Pharmacokinetics, and Bioactivity

Geometry optimization and electronic-structure calculations were performed using ORCA 5.0. The MOX-S ligand was optimized in the gas phase by density functional theory (DFT) at the B3LYP/6-31G(d) level. Harmonic vibrational frequency calculations were carried out to confirm that the optimized structure corresponded to a true minimum (no imaginary frequencies). Molecular structures and frontier molecular orbitals were visualized using Avogadro (v1.2.0).
Molecular surface analysis and molecular mechanics calculations were carried out using Avogadro (v-1.2.0) and Chem3D Ultra (v-14.0) (MM2 force field), respectively. Total steric energy, torsional strain, and van der Waals contributions were evaluated to identify stable conformers of MOX-S.
Molecular docking was performed using PyRx–AutoDock Vina (v1.2.3) against human DNA topoisomerase IIα (PDB ID: 5GWK). Ligands were prepared using Open Babel. Protein preparation (addition of hydrogens, removal of crystallographic water, and charge assignment) was conducted using AutoDock Tools (v1.5.7). The docking grid was defined to encompass the enzyme active site. Docking poses and interactions were analyzed using PyMOL and Discovery Studio Visualizer (v 20.1.0.19295).
ADMET and drug-likeness properties were estimated using SwissADME (2017), MolSoft (v 3.9-3), pkCSM, and ProTox-II.

3.4. Pharmacology and Biology

3.4.1. In Vitro Antibacterial/Antifungal Evaluation

The antimicrobial activity of MOX-S and its metal complexes was evaluated using the agar well diffusion method and minimum inhibitory concentration (MIC) determination. The tested organisms were Staphylococcus aureus (ATCC 25923), Escherichia coli (ATCC 25922), Bacillus subtilis (RCMB 015 (1), NRRL B-543), and Candida albicans (RCMB 005003 (1), ATCC 10231).
Antimicrobial experiments were conducted using freshly prepared solutions under standardized assay conditions. It is recognized that fluoroquinolone-based ligands can exhibit medium-dependent metal coordination behavior in aqueous environments and that biological media contain competing ions and ligands. Therefore, the exact solution speciation (fully intact complexes versus partially dissociated forms) was not independently characterized. Accordingly, the observed antimicrobial responses are attributed to the metal–ligand systems present under the assay conditions rather than to a single, well-defined molecular species [75].
Stock solutions were freshly prepared in distilled water to a final concentration of 20 mg/mL. Nutrient agar plates were aseptically seeded with standardized microbial suspensions, and wells (6 mm) were made in the solidified agar. Aliquots (100 µL) of each test solution were introduced into the wells. Gentamicin (4 mg/mL) and ketoconazole (100 µg/mL) served as reference standards for antibacterial and antifungal activity, respectively. Plates inoculated with bacteria were incubated at 37 °C for 24 h, whereas fungal plates were incubated at 28–30 °C for 48 h. Antimicrobial activity was quantified by measuring inhibition zone diameters (mm), including the well diameter.
For MIC evaluation, serial dilutions of each compound were prepared in distilled water and tested under the same incubation conditions. The MIC was defined as the lowest concentration at which no visible microbial growth was observed. All measurements were carried out in triplicate [34,76,77].

3.4.2. In Vitro Cytotoxicity Assay (MTT)

Cell lines were obtained from the cell culture bank at VACSERA (The Holding Company for Biological Products and Vaccines, Giza, Egypt). Cytotoxicity was evaluated using Vero (normal Chlorocebus kidney cells), MCF-7 (human breast adenocarcinoma), and HepG2 (human hepatocellular carcinoma) cell lines. Cells were maintained in RPMI-1640 medium supplemented with 10% fetal bovine serum (FBS), 100 U/mL penicillin, and 100 µg/mL streptomycin at 37 °C in a humidified atmosphere containing 5% CO2 and subcultured at 80–90% confluence. Only exponentially growing cells were used.
For the MTT assay, cells were seeded in 96-well plates at a density of 1 × 10⁵ cells/mL (100 µL/well) and incubated for 24 h to allow for monolayer establishment. The medium was removed and the cell layer was washed twice with sterile phosphate-buffered saline (PBS). Serial two-fold dilutions of the test compounds were prepared in RPMI-1640 containing 2% FBS (maintenance medium), and 100 µL of each dilution was added to the appropriate wells. Control wells received maintenance medium alone (three wells per plate). Cells were incubated with test compounds for 24 h. Cellular morphology was monitored using an inverted microscope for cytotoxic changes (e.g., rounding, shrinkage, granulation, or disruption of the monolayer).
After exposure, 20 µL of MTT solution (5 mg/mL in PBS) was added to each well. Plates were shaken at 150 rpm for 5 min and incubated for 4 h at 37 °C and 5% CO2 to allow for formazan formation. The supernatant was removed and the formazan crystals were dissolved in 200 µL DMSO with shaking at 150 rpm for 5 min. Absorbance was measured at 560 nm with background correction at 620 nm. Cell viability was calculated as a percentage relative to untreated controls using corrected absorbance values [78,79,80]. IC50 values were obtained from concentration–response curves as the concentration required to reduce cell viability to 50% of control levels.

4. Conclusions

A moxifloxacin-derived hydrazone Schiff-base (MOX-S) was synthesized and coordinated to Co(II), Ni(II), Cu(II), VO(IV), and Gd(III) to afford a series of metal complexes with 1:2 (metal/ligand) stoichiometry. The combined analytical and physicochemical evidence, including FT-IR, molar conductivity, UV–Vis/EPR, magnetic susceptibility, PXRD, and TGA/DTG, supports coordination of MOX-S through N/O donor sites and indicates enhanced thermal stability upon chelation relative to the free ligand.
Biological screening demonstrated clear metal- and organism-dependent trends. In diffusion assays, Cu–MOX-S and VO–MOX-S produced the largest inhibition zones (30 mm) against Gram-positive bacteria such as Staphylococcus aureus and Bacillus subtilis, and MIC testing for Cu–MOX-S gave values as low as 19.53 µg mL−1 against B. subtilis, while activity against E. coli was substantially weaker, consistent with typical Gram-negative permeability constraints. In cytotoxicity assays, MOX-S showed strong antiproliferative effects (IC50 3.08 µM for MCF-7 and 5.16 µM for HepG2) with preferential activity over Vero cells (SI 2.82–4.73), and Cu–MOX-S further improved potency, particularly toward HepG2 (IC50 0.98 µM; SI 5.97). AuNP formulation markedly increased apparent potency into the sub-micromolar range (0.15–0.36 µM), supported by ImageJ-based cell counting, while docking results provided a qualitative structure-based rationale for the stronger performance of Cu–MOX-S relative to the free ligand.
Overall, this study shows that Schiff-base derivatization, metal coordination, and AuNP formulation can be combined to tune the physicochemical properties and in vitro antimicrobial/cytotoxic readouts of a moxifloxacin-derived scaffold in a metal-dependent manner, providing a practical platform for further development within fluoroquinolone-based bioinorganic and nano-enabled therapeutics. Future work should therefore focus on obtaining crystallographic or advanced solution-state structural evidence, clarifying biological speciation under assay conditions, and evaluating mechanistic pathways underlying the observed antimicrobial and antiproliferative responses. Collectively, these steps will refine the mechanistic interpretation while preserving the practical value of the current metal- and formulation-dependent activity trends.

Supplementary Materials

The following supporting information can be downloaded at: https://www.mdpi.com/article/10.3390/inorganics14060143/s1.

Author Contributions

Conceptualization, A.S.O. and A.M.A.; Methodology, S.R.F. and A.M.A.; Software, S.R.F. and I.A.I.A.; Validation, A.S.O., I.A.I.A. and H.K.; Formal analysis, A.M.A., W.C.B. and H.K.; Investigation, A.S.O. and I.A.I.A.; Data curation, S.R.F. and A.M.A.; Writing—original draft, A.M.A. and S.R.F.; Writing—review & editing, A.M.A., W.C.B. and H.K.; Supervision, A.S.O. and A.M.A. All authors have read and agreed to the published version of the manuscript.

Funding

This research received no external funding.

Data Availability Statement

The original contributions presented in this study are included in the article/Supplementary Materials. Further inquiries can be directed to the corresponding authors.

Conflicts of Interest

The authors declare no conflict of interest.

References

  1. Naghavi, M.; Vollset, S.E.; Ikuta, K.S.; Swetschinski, L.R.; Gray, A.P.; Wool, E.E.; Aguilar, G.R.; Mestrovic, T.; Smith, G.; Han, C.J.T.L. Global burden of bacterial antimicrobial resistance 1990–2021: A systematic analysis with forecasts to 2050. Lancet 2024, 404, 1199–1226. [Google Scholar] [CrossRef]
  2. World Health Organization. WHO Bacterial Priority Pathogens List, 2024: Bacterial Pathogens of Public Health Importance to Guide Research, Development and Strategies to Prevent and Control Antimicrobial Resistance; World Health Organization: Geneva, Switzerland, 2024. [Google Scholar]
  3. Collins, J.A.; Osheroff, N. Gyrase and Topoisomerase IV: Recycling Old Targets for New Antibacterials to Combat Fluoroquinolone Resistance. ACS Infect. Dis. 2024, 10, 1097–1115. [Google Scholar] [CrossRef] [PubMed]
  4. Khanna, A.; Kumar, N.; Rana, R.; Jyoti; Sharma, A.; Muskan; Kaur, H.; Bedi, P.M.S. Fluoroquinolones tackling antimicrobial resistance: Rational design, mechanistic insights and comparative analysis of norfloxacin vs ciprofloxacin derivatives. Bioorg. Chem. 2024, 153, 107773. [Google Scholar] [CrossRef]
  5. El-Sagheir, A.M.K.; Wenzel, M.; Yli-Kauhaluoma, J. Fluoroquinolones as versatile scaffolds: Potential for targeting classical and novel mechanisms to combat antibacterial resistance. Eur. J. Pharm. Sci. 2025, 214, 107247. [Google Scholar] [CrossRef] [PubMed]
  6. Kherroubi, L.; Bacon, J.; Rahman, K.M. Navigating fluoroquinolone resistance in Gram-negative bacteria: A comprehensive evaluation. JAC-Antimicrob. Resist. 2024, 6, dlae127. [Google Scholar] [CrossRef]
  7. Humma, Z.E.; Patel, P. Moxifloxacin. In StatPearls; StatPearls Publishing: Treasure Island, FL, USA, 2024. [Google Scholar]
  8. Rusu, A.; Munteanu, A.-C.; Arbănași, E.-M.; Uivarosi, V. Overview of Side-Effects of Antibacterial Fluoroquinolones: New Drugs versus Old Drugs, a Step Forward in the Safety Profile? Pharmaceutics 2023, 15, 804. [Google Scholar] [CrossRef]
  9. Chrzanowska, A.; Struga, M.; Roszkowski, P.; Koliński, M.; Kmiecik, S.; Jałbrzykowska, K.; Zabost, A.; Stefańska, J.; Augustynowicz-Kopeć, E.; Wrzosek, M.; et al. The Effect of Conjugation of Ciprofloxacin and Moxifloxacin with Fatty Acids on Their Antibacterial and Anticancer Activity. Int. J. Mol. Sci. 2022, 23, 6261. [Google Scholar] [CrossRef]
  10. Lungu, I.A.; Moldovan, O.L.; Biriș, V.; Rusu, A. Fluoroquinolones Hybrid Molecules as Promising Antibacterial Agents in the Fight against Antibacterial Resistance. Pharmaceutics 2022, 14, 1749. [Google Scholar] [CrossRef] [PubMed]
  11. Ribeiro, N.; Correia, I. A review of hydrazide-hydrazone metal complexes’ antitumor potential. Front. Chem. Biol. 2024, 3, 1398873. [Google Scholar] [CrossRef]
  12. Tafere, D.A.; Gebrezgiabher, M.; Elemo, F.; Atisme, T.B.; Ashebr, T.G.; Ahmed, I.N.J.R.a. Hydrazones, hydrazones-based coinage metal complexes, and their biological applications. RSC Adv. 2025, 15, 6191–6207. [Google Scholar] [CrossRef]
  13. Vibhute, B.T.; Khairnar, B.B.; Deore, J.V.; Kadam, M.S.; Sonawane, H.R. A Comprehensive Review on Broad Spectrum of Medicinal Applications of Schiff Base Metal Complexes Derived from Quinoline Scaffolds. J. Inorg. Organomet. Polym. Mater. 2025, 1–33. [Google Scholar] [CrossRef]
  14. Hassan, M.; El-Faham, A.; Barakat, A.; Haukka, M.; Tatikonda, R.; Abu-Youssef, M.A.M.; Soliman, S.M.; Yousri, A. Synthesis, X-ray Structure, Cytotoxic, and Anti-Microbial Activities of Zn(II) Complexes with a Hydrazono s-Triazine Bearing Pyridyl Arm. Inorganics 2024, 12, 176. [Google Scholar] [CrossRef]
  15. Abbas, A.; Salem, H.; Orabi, A. Synthesis, characterization, in vitro and in silico assessment of novel diclofenac derivative metal complexes. J. Mol. Struct. 2024, 1318, 139191. [Google Scholar] [CrossRef]
  16. Abbas, A.; Salem, H.; Orabi, A. Synthesis, structural elucidation, and molecular docking of diclofenac-derived hydrazone metal complexes with anti-inflammatory and anticancer potential. Sci. Rep. 2025, 15, 42547. [Google Scholar] [CrossRef]
  17. Hijazi, A.K.; Taha, Z.A.; Issa, D.A.K.; Alshare, H.M.; Al-Momani, W.M.; Elrashidi, A.; Barham, A.S. Synthesis, Characterization and Catalytic/Antimicrobial Activities of Some Transition Metal Complexes Derived from 2-Floro-N-((2-Hydroxyphenyl)Methylene)Benzohydrazide. Molecules 2024, 29, 5758. [Google Scholar] [CrossRef]
  18. Kim, W.K.; An, J.M.; Lim, Y.J.; Kim, K.; Kim, Y.H.; Kim, D. Recent advances in metallodrug: Coordination-induced synergy between clinically approved drugs and metal ions. Mater. Today Adv. 2025, 25, 100569. [Google Scholar] [CrossRef]
  19. Ahmad, M.; Ziaullah; Islam, N.U.; Ali, M.; Khan, S. Metal Complexes of Fluoroquinolones with Selected Transition Metals, Their Synthesis, Characterizations, and Therapeutic Applications. Chem. Afr. 2024, 7, 4139–4156. [Google Scholar] [CrossRef]
  20. Wu, S.; Wang, M.; Liu, Z.; Fu, C. Mechanisms Operating in the Use of Transition Metal Complexes to Combat Antimicrobial Resistance. Microorganisms 2025, 13, 1570. [Google Scholar] [CrossRef] [PubMed]
  21. Kumar, M.; Singh, A.K.; Singh, V.K.; Yadav, R.K.; Singh, A.P.; Singh, S. Recent developments in the biological activities of 3d-metal complexes with salicylaldehyde-based N, O-donor Schiff base ligands. Coord. Chem. Rev. 2024, 505, 215663. [Google Scholar] [CrossRef]
  22. Abbas, A.M.; Nasrallah, H.H.; Aboelmagd, A.; Boyd, W.C.; Kalil, H.; Orabi, A.S. Novel Trimethoprim-Based Metal Complexes and Nanoparticle Functionalization: Synthesis, Structural Analysis, and Anticancer Properties. Inorganics 2025, 13, 144. [Google Scholar] [CrossRef]
  23. Felemban, M.F.; Tayeb, F.J.; Alqarni, A.; Ashour, A.A.; Shafie, A. Recent advances in Schiff base coinage metal complexes as anticancer agents: A comprehensive review (2021–2025). J. Dye. Pigment. 2025, 237, 112710. [Google Scholar] [CrossRef]
  24. Panebianco, R.; Santonoceta, G.D.; Borrelli, R.; Pittalà, M.G.; Saletti, R.; Sgarlata, C.; Viale, M.; Furnari, S.; Fuochi, V.; Furneri, P.M. Copper (II) and zinc (II) complexes of dimeric 8-hydroxyquinoline ligands: Synthesis, metal speciation, and biological evaluation. J. Inorg. Biochem. 2025, 275, 113138. [Google Scholar] [CrossRef]
  25. Hangan, A.C.; Oprean, L.S.; Procopciuc, L.M.; Dican, L.; Gog-Bogdan, S.; Lucaciu, R.L. Copper Complexes: Main Mechanisms as Anticancer Agents. Molecules 2026, 31, 874. [Google Scholar] [CrossRef]
  26. Dinda, R.; Garribba, E.; Sanna, D.; Crans, D.C.; Costa Pessoa, J.O. Hydrolysis, ligand exchange, and redox properties of vanadium compounds: Implications of solution transformation on biological, therapeutic, and environmental applications. Chem. Rev. 2025, 125, 1468–1603. [Google Scholar] [CrossRef]
  27. Küssner, K.; Ugone, V.; Sanna, D.; Cziferszky, M. In-Depth Mass Spectrometry Study of Vanadium(IV) Complexes with Model Peptides. Inorg. Chem. 2024, 63, 17785–17796. [Google Scholar] [CrossRef]
  28. Cruz-Navarro, J.A.; Delgado-Rangel, L.H.; Malpica-Calderón, R.; Sánchez-Mora, A.T.; Ponce-Bolaños, H.; González-Oñate, A.F.; Alí-Torres, J.; Colorado-Peralta, R.; Canseco-Gonzalez, D.; Reyes-Márquez, V.; et al. Advances in the Exploration of Coordination Complexes of Vanadium in the Realm of Alzheimer’s Disease: A Mini Review. Molecules 2025, 30, 2547. [Google Scholar] [CrossRef]
  29. Abbas, A.M.; Nasrallah, H.H.; Aboelmagd, A.; Kishk, S.M.; Boyd, W.C.; Kalil, H.; Orabi, A.S. Design, Synthesis, Anti-Inflammatory Activity, DFT Modeling and Docking Study of New Ibuprofen Derivatives. Int. J. Mol. Sci. 2024, 25, 3558. [Google Scholar] [CrossRef] [PubMed]
  30. Henderson, I.M.; Benevidez, A.D.; Mowry, C.D.; Watt, J.; Bachand, G.D.; Kirk, M.L.; Dokładny, K.; DeAguero, J.; Escobar, G.P.; Wagner, B. Precipitation of gadolinium from magnetic resonance imaging contrast agents may be the Brass tacks of toxicity. Magn. Reson. Imaging 2025, 119, 110383. [Google Scholar] [CrossRef]
  31. Zahdeh, M.; Karaman, R. Gold Nanoparticles in Biomedical Applications: Synthesis, Functionalization, and Recent Advances. Molecules 2026, 31, 17. [Google Scholar] [CrossRef]
  32. Mehdi, J.; Ansari, V.A.; Singh, A. A Review of Gold Nanoparticles: Synthesis Methods and Biomedical Applications. Biomed. Mater. Devices 2026, 4, 3903–3919. [Google Scholar] [CrossRef]
  33. Choudhary, S.; Kaur, S.D.; Gandhi, H.; Pemmaraju, D.B.; Kapoor, D.N. An updated review on the potential of gold nanoparticles for cancer treatment and detection. Gold Bull. 2025, 58, 4. [Google Scholar] [CrossRef]
  34. Asghar, B.H.; Arshad, M. Ciprofloxacin analogues: Drug likeness, biological and molecular docking studies. Umm Al-Qura Univ. Appl. Sci. 2023, 9, 508–520. [Google Scholar] [CrossRef]
  35. Elanany, M.A.; Osman, E.E.A.; Gedawy, E.M.; Abou-Seri, S.M. Design and synthesis of novel cytotoxic fluoroquinolone analogs through topoisomerase inhibition, cell cycle arrest, and apoptosis. Sci. Rep. 2023, 13, 4144. [Google Scholar] [CrossRef]
  36. Abbas, A.M.; Fisal, S.R.; Orabi, A.S. Enhancement of the biochemical activity of some market antibiotics by chemical modification: Synthesis, characterization, and biochemical evaluation. J. Chin. Chem. Soc. 2020, 68, 131–149. [Google Scholar] [CrossRef]
  37. Akhtar, M.; Gul, S.; Shamim, S.; Naeem, S.; Khan, A. Moxifloxacin Amide Analogs as Antibacterial and Antifungal Agents: Synthesis, Characterization, and Enzyme Inhibition Studies. Pharm. Chem. J. 2023, 57, 1008–1017. [Google Scholar] [CrossRef]
  38. Khorsand Zak, A.; Hashim, A.M. Advanced XRD peak broadening analysis of gallium-doped ZnO nanoparticles for crystallite size evaluation. Sci. Rep. 2025, 16, 1717. [Google Scholar] [CrossRef]
  39. Anitha, N.; Deepa, S.; Lakshmi, P.J.; Mudavath, R.; Devi, C.S.J.R.i.C. Novel transition metal complexes of hydrazone with isonicotinoyl N-oxide and ortho vanillin moieties: Spectroscopic analysis, in vitro biological activity and in silico docking studies. Results Chem. 2025, 16, 102479. [Google Scholar] [CrossRef]
  40. Seku, K.; Yamala, A.; Kancherla, M.; Kadimpati, K.K.; Badathala, V. Synthesis of moxifloxacin-Au (III) and Ag (I) metal complexes and their biological activities. J. Anal. Sci. Technol. 2018, 9, 14. [Google Scholar] [CrossRef]
  41. Sadeek, S.A.; El-Shwiniy, W.H.; El-Attar, M.S. Synthesis, characterization and antimicrobial investigation of some moxifloxacin metal complexes. Spectrochim. Acta Part A Mol. Biomol. Spectrosc. 2011, 84, 99–110. [Google Scholar] [CrossRef]
  42. Abbas, A.M.; Aboelmagd, A.; Kishk, S.M.; Nasrallah, H.H.; Boyd, W.C.; Kalil, H.; Orabi, A.S. A novel ibuprofen derivative and its complexes: Physicochemical characterization, dft modeling, docking, in vitro anti-inflammatory studies, and DNA interaction. Molecules 2022, 27, 7540. [Google Scholar] [CrossRef] [PubMed]
  43. Abbas, A.M.; Fisal, S.R.; Ali, I.A.I.; Boyd, W.C.; Kalil, H.; Orabi, A.S. Design, Synthesis, and Bioevaluation of Moxifloxacin Hydrazide Metal Complexes: Integrated Spectroscopic, Computational, Antimicrobial, and Anticancer Investigations. Int. J. Mol. Sci. 2026, 27, 3057. [Google Scholar] [CrossRef]
  44. Mohamed, N.S.; Mohamed, M.M.A.; Shehata, M.R.; Abdalla, E.M. Lanthanide–carbamazepine complexes: Synthesis, spectroscopic characterization, DFT Insights, molecular docking, and biological evaluation. Sci. Rep. 2026, 16, 6340. [Google Scholar] [CrossRef] [PubMed]
  45. Marinova, P.E.; Burdzhiev, N.; Varbanova, E.; Tsoneva, S.; Nikolova, S. Mixed-Ligand Copper(II) Complex with Ethyl (2-(Methylcarbamoyl)phenyl)carbamate and 3-Methylquinazoline-2,4(1H,3H)-dione. Molbank 2025, 2025, M2094. [Google Scholar] [CrossRef]
  46. Abbas, A.M.; Fisal, S.R.; Orabi, A.S. Novel β-lactam antibiotic derivative and its complexes: DFT, frontier energy levels, DNA interaction, docking, physicochemical and antimicrobial properties. J. Mol. Struct. 2020, 1218, 128487. [Google Scholar] [CrossRef]
  47. Lever, A.B.P. Inorganic Electronic Spectroscopy; Elsevier: Amsterdam, The Netherlands, 1968. [Google Scholar]
  48. Marts, A.R.; Greer, S.M.; Whitehead, D.R.; Woodruff, T.M.; Breece, R.M.; Shim, S.W.; Oseback, S.N.; Papish, E.T.; Jacobsen, F.E.; Cohen, S.M.; et al. Dual Mode EPR Studies of a Kramers ion: High-Spin Co(II) in 4-, 5- and 6-Coordination. Appl. Magn. Reson. 2011, 40, 501–511. [Google Scholar] [CrossRef]
  49. Pavlov, A.A.; Nehrkorn, J.; Zubkevich, S.V.; Fedin, M.V.; Holldack, K.; Schnegg, A.; Novikov, V.V.J.I.C. A synergy and struggle of EPR, magnetometry and NMR: A case study of magnetic interaction parameters in a six-coordinate cobalt (II) complex. Inorg. Chem. 2020, 59, 10746–10755. [Google Scholar] [CrossRef] [PubMed]
  50. Hernández-Ayala, L.F.; Toledano-Magaña, Y.; Ortiz-Frade, L.; Flores-Alamo, M.; Galindo-Murillo, R.; Reina, M.; García-Ramos, J.C.; Ruiz-Azuara, L. Heteroleptic NiII complexes: Synthesis, structural characterization, computational studies and amoebicidal activity evaluation. J. Inorg. Biochem. 2020, 206, 111043. [Google Scholar] [CrossRef]
  51. Nieuwenhuijse, B.; Reedijk, J. Jahn—Teller distortions in copper(II) complexes as determined from ESR powder spectra. Chem. Phys. Lett. 1973, 22, 201–203. [Google Scholar] [CrossRef]
  52. Zheng, W.C.; Mei, Y.; He, L. Studies of the g factors for the tetragonally elongated and compressed CuIIN6 octahedra in (MI = K, Rb, Cs; MII = Ca, Sr, Ba, Pb) crystals. Philos. Mag. 2010, 90, 1701–1709. [Google Scholar] [CrossRef]
  53. Syryamina, V.N.; Yulikov, M.; Nyström, L. The Cu(ii)-dietary fibre interactions at molecular level unveiled via EPR spectroscopy. RSC Adv. 2022, 12, 19901–19916. [Google Scholar] [CrossRef]
  54. Abdel-Rhman, M.; Samir, G.; Hosny, N. Synthesis, characterization and cytotoxic evaluation of metal complexes derived from new N′-(2-cyanoacetyl)isonicotinohydrazide. Sci. Rep. 2025, 15, 20335. [Google Scholar] [CrossRef]
  55. Singh, G.; Gamboa, S.; Orio, M.; Pantazis, D.A.; Roemelt, M. Magnetic exchange coupling in Cu dimers studied with modern multireference methods and broken-symmetry coupled cluster theory. Theor. Chem. Acc. 2021, 140, 139. [Google Scholar] [CrossRef]
  56. Mahmoud, N.H.; Fahim, A.M. The Effect of Anion, Steric Factors on the Catalytic Activity of Hydrogen Peroxide, Biological Activities, Docking, and DFT Calculations of Novel Mixed Ligand of Copper Complexes. J. Appl. Organomet. Chem. 2025, 39, e70220. [Google Scholar] [CrossRef]
  57. Imperato, M.; Nicolini, A.; Boniburini, M.; Sartini, D.; Benassi, E.; Chiesa, M.; Gigli, L.; Liao, Y.-K.; Raza, A.; Salvadori, E.; et al. Dual Structure of a Vanadyl-Based Molecular Qubit Containing a Bis(β-diketonato) Ligand. Inorg. Chem. 2024, 63, 7912–7925. [Google Scholar] [CrossRef]
  58. Nejo, A.; Kolawole, G.; Opoku, A.; Muller, C.; Wolowska, J. Synthesis, characterization, and insulin-enhancing studies of unsymmetrical tetradentate Schiff-base complexes of oxovanadium(IV). J. Coord. Chem. 2009, 62, 3411–3424. [Google Scholar] [CrossRef]
  59. Figgis, B. Introduction to Ligand Fields; John Wiley & Sons Ltd.: London, UK; New York, NY, USA, 1961. [Google Scholar]
  60. Al-Harazie, A.G.; Gomaa, E.A.; Zaky, R.R.; Abd El-Hady, M.N. Spectroscopic Characterization, Cyclic Voltammetry, Biological Investigations, MOE, and Gaussian Calculations of VO(II), Cu(II), and Cd(II) Heteroleptic Complexes. ACS Omega 2023, 8, 13605–13625. [Google Scholar] [CrossRef]
  61. Chasteen, N.D. [81] Vanadyl (IV) electron nuclear double resonance/electron spin echo envelope modulation spin probes. Methods Enzymol. 1993, 227, 232–244. [Google Scholar]
  62. El-Segaey, A.A.; El-Azabawy, R.E.; Labena, A.; Arafa, E.I.; Al-Shafey, H.I. Synthesis, characterization, and antimicrobial activity of hexa-coordinated cobalt (II) complexes with Salicylaldehyde-derived schiff base ligands. Discov. Appl. Sci. 2026, 8, 284. [Google Scholar] [CrossRef]
  63. Saleh, A.M.; Mahdy, A.G.; Hamed, A.A. “Sonochemically synthesized Ag(I) and Ni(II) schiff base complexes as efficient visible-light photocatalysts for dye degradation with DFT insights.”. Sci. Rep. 2026, 16, 7181. [Google Scholar] [CrossRef]
  64. Coats, A.W.; Redfern, J.P. Kinetic Parameters from Thermogravimetric Data. Nature 1964, 201, 68–69. [Google Scholar] [CrossRef]
  65. Abdel-Rahman, L.H.; El-ezz, D.A.; Abdel-Mawgoud, A.-M.M.; Shehata, M.R.; El-Remaily, M.A.E.A.A.A.; Abdel-Hameed, M.; Mohamed, S.K. Synthesis and biological evaluation of ibuprofen/o-vanillin Schiff base complexes with anti-inflammatory, anti-proliferative and anti-SARS-COV-19 activities. Sci. Rep. 2026, 16, 8501. [Google Scholar] [CrossRef]
  66. Alhashmialameer, D. Synthesis of Some Novel Cr(III), Mn(II), and Pd(II) Complexes via the Sono-Chemical Route with a Chlorinated Quinolinyl-Imine Ligand: Structural Elucidation, Bioactivity Analysis, and Docking Simulations. Inorganics 2025, 13, 271. [Google Scholar] [CrossRef]
  67. Zayed, M.; Belal, A.; Ragha, S. Structure Studies of the Prepared Novel Hydrazone Schiff’s Base Complexes Using Spectroscopic, Thermal Analyses and Their Biological Activities. J. Transit. Met. Complexes 2018, 1, 1–10. [Google Scholar] [CrossRef][Green Version]
  68. Bondarchuk, I.; Bondarchuk, S.; Vorozhtsov, A.; Zhukov, A.J.M. Advanced fitting method for the kinetic analysis of thermogravimetric data. Molecules 2023, 28, 424. [Google Scholar] [CrossRef]
  69. El-Saady, A.; Ibrahim, M.A.; El-Nahass, M.; Adly, O.M.; Farag, A.; Salah, N. Exploring a novel copper (II) semicarbazone–pyranoquinoline complex: Synthesis, spectroscopic profiling, and DFT insights. Sci. Rep. 2025, 15, 40355. [Google Scholar] [CrossRef] [PubMed]
  70. El-Nour, K.M.A.; Salam, E.T.A.; Soliman, H.M.; Orabi, A.S. Gold Nanoparticles as a Direct and Rapid Sensor for Sensitive Analytical Detection of Biogenic Amines. Nanoscale Res. Lett. 2017, 12, 231. [Google Scholar] [CrossRef] [PubMed]
  71. Tabrizi, A.; Ayhan, F.; Ayhan, H. Gold Nanoparticle Synthesis and Characterisation. Hacet. J. Biol. Chem. 2009, 37, 217–226. [Google Scholar]
  72. Shahzad, S.; Qadir, M.A.; Rasheed, R.; Ahmed, M. Synthesis of 99mTc-gemifloxacin freeze dried kits and their biodistribution in Salmonella typhi, Pseudomonas aeruginosa and Klebsiella pneumoniae. Arab. J. Chem. 2019, 12, 664–670. [Google Scholar] [CrossRef]
  73. Hisaindee, S.; Al-Kaabi, L.; Ajeb, S.; Torky, Y.; Iratni, R.; Saleh, N.i.; AbuQamar, S.F. Antipathogenic effects of structurally-related Schiff base derivatives: Structure–activity relationship. Arab. J. Chem. 2015, 8, 828–836. [Google Scholar] [CrossRef]
  74. Turkevich, J.; Stevenson, P.C.; Hillier, J. A study of the nucleation and growth processes in the synthesis of colloidal gold. Discuss. Faraday Soc. 1951, 11, 55–75. [Google Scholar] [CrossRef]
  75. Refaat, H.M.; El-Badway, H.A.; Morgan, S.M. Molecular docking, geometrical structure, potentiometric and thermodynamic studies of moxifloxacin and its metal complexes. J. Mol. Liq. 2016, 220, 802–812. [Google Scholar] [CrossRef]
  76. Biemer, J.J. Antimicrobial susceptibility testing by the Kirby-Bauer disc diffusion method. Ann. Clin. Lab. Sci. 1973, 3, 135–140. [Google Scholar]
  77. Bonev, B.; Hooper, J.; Parisot, J. Principles of assessing bacterial susceptibility to antibiotics using the agar diffusion method. J. Antimicrob. Chemother. 2008, 61, 1295–1301. [Google Scholar] [CrossRef] [PubMed]
  78. van de Loosdrecht, A.A.; Beelen, R.H.; Ossenkoppele, G.J.; Broekhoven, M.G.; Langenhuijsen, M.M. A tetrazolium-based colorimetric MTT assay to quantitate human monocyte mediated cytotoxicity against leukemic cells from cell lines and patients with acute myeloid leukemia. J. Immunol. Methods 1994, 174, 311–320. [Google Scholar] [CrossRef] [PubMed]
  79. Alley, M.C.; Scudiero, D.A.; Monks, A.; Hursey, M.L.; Czerwinski, M.J.; Fine, D.L.; Abbott, B.J.; Mayo, J.G.; Shoemaker, R.H.; Boyd, M.R. Feasibility of drug screening with panels of human tumor cell lines using a microculture tetrazolium assay. Cancer Res. 1988, 48, 589–601. [Google Scholar]
  80. Slater, T.; Sawyer, B.; Sträuli, U. Studies on succinate-tetrazolium reductase systems: III. Points of coupling of four different tetrazolium salts III. Points of coupling of four different tetrazolium salts. Biochim. Biophys. Acta 1963, 77, 383–393. [Google Scholar] [CrossRef]
Figure 1. Chemical structure of (A) moxifloxacin with the key structural positions relevant to its biological activity and derivatization clearly indicated. (B) Moxifloxacin–salicylaldehyde hydrazone ligand (MOX-S).
Inorganics 14 00143 g001
Figure 2. FT-IR spectrum of Gd-MOX-S. FT-IR spectrum of [Gd(H2O)(MOX−S)2(NO3)2]NO3⋅3H2O with the principal diagnostic bands labeled, including (1) ν(O–H/N–H/H2O), quinolone (2) ν(C=O), (3) azomethine ν(C=N), (4) nitrate vibrations, and low-frequency (5) ν(M–O)/(6) ν(M–N) modes.
Inorganics 14 00143 g002
Figure 3. UV–visible spectrum of a Co-MOX-S complex.
Inorganics 14 00143 g003
Figure 4. UV–visible spectrum of a Cu(II)-MOX-S complex.
Inorganics 14 00143 g004
Figure 5. EPR spectrum for a Cu(II)-MOX-S complex.
Inorganics 14 00143 g005
Figure 6. EPR spectrum for a VO(II)-MOX-S complex.
Inorganics 14 00143 g006
Figure 7. TGA and DTG data for [Ni(H2O)Cl(MOX-S)2]Cl·5H2O.
Inorganics 14 00143 g007
Figure 8. The postulated structures of MOX-S metal complexes (M = Co2+, Ni2+ and Cu2+; x = 4, 5, 3, respectively).
Inorganics 14 00143 g008
Figure 9. (A) TEM image, (B) histogram of size distribution for AuNPs.
Inorganics 14 00143 g009
Figure 10. The DFT simulation for the MOX-S (A) HOMO and (B) LUMO.
Inorganics 14 00143 g010
Figure 11. The surface properties of the MOX-S compound. The left diagram shows an active lone pair map (violet = H-bonding, green = hydrophobic and blue = mild polar). The right diagram shows a lipophilicity/hydrophilicity map (violet = hydrophilic, white = neutral and green = lipophilic).
Inorganics 14 00143 g011
Figure 12. (A) BOILED-Egg model for MOX-S Schiff-base. (B) The toxicity radar chart of MOX-S.
Inorganics 14 00143 g012
Figure 13. (A) 3D PCA score plot of the fluoroquinolone dataset. (B) Correlation between predicted and experimental IC50 values.
Inorganics 14 00143 g013
Figure 14. Docking model of MOX-S with topo II-α (PDB code 5GWK): (A) 3D interaction diagram, (B) binding cavity view (C) 2D interaction map.
Inorganics 14 00143 g014
Figure 15. Docking model of Cu–MOX-S with Topo IIα (PDB ID: 5GWK): (A) 3D interaction diagram, (B) binding cavity view, and (C) 2D interaction map.
Inorganics 14 00143 g015
Figure 16. The inhibition zone (mm) of the MOX-S ligand and its complexes towards some Gram-positive and Gram-negative bacteria and fungi.
Inorganics 14 00143 g016
Scheme 1. Synthesis route for the preparation of the moxifloxacin Schiff-base derivative (MOX-S).
Inorganics 14 00143 sch001
Scheme 2. The preparation of MOX-S@AuNPs and Cu–MOX-S@AuNPs by surface functionalization of preformed citrate-stabilized AuNPs.
Inorganics 14 00143 sch002
Table 1. Analytical data and molar conductivity (Λm) for MOX-S and its metal complexes measured at 10−3 M in DMSO.
CompoundMolecular WeightColorMelting Point
(°C)
Λm *M%
FoundCalc.
AB
MOX-S (C28H30FN5O4)519.58White120----
[Co(H2O)Cl(MOX-S)2]Cl·4H2O1259.09Brown265394.684.564.61
[Ni(H2O)Cl(MOX-S)2]Cl·5H2O1276.87Olive brown˃300385.264.794.59
[Cu(H2O)Cl(MOX-S)2]Cl·3H2O1254.69Dirty green19731-5.015.09
[VO(MOX-S)2]SO4·2.5H2O1247.22Apple green˃30050-3.784.08
[Gd(H2O)(MOX-S)2(NO3)2]NO3·3H2O1454.52Yellow˃30074-10.310.8
* Λm values are given in Ω−1 cm2 mol−1. A = complexometric titration; B = thermogravimetric analysis (TGA).
Table 2. Significant IR frequencies (cm−1) for MOX-S and its complexes.
Compound ν (OH/NH/H2O) ν (C=O)
OH/NH
ν (C=O) Quinolone ν (C=N) ν 3 ,   ν 1 (NO3) ν 3 ,   ν 4 (SO42−) ν (M-O) ν (M-N)
MOX-H3430–3238 (br, m)1665 (s)1621(m)1587 (m)----
MOX-S3441–3120 (br, m)1675 (w)1617 (m)1549 (m)----
[Co(H2O)Cl(MOX-S)2]Cl·4H2O,3447 (br, s)-1622 (m)1561 (w)--552 (br, w)419(br, w)
[Ni(H2O)Cl(MOX-S)2]Cl·5H2O3423 (br, s)-1626 (m)1579 (w)--540 (br, w)473 (br, w)
[Cu(H2O)Cl(MOX-S)2]Cl·3H2O3423 (br, s)-1620 (m)---597 (br, w)464 (br, w)
[VO(MOX-S)2]SO4·2.5H2O3442 (br, s)-1620(m)--1100 (s), 618 (w)512 (br, w)464 (br, w)
[Gd(H2O)(MOX-S)2 (NO3)2]NO3·3H2O3385 (br, s)-1635 (m)1584 (w)1456 (s)
1383 (s), 1130 (s)
-592 (br, w)499 (br, w)
s: strong, m: medium, w: weak, br: broad.
Table 3. The interaction parameters of MOX-S and its Cu complex with topoisomerase II-α (PDB code: 5GWK).
CompoundsScoreRMSD
(Å)
The Interaction Poses AddressTotal Free Binding Energy
(kcal/mol)
Compound AtomReceptor AtomType of the InteractionDistance
(Å)
Binding Energy
(kcal/mol)
MOX-S−7.51.72O24N
(Arg673)
Sidechain acceptor
(H-acceptor)
3.29−2.6−10.99
O25NH2
(Arg672)
Sidechain acceptor
(H-acceptor)
3.15−1.4
Cu-MOX-S−10.242.04O42O
(Asp831)
H-donor3.31−0.5−7.99
Disclaimer/Publisher’s Note: The statements, opinions and data contained in all publications are solely those of the individual author(s) and contributor(s) and not of MDPI and/or the editor(s). MDPI and/or the editor(s) disclaim responsibility for any injury to people or property resulting from any ideas, methods, instructions or products referred to in the content.