Abstract
The interaction of manganese(II) with deprotonated 3,5–dibromo–salicylaldehyde (3,5–diBr–saloH) in the absence or the presence of the N,N′-donors 2,2′–bipyridylamine (bipyam), 2,2′–bipyridine (bipy), 1,10–phenanthroline (phen), and 2,9–dimethyl–1,10–phenanthroline (neoc) as co-ligands yielded five neutral mononuclear complexes, namely Mn(3,5-diBr-salo)2(CH3OH)2] (complex 1), [Mn(3,5-diBr-salo)2(bipyam)] (complex 2), [Mn(3,5-diBr-salo)2(bipy)] (complex 3), [Mn(3,5-diBr-salo)2(phen)] (complex 4), and [Mn(3,5-diBr-salo)2(neoc)] (complex 5), respectively. The resultant complexes were characterized with physicochemical and spectroscopic techniques, and single-crystal X-ray crystallography was applied to determine the crystal structure of complex 2. The evaluation of the potential biological profile of the complexes focused on the interaction with linear calf-thymus (CT) DNA, and bovine (BSA) and human (HSA) serum albumin. According to the data derived, the complexes interact intercalatively and strongly with CT DNA and associate tightly and reversibly with both albumins studied.
1. Introduction
Manganese is a significant biometal because of its presence in the active center of many vital enzymes (oxygen-evolving center, superoxide dismutase, and catalase), its involvement in various functions such as glucose metabolism, energy production, protein digestion, and synthesis of cholesterol and fatty acids [1,2,3,4], and its role as a cofactor in the synthesis and activation of important enzymes including transferases, isomerases, hydrolases [5], and glutamine synthetase [6]. In addition, manganese compounds are gaining an increasing role in the research of metallodrugs since there are examples of manganese complexes that have shown in vitro anticancer [7,8,9,10], antimicrobial [11,12,13,14], and antioxidant [15,16] potency, although the use of manganese chemotherapeutics is limited to SC–52608 and Teslascan as anticancer and MRI contrast agents, respectively [17].
Substituted 2–hydroxy–benzaldehydes or salicylaldehydes (X–saloH) are compounds presenting potency against bacteria and yeasts [18,19] as well as antioxidant activity [20]. The insertion of diverse groups on the benzene ring (such as alkyl, alkoxy, nitro, and halogen groups) may alter the biological efficacy of these compounds [21]. In particular, the halogenation is an important modification of the ring that results in an improved biological profile; halogenated compounds contribute to an increase in the permeability of the cell membrane and a decrease in the degradation of metabolism [22,23] and are among the most active drugs [21,24]. The reports of manganese complexes with substituted salicylaldehydes as ligands are rather limited till now [25,26].
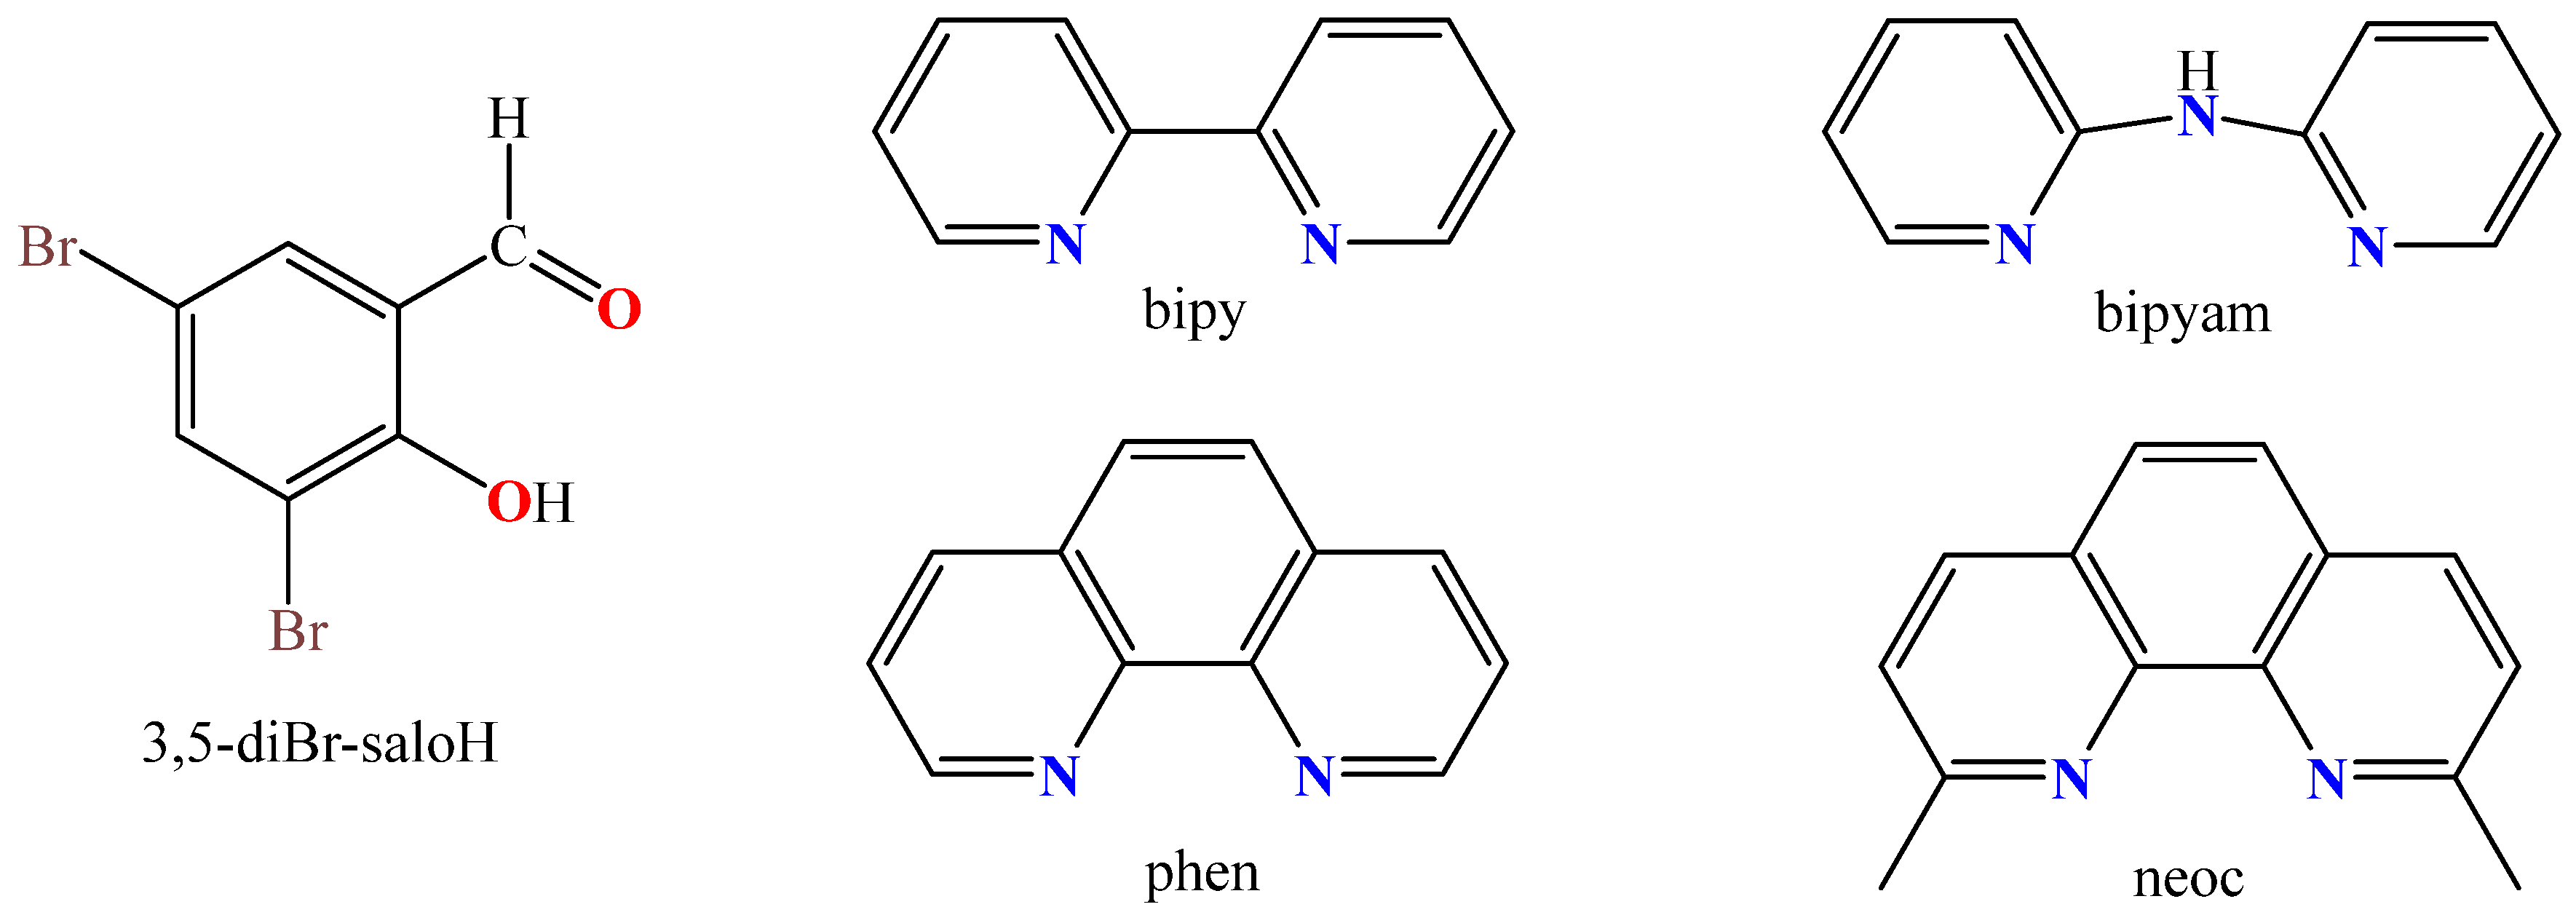
3,5–dibromosalicylaldehyde (3,5–diBr–saloH, Figure 1) is a dibromo-substituted salicylaldehyde inhibiting the inositol-requiring enzyme 1 (IRE1), which is related to the treatment of ischemic stroke [27,28]. In the literature, diverse metal complexes with 3,5–dibromo–salicylaldehyde as a ligand, including mononuclear zinc(II) [29], copper(II) [30], nickel(II) [31], iron(III) [32], and palladium(II) complexes [33], as well as a tetranuclear nickel(II) complex [34], have been structurally characterized and biologically evaluated.
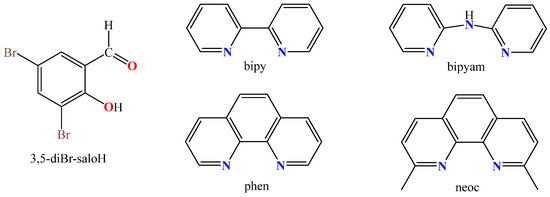
Figure 1.
Syntax formula of 3,5–dibromo–salicylaldehyde (3,5–diBr–saloH), 2,2′–bipyridine (bipy), 2,2′–bipyridylamine (bipyam), 1,10–phenanthroline (phen), and 2,9–dimethyl–1,10–phenanthroline (neoc).
In continuation of our current research project regarding metal complexes of 3,5–dibromo–salicylaldehyde [29,30,31,32,33], five novel neutral mononuclear manganese(II) complexes of 3,5–diBr–saloH were synthesized in the absence or the presence of the N,N′-donors 2,2′–bipyridylamine (bipyam), 2,2′–bipyridine (bipy), 1,10–phenanthroline (phen), and neocuproine (2,9–dimethyl–1,10–phenanthroline, neoc) (Figure 1). The resultant complexes [Mn(3,5-diBr-salo)2(CH3OH)2] (complex 1), [Mn(3,5-diBr-salo)2(bipyam)] (complex 2), [Mn(3,5-diBr-salo)2(bipy)] (complex 3), [Mn(3,5-diBr-salo)2(phen)] (complex 4), and [Mn(3,5-diBr-salo)2(neoc)] (complex 5) were characterized with physicochemical and spectroscopic (FT–IR and UV–vis) techniques, while single-crystal X-ray crystallography was applied for complex 2. The biological evaluation of compounds 1–5 focused on the interaction with calf-thymus (CT) DNA monitored with titration studies (measurements of DNA viscosity and UV–vis spectroscopy) and via the replacement ability of ethidium bromide (EB) from the EB–DNA adduct, and the affinity for bovine serum albumin (BSA) and human serum albumin (HSA) monitored with fluorescence emission spectroscopy. In these studies, the interaction mode was evaluated, and the corresponding binding constants of the complexes were also calculated.
2. Results and Discussion
2.1. Synthesis and Spectroscopic Characterization
Complexes 1–5 were synthesized in methanol in satisfactory yield via the aerobic reaction of MnCl2·4H2O with deprotonated (with CH3ONa) 3,5-diBr-salo− in the absence (in a 1:2 Mn2+:(3,5-diBr-salo)– ratio) or in the presence of the corresponding N,N′-donor (in a 1:2:1 Mn2+:(3,5-diBr-salo)–:(N,N′-donor) ratio). The resultant complexes were characterized with diverse physicochemical techniques (elemental analysis, molar conductivity measurements), room temperature (RT) magnetic measurements, IR and UV–vis spectroscopies, and single-crystal X-ray crystallography (for complex 2).
Complexes 1–5 are neutral (molar conductivity values in DMSO solution were found to be <15 S∙cm2∙mol−1) [35] and possess a 1:2 Mn(II):(3,5–diBr–salo) (for 1) or a 1:2:1 Mn(II):(3,5–diBr–salo):(N,N′-donor) (for 2–5) composition. The values of μeff derived for complexes 1–5 at RT (μeff = 5.85–5.96 BM) are close to the spin-only value (μeff = 5.92 BM) and are characteristic for isolated high-spin manganese(II) ions (i.e., mononuclear complexes) bearing a d5 configuration (S = 5/2) [36].
The bands observed at ~3200 cm−1 and 1400 cm−1 in the spectrum of the free 3,5-diBr-saloH [29] attributable to the stretching and bending vibrations, respectively, of the phenolic –OH [37] disappeared in the IR spectra of the complexes (Figure S1), indicating the deprotonation of the phenolato group. In addition, the binding of the phenolato oxygen with Mn(II) was proved from the presence of the stretching vibration v(C–O → Mn) located at 1306–1328 cm−1 [37]. Furthermore, the coordination of the carbonyl oxygen was confirmed from the shift of v(C=O) from 1679 cm−1 in free 3,5-diBr-saloH towards lower wavenumbers (1625–1641 cm−1) concluding therefore an overall bidentate coordination of deprotonated 3,5–diBr–salo– ligands. The existence and the coordination of the N,N′-donor co-ligands were verified from the presence of the corresponding out-of-plane ρ(C–H) vibrations [37]: at 767 cm−1 for ρ(C–H)bipyam in complex 2, 760 cm−1 for ρ(C–H)bipy in complex 3, 729 cm−1 for ρ(C–H)phen in complex 4, and 735 cm−1 for ρ(C–H)neoc in complex 5.
The UV–vis spectra of the compounds (Figure S3) were recorded as nujol mull (as solid state), in DMSO solution, and in the presence of buffer solution (150 mM NaCl and 15 mM trisodium citrate at pH = 7) to investigate whether the complexes remain stable in the presence of buffer solution used in the biological experiments. The UV–vis spectra are similar (no significant changes, e.g., shift of the λmax or new peaks, were observed), constituting proof of the integrity and the structure of the complexes in solution [25,26,29,30,31,32].
These features concerning the behavior of complexes 1–5 in solution (electronic spectra and molar conductivity measurements) are evidence of their stability in solution.
2.2. Structure of the Complexes
2.2.1. Crystal Structure of Complex 2
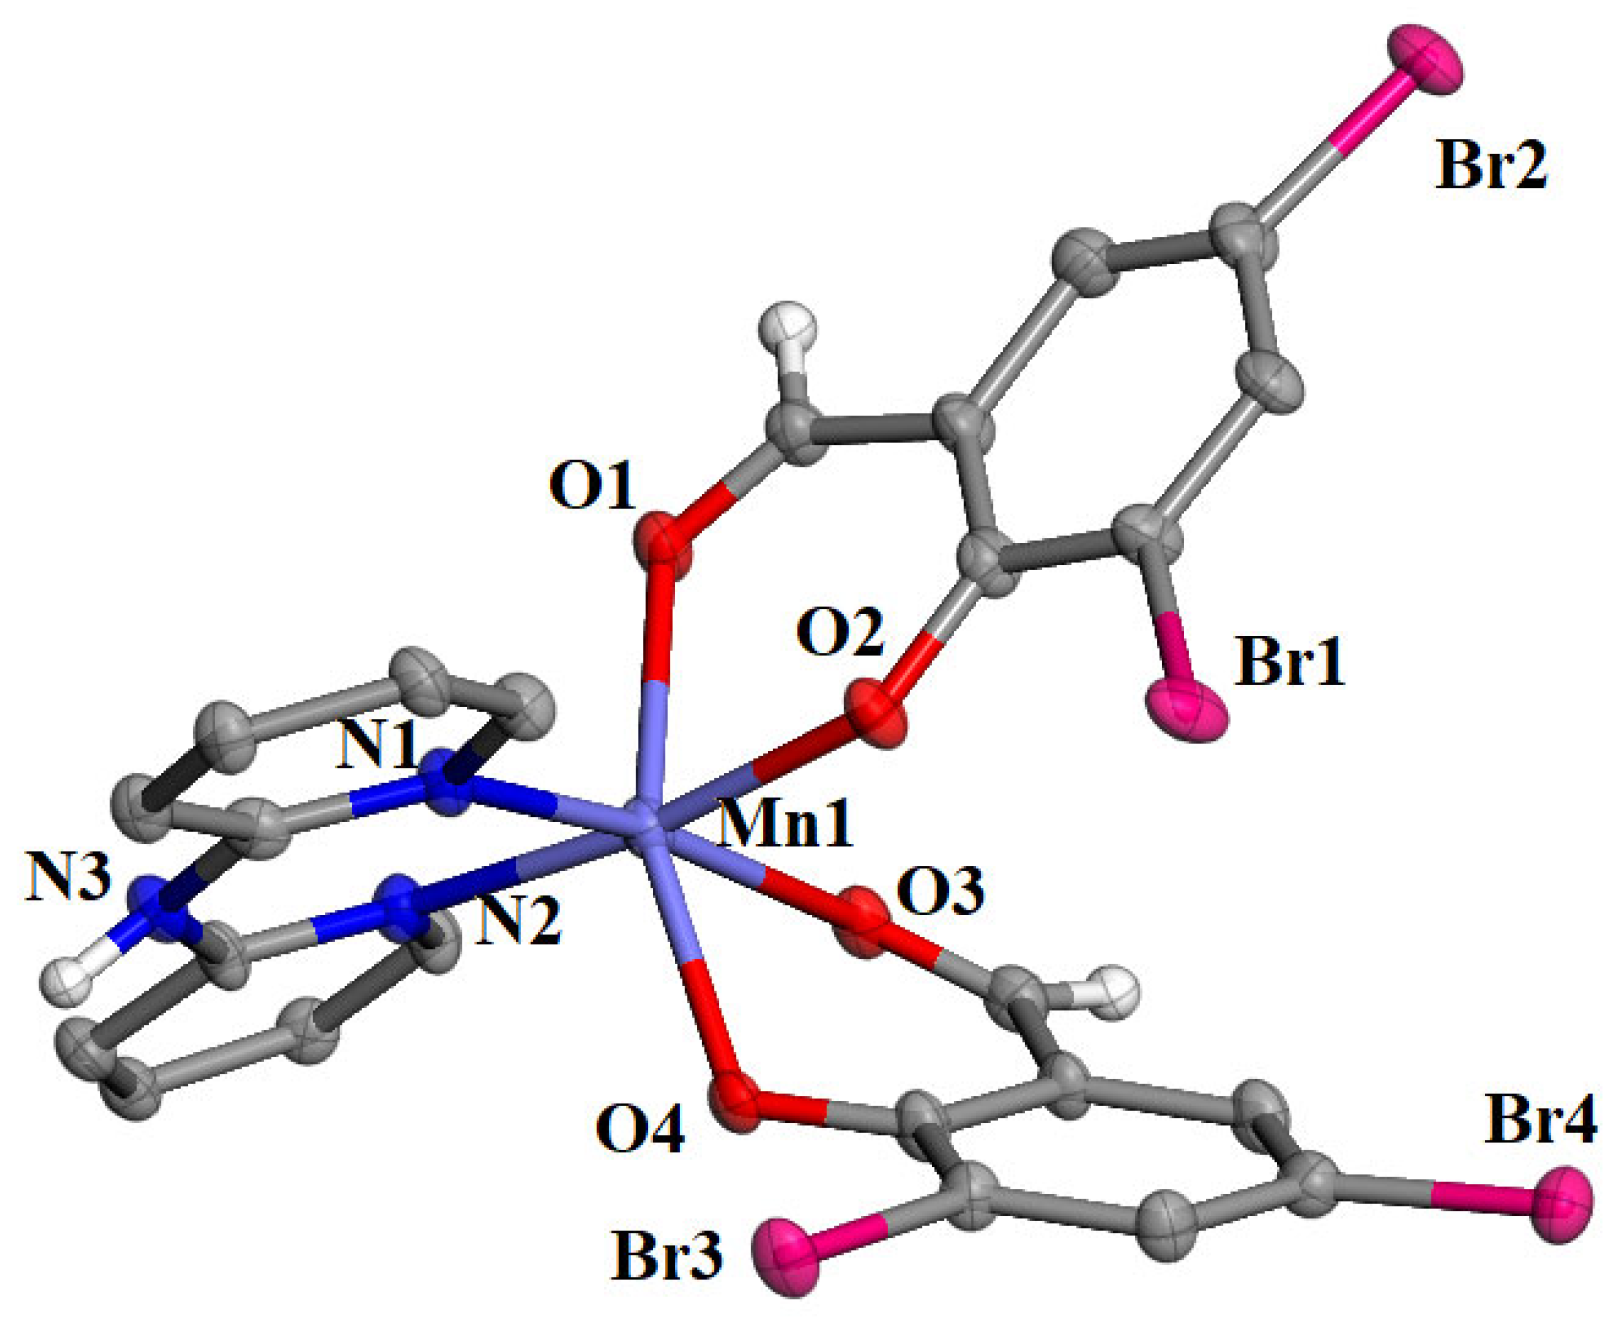
Among complexes 1–5, single-crystals were obtained only for [Mn(3,5-diBr-salo)2(bipyam)] (complex 2) in order to determine its molecular structure with single-crystal X-ray crystallography. Complex 2 crystallized in the monoclinic crystal system and the Cc space group (Table S1). The molecular structure is depicted in Figure 2, and selected bond lengths and angles are summarized in Table 1.
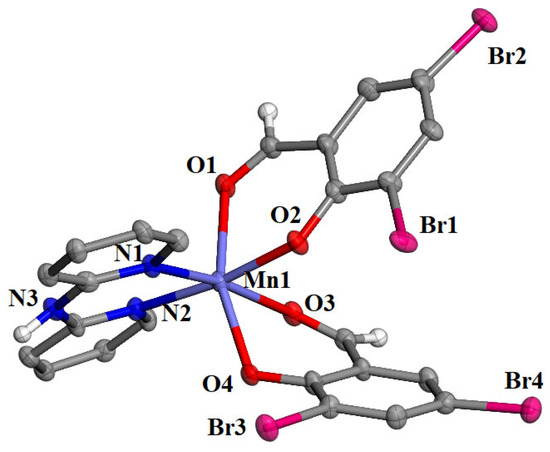
Figure 2.
Molecular structure of complex [Mn(3,5-diBr-salo)2(bipyam)]. Aromatic hydrogen atoms were omitted for clarity. Carbon and hydrogen atoms are grey and white, respectively.

Table 1.
Selected bond lengths (Å) and angles (°) for [Mn(3,5-diBr-salo)2(bipyam)] (complex 2).
It is a mononuclear manganese(II) complex, and the 3,5–diBr–salo– ligands are deprotonated and bound to Mn1 through the aldehyde oxygens O1 and O3 and the phenolato oxygen atoms O2 and O4. Two nitrogen atoms from the chelating bipyam ligand complete the coordination sphere of the six-coordinate Mn1 ion, which bears a distorted octahedral geometry. The Mn–Ophenolato are the shortest bond distances (2.091(6)–2.105(6) Å), while the Mn–Oaldehydo are the longest ones (2.250(6)–2.281(6) Å) in the coordination sphere. A similar arrangement of X–salo– and α–diimine ligands around the central metal was also reported in a series of Co(II) [38], Ni(II) [31], Zn(II) [29,39], and Cd(II) [40].
The crystal structure of complex 2 is further stabilized by an intermolecular hydrogen bond developed between the imino hydrogen H31 of the bipyam ligand with the non-coordinated oxygen O4i (symmetry code: (i) x, −y + 1, z − 1/2) of an adjacent molecule (N3—H31 = 0.86 Å, H31⋅⋅⋅O4i = 2.30 Å, N3⋅⋅⋅O4i = 2.952(13) Å, N3—H31⋅⋅⋅O4i = 133°).
2.2.2. Proposed Structures for Complexes 1 and 3–5
Despite all our efforts, single-crystals were not obtained for all complexes (i.e., 1 and 3–5) under study. Thus, their structural characterization succeeded according to existing experimental data derived from IR and UV–vis spectroscopy, molar conductivity, and RT magnetic measurements and after a comparison with similar reported manganese(II)-(X-salo) complexes. On the basis of RT magnetic measurements (μeff = 5.85–5.96 BM), the Mn(II) complexes are mononuclear. Based on IR spectra, the 3,5-diBr-salo ligands bind to Mn(II) ions in a chelating bidentate fashion through the phenolato and the carbonyl oxygen atoms, and the presence of the N,N′-donors as co-ligands in complexes 3–5 was also confirmed.
In conclusion, complex 1 (Figure S2) is expected to have a similar structure to the reported Mn(II) complexes [Mn(5–NO2–salo)2(MeOH)2] [26], [Μn(5–Cl–salo)2(MeOH)2], and [Μn(5–Br–salo)2(MeOH)2] [25] (5–NO2–saloH = 5–nitro–salicylaldehyde, 5–Cl–saloH = 5–chloro–salicylaldehyde, and 5–Br–saloH = 5–bromo–salicylaldehyde). On the other hand, complexes 3–5 are expected to have a similar structure (Figure S2) to complex 2 and analogous reported Mn(II) complexes [Mn(5–NO2–salo)2(phen)] [26], [Mn(4–OMe–salo)2(phen)], [Mn(4–OMe–salo)2(bipy)], and [Mn(4–OMe–salo)2(bipyam)] [25] (4–OMe–saloH = 4–methoxo–salicylaldehyde), as well as the nickel(II) complex [Ni(3,5–diBr–salo)2(neoc)] [31].
2.3. Interaction of the Complexes with CT DNA
Biologically active compounds may interact with DNA in diverse modes depending on their stability, their structure, and the nature of their ligands [41]. Metal complexes interact with the double helix of DNA in a covalent way or in a noncovalent mode or via the cleavage of the DNA helix [42,43]. In order to study the affinity of complexes 1–5 for CT DNA, titration studies employing UV-vis spectroscopy, viscosity measurements, and EB-displacement monitored with fluorescence emission spectroscopy were performed.
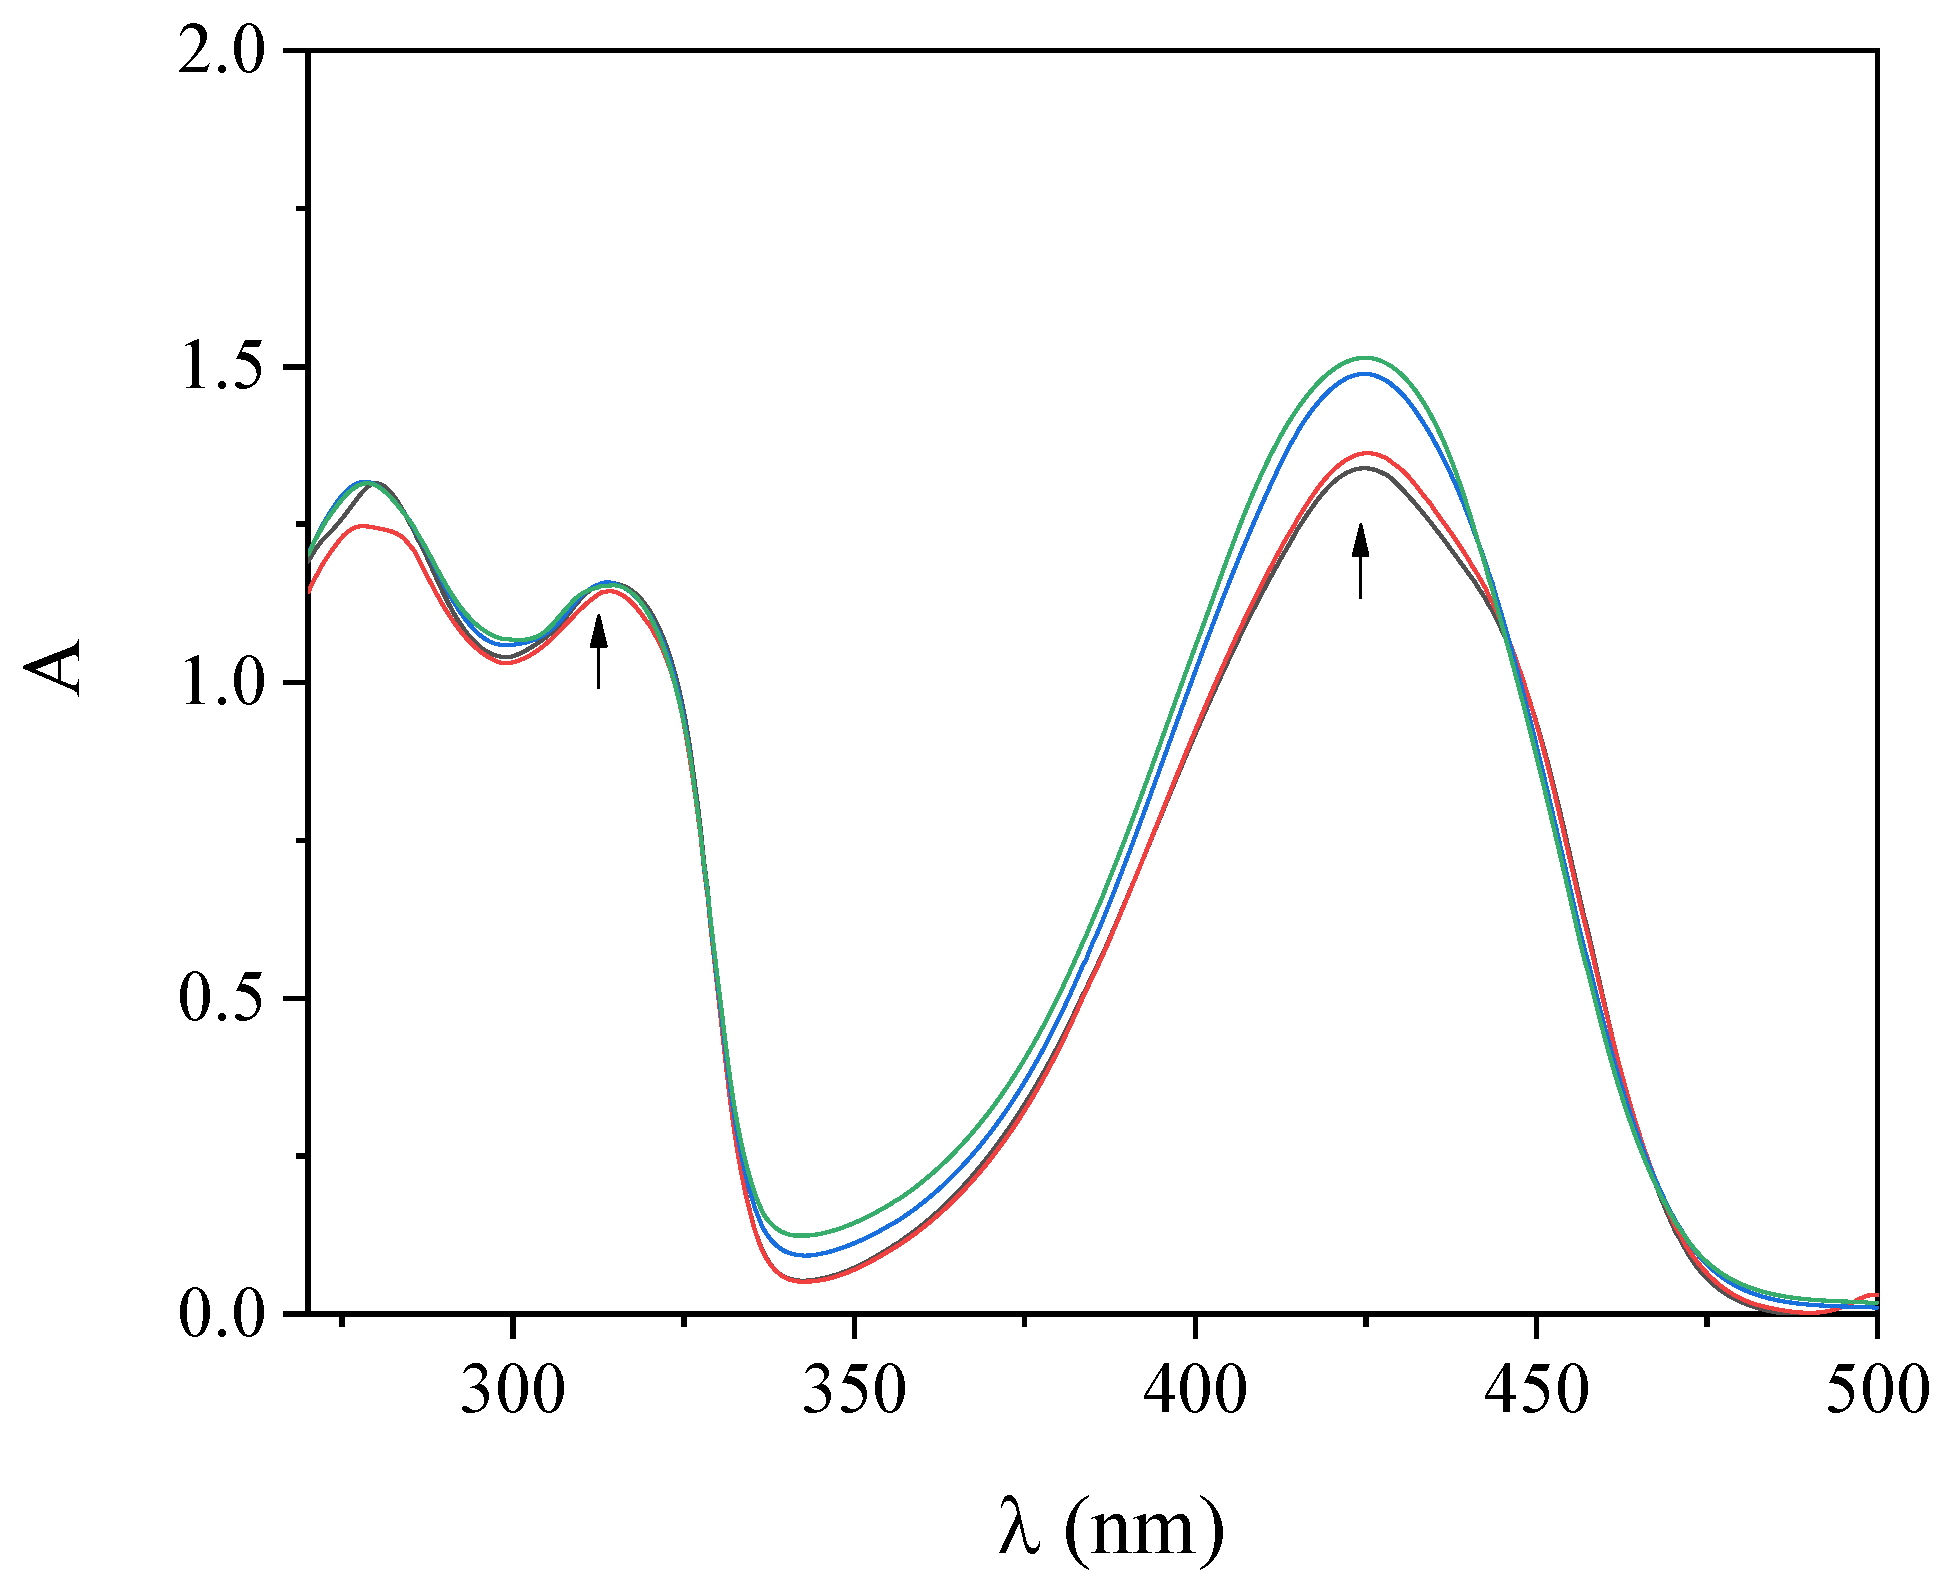
UV–vis spectroscopy titration studies provide initial information regarding the interaction of complexes with CT DNA and aid the determination of the DNA-binding constant (Kb). The UV–vis spectra of the complexes were recorded in the presence of increasing amounts of CT DNA solution (Figure 3 and Figure S4). The intraligand bands in the region 300–315 nm and at 425 nm presented upon addition of CT DNA a slight hyperchromism, while the positions of the corresponding λmax remained stable (Table 2). Such changes reveal the interaction of the compounds with CT DNA [44] but cannot lead to a safe conclusion regarding the mode of this interaction, thus necessitating the employment of more techniques such as DNA-viscosity measurements and EB-displacement studies.
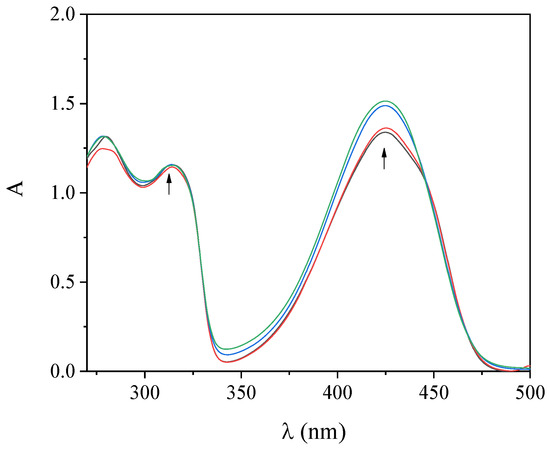
Figure 3.
UV−vis spectra of a DMSO solution of complex 2 (100 µM) in the presence of increasing amounts of CT DNA. The arrows show the changes upon increasing amounts of CT DNA.

Table 2.
UV–vis spectroscopic data concerning the interaction of complexes 1–5 with CT DNA: UV-band (λmax, in nm) (percentage of the observed hyper/hypochromism (ΔA/A0, in %), blue-/red-shift of the λmax (Δλ, in nm)); DNA-binding constant (Kb, in M−1).
The Kb values of complexes 1–5 were calculated with the aid of the Wolfe–Shimer equation (Equation (S1)) [45] and the plots of [DNA]/(εA-εf) versus [DNA] (Figure S5). Most of the complexes present a higher Kb value than free 3,5-diBr-saloH (Table 2), revealing its stronger binding to CT DNA upon coordination, with complex 3 bearing the highest Kb (= 6.58(±0.53) × 105 M−1) among the compounds studied herein. The DNA-binding constants of complexes 1–5 are in the range reported (= 2.83 × 10⁵ – 3.37 × 10⁶ M−1) for a series of transition metal complexes with 3,5-diBr-salo ligands [29,30,31,32,33] and Mn(II) complexes with di- or mono-substituted salicylaldehydes (Kb = 9.92 × 10⁴ – 3.08 × 10⁷ M−1) [25,26]. The Kb values of the complexes are higher than that of EB (Kb = 1.23×10⁵ M−1) [46], which is a reference intercalator, revealing the potency of the compounds to displace EB from its intercalating site.
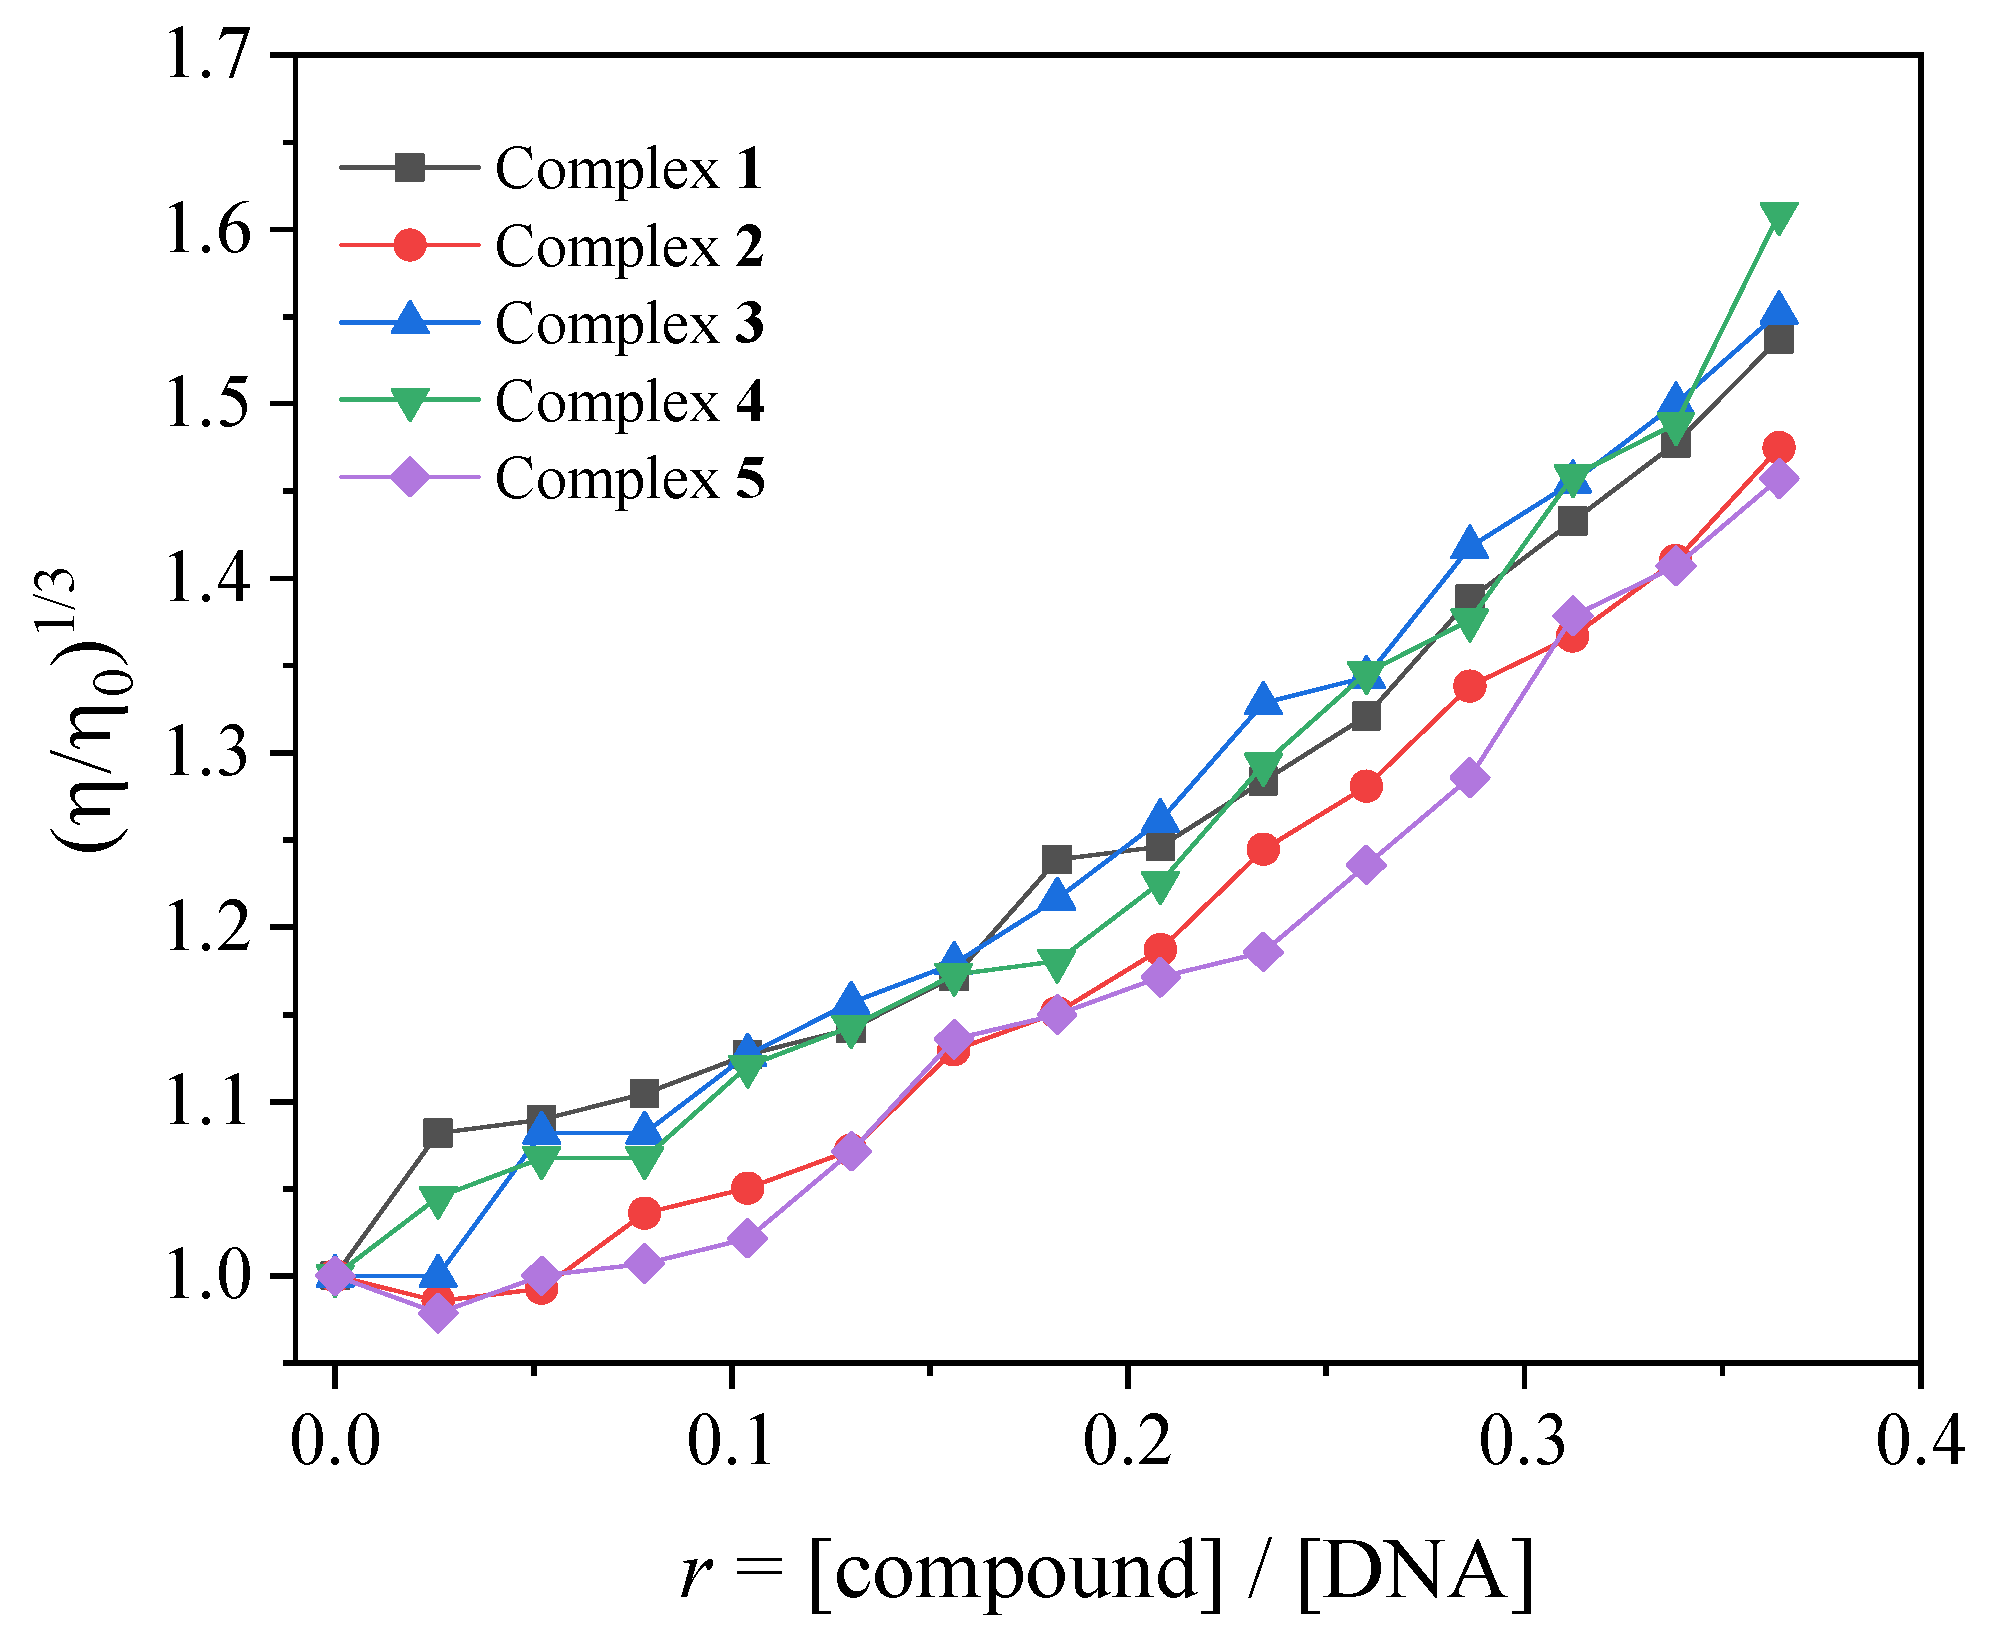
The relative viscosity of DNA is usually sensitive to DNA-length changes since they are related via the equation L/L0 = (η/η0)1/3, where η/η0 denotes the relative DNA viscosity and L/L0 is the relative DNA length. Therefore, the measurement of the viscosity of a DNA solution in the presence of a compound provides significant information regarding changes in relative DNA length arising from specific DNA interaction modes [47]. In general, a classic intercalation will increase the separation distance between DNA bases to host the intercalating molecule in-between, thus resulting in an elongation of the relative DNA length in proportion to the relative DNA viscosity. An external interaction with DNA (an electrostatic or DNA-groove binding interaction) may bend slightly the DNA helix, leading to a slight shortening of the relative DNA helix, which may decrease relative DNA viscosity or leave it practically stable [47].
In the current study, the changes in viscosity of a CT DNA solution (0.1 mM) were monitored in the presence of increasing amounts of complexes 1–5 (up to the value of r = 0.36, Figure 4). Especially in the case of complexes 2 and 5, the addition of the complexes initially resulted (up to r~0.1, Figure 4) in a slight decrease in relative DNA viscosity, showing that an external interaction with DNA may probably take place, allowing the complexes to approach DNA. Further addition of the complexes into the DNA solution resulted in a gradual increase in the relative DNA viscosity, revealing an intercalative interaction [47].
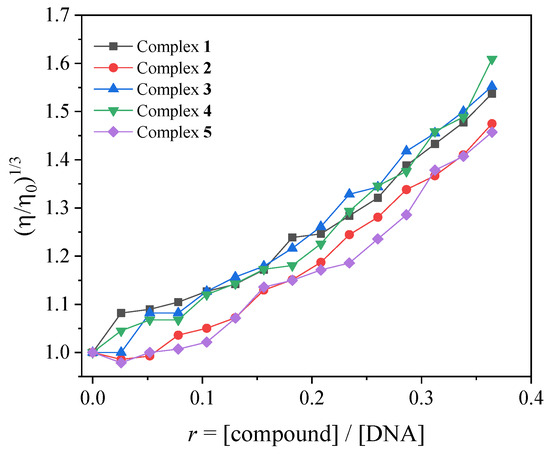
Figure 4.
Relative viscosity (η/η0)1/3 of CT DNA (0.1 mM) in buffer solution (150 mM NaCl and 15 mM trisodium citrate at pH 7.0) in the presence of the compounds (initial concentration 0.1 mM) at increasing amounts (r = [compound]/[DNA] up to 0.36).
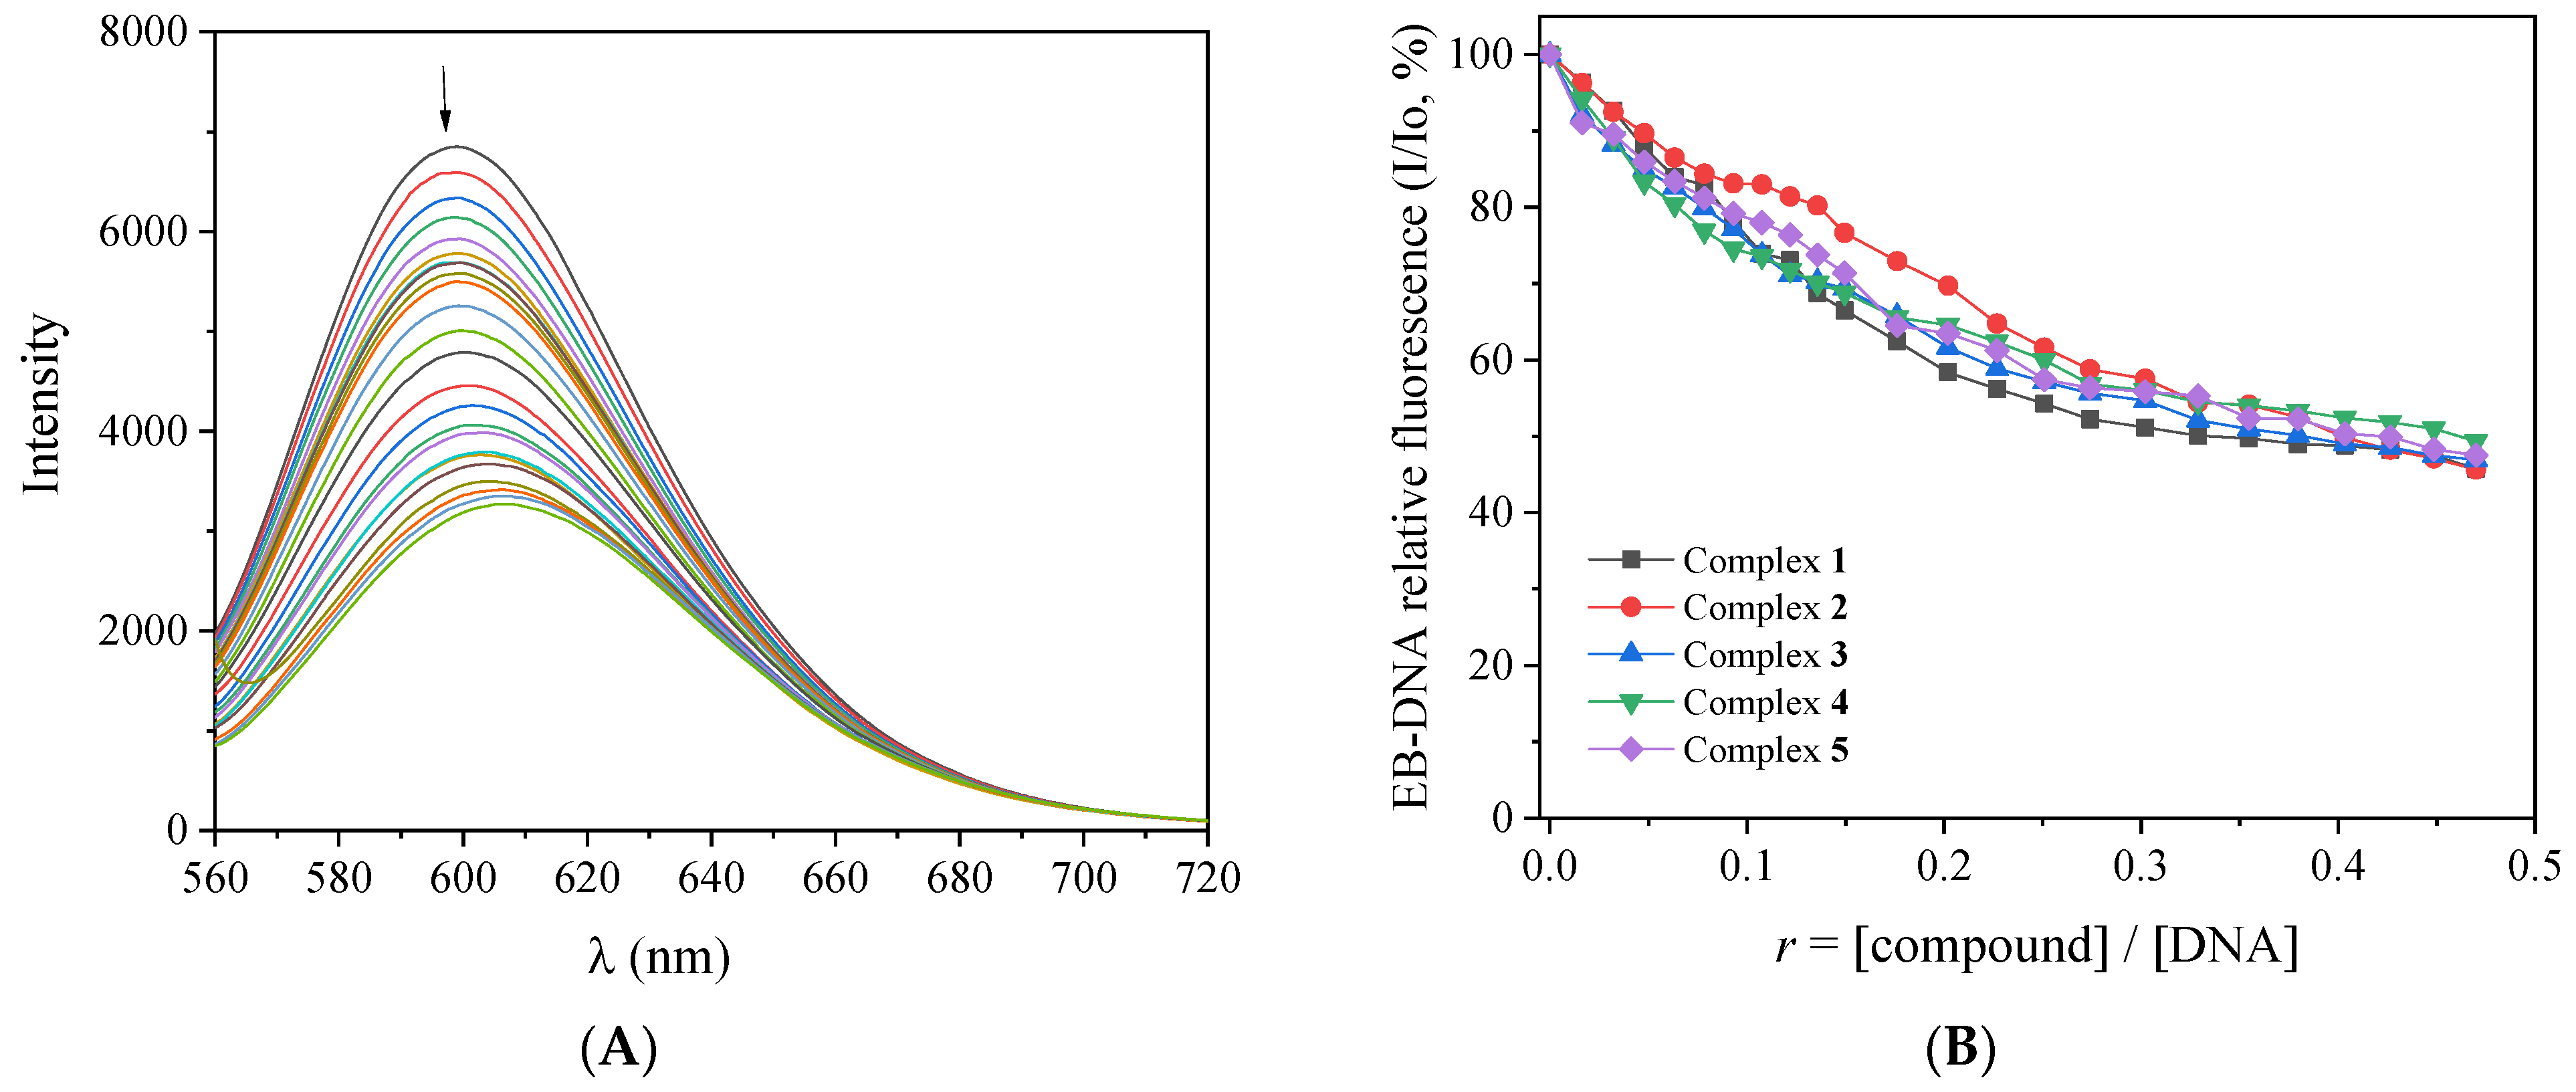
EB intercalates to DNA through its planar phenanthridine ring, which inserts in-between two adjacent DNA bases, resulting in an intense fluorescence emission band at λmax = 592–594 nm upon excitation at 540 nm [48]. It is considered a DNA-intercalation marker, since the quenching of this band in the presence of intercalating compounds is an indication of competition for the same DNA-intercalation sites [48]. For this experiment, the fluorescence emission spectra of a buffer solution containing pretreated EB (40 μM) and CT DNA (40 μM) were recorded (with λexcitation = 540 nm) in the presence of increasing amounts of complexes 1–5 (Figure 5A and Figure S6). The quenching of the EB–DNA emission band at λmax = 594 nm observed for all complexes (up to 54% of the initial fluorescence, Figure 5B, Table 3) may be assigned to the displacement of the EB from EB-DNA induced by the complexes as a result of the competition for the same DNA sites. Such displacement of EB indirectly suggests intercalation as the most probable mode of interaction between CT DNA and complexes 1–5 [48].
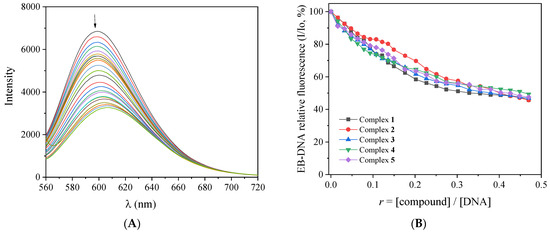
Figure 5.
(A) Fluorescence emission spectra (λexcitation = 540 nm) for EB–DNA ([EB] = 40 μM, [DNA] = 45 μM) in buffer solution (150 mM NaCl and 15 mM trisodium citrate at pH 7.0) in the absence and presence of increasing amounts of the complex 2. The arrow shows the changes in intensity upon increasing amounts of the complex. (B) Plot of relative EB–DNA fluorescence emission intensity at λemission = 594 nm (I/Io, %) versus r (r = [compound]/[DNA]) in the presence of complexes 1–5 (up to 45.7% of the initial EB–DNA fluorescence for complex 1, 45.7% for complex 2, 46.9% for complex 3, 49.3% for complex 4, and 47.5% for complex 5).

Table 3.
Fluorescence features of the EB-displacement studies for complexes 1–5: percentage of EB–DNA fluorescence emission quenching (ΔI/I0, in %), Stern–Volmer (KSV, in M−1), and quenching constants (Kq, in M−1s−1).
The evaluation of the EB-displacement was assessed through the Stern–Volmer constants (KSV) calculated with the Stern–Volmer equation (Equation (S2)) [48] and the corresponding Stern–Volmer plots (Figure S7). Most of the complexes studied herein present higher KSV values than free 3,5-diBr-saloH (Table 3), with [Mn(3,5-diBr-salo)2(CH3OH)2] bearing the highest constant (KSV = 1.09(±0.03) × 105 M−1). The quenching constants (Kq) for the complexes were calculated with Equation (S3), applying the value of 23 ns as the fluorescence lifetime for the EB–DNA system (τ0) [49]. The Kq values of all complexes are found to be of the 1012 M−1s−1 order and are much higher than the value of 1010 M−1s−1; these values suggest the presence of a static quenching mechanism and confirm the formation of a new DNA–compound adduct as the result of the displacement of EB and subsequently indicate an intercalative mode of interaction [48].
2.4. Interaction of the Complexes with Albumins
Serum albumin (SA) is the most abundant protein in human blood plasma with important key roles such as the reversible binding and the transportation of drugs or other compounds and the maintenance of the osmotic pressure [50,51]. Within this context, the interaction of complexes 1–5 with the homologue albumins HSA and BSA was studied with fluorescence emission spectroscopy. In addition, the subtraction of the spectra was performed from the free compound for precise quantitative studies. Furthermore, the inner-filter effect was assessed with Equation (S4), and it was found negligible to affect the measurements [52].
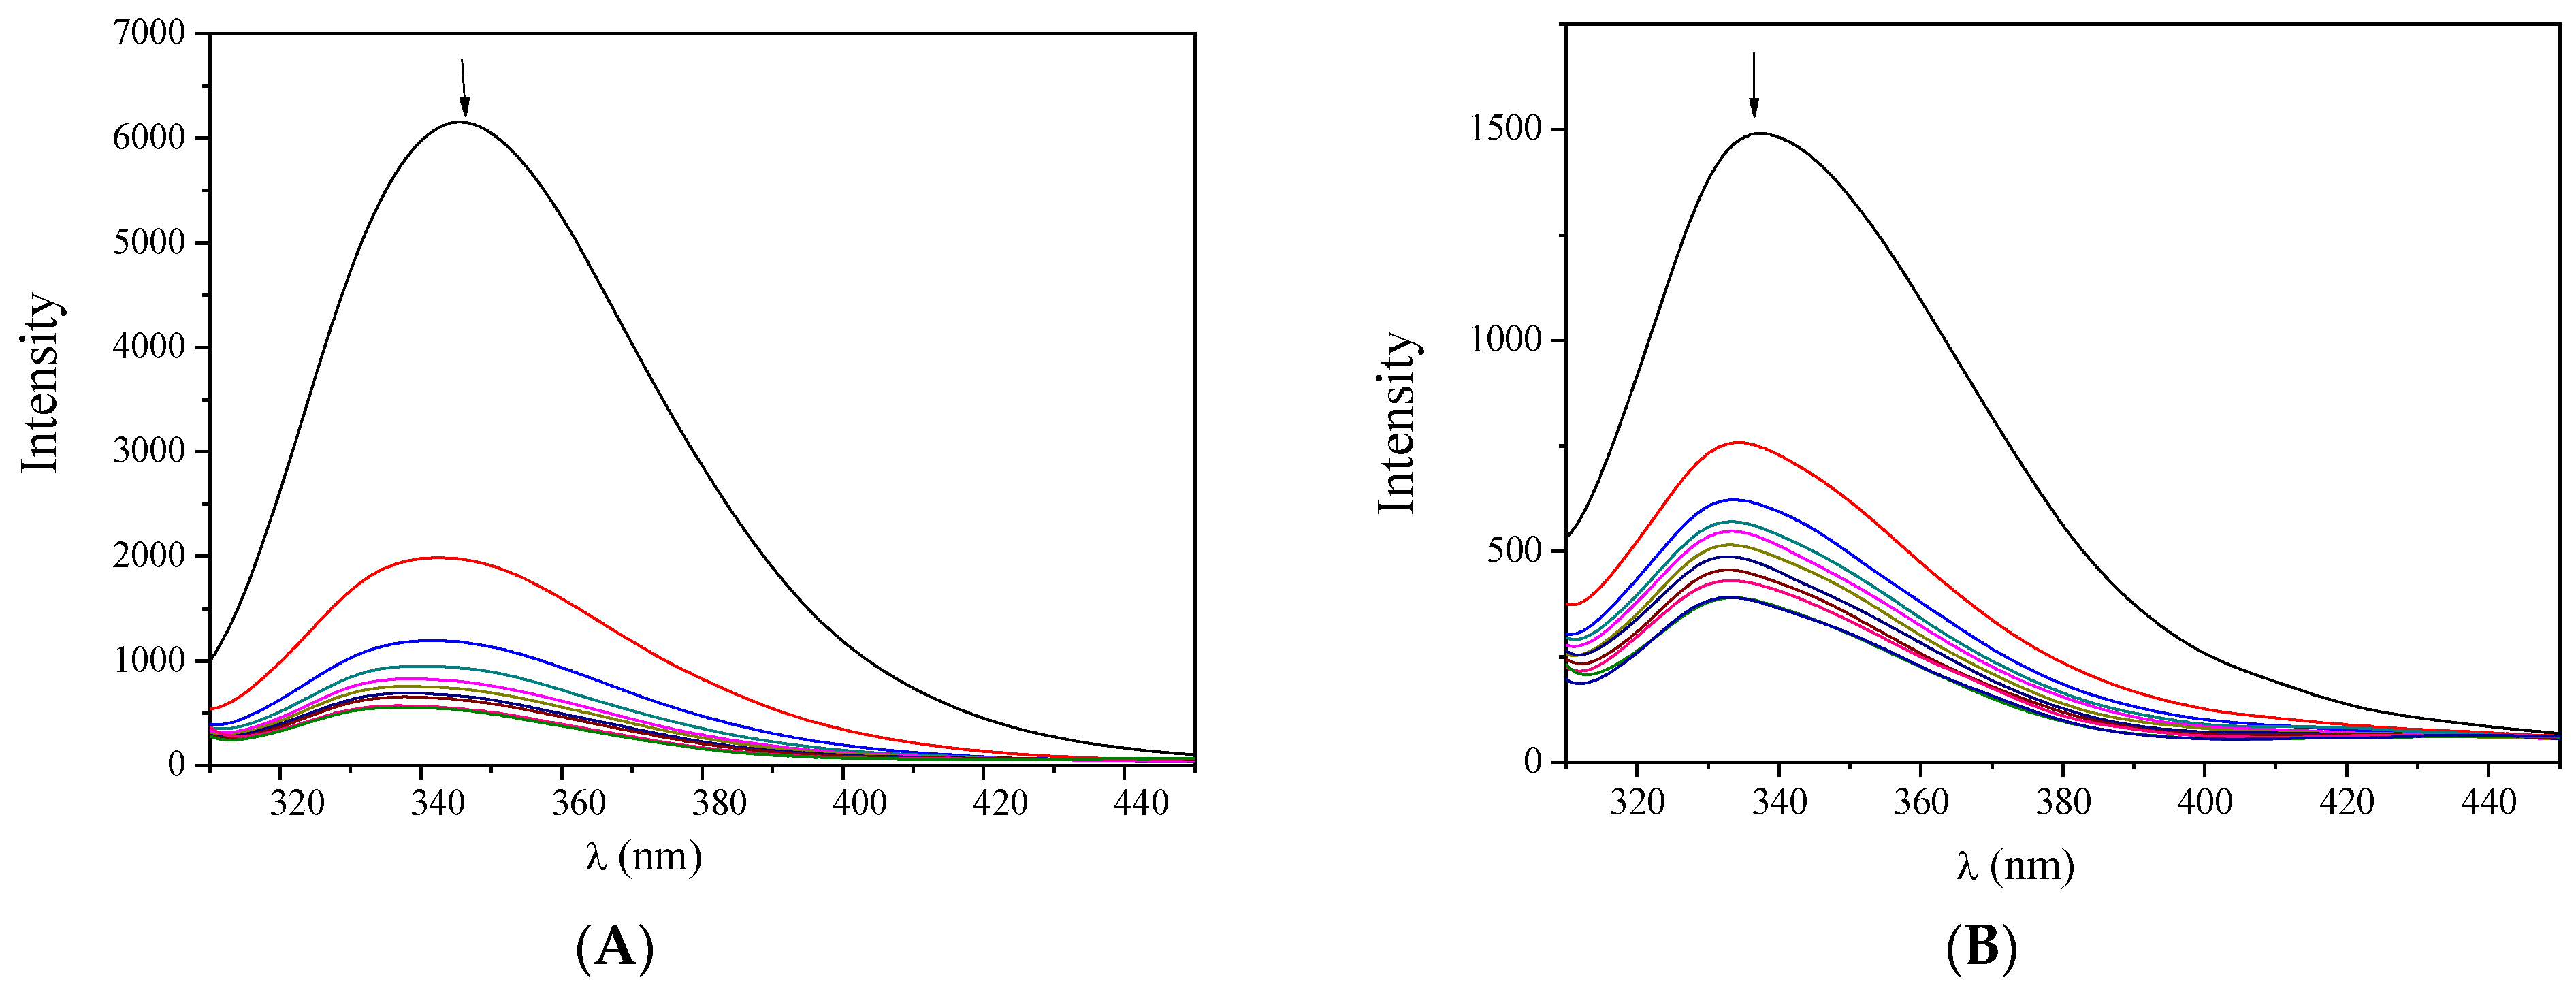
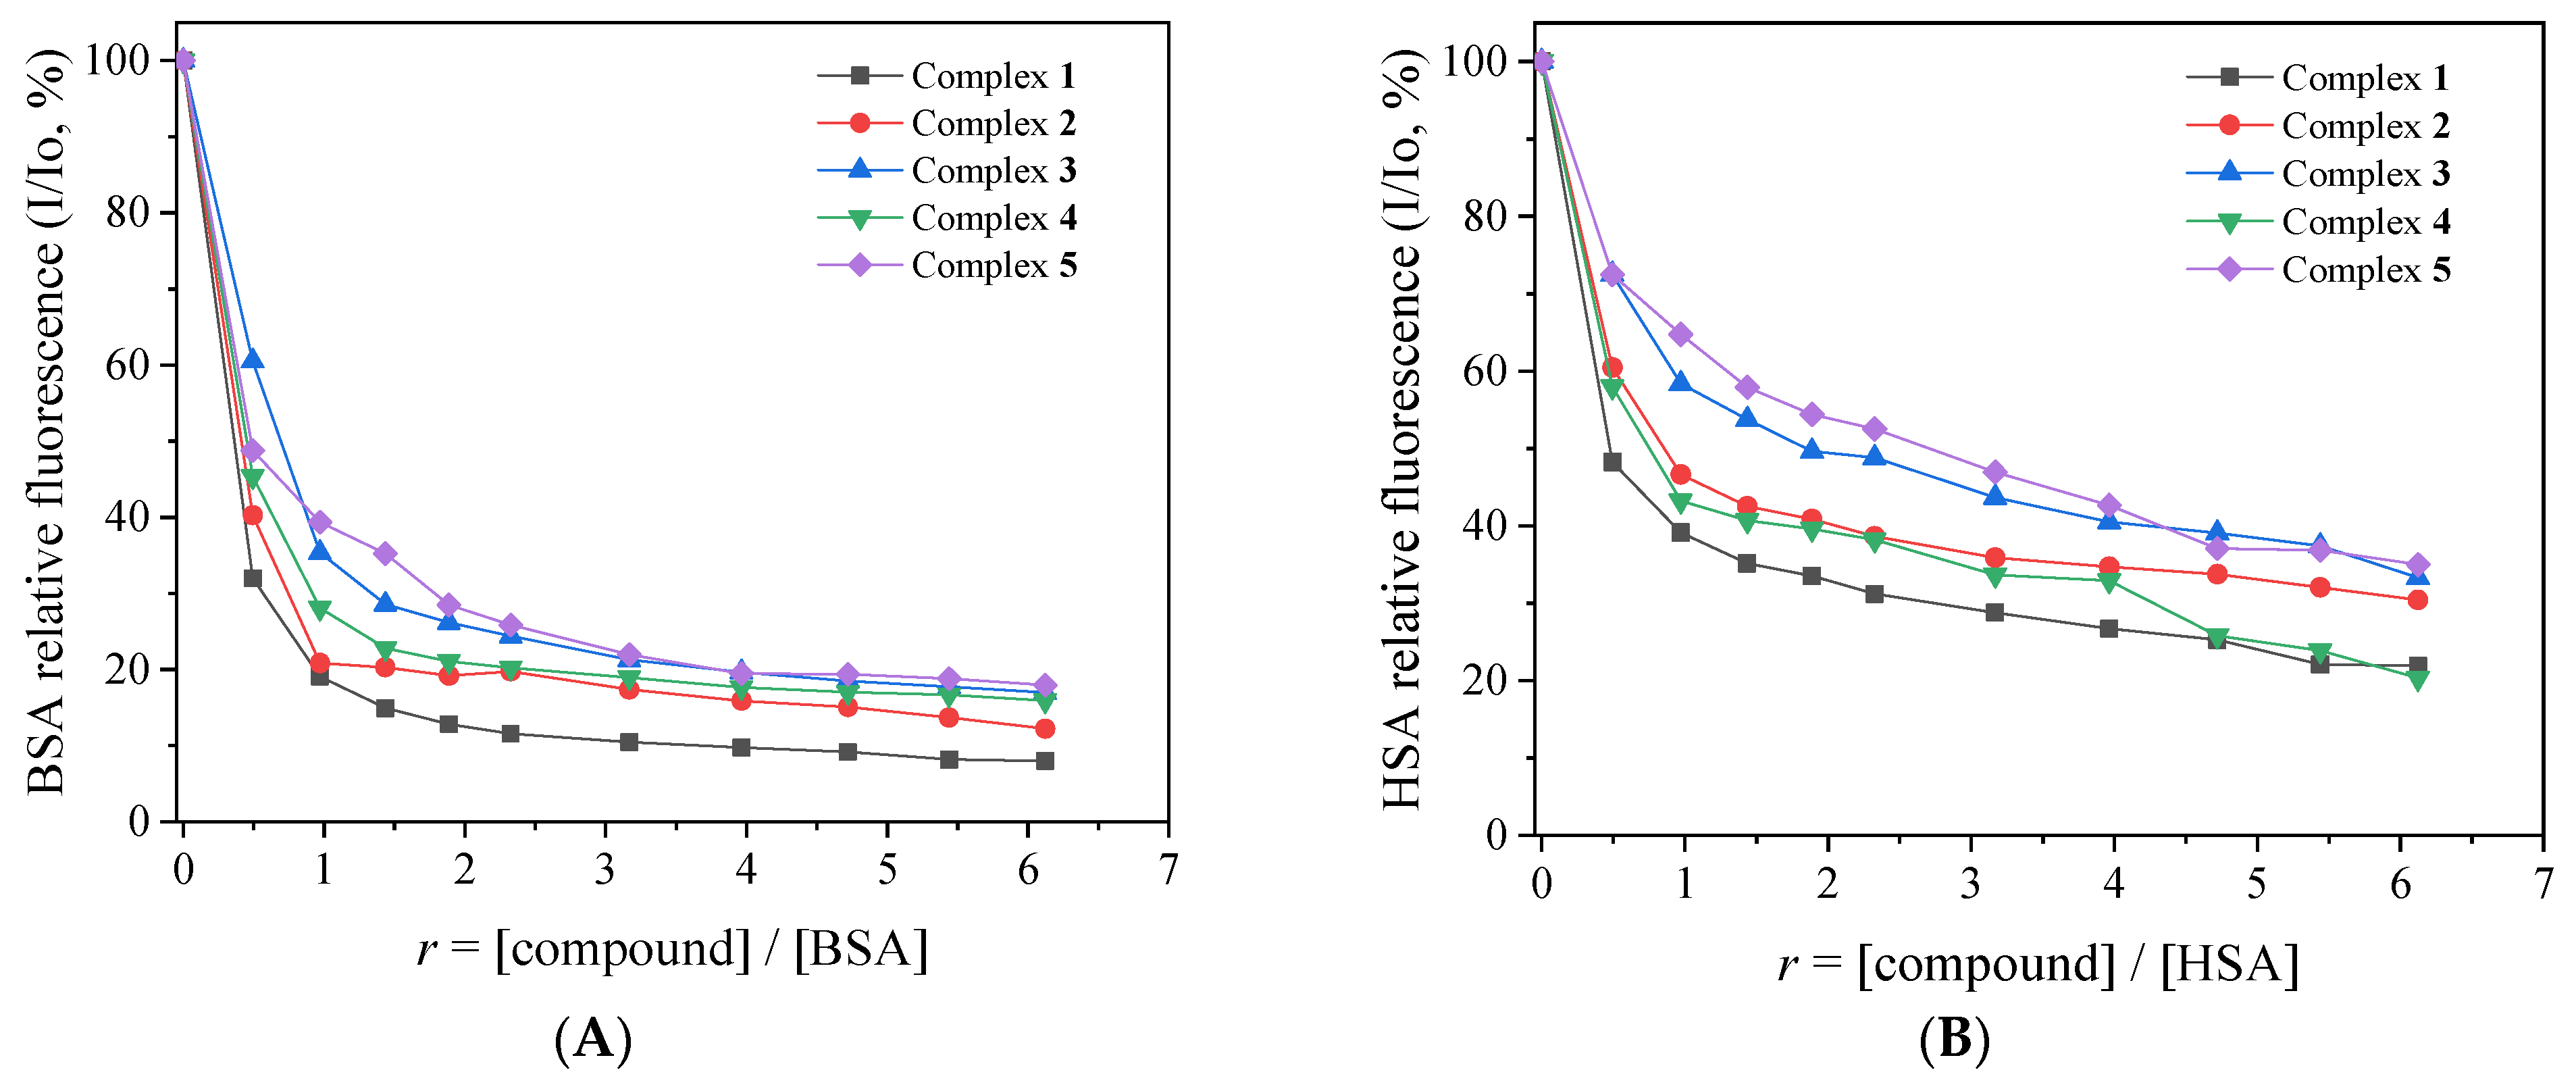
The fluorescence emission spectra (excitation at 295 nm) of the albumins (3 μM) in buffer solution were recorded in the presence of increasing amounts of complexes 1–5 (Figure 6, Figures S8 and S9). The intense fluorescence emission band observed at 345 nm (for BSA) or 340 nm (for HSA) exhibited a significant quenching (up to 92% of the initial emission intensity) in the presence of the complexes (Figure 7). Such quenching may result from the changes in the albumin’s secondary structure and may be attributed to possible alterations of tryptophan residues of Sas and serves as an indication of the interaction of the complexes with the albumins [48].
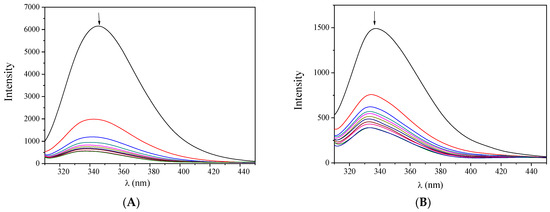
Figure 6.
Fluorescence emission spectra (λexcitation = 295 nm) of (A) BSA (3 μM) and (B) HSA (3 μM) in buffer solution (150 mM NaCl and 15 mM trisodium citrate at pH 7.0) in the presence of increasing amounts of complex 1. The arrows show the changes in intensity upon increasing amounts of the complex.
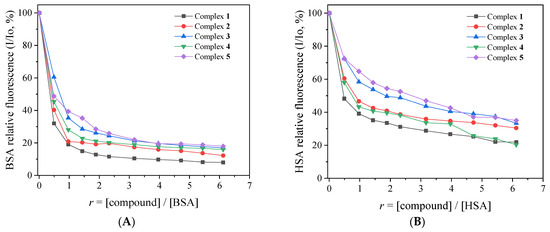
Figure 7.
(A) Plot of % relative fluorescence intensity of BSA at λem = 345 nm (I/Io, %) versus r (r = [compound]/[BSA]) for its complexes 1–5 (up to 8.0% of the initial BSA fluorescence for complex 1, 12.3% for complex 2, 17.0% for complex 3, 15.9% for complex 4, and 18.0% for complex 5). (B) Plot of % relative fluorescence intensity of HSA at λem = 340 nm (I/Io, %) versus r (r = [compound]/[HSA]) for complexes 1–5 (up to 21.9% of the initial HSA fluorescence for complex 1, 30.4% for complex 2, 33.3% for complex 3, 20.3% for complex 4, and 35.0% for complex 5).
The interaction of the complexes with the albumins was assessed through the SA-quenching constants (Kq) and the SA-binding constants (K) calculated with the Stern–Volmer and Scatchard equations and the corresponding plots, respectively. The Kq constants were calculated with the Stern–Volmer equations (Equations (S2) and (S3)) and plots (Figures S10 and S11) applying the value of τ0 = 10−8 s as the fluorescence lifetime of tryptophan in SAs [48]. The Kq values of the complexes for both albumins (Table 4) are of the order of 1012–1013 M−1s−1 and are much higher than the value of 1010 M−1s−1, revealing the existence of a static quenching mechanism [48], which confirms the interaction of the compounds with the albumin.

Table 4.
The BSA/HSA-quenching constants (Kq, in M−1s−1) and the BSA/HSA-binding constants (K, in M−1) calculated for complexes 1–5.
The K values of the complexes for both SAs were calculated with the Scatchard equation (Equation (S5)) and corresponding plots (Figures S12 and S13). They are of 105–106 M−1 magnitude, showing a tight interaction of the complexes with the albumins. The Kq and K constants of complexes 1–5 (Table 4) are comparable with those recently reported (for BSA: Kq = 6.83 × 10¹² – 2.11 × 10¹⁴ M−1s−1, K = 8.21 × 10⁴ – 2.11 × 10⁶ M−1; for HSA: Kq = 6.00×10¹² – 4.22×10¹³ M−1s−1, K = 2.23×10⁴ – 1.99×10⁶ M−1) for metal complexes with 3,5-diBr-salo– ligands [29,30,31,32,33] and higher than most reported Mn(II) complexes with di- or mono-substituted salicylaldehydes (Kq(BSA) = 3.32×10¹² – 3.14 × 10¹³ M−1s−1, K(BSA) = 2.37 × 10⁴ – 4.79 × 10⁵ M−1) [25,26].
In addition, the SA-binding constants of all complexes under study are significantly lower than the value of 1015 M−1, which is the highest binding constant found for the noncovalent interactions involving avidin. Based on this comparison, we may conclude that the herein reported complexes 1–5 can reversibly bind to the albumins and may be transferred and released at possible biological targets [53].
3. Experimental Section
3.1. Materials–Instrumentation–Methods
Information concerning materials, instrumentation, and physical measurements is cited in the Supplementary Materials (Section S1) [54] (abbreviations used for IR spectra: vs. = very strong; s = strong; sm = strong-to-medium; m = medium).
The procedure regarding the determination of crystal structure of complex 2 with single-crystal X-ray crystallography is described in the Supporting Information file (Section S2) [55,56,57,58]. Details of crystal data and structure refinement parameters are shown in Table S1 [59,60].
All the procedures and relevant equations used in the in vitro study of the biological activity (interaction with CT DNA, HSA, and BSA) of the compounds are described in the Supplementary Materials (Sections S3 and S4) [61].
3.2. Synthesis of the Complexes
3.2.1. Synthesis of [Mn(3,5-diBr-salo)2(CH3OH)2] (Complex 1)
A methanolic solution containing 3,5-diBr-saloH (0.5 mmol, 140 mg) and CH3ONa (0.5 mmol, 27 mg) was stirred for 1 h and afterwards was added into a methanolic solution of MnCl2∙4H2O (0.25 mmol, 49 mg) at RT. The reaction mixture was stirred for an additional 60 min and left to slowly evaporate. After two weeks, a beige microcrystalline product (yield: 85 mg, 50%) of complex 1 was collected with filtration. Anal. Calc. for [Mn(3,5-diBr-salo)2(MeOH)2] (C16H14Br4MnO6) (MW = 676.86). C: 28.39, H: 2.08%; found: C: 28.55, H: 2.17%. IR (KBr disk), νmax (in cm−1): (O–H)MeOH, 3400(m); v(C=O), 1641(s); v(C–O → Mn), 1312(m). UV–vis: as nujol mull, λ (in nm): 419 (sh (shoulder)); in DMSO, λ (in nm) (ε, in M−1 cm−1): 425 (10200), 268 (9140). μeff at RT = 5.90 BM. The complex is soluble in DMF and DMSO (ΛM = 10 S·cm2·mol−1, in 1 mM DMSO solution) and partially soluble in methanol.
3.2.2. Synthesis of Complexes [Mn(3,5-diBr-salo)2(N,N′-donor) (Complexes 2–5)
Complexes 2–5 were prepared at RT according to the following procedure: a methanolic solution (10 mL) of CH3ONa (0.5 mmol, 27 mg) and 3,5–diBr–saloH (0.5 mmol, 70 mg) was stirred for 30 min in order to deprotonate 3,5–dibromo–salicylaldehyde. Afterwards, the resultant solution was added dropwise and simultaneously with a solution of the corresponding N,N′-donor (0.25 mmol) into a methanolic solution of MnCl2∙4H2O (0.25 mmol, 49 mg). The final solution was stirred for an additional 45 min and was left to evaporate slowly. The formation of the desired product was observed after a few days.
[Mn(3,5-diBr-salo)2(bipyam)] (complex 2): For the synthesis of complex 2, bipyam (0.25 mmol, 43 mg) was used as the N,N′-donor. Light-brown crystals of 2 (90 mg, 45%) suitable for X-ray crystallography were collected after ten days. Anal. Calc. for [Mn(3,5-diBr-salo)2(bipyam)] (C24H15Br4MnN3O4) (MW = 783.94). C: 36.77, H: 1.93, N: 5.36%; found: C: 36.60, H: 1.83, N: 5.13%. IR (KBr disk), νmax (in cm−1): ν(C=O)aldehydo, 1641 (s); ν(C–O)phenolato, 1306 (sm); ρ(C–H)bipyam, 767 (m). UV–vis: as nujol mull, λ (in nm): 422 (sh); in DMSO, λ (in nm) (ε, in M−1 cm−1): 425 (6250), 315 (7500), 287 (9500). μeff at RT = 5.96 BM. The complex is soluble in DMF and DMSO (ΛM = 8 S·cm2·mol−1, in 1 mM DMSO solution) and partially soluble in methanol and acetonitrile.
CCDC deposition number 2,468,794 contains the supplementary crystallographic data for complex 2. These data can be obtained free of charge via www.ccdc.cam.ac.uk (or from the Cambridge Crystallographic Data Centre, 12 Union Road, Cambridge CB21EZ, UK; fax: (+44) 1223–336–033; or deposit@ccdc.cam.ac.uk).
[Mn(3,5-diBr-salo)2(bipy)] (complex 3): For the synthesis of complex 3, bipy (0.25 mmol, 39 mg) was used as the N,N′-donor. The orange product of complex 3 (yield: 95 mg, 50%) was collected with filtration after two weeks. Anal. Calc. for [Mn(3,5-diBr-salo)2(bipy)] (C24H14Br4MnN2O4) (MW = 768.96). C: 37.49, H: 1.83, N: 3.64%; found: C: 37.65, H: 1.69, N: 3.46%. IR (KBr disk), νmax (in cm−1): ν(C=O)aldehydo, 1625 (s); ν(C–O)phenolato, 1324 (sm); ρ(C–H)bipy, 760 (m). UV–vis: as nujol mull, λ (in nm): 415 (sh); in DMSO, λ (in nm) (ε, in M−1cm−1): 425 (7450), 283 (8040). μeff at RT = 5.88 BM. The complex is soluble in DMF and DMSO (ΛM = 15 S·cm2·mol−1, in 1 mM DMSO solution) and partially soluble in acetonitrile.
[Mn(3,5-diBr-salo)2(phen)] (complex 4): For the synthesis of complex 4, phen (0.25 mmol, 45 mg) was used as the N,N′-donor. The orange product of complex 4 (yield: 105 mg, 52%) was collected with filtration after two weeks. Anal. Calc. for [Mn(3,5-diBr-salo)2(phen)] (C26H14Br4MnN2O4) (MW = 792.98). C: 39.38, H: 1.78, N: 3.53%; found: C: 39.56, H: 1.67, N: 3.33%. IR (KBr disk), νmax (in cm−1): ν(C=O)aldehydo, 1632 (s); ν(C–O)phenolato, 1325 (sm); ρ(C–H)phen, 729 (m). UV–vis: as nujol mull, λ (in nm): 421 (sh); in DMSO, λ (in nm) (ε, in M−1 cm−1): 425 (6200), 300 (11500). μeff at RT = 5.87 BM. The complex is soluble in DMF and DMSO (ΛM = 11 S·cm2·mol−1, in 1 mM DMSO solution) and partially soluble in methanol and acetonitrile.
[Mn(3,5-diBr-salo)2(neoc)] (complex 5): For the synthesis of complex 5, neoc (0.25 mmol, 52 mg) was used as the N,N′-donor. The orange product of complex 5 (yield: 95 mg, 45%) was collected with filtration after twenty days. Anal. Calc. for [Mn(3,5-diBr-salo)2(neoc)] (C28H18Br4MnN2O4) (MW = 821.04). C: 40.96, H: 2.21, N: 3.41%; found: C: 40.75, H: 2.37, N: 3.26%. IR (KBr disk), νmax (in cm−1): ν(C=O)aldehydo, 1632 (s); ν(C–O)phenolato, 1328 (sm); ρ(C–H)neoc, 735 (m). UV–vis: as nujol mull, λ (in nm): 419 (sh); in DMSO, λ (in nm) (ε, in M−1 cm−1): 425 (6430), 311 (5500), 279 (6120). μeff at RT = 5.85 BM. The complex is soluble in DMF and DMSO (ΛM = 10 S·cm2·mol−1, in 1 mM DMSO solution) and partially soluble in methanol.
4. Conclusions
Five neutral mononuclear manganese(II) complexes with 3,5–dibromo–salicylaldehyde (3,5–diBr–saloH) were synthesized in the absence or the presence of the N,N′-donors 2,2′–bipyridylamine (bipyam), 2,2′–bipyridine (bipy), 1,10–phenanthroline (phen), and 2,9–dimethyl–1,10–phenanthroline (neoc) and were characterized with various techniques. The 3,5–diBr–salo– ligands are bound to the manganese(II) ion in a bidentate fashion via the deprotonated phenolato and the carbonyl oxygen atoms. The manganese(II) ions are six-coordinated with a distorted octahedral geometry.
The complexes interact with linear CT DNA via intercalation as derived from the techniques employed, and complex [Mn(3,5-diBr-salo)2(bipy)] exhibits the highest DNA-binding constant (Kb = 6.58 × 10⁵ M−1) among the compounds studied herein. Furthermore, the complexes tightly and reversibly bind to human and serum albumins, as concluded from the values of the corresponding binding constants calculated. The DNA- and albumin-binding constants of complexes 1–5 are among the highest constants of the reported manganese(II) complexes with di- or mono-substituted salicylaldehydes. In conclusion, complexes 1–5 showed promising features regarding the interaction with biomolecules, deserving further bioactivity studies in future projects.
Supplementary Materials
The following supporting information can be downloaded at: https://www.mdpi.com/article/10.3390/inorganics13080263/s1; Cif file for complex 2; Checkcif file for complex 2; Information for materials, instrumentation, and physical measurements (Section S1); Procedure for single-crystal X-ray crystallography (Section S2); Protocols and equations regarding interaction studies with CT DNA (Section S3); Albumin-binding studies (Section S4). Table S1 and Figures S1–S13 are included in the ESI file.
Author Contributions
Conceptualization, V.T., A.Z., and G.P.; methodology, V.T., A.Z., and G.P.; formal analysis, V.T., A.Z., A.G.H., and G.P.; investigation, V.T., A.Z., and A.G.H.; resources, A.G.H. and G.P.; data curation, V.T., A.Z., A.G.H., and G.P.; writing—original draft preparation, V.T., A.Z., A.G.H., and G.P.; writing—review and editing, G.P.; supervision, G.P.; project administration, G.P.; funding acquisition, G.P. All authors have read and agreed to the published version of the manuscript.
Funding
This research received no external funding.
Institutional Review Board Statement
Not applicable.
Informed Consent Statement
Not applicable.
Data Availability Statement
Data are contained within the article and Supplementary Materials.
Conflicts of Interest
The authors declare no conflicts of interest.
Abbreviations
The following abbreviations are used in this manuscript:
| 3,5-diBr–saloH | 3,5–dibromo–salicylaldehyde |
| 4-OMe–saloH | 4–methoxy–salicylaldehyde |
| 5-Br–saloH | 5–bromo–salicylaldehyde |
| 5-Cl–saloH | 5–chloro–salicylaldehyde |
| 5-NO2–saloH | 5–nitro–salicylaldehyde |
| bipy | 2,2′–bipyridine |
| bipyam | 2,2′–bipyridylamine |
| BSA | bovine serum albumin |
| CT | calf-thymus |
| EB | ethidium bromide |
| HSA | human serum albumin |
| K | SA-binding constant |
| Kb | DNA-binding constant |
| Kq | quenching constant |
| KSV | Stern–Volmer constant |
| neoc | 2,9–dimethyl–1,10–phenanthroline |
| phen | 1,10–phenanthroline |
| RT | room-temperature |
| SA | serum albumin |
| saloH | salicylaldehyde |
| X–saloH | substituted salicylaldehyde |
References
- Mullins, C.S.; Pecoraro, V.L. Reflections on Small Molecule Manganese Models That Seek to Mimic Photosynthetic Water Oxidation Chemistry. Coord. Chem. Rev. 2008, 252, 416–443. [Google Scholar] [CrossRef]
- Wu, A.J.; Penner-Hahn, J.E.; Pecoraro, V.L. Structural, Spectroscopic, and Reactivity Models for the Manganese Catalases. Chem. Rev. 2004, 104, 903–938. [Google Scholar] [CrossRef] [PubMed]
- Horning, K.J.; Caito, S.W.; Tipps, K.G.; Bowman, A.B.; Aschner, M. Manganese Is Essential for Neuronal Health. Annu. Rev. Nutr. 2015, 35, 71–108. [Google Scholar] [CrossRef] [PubMed]
- Li, L.; Yang, X. The Essential Element Manganese, Oxidative Stress, and Metabolic Diseases: Links and Interactions. Oxid. Med. Cell Longev. 2018, 2018, 7580707. [Google Scholar] [CrossRef] [PubMed]
- Krstic, N.S.; Nikolic, R.S.; Stankovic, M.N.; Nikolic, N.G.; Djordjevic, D.M. Coordination Compounds of M(II) Biometal Ions with Acid-Type Anti-Inflammatory Drugs as Ligands—A Review. Trop. J. Pharm. Res. 2015, 14, 337–349. [Google Scholar] [CrossRef]
- Peres, T.V.; Schettinger, M.R.C.; Chen, P.; Carvalho, F.; Avila, D.S.; Bowman, A.B.; Aschner, M. Manganese-Induced Neurotoxicity: A Review of Its Behavioral Consequences and Neuroprotective Strategies. BMC Pharmacol. Toxicol. 2016, 17, 57. [Google Scholar] [CrossRef]
- Eremina, J.A.; Ermakova, E.A.; Smirnova, K.S.; Klyushova, L.S.; Berezin, A.S.; Sukhikh, T.S.; Zubenko, A.A.; Fetisov, L.N.; Kononenko, K.N.; Lider, E.V. Cu(II), Co(II), Mn(II) Complexes with 5-Phenyltetrazole and Polypyridyl Ligands: Synthesis, Characterization and Evaluation of the Cytotoxicity and Antimicrobial Activity. Polyhedron 2021, 206, 115352. [Google Scholar] [CrossRef]
- Abdallah, A.M.; Zaki, N.G.; Mahmoud, W.H.; El Kerdawy, A.M.; Mohamed, G.G. Synthesis, Structural Characterization, Density Functional Theory Calculations, and Antimicrobial, Anticancer, and Antimetastatic Properties of Nanosized Heteroleptic Complexes of Cocaine/TMEDA with d-Block Metal Ions. Appl. Organomet. Chem. 2021, 35, e6441. [Google Scholar] [CrossRef]
- Archana, B.; Sreedaran, S. Synthesis, Characterization, DNA Binding and Cleavage Studies, in-Vitro Antimicrobial, Cytotoxicity Assay of New Manganese(III) Complexes of N-Functionalized Macrocyclic Cyclam Based Schiff Base Ligands. Polyhedron 2023, 231, 116269. [Google Scholar] [CrossRef]
- Bourouai, M.A.; Bouchoucha, A.; Si Larbi, K.; Cosnier, S.; Djebbar, S. Novel Mn(II) and Cu(II) Metal Complexes with Sulfa Drug-Derived Ligands as Potent Antimicrobial and Anticancer Agents: In Vitro Studies, ADMET Profile and Molecular Docking. Polyhedron 2024, 253, 116914. [Google Scholar] [CrossRef]
- Friaes, S.; Trigueiros, C.; Gomes, C.S.B.; Fernandes, A.R.; Lenis-Rojas, O.A.; Martins, M.; Royo, B. Antimicrobial Activity of Manganese(I) Tricarbonyl Complexes Bearing 1,2,3-Triazole Ligands. Molecules 2023, 28, 7453. [Google Scholar] [CrossRef]
- Saleem, S.; Parveen, B.; Abbas, K.; Iqbal, S.; Altaf, A.A.; Kausar, S. Synthesis, Structural Elucidation, Molecular Modeling and Antimicrobial Studies of Mn(II), Co(II), Ni(II), and Cu(II) Complexes Containing NO Donor Bidentate Schiff Base. Appl. Organomet. Chem. 2023, 37, e7234. [Google Scholar] [CrossRef]
- Swiderski, G.; Wojtulewski, S.; Kalinowska, M.; Swisłocka, R.; Wilczewska, A.Z.; Pietryczuk, A.; Cudowski, A.; Lewandowski, W. The Influence of Selected Transition Metal Ions on the Structure, Thermal and Microbiological Properties of Pyrazine-2-Carboxylic Acid. Polyhedron 2020, 175, 114173. [Google Scholar] [CrossRef]
- Jablonska-Wawrzycka, A.; Rogala, P.; Czerwonka, G.; Michalkiewicz, S.; Hodorowicz, M.; Galczynska, K.; Cieslak, B.; Kowalczyk, P. Tuning Anti-Biofilm Activity of Manganese(Ii) Complexes: Linking Biological Effectiveness of Heteroaromatic Complexes of Alcohol, Aldehyde, Ketone, and Carboxylic Acid with Structural Effects and Redox Activity. Int. J. Mol. Sci. 2021, 22, 4847. [Google Scholar] [CrossRef] [PubMed]
- Dimiza, F.; Hatzidimitriou, A.G.; Psomas, G. Manganese(II) Complexes with Non-Steroidal Anti-Inflammatory Drugs: Structure and Biological Activity. Int. J. Mol. Sci. 2024, 25, 13457. [Google Scholar] [CrossRef] [PubMed]
- Sakthikumar, K.; Kabuyaya Isamura, B.; Krause, R.W.M. Exploring the Antioxidant, Antimicrobial, Cytotoxic and Biothermodynamic Properties of Novel Morpholine Derivative Bioactive Mn(II), Co(II) and Ni(II) Complexes—Combined Experimental and Theoretical Measurements towards DNA/BSA/SARS-CoV-2 3CLPro. RSC Med. Chem. 2023, 14, 1667–1697. [Google Scholar] [CrossRef] [PubMed]
- Guo, Z.; Sadler, P.J. Metals in Medicine. Angew. Chem. Int. Ed. 1999, 38, 1512–1531. [Google Scholar] [CrossRef]
- Elo, H.; Kuure, M.; Pelttari, E. Correlation of the Antimicrobial Activity of Salicylaldehydes with Broadening of the NMR Signal of the Hydroxyl Proton. Possible Involvement of Proton Exchange Processes in the Antimicrobial Activity. Eur. J. Med. Chem. 2015, 92, 750–753. [Google Scholar] [CrossRef]
- Pelttari, E.; Karhumaki, E.; Langshaw, J.; Perakyla, H.; Elo, H. Antimicrobial Properties of Substituted Salicylaldehydes and Related Compounds. Z. Naturforschung C 2007, 62, 487–497. [Google Scholar] [CrossRef]
- Bountagkidou, O.G.; Ordoudi, S.A.; Tsimidou, M.Z. Structure–Antioxidant Activity Relationship Study of Natural Hydroxybenzaldehydes Using in Vitro Assays. Food Res. Int. 2010, 43, 2014–2019. [Google Scholar] [CrossRef]
- Kordestani, N.; Rudbari, H.A.; Fernandes, A.R.; Raposo, L.R.; Baptista, P.V.; Ferreira, D.; Bruno, G.; Bella, G.; Scopelliti, R.; Braun, J.D.; et al. Antiproliferative Activities of Diimine-Based Mixed Ligand Copper(II) Complexes. ACS Comb. Sci. 2020, 22, 89–99. [Google Scholar] [CrossRef]
- Xu, Z.; Yang, Z.; Liu, Y.; Lu, Y.; Chen, K.; Zhu, W. Halogen Bond: Its Role beyond Drug–Target Binding Affinity for Drug Discovery and Development. J. Chem. Inf. Model. 2014, 54, 69–78. [Google Scholar] [CrossRef]
- Varadwaj, P.R.; Varadwaj, A.; Marques, H.M. Halogen Bonding: A Halogen-Centered Noncovalent Interaction Yet to Be Understood. Inorganics 2019, 7, 40. [Google Scholar] [CrossRef]
- Lu, Y.; Wang, Y.; Zhu, W. Nonbonding Interactions of Organic Halogens in Biological Systems: Implications for Drug Discovery and Biomolecular Design. Phys. Chem. Chem. Phys. 2010, 12, 4543–4551. [Google Scholar] [CrossRef] [PubMed]
- Ntanatsidis, S.; Perontsis, S.; Konstantopoulou, S.; Kalogiannis, S.; Hatzidimitriou, A.G.; Papadopoulos, A.N.; Psomas, G. Manganese(II) Complexes of Substituted Salicylaldehydes and α-Diimines: Synthesis, Characterization and Biological Activity. J. Inorg. Biochem. 2022, 227, 111693. [Google Scholar] [CrossRef] [PubMed]
- Stamou, P.; Hatzidimitriou, A.G.; Psomas, G. Manganese(II) Complexes with 5–Nitro–2–Hydroxy–Benzaldehyde or Substituted 2–Hydroxy–Phenones: Structure and Interaction with Bovine Serum Albumin and Calf–Thymus DNA. J. Inorg. Biochem. 2022, 235, 111923. [Google Scholar] [CrossRef]
- Feng, D.; Wang, B.; Wang, L.; Abraham, N.; Tao, K.; Huang, L.; Shi, W.; Dong, Y.; Qu, Y. Pre-Ischemia Melatonin Treatment Alleviated Acute Neuronal Injury after Ischemic Stroke by Inhibiting Endoplasmic Reticulum Stress-Dependent Autophagy via PERK and IRE1 Signalings. J. Pineal Res. 2017, 62, e12395. [Google Scholar] [CrossRef]
- Thapa, K.; Khan, H.; Singh, T.G.; Kaur, A. Traumatic Brain Injury: Mechanistic Insight on Pathophysiology and Potential Therapeutic Targets. J. Mol. Neurosci. 2021, 71, 1725–1742. [Google Scholar] [CrossRef]
- Zianna, A.; Geromichalou, E.; Geromichalos, G.; Fiotaki, A.M.; Hatzidimitriou, A.G.; Kalogiannis, S.; Psomas, G. Zinc(II) Complexes of 3,5–Dibromo–Salicylaldehyde and α–Diimines: Synthesis, Characterization and in Vitro and in Silico Biological Profile. J. Inorg. Biochem. 2022, 226, 111659. [Google Scholar] [CrossRef]
- Christidou, A.; Zavalani, K.; Hatzidimitriou, A.G.; Psomas, G. Copper(II) Complexes with 3,5–Dihalogeno–Salicylaldehydes: Synthesis, Structure and Interaction with DNA and Albumins. J. Inorg. Biochem. 2023, 238, 112049. [Google Scholar] [CrossRef]
- Psarras, G.I.; Zianna, A.; Hatzidimitriou, A.G.; Psomas, G. Coordination Compounds of Nickel(II) with 3,5–Dibromo–Salicylaldehyde: Structure and Interaction with Biomolecules. Inorganics 2024, 12, 138. [Google Scholar] [CrossRef]
- Papadopoulos, Z.; Hatzidimitriou, A.G.; Psomas, G. Iron(III) Complexes with Substituted Salicylaldehydes: Synthesis, Interaction with DNA and Serum Albumins, and Antioxidant Activity. Molecules 2025, 30, 2383. [Google Scholar] [CrossRef]
- Zianna, A.; Geromichalos, G.; Fiotaki, A.M.; Hatzidimitriou, A.G.; Kalogiannis, S.; Psomas, G. Palladium(II) Complexes of Substituted Salicylaldehydes: Synthesis, Characterization and Investigation of Their Biological Profile. Pharmaceuticals 2022, 15, 886. [Google Scholar] [CrossRef] [PubMed]
- Aryaeifar, M.; Rudbari, H.A.; Moreno-Pineda, E.; Cuevas-Vicario, J.V.; Paul, S.; Schulze, M.; Wernsdorfer, W.; Lloret, F.; Moini, N.; Blacque, O. Synthesis, Characterization and Magnetic Properties of Halogenated Tetranuclear Cubane-like Nickel(II) Complexes. New J. Chem. 2024, 48, 3603–3613. [Google Scholar] [CrossRef]
- Geary, W.J. The Use of Conductivity Measurements in Organic Solvents for the Characterisation of Coordination Compounds. Coord. Chem. Rev. 1971, 7, 81–122. [Google Scholar] [CrossRef]
- Chiswell, B.; McKenzie, E.D.; Lindoy, L.F. 41 Manganese. Compr. Coord. Chem. 1987, 4, 1–122. [Google Scholar]
- Nakamoto, K. Infrared and Raman Spectra of Inorganic and Coordination Compounds: Part B: Applications in Coordination, Organometallic, and Bioinorganic Chemistry. In Infrared and Raman Spectra of Inorganic and Coordination Compounds: Part B: Applications in Coordination, Organometallic, and Bioinorganic Chemistry; John Wiley & Sons: Hoboken, NJ, USA, 2008; pp. 1–408. [Google Scholar] [CrossRef]
- Papadopoulos, C.D.; Lalia-Kantouri, M.; Jaud, J.; Hatzidimitriou, A.G. Substitution Effect on New Co(II) Addition Compounds with Salicylaldehydes and the Nitrogenous Bases Phen or Neoc: Crystal and Molecular Structures of [CoII(5-NO2-Salicylaldehyde)2(Phen)], [CoII(5-CH3-Salicylaldehyde)2(Neoc)] and [CoII(5-Cl-Salicylaldehyde)2(Neoc)]. Inorganica Chim. Acta 2007, 360, 3581–3589. [Google Scholar] [CrossRef]
- Zianna, A.; Vradi, E.; Hatzidimitriou, A.G.; Kalogiannis, S.; Psomas, G. Zinc(II) Complexes of 3-Bromo-5-Chloro-Salicylaldehyde: Characterization and Biological Activity. Dalton Trans. 2022, 51, 17629–17641. [Google Scholar] [CrossRef]
- Zianna, A.; Sumar Ristovic, M.; Psomas, G.; Hatzidimitriou, A.; Coutouli-Argyropoulou, E.; Lalia-Kantouri, M. Cadmium(II) Complexes of 5-Nitro-Salicylaldehyde and α -Diimines: Synthesis, Structure and Interaction with Calf-Thymus DNA. J. Coord. Chem. 2015, 68, 4444–4463. [Google Scholar] [CrossRef]
- Hadjiliadis, N.D.; Sletten, E. Metal Complex-DNA Interactions; Hadjiliadis, N., Sletten, E., Eds.; Wiley: New York, NY, USA, 2009; ISBN 978-1-405-17629-3. [Google Scholar]
- Rehman, S.U.; Sarwar, T.; Husain, M.A.; Ishqi, H.M.; Tabish, M. Studying Non-Covalent Drug–DNA Interactions. Arch. Biochem. Biophys. 2015, 576, 49–60. [Google Scholar] [CrossRef]
- Zeglis, B.M.; Pierre, V.C.; Barton, J.K. Metallo-Intercalators and Metallo-Insertors. Chem. Commun. 2007, 44, 4565–4579. [Google Scholar] [CrossRef]
- Pyle, A.M.; Rehmann, J.P.; Meshoyrer, R.; Kumar, C.V.; Turro, N.J.; Barton, J.K. Mixed-Ligand Complexes of Ruthenium(II): Factors Governing Binding to DNA. J. Am. Chem. Soc. 2002, 111, 3051–3058. [Google Scholar] [CrossRef]
- Wolfe, A.; Shimer, G.H.; Meehan, T. Polycyclic Aromatic Hydrocarbons Physically Intercalate into Duplex Regions of Denatured DNA. Biochemistry 1987, 26, 6392–6396. [Google Scholar] [CrossRef] [PubMed]
- Dimitrakopoulou, A.; Dendrinou-Samara, C.; Pantazaki, A.A.; Alexiou, M.; Nordlander, E.; Kessissoglou, D.P. Synthesis, Structure and Interactions with DNA of Novel Tetranuclear, [Mn4(II/II/II/IV)] Mixed Valence Complexes. J. Inorg. Biochem. 2008, 102, 618–628. [Google Scholar] [CrossRef] [PubMed]
- Bravo-Anaya, L.; Rinaudo, M.; Martinez, F. Conformation and Rheological Properties of Calf-Thymus DNA in Solution. Polymers 2016, 8, 51. [Google Scholar] [CrossRef] [PubMed]
- Lakowicz, J.R. Principles of Fluorescence Spectroscopy; Springer: Berlin/Heidelberg, Germany, 2006; ISBN 0387312781. [Google Scholar]
- Heller, D.P.; Greenstock, C.L. Fluorescence Lifetime Analysis of DNA Intercalated Ethidium Bromide and Quenching by Free Dye. Biophys. Chem. 1994, 50, 305–312. [Google Scholar] [CrossRef]
- He, X.M.; Carter, D.C. Atomic Structure and Chemistry of Human Serum Albumin. Nature 1992, 358, 209–215. [Google Scholar] [CrossRef]
- Olson, R.E.; Christ, D.D. Chapter 33. Plasma Protein Binding of Drugs. Annu. Rep. Med. Chem. 1996, 31, 327–336. [Google Scholar] [CrossRef]
- Stella, L.; Capodilupo, A.L.; Bietti, M. A Reassessment of the Association between Azulene and [60]Fullerene. Possible Pitfalls in the Determination of Binding Constants through Fluorescence Spectroscopy. Chem. Commun. 2008, 39, 4744–4746. [Google Scholar] [CrossRef]
- Laitinen, O.H.; Hytonen, V.P.; Nordlund, H.R.; Kulomaa, M.S. Genetically Engineered Avidins and Streptavidins. Cell. Mol. Life Sci. 2006, 63, 2992–3017. [Google Scholar] [CrossRef]
- Reichmann, M.E.; Rice, S.A.; Thomas, C.A.; Doty, P. A Further Examination of the Molecular Weight and Size of Desoxypentose Nucleic Acid. J. Am. Chem. Soc. 1954, 76, 3047–3053. [Google Scholar] [CrossRef]
- Apex2, Version 2 User Manual, M86–E01078; Bruker Analytical X–Ray Systems, Inc.: Madison, WI, USA, 2006.
- SADABS: Area–Detector Absorption Correction; Siemens Industrial Automation, Inc.: München, Germany, 1996.
- Palatinus, L.; Chapuis, G. SUPERFLIP—A Computer Program for the Solution of Crystal Structures by Charge Flipping in Arbitrary Dimensions. J. Appl. Crystallogr. 2007, 40, 786–790. [Google Scholar] [CrossRef]
- Betteridge, P.W.; Carruthers, J.R.; Cooper, R.I.; Prout, K.; Watkin, D.J. CRYSTALS Version 12: Software for Guided Crystal Structure Analysis. J. Appl. Crystallogr. 2003, 36, 1487. [Google Scholar] [CrossRef]
- de Meulenaer, J.; Tompa, H. The Absorption Correction in Crystal Structure Analysis. Acta Crystallogr. 1965, 19, 1014–1018. [Google Scholar] [CrossRef]
- Watkin, D.J.; Cooper, R.I. Why Direct and Post-Refinement Determinations of Absolute Structure May Give Different Results. Acta Crystallogr. B Struct. Sci. Cryst. Eng. Mater. 2016, 72, 661–683. [Google Scholar] [CrossRef]
- Wang, Y.-Q.; Zhang, H.-M.; Zhang, G.-C.; Tao, W.-H.; Tang, S.-H. Interaction of the Flavonoid Hesperidin with Bovine Serum Albumin: A Fluorescence Quenching Study. J. Lumin. 2007, 126, 211–218. [Google Scholar] [CrossRef]
Disclaimer/Publisher’s Note: The statements, opinions and data contained in all publications are solely those of the individual author(s) and contributor(s) and not of MDPI and/or the editor(s). MDPI and/or the editor(s) disclaim responsibility for any injury to people or property resulting from any ideas, methods, instructions or products referred to in the content. |
© 2025 by the authors. Licensee MDPI, Basel, Switzerland. This article is an open access article distributed under the terms and conditions of the Creative Commons Attribution (CC BY) license (https://creativecommons.org/licenses/by/4.0/).

