Article

Optimized NaYF4: Er3+/Yb3+ Upconversion Nanocomplexes via Oleic Acid for Biomedical Applications

1
Department of Chemistry, Hanoi Medical University, 1 Ton That Tung, Hanoi 100000, Vietnam
2
Faculty of Basic Science, Hanoi University of Mining and Geology, 18 Pho Vien, Hanoi 100000, Vietnam
3
Institute of Materials Science, Vietnam Academy of Science and Technology, 18 Hoang Quoc Viet, Hanoi 100000, Vietnam
4
Faculty of Biotechnology, Chemistry and Environmental Engineering, Phenikaa University, Yen Nghia, Ha Dong, Hanoi 100000, Vietnam
5
Faculty of Medical Technology, Hanoi Medical University, 1 Ton That Tung, Hanoi 100000, Vietnam
6
Faculty of Physics, VNU University of Science, Vietnam National University, Hanoi, 334 Nguyen Trai, Hanoi 100000, Vietnam
7
Institute of Biology, Vietnam Academy of Science and Technology, 18 Hoang Quoc Viet, Hanoi 100000, Vietnam
*
Authors to whom correspondence should be addressed.
Inorganics 2025, 13(5), 140; https://doi.org/10.3390/inorganics13050140
Submission received: 9 March 2025 / Revised: 15 April 2025 / Accepted: 23 April 2025 / Published: 29 April 2025
(This article belongs to the Special Issue Biological Activity of Metal Complexes)

Abstract

:
This study presents the synthesis of NaYF4: Er3+/Yb3+ upconversion luminescent nanomaterials using a wet chemistry method. The role of oleic acid in influencing the size, shape, and luminescent properties of the materials was also investigated. The results showed that, at a suitable oleic acid concentration of 10−3 M, the obtained nanoparticles exhibited a nearly spherical morphology with diameters ranging from 150 to 250 nm and predominantly display a hexagonal (β-NaYF4) crystalline phase. Photoluminescence measurements under 980 nm laser excitation reveal that these nanoparticles emit strong, stable luminescence with narrow emission bands characteristic of Er3+ transitions. Subsequently, the nanoparticles were coated with a silica shell, functionalized with amine groups, and conjugated with IgG antibodies via glutaraldehyde (GA) to form the bio-nano complex β-NaYF4: Er3+/Yb3+@SNGA-IgG. In vitro experiments using fluorescence microscopy demonstrated that the complex effectively labels HeLa cervical cancer cells. With its robust upconversion luminescence and excellent biocompatibility, the developed nanocomplex shows promising potential for rapid pathogen detection and other biomedical applications.

1. Introduction

Rare-earth ion-doped luminescent nanomaterials have attracted significant research interest due to their ability to exhibit both downconversion (DC) and upconversion (UC) luminescence. These properties are suitable for applications such as photocatalysis, security printing, solar cells, drug delivery, and cell labeling for biomedical applications [1,2,3,4,5,6,7,8].
Among these effects, upconversion luminescence has several advantages, including high sensitivity, generating a strong optical signal to enhance biological detection when using an infrared excitation source (e.g., 980 nm laser). Using infrared excitation sources that are non-damaging to cells, friendly to humans, and capable of penetrating several millimeters into human tissue allows deeper interaction with damaged areas. Consequently, these materials have attracted interest in medical applications, especially for pathogen detection and cancer cell labeling [9,10,11,12,13,14,15].
NaYF4 luminescent materials doped with Er3+ and Yb3+ ions are especially promising due to their upconversion effects. However, in order to achieve the target of using these materials for biomedical applications, numerous challenges still remain to be solved such as relatively low luminescence intensity compared to other materials and the need to optimize surface functionalization for effective biomolecule binding [16,17,18,19]. Researchers are, therefore, focusing on enhancing luminescence intensity, developing more stable and safer synthesis methods, and expanding applications for rapid and accurate pathogen detection. Controlled synthesis of nanoparticle size and shape is crucial, as these parameters directly influence optical properties and overall luminescence efficiency.
Oleic acid, a surfactant with the chemical formula C17H33COOH, plays a pivotal role in nanoparticle synthesis. Its cis C=C double bond facilitates the formation of a protective layer around nanoparticles, reducing energy loss and preventing aggregation. This protective effect allows for precise control over nanoparticle size and shape. Given that nanoparticle size directly affects optical performance, achieving optimal size control is essential for maximizing luminescence efficiency [20].
In this study, we investigate the effect of surfactant concentration—specifically, oleic acid (OA)—on the size, shape, and luminescent properties of NaYF4: Er3+/Yb3+ nanomaterials. Our goal is to determine the suitable synthesis conditions for producing highly luminescent materials for diagnostic applications, particularly in rapid pathogen detection. Additionally, we evaluated the ability of the nanocomplex containing NaYF4:Yb3+/Er3+ to detect HeLa cervical cancer cells, thereby confirming its potential for biomedical diagnostics.

2. Results and Discussion

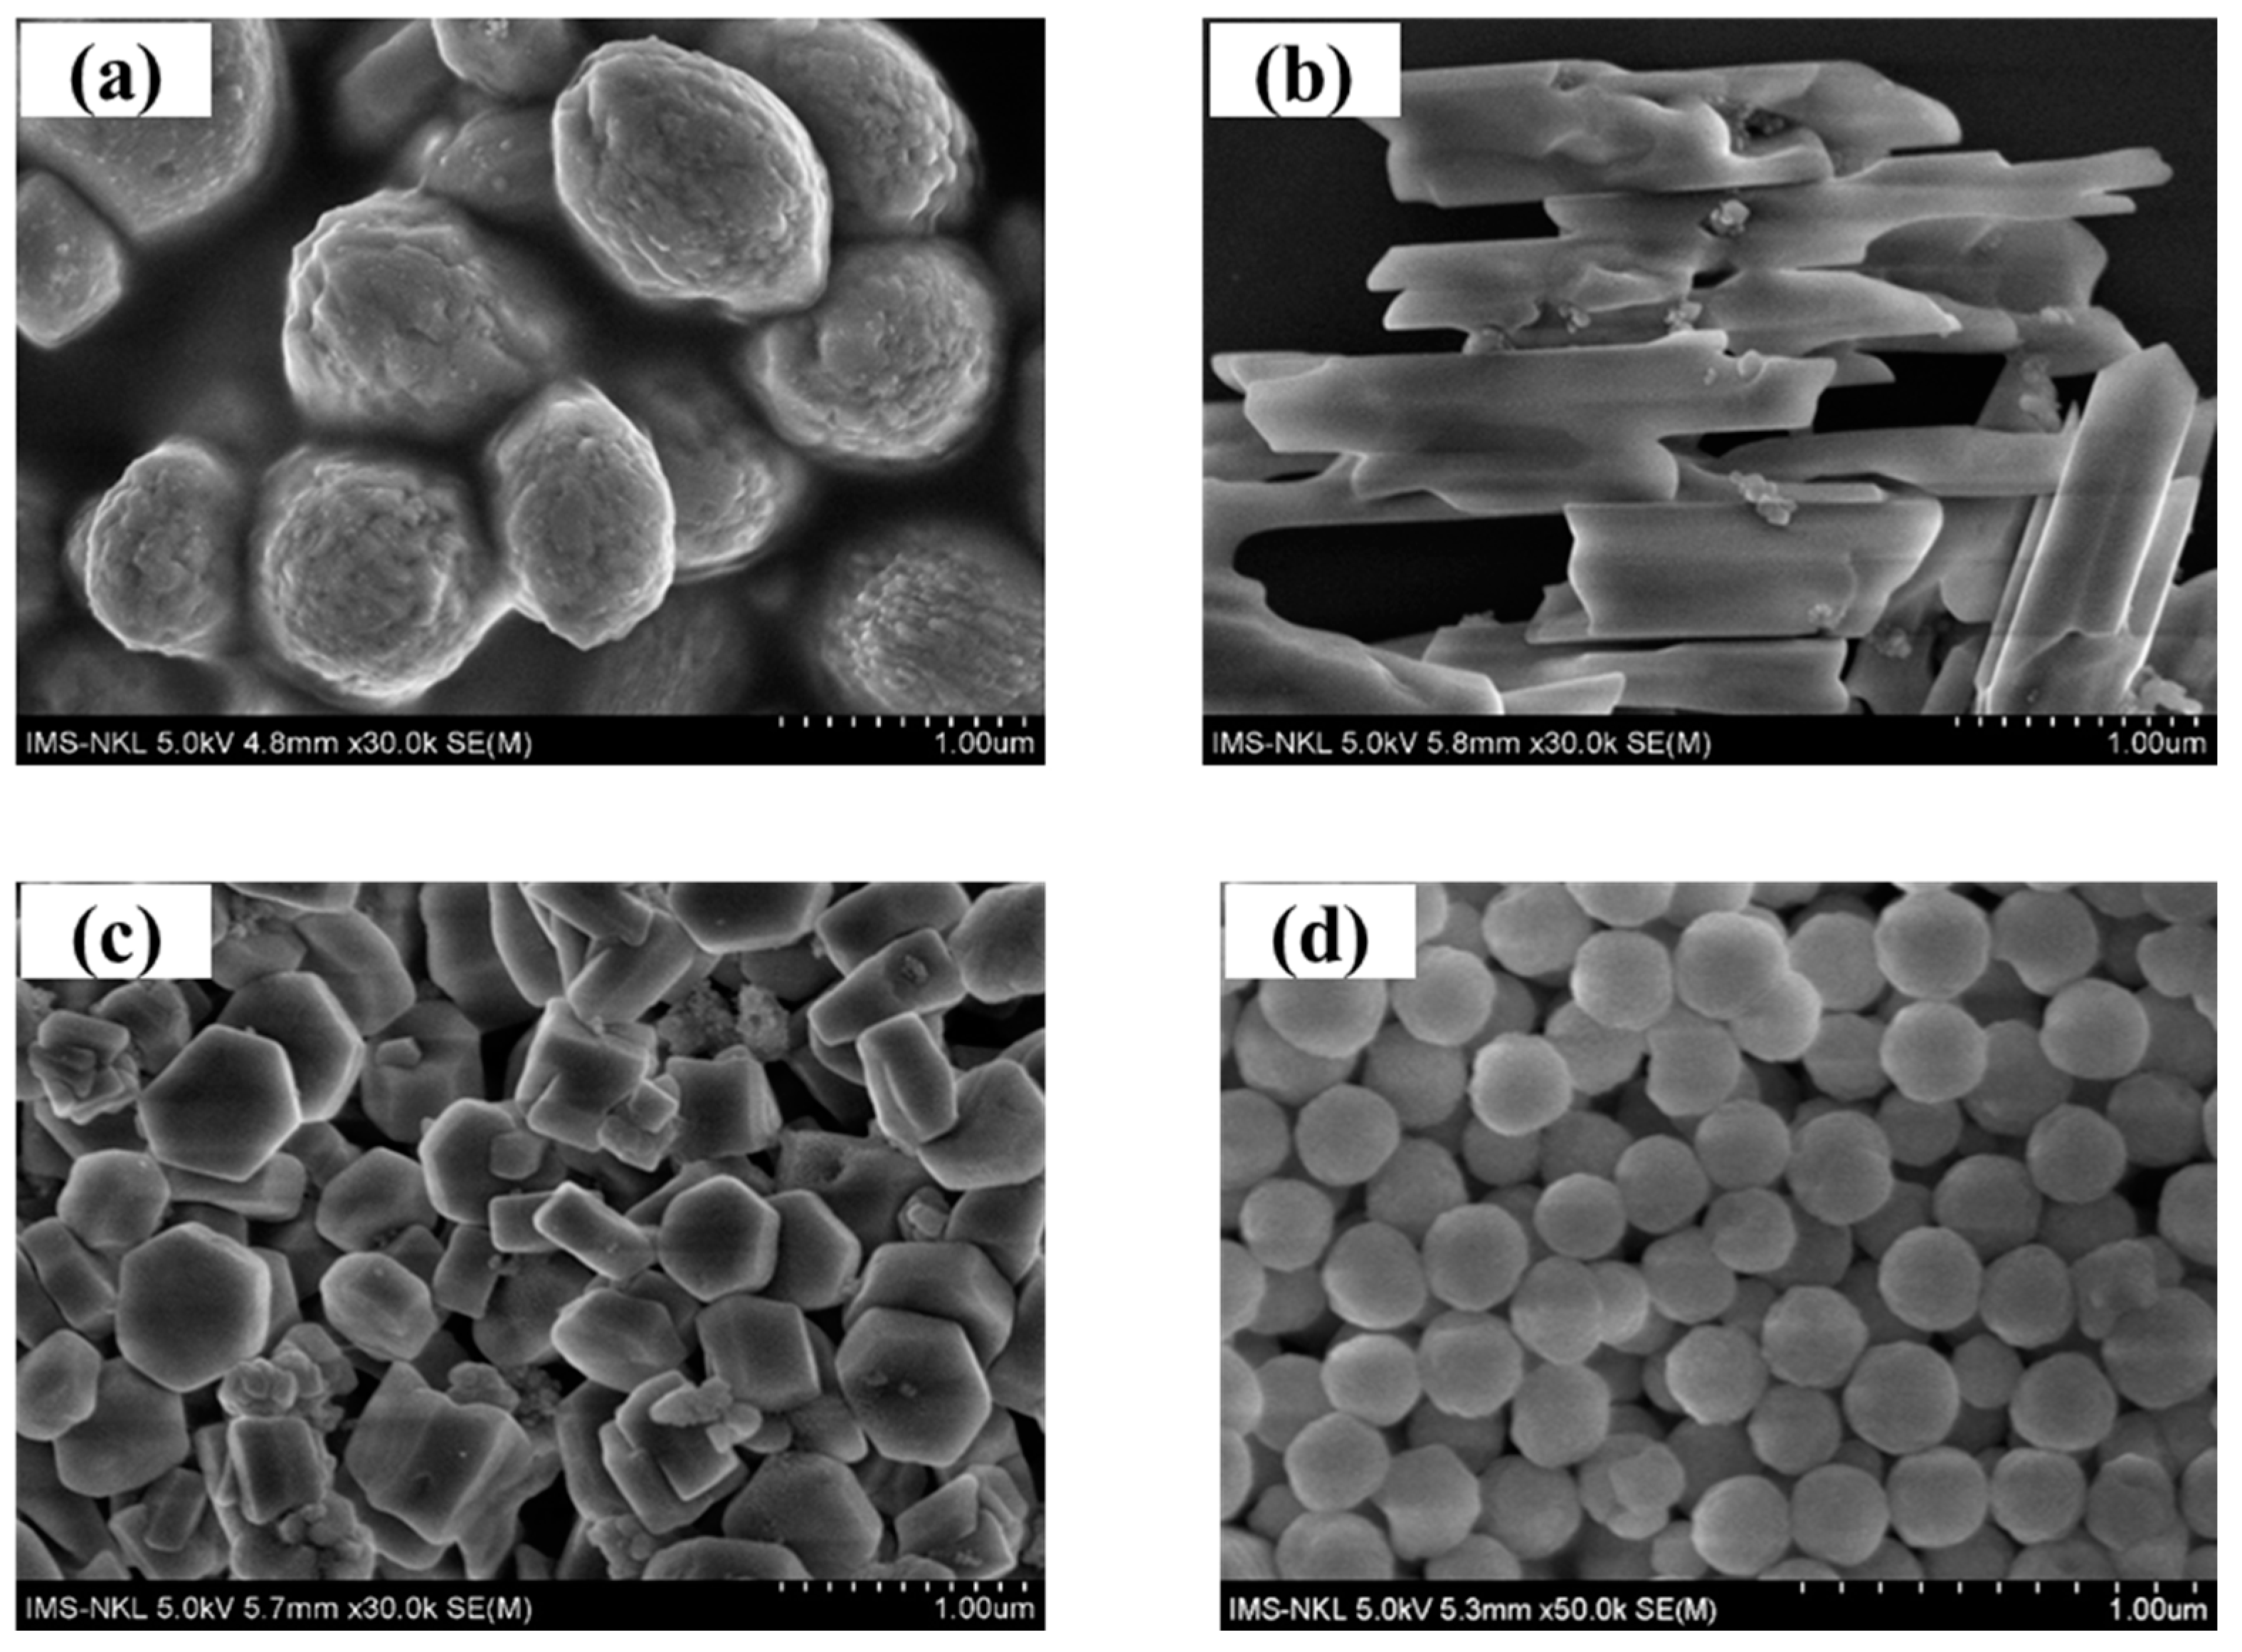
2.1. Morphological Characterization

Figure 1 presents the FESEM images of the nanomaterial samples: (a) NaYF4: Er3+/Yb3+, (b) NaYF4: Er3+/Yb3+–OA (10−1 M), (c) NaYF4: Er3+/Yb3+–OA (10−2 M), and (d) NaYF4: Er3+/Yb3+–OA (10−3 M), respectively. The results indicate that the NaYF4: Er3+/Yb3+ sample that was synthesized without using OA (Figure 1a) exhibits an oval block shape with a diameter ranging from 800 to 900 nm. When oleic acid (OA) is introduced at a concentration of OA (10−1 M) (Figure 1b), the material tends to transition into a rod-like form with a length of 800–900 nm and a diameter of 400–500 nm. As the OA concentration decreases to OA (10−2 M), the particles become completely separated and tend to be hexagonal in shape with sizes of 400–500 nm. Further dilution to OA (10−3 M) results in progressively smaller spherical-like particles, ranging from 150 to 250 nm.
The gradual reduction in particle size can be probably attributed to the dilution process, which decreases the extent of reaction participation and promotes increased nucleation relative to individual particle growth. Additionally, a more diluted environment reduces particle collisions, thereby limiting aggregation and ensuring both small size and uniform dispersion.
These findings demonstrate that OA plays a crucial role in controlling the size and morphology of the material. At high OA concentrations, the material adopts a rod-like morphology, whereas at lower concentrations, it shifts towards a more spherical-like form and becomes progressively smaller. The controlled addition and dilution of OA provide an effective means of tailoring particle size and morphology, making the material suitable for various applications, particularly in biomedicine. This demonstrates the role of oleic acid as a morphological controller of the material, where dilution of its concentration leads to a gradual decrease in particle size.

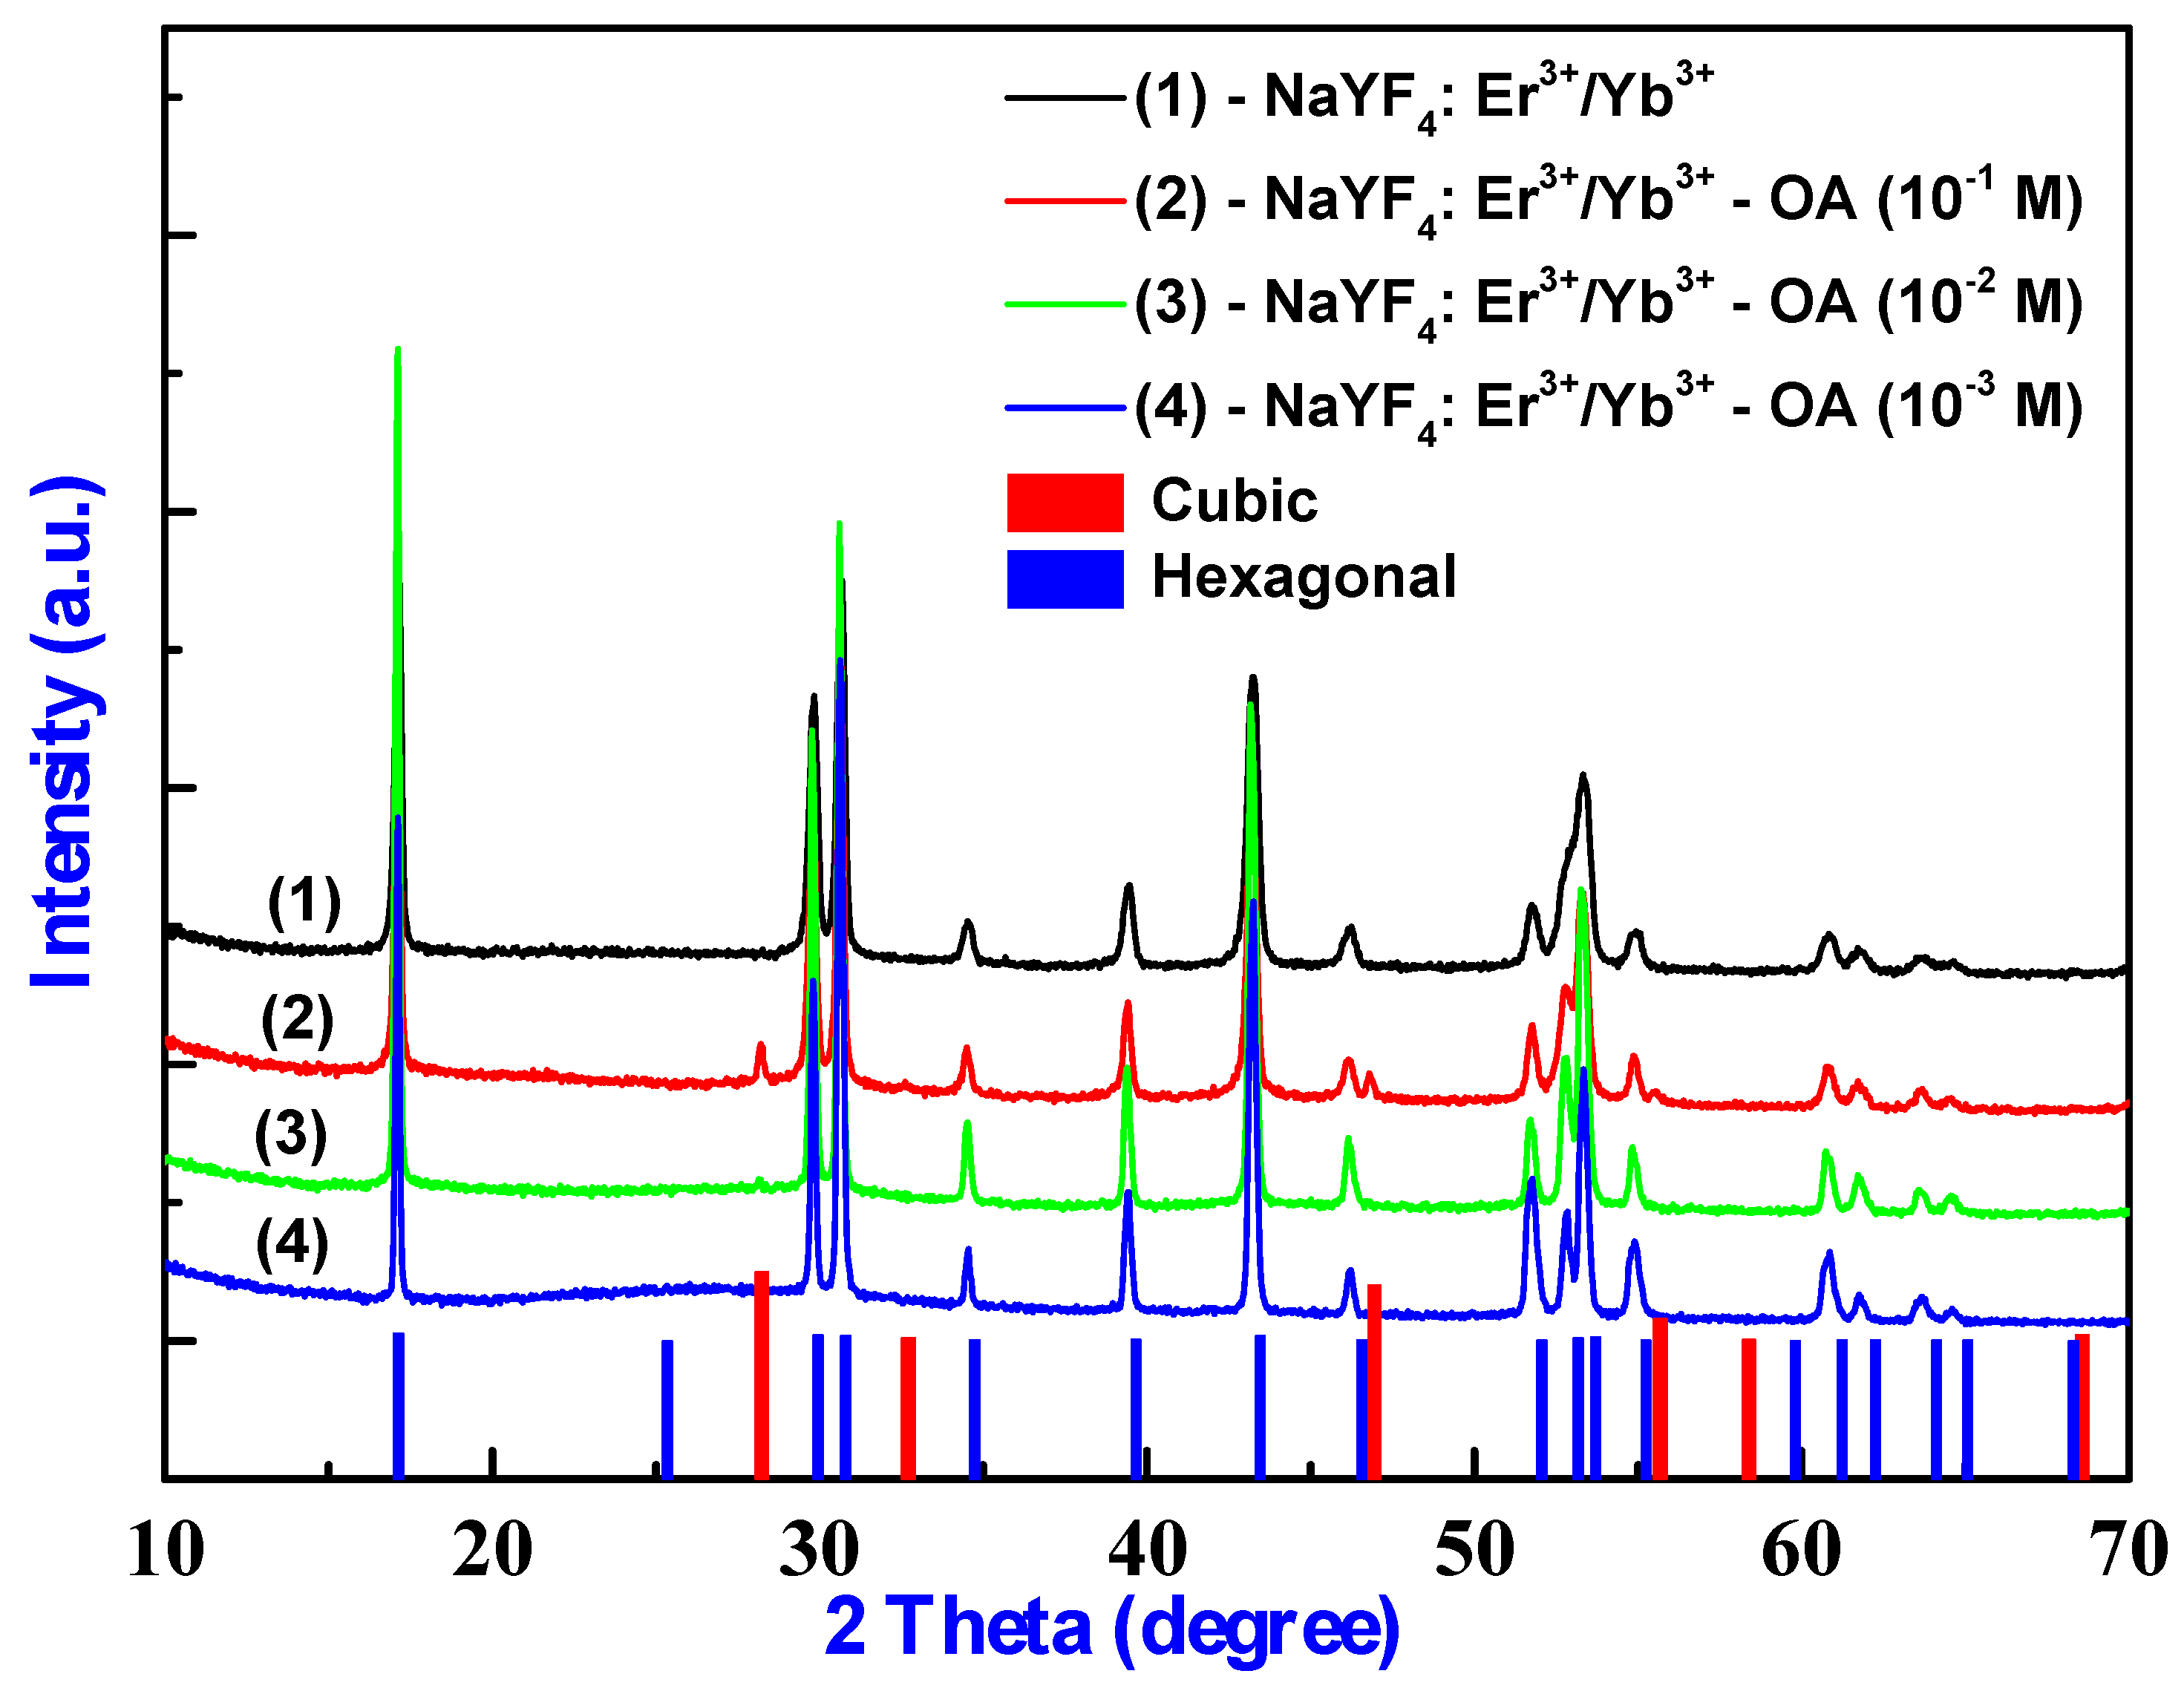
2.2. Structure Characterization

The XRD patterns of the nanoparticle samples, namely, NaYF4: Er3+/Yb3+, NaYF4: Er3+/Yb3+–OA (10−1 M), NaYF4: Er3+/Yb3+–OA (10−2 M), and NaYF4: Er3+/Yb3+–OA (10−3 M) are shown in Figure 2. The results reveal that characteristic diffraction peaks appear in the NaYF4: Er3+/Yb3+ samples synthesized by using OA at 2θ angles of 17.2, 29.8, 30.8, 34.7, 43.5, 46.5, 53.6, 55.2, and 62.3°. These peaks correspond to those in the JCPDS reference card No. 28-1192 for the β-NaYF4 (hexagonal) crystal phase, which is the preferred phase for achieving high luminescence efficiency. For the NaYF4: Er3+/Yb3+ sample with the added OA concentration of 10−1 M, additional diffraction peaks at 28.2, 32.6, 46.9, and 55.6° were observed alongside those of the β-NaYF4 (hexagonal) phase. These peaks correspond to the α-NaYF4 (cubic) phase, as indicated by JCPDS reference card no. 01-077-2042. Importantly, for the case of using the suitable OA concentrations in the range of 10−2–10−3 M, no impurity peaks are observed, confirming that the β-NaYF4: Er3+/Yb3+ material was synthesized readily and purely with a high crystallinity.
By combining the results obtained from FESEM and XRD measurements, it can be concluded that, for the NaYF4: Er3+/Yb3+–OA (10−1 M) sample (Figure 2, curve 2), the material exhibits a rod-like morphology with a mixed-phase structure (hexagonal and cubic). However, as the OA concentration is diluted to 10−3 M, the material adopts a spherical-like morphology with only the hexagonal phase presents.
This shows that the concentration of oleic acid (OA) plays a crucial role not only in controlling particle size and morphology but also in determining the crystal phase of the synthesized NaYF4:Yb3+/Er3+ nanomaterials. At low OA concentrations, the surface of crystal nuclei is only partially covered, allowing for anisotropic growth that favors the formation of the thermodynamically stable hexagonal β-phase, which is typically associated with enhanced upconversion luminescence. However, when the OA concentration increases, the nanocrystal surfaces become densely coated with OA molecules, significantly altering the surface energy and growth dynamics. This hinders anisotropic crystal growth, thereby kinetically stabilizing the formation of the cubic α-phase, which is known to form during early nucleation or under growth-restricted conditions.
Additionally, excess OA can suppress the transition from cubic to hexagonal phase by reducing the crystallization rate, ultimately leading to the coexistence of both α- and β-phases in the final product. However, the hexagonal β-NaYF4 phase features a larger separation between Er3+ ions, which helps to reduce fluorescence quenching. This structural advantage is highly beneficial for achieving strong luminescence, making the material well-suited for various applications [21,22,23,24].
Figure 3 presents the Fourier transform infrared (FTIR) spectrum of the β-NaYF4: Er3+/Yb3+–OA (10−3 M) sample. The infrared spectrum displays a broad and intense band in the 3600–3300 cm−1 region, corresponding to O–H bond vibrations caused by the absorption of H2O. Despite multiple washing steps with water and ethanol, organic citrate molecules remain on the particle surface. The peaks at approximately 2950 and 2854 cm−1 are attributed to the asymmetric and symmetric stretching vibrations of the methylene group (–CH2), respectively [25,26]. A distinct peak at ~1614 cm−1 corresponds to the carboxylate (COO) group, confirming the attachment of oleic acid (OA) to the particle surface and its interaction with metal ions in the NaYF4 lattice. Additionally, the band at ~1011 cm−1 is assigned to the C–O stretching vibration, indicating coordination with metal cations. The presence of rare earth elements bonded to the NaYF4 matrix is reflected in the lower-frequency vibrations observed at 792, 576, and 454 cm−1. These results confirm the successful formation of NaYF4: Er3+/Yb3+ nanoparticles.
By integrating the findings from XRD and FTIR measurements, it is evident that the incorporation of oleic acid in the synthesis process plays a crucial role in controlling particle size and morphology, ultimately enhancing the optical properties of the material.

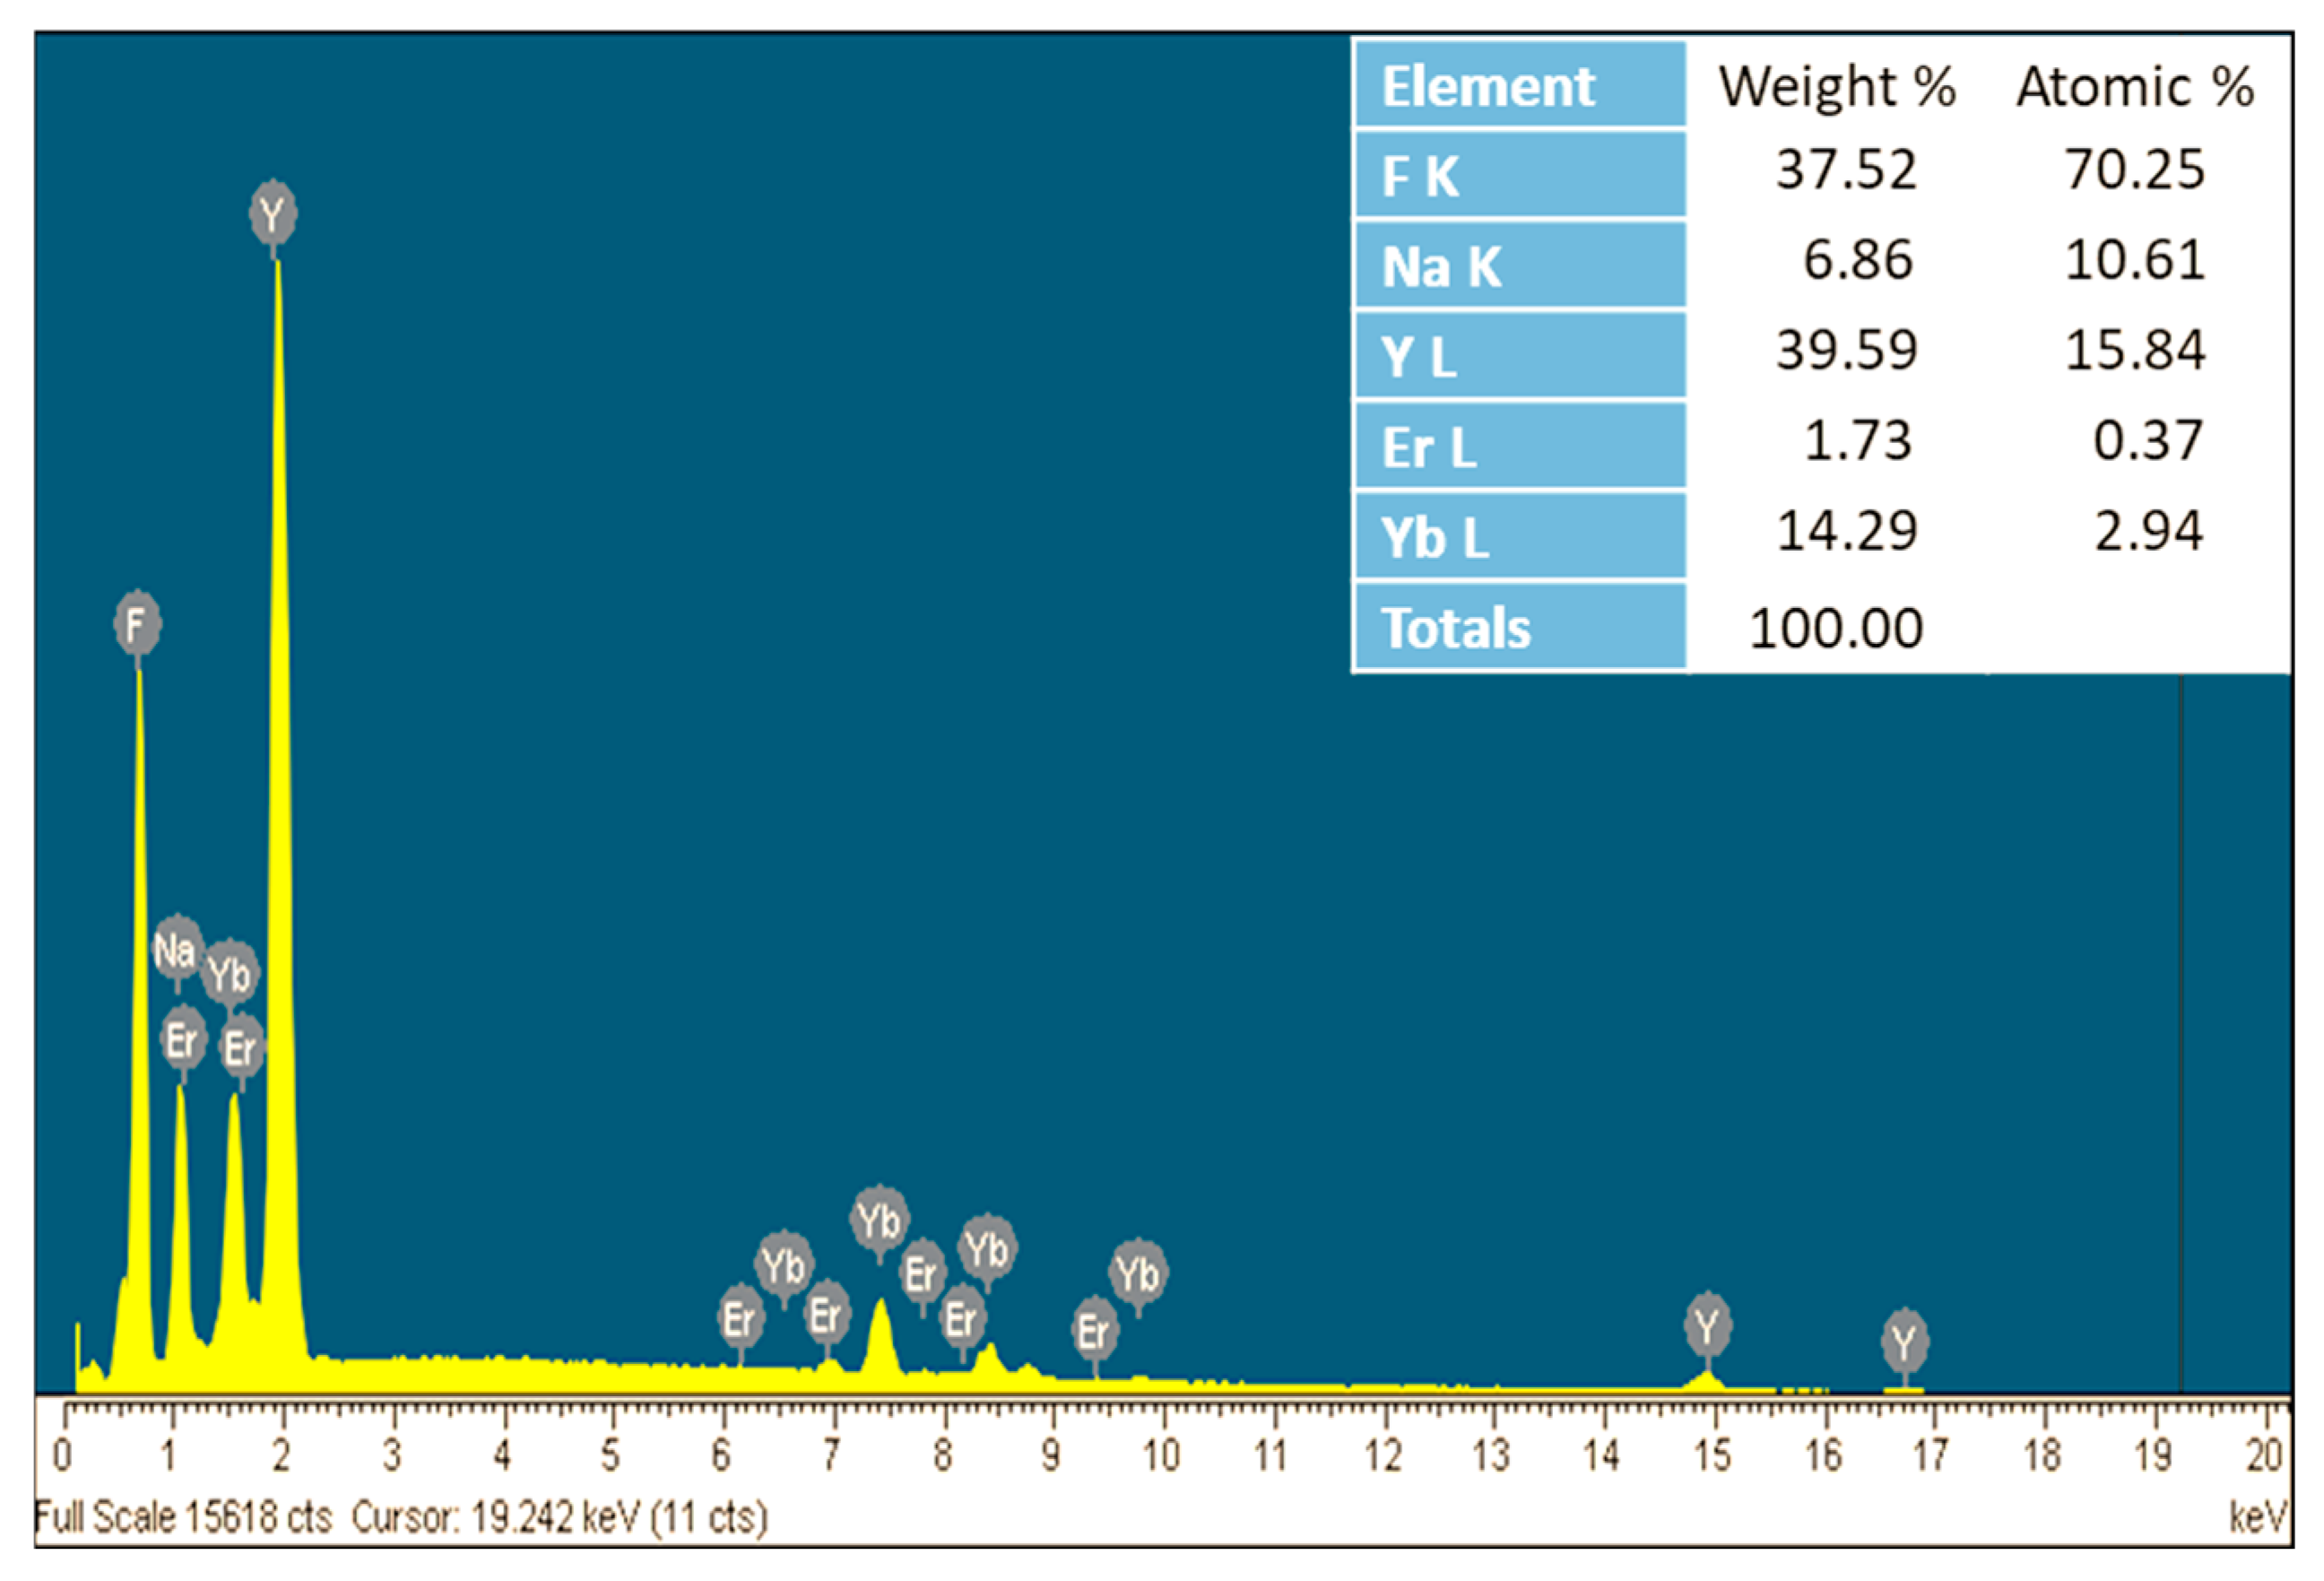
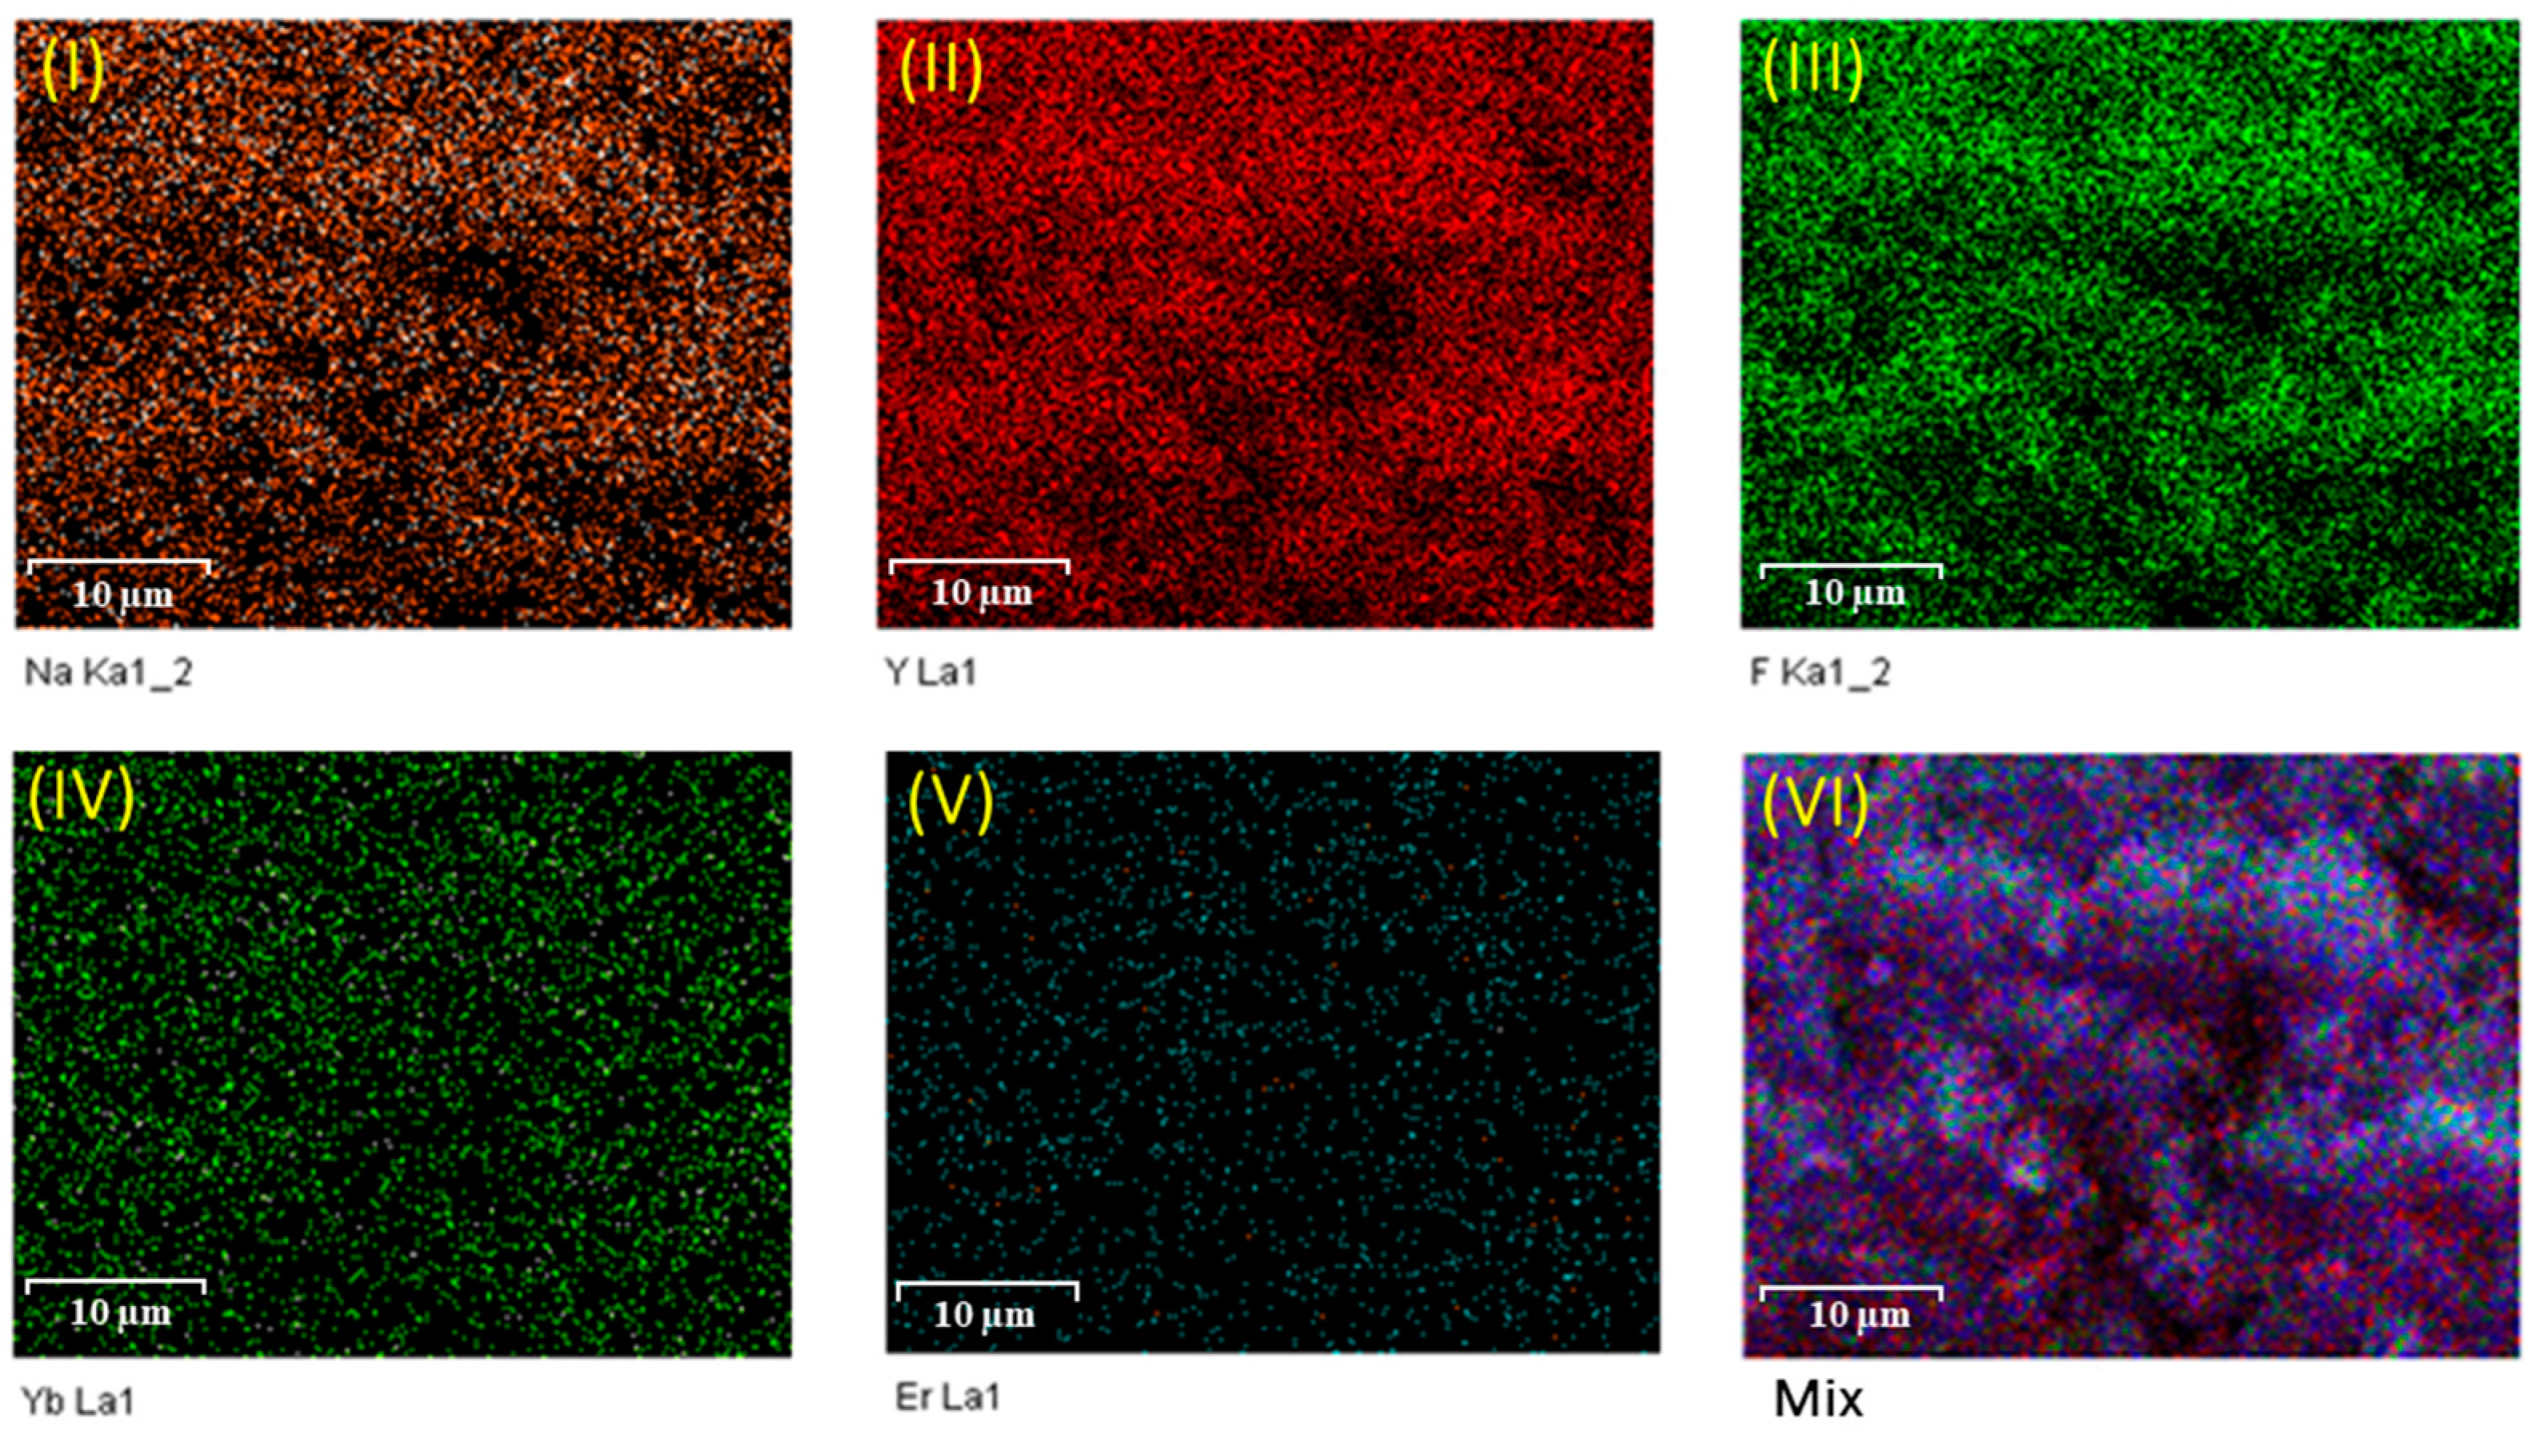
2.3. Energy Dispersive X-Ray Analysis

Figure 4 presents the energy dispersive X-ray (EDX) spectrum of the β-NaYF4: Er3+/Yb3+–OA (10−3 M) nanoparticles. The spectrum reveals strong peaks corresponding to the primary elements Na, Y, and F, along with weaker peaks for Yb and Er, which are consistent with the expected composition of NaYF4: Er3+/Yb3+. Notably, no foreign elements are detected, confirming the successful synthesis of the β-NaYF4: Er3+/Yb3+–OA (10−3 M) material.
To further analyze the elemental distribution and verify the uniform dispersion of dopant elements within the host matrix, energy dispersive X-ray spectroscopy (EDS) mapping was conducted (Figure 5). The EDS mapping images of the β-NaYF4: Er3+/Yb3+–OA (10−3 M) nanoparticles illustrate the distribution of: (I) sodium (Na); (II) yttrium (Y); (III) fluorine (F); (IV) ytterbium (Yb); (V) erbium (Er) elements.
The mapping results confirm that Na, F, and Y are evenly distributed throughout the sample, indicating the successful incorporation of these elements into the host lattice. Additionally, the distributions of Yb and Er are also homogeneous, which plays a crucial role in reducing concentration quenching and enhancing luminescence intensity. The composite (merged color) image (VI) demonstrates the overlap of elemental signals, verifying that all components are present and uniformly distributed within the system, with no signs of phase separation or aggregation. This finding underscores the high potential of this material for optical applications, particularly in the biomedical field.

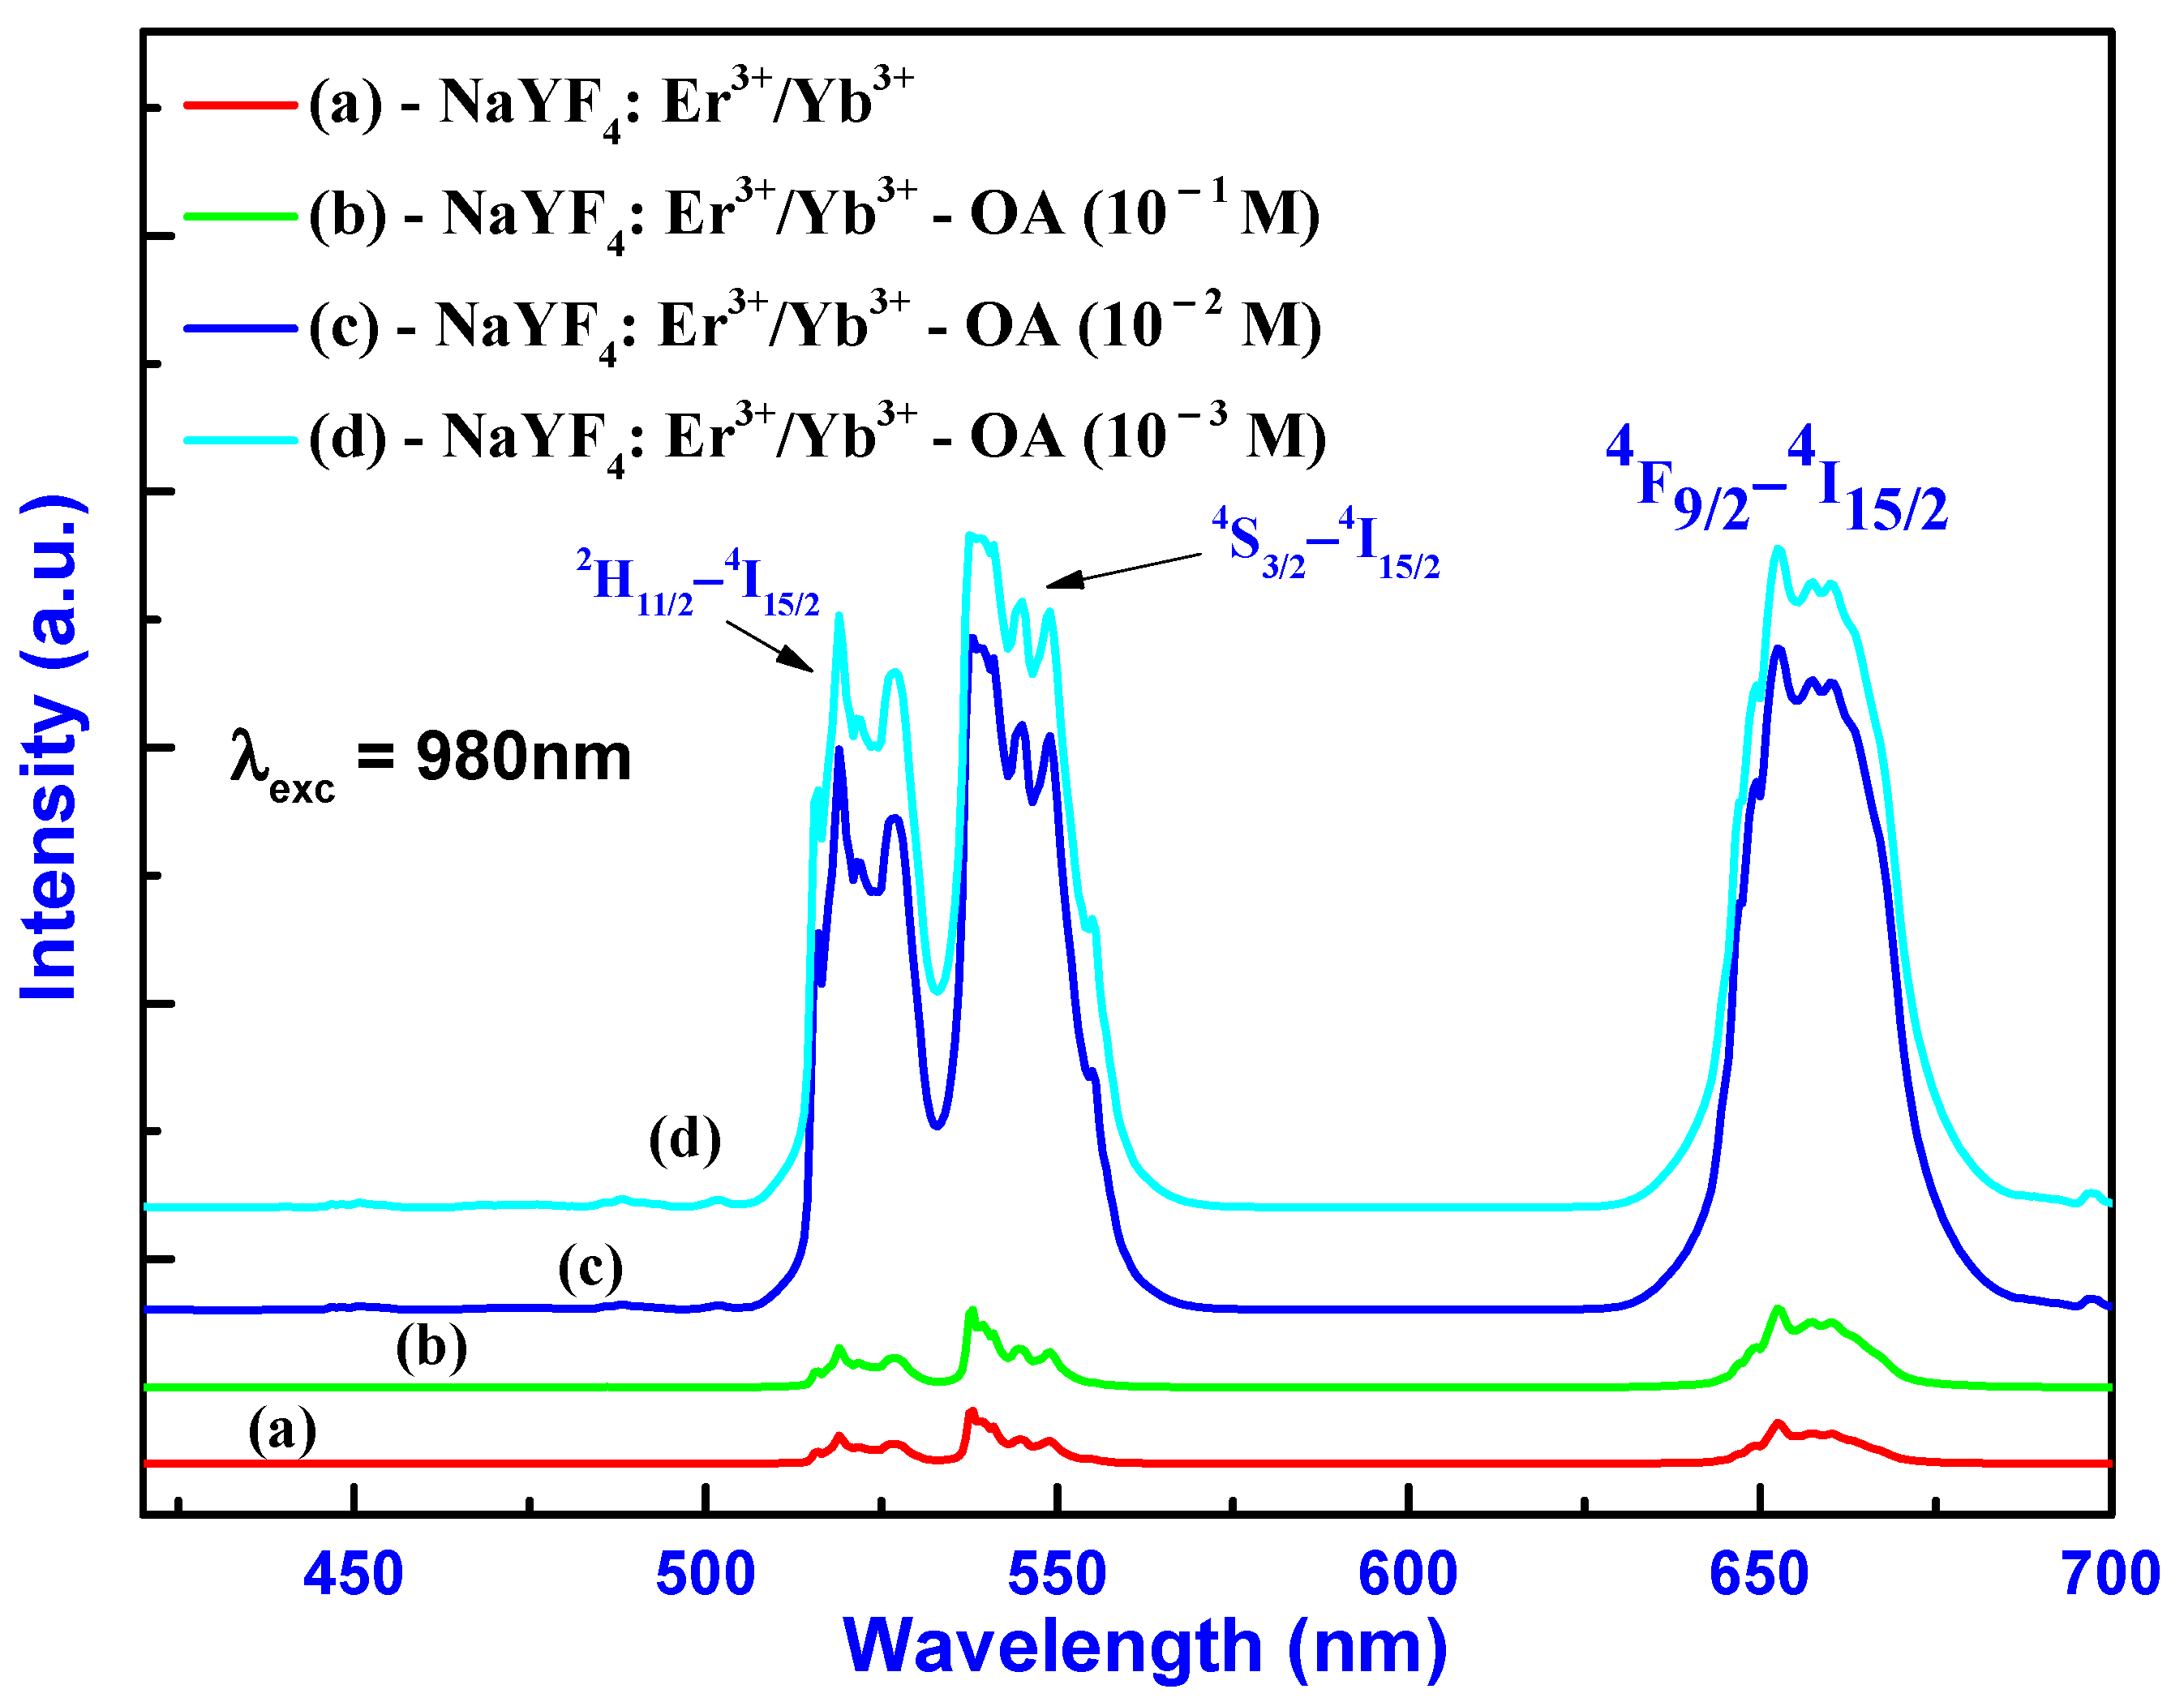
2.4. Luminescence Properties

Figure 6 presents the upconversion photoluminescence spectra of the nanoparticle samples: (a) NaYF4: Er3+/Yb3+, (b) NaYF4: Er3+/Yb3+–OA (10−1 M), (c) NaYF4: Er3+/Yb3+–OA (10−2 M), and (d) NaYF4: Er3+/Yb3+–OA (10−3 M), under 980 nm excitation, at 450 mW.
The spectra exhibit three broad emission bands ranging from green to red, centered at 520, 540, and 650 nm. These emissions correspond to the 2H11/24I15/2, 4S3/24I15/2, and 4F9/24I15/2 energy transitions in Er3+, respectively [7,27,28]. The upconversion emission of NaYF4: Er3+/Yb3+ nanoparticles clearly demonstrates these typical energy transitions. A significant enhancement in luminescence intensity was observed in the NaYF4: Er3+/Yb3+–OA (10−3 M) sample compared to the NaYF4: Er3+/Yb3+–OA (10−1 M) sample. The emission intensity of the β-NaYF4: Er3+/Yb3+–OA (10−3 M) sample is 8.2 times higher than that of the mixed phase NaYF4: Er3+/Yb3+–OA (10−1 M) sample. This enhancement can be attributed to the small particle size and uniform distribution of dopant ions in the material, which further contributes to reducing the concentration quenching effect, thereby enhancing the luminescence intensity.
Some reports have demonstrated that NaYF4-based upconversion nanocrystals can be synthesized with significantly smaller sizes (e.g., 20–50 nm) by employing different synthetic strategies [29,30]. To further reduce particle size, several optimization approaches can be considered, such as: decreasing the OA concentration; adjusting the reaction temperature and time; employing a co-surfactant or alternative ligands using microwave-assisted synthesis. In our work, the primary focus was to ensure strong upconversion luminescence and phase purity (especially stabilizing the β-phase). We have investigated the effects of three representative oleic acid (OA) concentrations (10−1, 10−2, and 10−3 M) on the morphology and upconversion luminescence of NaYF4:Er3+/Yb3+ nanomaterials. Among these, the 10−3 M concentration exhibited the very good performance in terms of emission intensity, particle uniformity, and size. Therefore, this sample was selected for cancer cell labeling experiments. Further investigation of these material characteristics will be carried out in the next study.

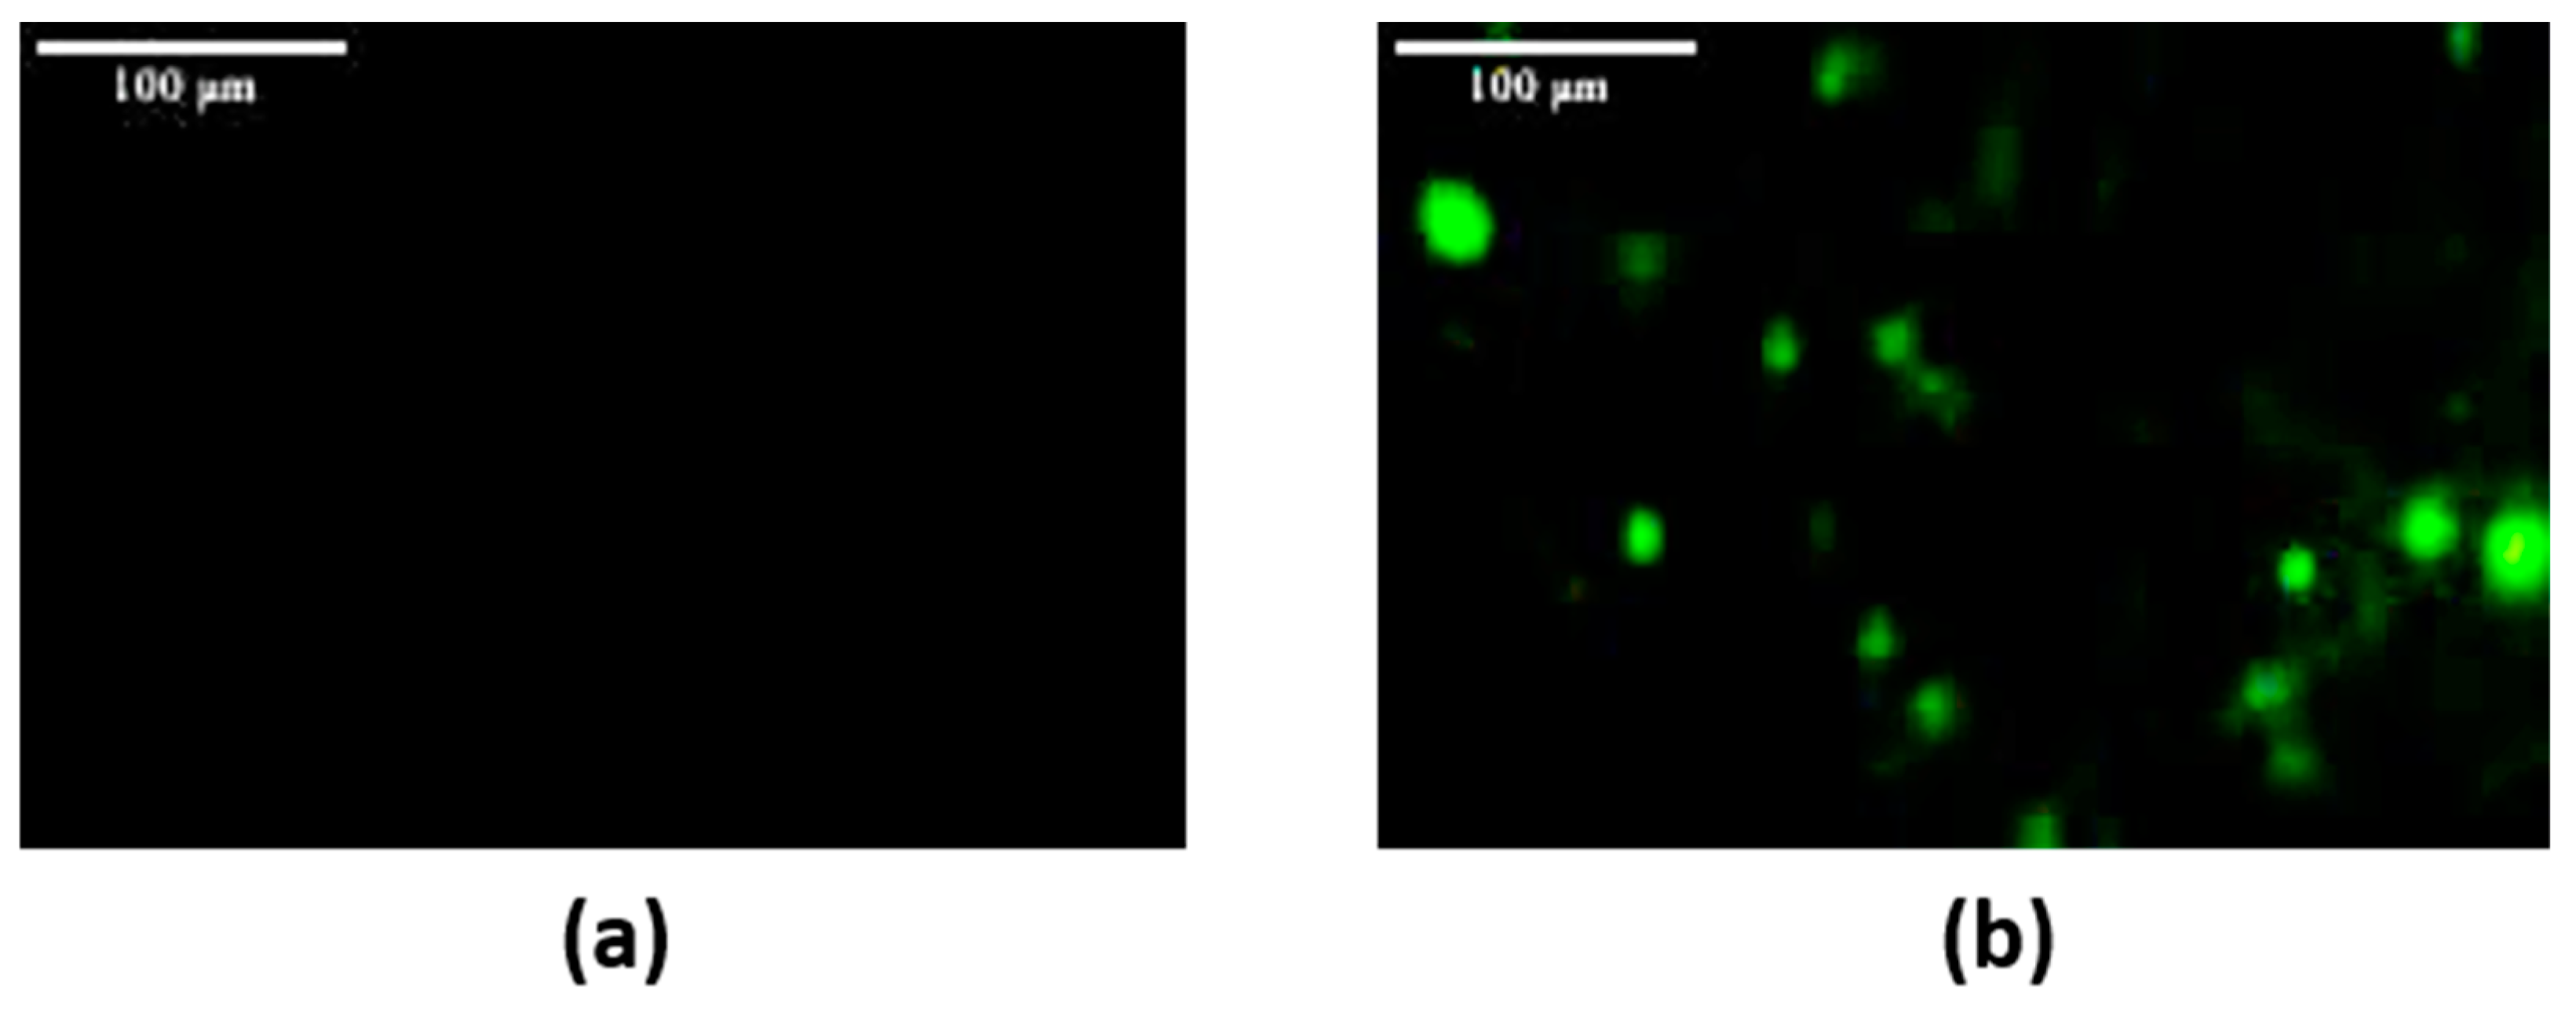
2.5. In Vitro Cellular Imaging

We used fluorescence microscopy to evaluate the binding ability between NaYF4: Er3+/Yb3+@SNGA-IgG conjugates and HeLa cervical cancer cells after the incubation process. Figure 7a,b show the fluorescent images of HeLa cervical cancer cells (negative control) and HeLa cervical cancer cells incubated with NaYF4: Er3+/Yb3+@SNGA-IgG, respectively.
In the first case, no photoluminescence (PL) emission was observed in the reference sample (Figure 7a). In the second case, the NaYF4: Er3+/Yb3+@SNGA-IgG sample exhibited strong green luminescence (Figure 7b). This might be attributed to the formation of bonds between NaYF4: Er3+/Yb3+@SNGA-IgG and HeLa cervical cancer cells, demonstrating a strong interaction between the conjugates and HeLa cancer cells due to biological conjugation. Furthermore, it can be seen that the NaYF4: Er3+/Yb3+@SNGA-IgG particles are localized within the cell cytoplasm. The Glutaraldehyde facilitates ligand binding between the cell and the luminescent labeling particles, and, subsequently, the conjugates are internalized into the cell via the invagination process. Therefore, β-NaYF4: Er3+/Yb3+@SNGA-IgG could serve as a potential bio-label for cancer cells.

3. Experimental

3.1. Materials and Methods

Yttrium (III) nitrate hexahydrate, Y(NO3)3·6H2O (99.9%), ytterbium (III) nitrate pentahydrate, Yb(NO3)3·5H2O (99.9%), erbium (III) nitrate pentahydrate, Er(NO3)3·5H2O (99.9%), NaF (99%), and tetraethyl orthosilicate (TEOS) (99.9%) were purchased from Sigma-Aldrich, St. Louis, MO, USA. NaOH (99%), trisodium citrate dehydrate HOC(COONa) (CH2COONa)2·2H2O (99%) were provided from Merck, Darmstadt, Germany, while oleic acid (C18H34O2) (92%) was provided from Fisher, London, England. All chemicals were of analytical grade without any purification.
The crystalline phase identification of NaYF4:Yb3+/Er3+ nanomaterials were carried out by using X-ray diffraction (XRD) (D8 Advance, Bruker, Karlsruhe, Germany). The morphology and energy dispersive X-ray spectra (EDS) of the NaYF4:Yb3+/Er3+ nanoparticles were analyzed using a field emission scanning electron microscope (FE-SEM, S-4800, Hitachi, Tokyo, Japan) and high-resolution transmission electron microscopy (HRTEM, JEM 2100, Jeol, Tokyo, Japan). To investigate the chemical bonding of the material, infrared absorption spectra (IR) were recorded in the wavenumber range of 4000 to 400 cm−1 using a Fourier transform infrared (FT-IR) spectrometer (Spectrum Two, PerkinElmer, Waltham, MA, USA). Photoluminescence (PL) measurements were conducted to evaluate the optical properties of NaYF4:Yb3+/Er3+ nanomaterials.
The upconversion photoluminescence properties were analyzed using an iHR320 photoluminescence measurement system (Horiba, Kyoto, Japan), under 980 nm excitation (the dried nanopowder samples were placed directly onto flat copper slides). The cells were observed under an Olympus ScanR fluorescence microscope (Olympus Europa SE and Co.KG, Hamburg, Germany).

3.2. Preparation of NaYF4: Er3+/Yb3+ Nanoparticles

The synthesis process of NaYF4: Er3+/Yb3+ nanomaterials is as follows:
First, a mixed solution of rare-earth metal salts, including Y(NO3)3·6H2O, Yb(NO3)3·5H2O, and Er(NO3)3·5H2O, is prepared with a molar ratio of NaYF4:Yb3+:Er3+ = 79:19:02. The solution is stirred for 15 min to obtain Solution 1.
Next, a solution of NaF and sodium hydroxide is slowly added to Solution 1, followed by continuous stirring for 120 min to obtain Solution 2. Then, trisodium citrate dihydrate is gradually added to Solution 2 and stirred for 15 min to obtain Solution 3.
After that, oleic acid solutions (10−1, 10−2, 10−3 M, etc.) are added to Solution 3 and stirred for 120 min. Finally, the resulting solution is transferred into an autoclave and heated at 200 °C for 24 h.
After completion of the hydrothermal reaction, the resulting products were collected by centrifugation and washed several times with deionized water to remove unreacted precursors and soluble byproducts. The washed samples were then dried at 70 °C for 48 h to obtain dry nanopowders. Notably, although the nanocrystals were surface-modified with oleic acid (OA), the washing step did not involve redispersion in an aqueous medium. As a result, the dried OA-coated nanocrystals retained their hydrophobic nature and were not dispersed in water during any of the characterization steps. The obtained product is centrifuged, thoroughly washed with deionized water to remove residual solvents and dried at 70 °C for 48 h. The final product is a NaYF4:Er3+/Yb3+ material in powder form.

3.3. Preparation of NaYF4: Er3+/Yb3+@SNGA-IgG Bio-NanoComplexes

After synthesis, the NaYF4: Er3+/Yb3+ material was coated with a layer of silica via the hydrolysis of tetraethyl orthosilicate (TEOS). To functionalize the surface with amine groups, we used a solution of 3-aminopropyltrimethoxysilane [31]. The surface functionalization process was carried out for 24 h. Next, a solution of 50% glutaraldehyde (GA) was mixed with the functionalized NaYF4: Er3+/Yb3+material; this mixture was then dispersed in a PBS solution (0.1 M, pH = 5) at a concentration of 5 g L−1 and agitated for 30 min. Subsequently, the compound was combined with various concentrations of IgG. The reaction mixtures were incubated in the presence of glycerol at room temperature for 4 h. Finally, the NaYF4: Er3+/Yb3+@SNGA-IgG products were collected by centrifugation at 5900 rpm, washed three times with water, and stored at 4 °C in a sealed container.

3.4. Experiment on Incubating the Biomedical NaYF4: Er3+/Yb3+@SNGA-IgG Nanocomplex with HeLa Cervical Cancer Cells

3.4.1. In Vitro Cell Culture

HeLa cervical cancer cells were cultured at 37 °C in DMEM medium supplemented with 10% fetal bovine serum (FBS), 1% antibiotic–antimycotic, and 50 µg/mL gentamicin. The cells were subcultured after 3–5 days at a ratio of 1:3 and incubated at 37 °C in an atmosphere containing 5% CO2.

3.4.2. Experiment for Labeling HeLa Cervical Cancer Cells Using the Biomedical Nanocomplex NaYF4: Er3+/Yb3+@SNGA-IgG

To evaluate cell detection capabilities, we performed cell staining. The procedure was as follows: HeLa cervical cancer cells were seeded into a 24-well plate at a density of 5 × 10⁴ cells/mL and allowed to stabilize in an incubator at 37 °C with 5% CO2 for 24 h. Next, PEG 1500 and the nanocomplex of β-NaYF4: Er3+/Yb3+@SNGA-IgG (at a concentration of 20 µg/mL) were added to the cell culture wells, and the cells were incubated for further 3 h.
After incubation, the culture medium (including nanoparticles) was discarded. The cells were then washed three times with sterile phosphate-buffered saline (pH 7.4) before being observed under an Olympus ScanR fluorescence microscope.

4. Conclusions

We have successfully synthesized the NaYF4: Er3+/Yb3+ material using a wet chemistry method. The influence of oleic acid on the morphology and luminescent properties of the material was investigated. The resulting NaYF4: Er3+/Yb3+ nanomaterials exhibit upconversion luminescence in the green region, and our results indicate that a suitable oleic acid concentration of 10−3 M is required. The synthesized nanoparticles are spherical in shape, with diameters ranging from 150 to 250 nm, and possess a single-phase β-NaYF4 (hexagonal phase) crystalline structure.
The β-NaYF4: Er3+/Yb3+ materials synthesized with an oleic acid concentration of 10−3 M demonstrate good and stable upconversion luminescence. They were subsequently coated with silica, functionalized with amino-silane, and conjugated with IgG antibodies. The pairing ability of the biomedical β-NaYF4: Er3+/Yb3+@SNGA-IgG nanocomplex for labeling HeLa cervical cancer cells was successfully evaluated using an inverted fluorescence microscope. The results show that the nanocomplex effectively binds to HeLa cervical cancer cells under in vitro conditions.
Initial test results suggest that the biomedical nanocomplex containing the β-NaYF4: Er3+/Yb3+ material shows promising potential for rapid pathogen detection.

Author Contributions

Conceptualization, T.T.H.; data curation, L.T.V., T.Q.T., V.T.H.H., L.T.H., P.D.T. and T.T.H.; formal analysis, H.T.P., V.N.P., L.T.H., P.D.T., D.T.T. and T.T.H.; investigation, H.T.P., L.T.V., T.Q.C., T.Q.T., V.T.H.H. and D.T.T.; methodology, H.T.P., L.T.V., T.Q.C., T.Q.T., N.D.V., V.T.H.H. and V.N.P.; writing—original draft, T.Q.C., T.Q.T., V.T.H.H., V.N.P., P.D.T., D.T.T. and T.T.H.; writing—review and editing, N.D.V. and T.T.H. All authors have read and agreed to the published version of the manuscript.

Funding

This research was funded by the ĐTĐL.CN-26/23 project of the Ministry of Science and Technology.

Institutional Review Board Statement

Not applicable.

Informed Consent Statement

Not applicable.

Data Availability Statement

All data are available in this publication.

Conflicts of Interest

The authors declare no conflicts of interest.

References

  1. Yaoguang, Y.; Gang, C.; Yansong, Z.; Zhonghui, H. Recent advances in rare-earth elements modification of inorganic semiconductor-based photocatalysts for efficient solar energy conversion: A review. J. Rare Earths 2015, 33, 453–462. [Google Scholar] [CrossRef]
  2. Guo, X.; Chen, C.; Zhang, D.; Tripp, C.P.; Yin, S.; Qin, W. Photocatalysis of NaYF4:Yb,Er/CdSe composites under 1560 nm laser excitation. RSC Adv. 2016, 6, 8127–8133. [Google Scholar] [CrossRef]
  3. You, M.; Zhong, J.; Hong, Y.; Duan, Z.; Lin, M.; Xu, F. Inkjet printing of upconversion nanoparticles for anti-counterfeit applications. Nanoscale 2015, 7, 4423–4431. [Google Scholar] [CrossRef]
  4. Shao, J.; Yan, J.; Xiaoguang, L.; Li, S.; Hu, T. Novel fluorescent label based on YVO4: Bi3+, Eu3+ for latent fingerprint detection. Dye. Pigment. 2019, 160, 555–562. [Google Scholar] [CrossRef]
  5. Huang, X.; Han, S.; Huang, W.; Liu, X. Enhancing solar cell efficiency: The search for luminescent materials as spectral converters. Chem. Soc. Rev. 2013, 42, 173–201. [Google Scholar] [CrossRef]
  6. Akbarzadeh, I.; Yaraki, M.T.; Ahmadi, S.; Chiani, M.; Nourouzian, D. Folic acid-functionalized niosomal nanoparticles for selective dual-drug delivery into breast cancer cells: An in-vitro investigation. Adv. Powder Technol. 2020, 31, 4064–4071. [Google Scholar] [CrossRef]
  7. Zhou, J.; Liu, Q.; Feng, W.; Sun, Y.; Li, F. Upconversion luminescent materials: Advances and applications. Chem. Rev. 2015, 115, 395–465. [Google Scholar] [CrossRef]
  8. Chen, G.; Qiu, H.; Prasad, P.N.; Chen, X. Upconversion Nanoparticles: Design, Nanochemistry, and Applications in Theranostics. Chem. Rev. 2014, 114, 5161–5214. [Google Scholar] [CrossRef]
  9. Chitta, R.P.; Resham, B.; Sujata, P.; Sujit, B.; Priyabrata, M.; Debabrata, M. Inorganic Phosphate nanorods are a novel fluorescent label in cell biology. J. Nanobiotechnol. 2006, 4, 11. [Google Scholar]
  10. Xu, R.; Cao, H.; Lin, D.; Yu, B.; Junle, Q. Lanthanide-doped upconversion nanoparticles for biological super-resolution fluorescence imaging. Cell Rep. Phys. Sci. 2022, 3, 100922. [Google Scholar] [CrossRef]
  11. Chen, G.; Ågren, H.; Ohulchanskyy, T.Y.; Prasad, P.N. Light upconverting core–shell nanostructures: Nanophotonic control for emerging applications. Chem. Soc. Rev. 2015, 44, 1680–1713. [Google Scholar] [CrossRef]
  12. Liang, X.; Fan, J.; Zhao, Y.; Jin, R. Core–Shell Structured NaYF4:Yb,Er Nanoparticles with Excellent Upconversion Luminescent for Targeted Drug Delivery. J. Clust. Sci. 2021, 32, 1683–1691. [Google Scholar] [CrossRef]
  13. Lei, Y.; Huang, T.; Su, M.; Luo, J.; Korteweg, C.; Li, J.; Chen, Z.; Qiu, Y.; Liu, X.; Yan, M.; et al. Expression and distribution of immunoglobulin G in the normal liver, hepatocarcinoma and postpartial hepatectomy liver. Lab. Investig. 2014, 94, 1283–1295. [Google Scholar] [CrossRef]
  14. Chinen, A.B.; Guan, C.M.; Ferrer, J.R.; Barnaby, S.N.; Merkel, T.J.; Mirkin, C.A. Nanoparticle Probes for the Detection of Cancer Biomarkers, Cells, and Tissues by Fluorescence. Chem. Rev. 2015, 115, 10530–10574. [Google Scholar] [CrossRef]
  15. Feng, W.; Zhu, X.; Li, F. Recent advances in the optimization and functionalization of upconversion nanomaterials for in vivo bioapplications. NPG Asia Mater. 2013, 5, e75. [Google Scholar] [CrossRef]
  16. Oleksa, V.; Macková, H.; Engstová, H.; Patsula, V.; Shapoval, O.; Velychkivska, N.; Ježek, P.; Horák, D. Poly (N,N-di met hyl acr yla mid e)-coated upconverting NaYF4:Yb,Er@ NaYF4:Nd core–shell nanoparticles for fluorescent labeling of carcinoma cells. Sci. Rep. 2021, 11, 21373. [Google Scholar] [CrossRef]
  17. Doronkina, A.A.; Kochubey, V.I.; Maksutova, A.V.; Pravdin, A.B.; Mylnikov, A.M.; Navolokin, N.A.; Yanina, I.Y. NaYF4: Yb,Er Upconversion Nanoparticles for Imaging: Effect on Red Blood Cells. Photonics 2023, 10, 1386. [Google Scholar] [CrossRef]
  18. Skaptsov, A.A.; Ustalkov, S.O.; Mohammed, A.H.; Zakharevich, A.M.; Kozyrev, A.A.; Sagaidachnaya, E.A.; Kochubey, V.I. Application of Upconversion Luminescence of NaYF4:Yb,Er Nanoparticles to Study Protein Coagulation Dynamics. Opt. Spectrosc. 2020, 128, 952–958. [Google Scholar] [CrossRef]
  19. Hua, L.; Xiaobo, S.; Xia, L.; Lingbo, Z. Size-tunable β-NaYF4:Yb/Er up-converting nanoparticles with a strong green emission synthesized by thermal decomposition. Opt. Mater. 2020, 108, 110144. [Google Scholar] [CrossRef]
  20. Takahashi, N.; Gubarevich, A.; Sakurai, J.; Hata, S.; Tsuge, T.; Kitamoto, Y.; Yamazaki, Y.; Odawara, O.; Wada, H. Preparation and Optical Properties of Rare Earth Doped Y2O3 Nanoparticles Synthesized by Thermal Decomposition with Oleic Acid. Adv. Mater. Res. 2011, 332–334, 1974–1978. [Google Scholar] [CrossRef]
  21. Gunaseelan, M.; Yamini, S.; Kumar, G.A.; Senthilselvan, J. Highly efficient upconversion luminescence in hexagonal NaYF4:Yb3+, Er3+ nanocrystals synthesized by a novel reverse microemulsion method. Opt. Mater. 2018, 75, 174–186. [Google Scholar] [CrossRef]
  22. Wang, J.; Song, H.; Xu, W.; Dong, B.; Xu, S.; Chen, B.; Yu, W.; Zhang, S. Phase transition, size control and color tuning of NaREF4:Yb3+, Er3+ (RE = Y, Lu) nanocrystals. Nanoscale 2013, 5, 3412–3420. [Google Scholar] [CrossRef]
  23. Ding, M.; Yin, S.; Ni, Y.; Lu, C.; Chen, D.; Zhong, J.; Ji, Z.; Xu, Z. Controlled synthesis of β-NaYF4:Yb3+/Er3+ microstructures with morphology-and size dependent up conversion luminescence. Ceram. Int. 2015, 41, 7411–7420. [Google Scholar] [CrossRef]
  24. Xie, J.; Hu, W.; Tian, D.; Wei, Y.; Zheng, G.; Huang, L.; Liang, E. Selective growth and upconversion photoluminescence of Y-based fluorides: From NaYF4: Yb/Er to YF3: Yb/Er crystals. Nanotechnology 2020, 31, 505605. [Google Scholar] [CrossRef]
  25. Stauffer, M.T. Fourier Transform Infrared and Raman Characterization of Silica-Based Materials. In Applications of Molecular Spectroscopy to Current Research in the Chemical and Biological Sciences; Capeletti, L.B., Zimnoch, J.H., Eds.; IntechOpen: London, UK, 2016. [Google Scholar] [CrossRef]
  26. Haase, M.; Schäfer, H. Upconverting nanoparticles. Angew. Chem. Int. Ed. 2011, 50, 5808–5829. [Google Scholar] [CrossRef]
  27. Feng, Y.; Li, Z.; Li, Q.; Yuan, J.; Tu, L.; Ning, L.; Zhang, H. Internal OH induced cascade quenching of upconversion luminescence in NaYF4:Yb/Er nanocrystals. Light Sci. Appl. 2021, 10, 105. [Google Scholar] [CrossRef]
  28. Huong, T.T.; Phuong, H.T.; Vinh, L.T.; Khuyen, H.T.; Thao, D.T.; Tuyen, L.D.; Anh, T.K.; Minh, L.Q. Upconversion NaYF4:Yb3+/Er3+@silica-TPGS bio-nano complexes: Synthesis, characterization, and in vitro test for labelling cancer cells. J. Phys. Chem. B 2021, 125, 9768–9775. [Google Scholar] [CrossRef]
  29. Liu, S.; De, G.; Xu, Y.; Wang, X.; Liu, Y.; Cheng, C.; Wang, J. Size, phase-controlled synthesis, the nucleation and growth mechanisms of NaYF4: Yb/Er nanocrystals. J. Rare Earths 2018, 36, 1060–1066. [Google Scholar] [CrossRef]
  30. Wang, F.; Han, Y.; Lim, C.S.; Lu, Y.; Wang, J.; Xu, J.; Chen, H.; Zhang, C.; Hong, M.; Liu, X. Simultaneous phase and size control of upconversion nanocrystals through lanthanide doping. Nature 2010, 463, 1061–1065. [Google Scholar] [CrossRef]
  31. Huong, T.T.; Vinh, L.T.; Khuyen, H.T.; Tuyen, L.D.; Van, N.D.; Thao, D.T.; Phuong, H.T. Synthesis and in vitro testing of YVO4:Eu3+@silica- NH-GDA-IgG bio-nano complexes for labelling MCF-7 breast cancer cells. Molecules 2023, 28, 280. [Google Scholar] [CrossRef]
Figure 1. FESEM images of (a) NaYF4: Er3+/Yb3+, (b) NaYF4: Er3+/Yb3+–OA (10−1 M), (c) NaYF4: Er3+/Yb3+–OA (10−2 M), and (d) NaYF4: Er3+/Yb3+–OA (10−3 M) samples.
Inorganics 13 00140 g001
Figure 2. X-ray diffraction pattern of (1) NaYF4: Er3+/Yb3+, (2) NaYF4: Er3+/Yb3+–OA (10−1 M), (3) NaYF4: Er3+/Yb3+–OA (10−2 M), and (4) NaYF4: Er3+/Yb3+–OA (10−3 M) samples.
Inorganics 13 00140 g002
Figure 3. FTIR spectrum of the NaYF4: Er3+/Yb3+–OA (10−3 M) samples.
Inorganics 13 00140 g003
Figure 4. EDX spectrum of the β-NaYF4: Er3+/Yb3+—oleic acid 10−3 M sample.
Inorganics 13 00140 g004
Figure 5. Mapping EDS images of β-NaYF4: Er3+/Yb3+–OA (10−3 M) nanoparticles, the distribution of: (I) sodium (Na) element; (II) yttrium (Y) element; (III) fluorine (F) element; (IV) ytterbium (Yb) element; (V) erbium (Er) element, and (VI) merged color.
Inorganics 13 00140 g005
Figure 6. The upconversion photoluminescence spectra of (a) NaYF4: Er3+/Yb3+, (b) NaYF4: Er3+/Yb3+–OA (10−1 M), (c) NaYF4: Er3+/Yb3+–OA (10−2 M), and (d) NaYF4: Er3+/Yb3+–OA (10−3 M) samples under 980 nm excitation.
Inorganics 13 00140 g006
Figure 7. Fluorescence microscopy images of HeLa cervical cancer cells after 3 h of incubation with (a) HeLa cervical cancer cells (negative control) and (b) β-NaYF4: Er3+/Yb3+@SNGA-IgG conjugates at a concentration of 20 µg/mL.
Inorganics 13 00140 g007
Disclaimer/Publisher’s Note: The statements, opinions and data contained in all publications are solely those of the individual author(s) and contributor(s) and not of MDPI and/or the editor(s). MDPI and/or the editor(s) disclaim responsibility for any injury to people or property resulting from any ideas, methods, instructions or products referred to in the content.

