Article

Unraveling the Effect of Synthesis Temperature and Metal Doping on the Structural, Optical, and Photocatalytic Properties of g-C3N4 for Enhanced E. coli Photodisinfection and Self-Cleaning Surface Applications

by
D. Fabio Mercado
1,2,*,
Isabel Cristina Ortega Bedoya
3,
Gloria Cristina Valencia
3 and
Ricardo A. Torres-Palma
1,*
1
Grupo de Investigación en Remediación Ambiental y Biocatálisis (GIRAB), Instituto de Química, Facultad de Ciencias Exactas y Naturales, Universidad de Antioquia UdeA, Calle 70 No. 52-21, Medellín 050010, Colombia
2
Programa de Química Farmacéutica, Universidad CES, Calle 10a No. 22-04, Medellín 050031, Colombia
3
Grupo de Investigación Aplicaciones en Fotoquímicas (GIAFOT), Escuela de Química, Facultad de Ciencias, Universidad Nacional de Colombia-Sede Medellín, Calle 59a 63-020 Autopista Norte, P.O. Box 3840, Medellín 050034, Colombia
*
Authors to whom correspondence should be addressed.
Inorganics 2025, 13(8), 262; https://doi.org/10.3390/inorganics13080262
Submission received: 2 June 2025 / Revised: 28 July 2025 / Accepted: 8 August 2025 / Published: 11 August 2025
(This article belongs to the Special Issue Transition Metal Catalysts: Design, Synthesis and Applications)

Abstract

The development of efficient photocatalytic materials for waterborne pathogen inactivation and self-cleaning surfaces in biomedical applications remains a critical challenge due to the rising prevalence of antimicrobial-resistant bacteria. This study systematically investigates the structural, optical, and photocatalytic disinfection properties of graphitic carbon nitride (g-C3N4) synthesized at variable temperatures (450–600 °C) and doped with transition metals (Mn, Co, Cu). Through FTIR and UV/Vis spectroscopy, we demonstrate that synthesis temperatures between 450 and 550 °C yield a well-ordered polymeric network with enhanced π-conjugation and charge separation, while 600 °C induces structural degradation. Metal doping with Mn and Co significantly enhances photocatalytic disinfection, achieving complete E. coli inactivation (6-log reduction) within 6 h via optimized reactive oxygen species (ROS) generation. The best material (g-C3N4 synthesized at 500 °C and doped with Mn) was integrated into sodium alginate hydrogel surfaces, demonstrating reusable self-cleaning functionality with sustained bactericidal activity (5.9-log CFU/mL reduction after five cycles). This work provides a roadmap for tailoring metal-doped g-C3N4 composites for practical antimicrobial applications, emphasizing the interplay between synthesis parameters, ROS dynamics, and real-world performance.

1. Introduction

Waterborne pathogenic bacteria represent a major public health concern due to their ability to spread antimicrobial resistance and persist in aquatic environments. Many of these microorganisms can form biofilms on surfaces, making their eradication particularly challenging [1]. These issues have spurred growing interest in advanced disinfection strategies, particularly those based on visible-light-activated photocatalytic materials [2].
In this sense, heterogeneous photocatalysis, a subset of advanced oxidation processes (AOPs), uses photocatalytic materials to generate reactive oxygen species (ROS) like hydroxyl radicals (HO•), superoxide anions (O2), and singlet oxygen (1O2), which degrade organic pollutants and inactivate microorganisms [3,4]. While TiO2 is the most studied photocatalytic material, its limited visible-light absorption (λ < 387 nm) and rapid charge recombination (~100 ps) limit its application [5]. Thus, the development of new semiconductors is required.
On the other hand, graphitic carbon nitride (g-C3N4), a metal-free semiconductor, offers advantages such as visible-light responsiveness (bandgap ~2.8 eV, which correlates with a wavelength of 442 nm), thermal stability, and low toxicity [6,7]. However, its efficiency is constrained by its low surface area and sluggish charge transfer [6]. Recent advances highlight that optimizing synthesis parameters—particularly the polycondensation temperature of urea precursors—can tailor its structural and electronic properties [8].
Although several studies have examined the effect of synthesis temperature on the structural and optical properties of carbon nitride-based materials, most reports focus on narrow temperature intervals or on materials tailored for general photocatalytic applications, such as dye degradation or hydrogen evolution [8]. However, to date, there is no comprehensive study that systematically explores a wide synthesis temperature range and its impact on the photocatalytic disinfection performance of g-C3N4, particularly regarding the generation pathways of reactive oxygen species (ROS) and their correlation with bacterial inactivation efficiency. Furthermore, few studies translate powdered catalysts into functional self-cleaning surfaces, limiting real-world applicability.
In addition, critical gaps persist in understanding how synthesis temperature synergizes with metal doping to govern ROS dynamics and bactericidal efficacy. In fact, while transition metal doping (e.g., Mn, Co, Cu) is known to alter the electronic structure of g-C3N4 by introducing mid-gap states, prior works have predominantly studied doping effects independently of synthesis temperature [9]. For instance, Fe3O4 incorporation has been reported to enhance O2 and HO• [10]. Yet, the interplay between optimized synthesis temperatures and metal doping, which are critical for tailoring ROS selectivity and bactericidal performance, has not been rigorously addressed.
Taking E. coli as an indicator of bacterial inactivation, this study bridges the abovementioned gaps by systematically investigating how synthesis temperature (450–600 °C) governs the structural, optical, and electrochemical properties of g-C3N4, as well as how subsequent transition metal doping (Mn, Co, Cu) modulates ROS generation and disinfection kinetics. By integrating temperature-dependent structural analysis with metal doping strategies, we identify synergistic conditions for maximizing photocatalytic disinfection efficiency and translate these insights into functional self-cleaning surfaces.

2. Results and Discussion

2.1. Characterization of g-C3N4 Synthesized at Different Temperatures

2.1.1. Spectroscopic Characterization of Bare g-C3N4

The FTIR spectra shown in Figure 1 illustrate the structural evolution of g-C3N4 synthesized at different temperatures, with the spectrum of urea included as a reference. The initial spectrum of urea exhibits several sharp and intense bands characteristic of its molecular structure, particularly vibrations related to N–H stretching and C=O functional groups. Upon thermal treatment, these distinctive urea signals are modified, confirming the decomposition of the precursor and the subsequent formation of polymeric structures consistent with graphitic carbon nitride [11].
In the spectra of the thermally treated samples, a prominent and sharp absorption band appears around 810 cm−1 across all cases, corresponding to the out-of-plane bending vibrations of the s-triazine rings. This feature is a well-known fingerprint of the g-C3N4 structure and indicates the successful formation of the heptazine-based polymeric network. Additionally, in the range of 1200–1650 cm−1, multiple overlapping bands are observed, which are associated with the stretching vibrations of C–N and C=N bonds in the heterocyclic framework. These bands are clearly defined in samples synthesized between 450 and 600 °C, demonstrating the development and stability of the g-C3N4 structure within this temperature range [11].
The region between 3000 and 3400 cm−1 displays a broad absorption band in all samples, which can be attributed to the N–H stretching vibrations of the terminal amine groups and O–H stretching from adsorbed water or hydroxyl functionalities. As the synthesis temperature increases, the intensity of this broad band gradually increases, indicating progressive condensation of surface amine groups and a more hydrophilic surface [11]. This trend reflects the thermal evolution of the synthesized g-C3N4, which is consistent with the material undergoing further deamination and densification at higher temperatures.
A shoulder around 1170 cm−1 becomes more apparent in the spectra of samples treated at intermediate temperatures, particularly at 500 and 550 °C. This feature is associated with the presence of C–OH groups located at the edges of the g-C3N4 sheets [11]. Its relative prominence suggests that moderate temperatures favor the retention of certain edge functionalities that may be beneficial for further surface modifications or interactions.
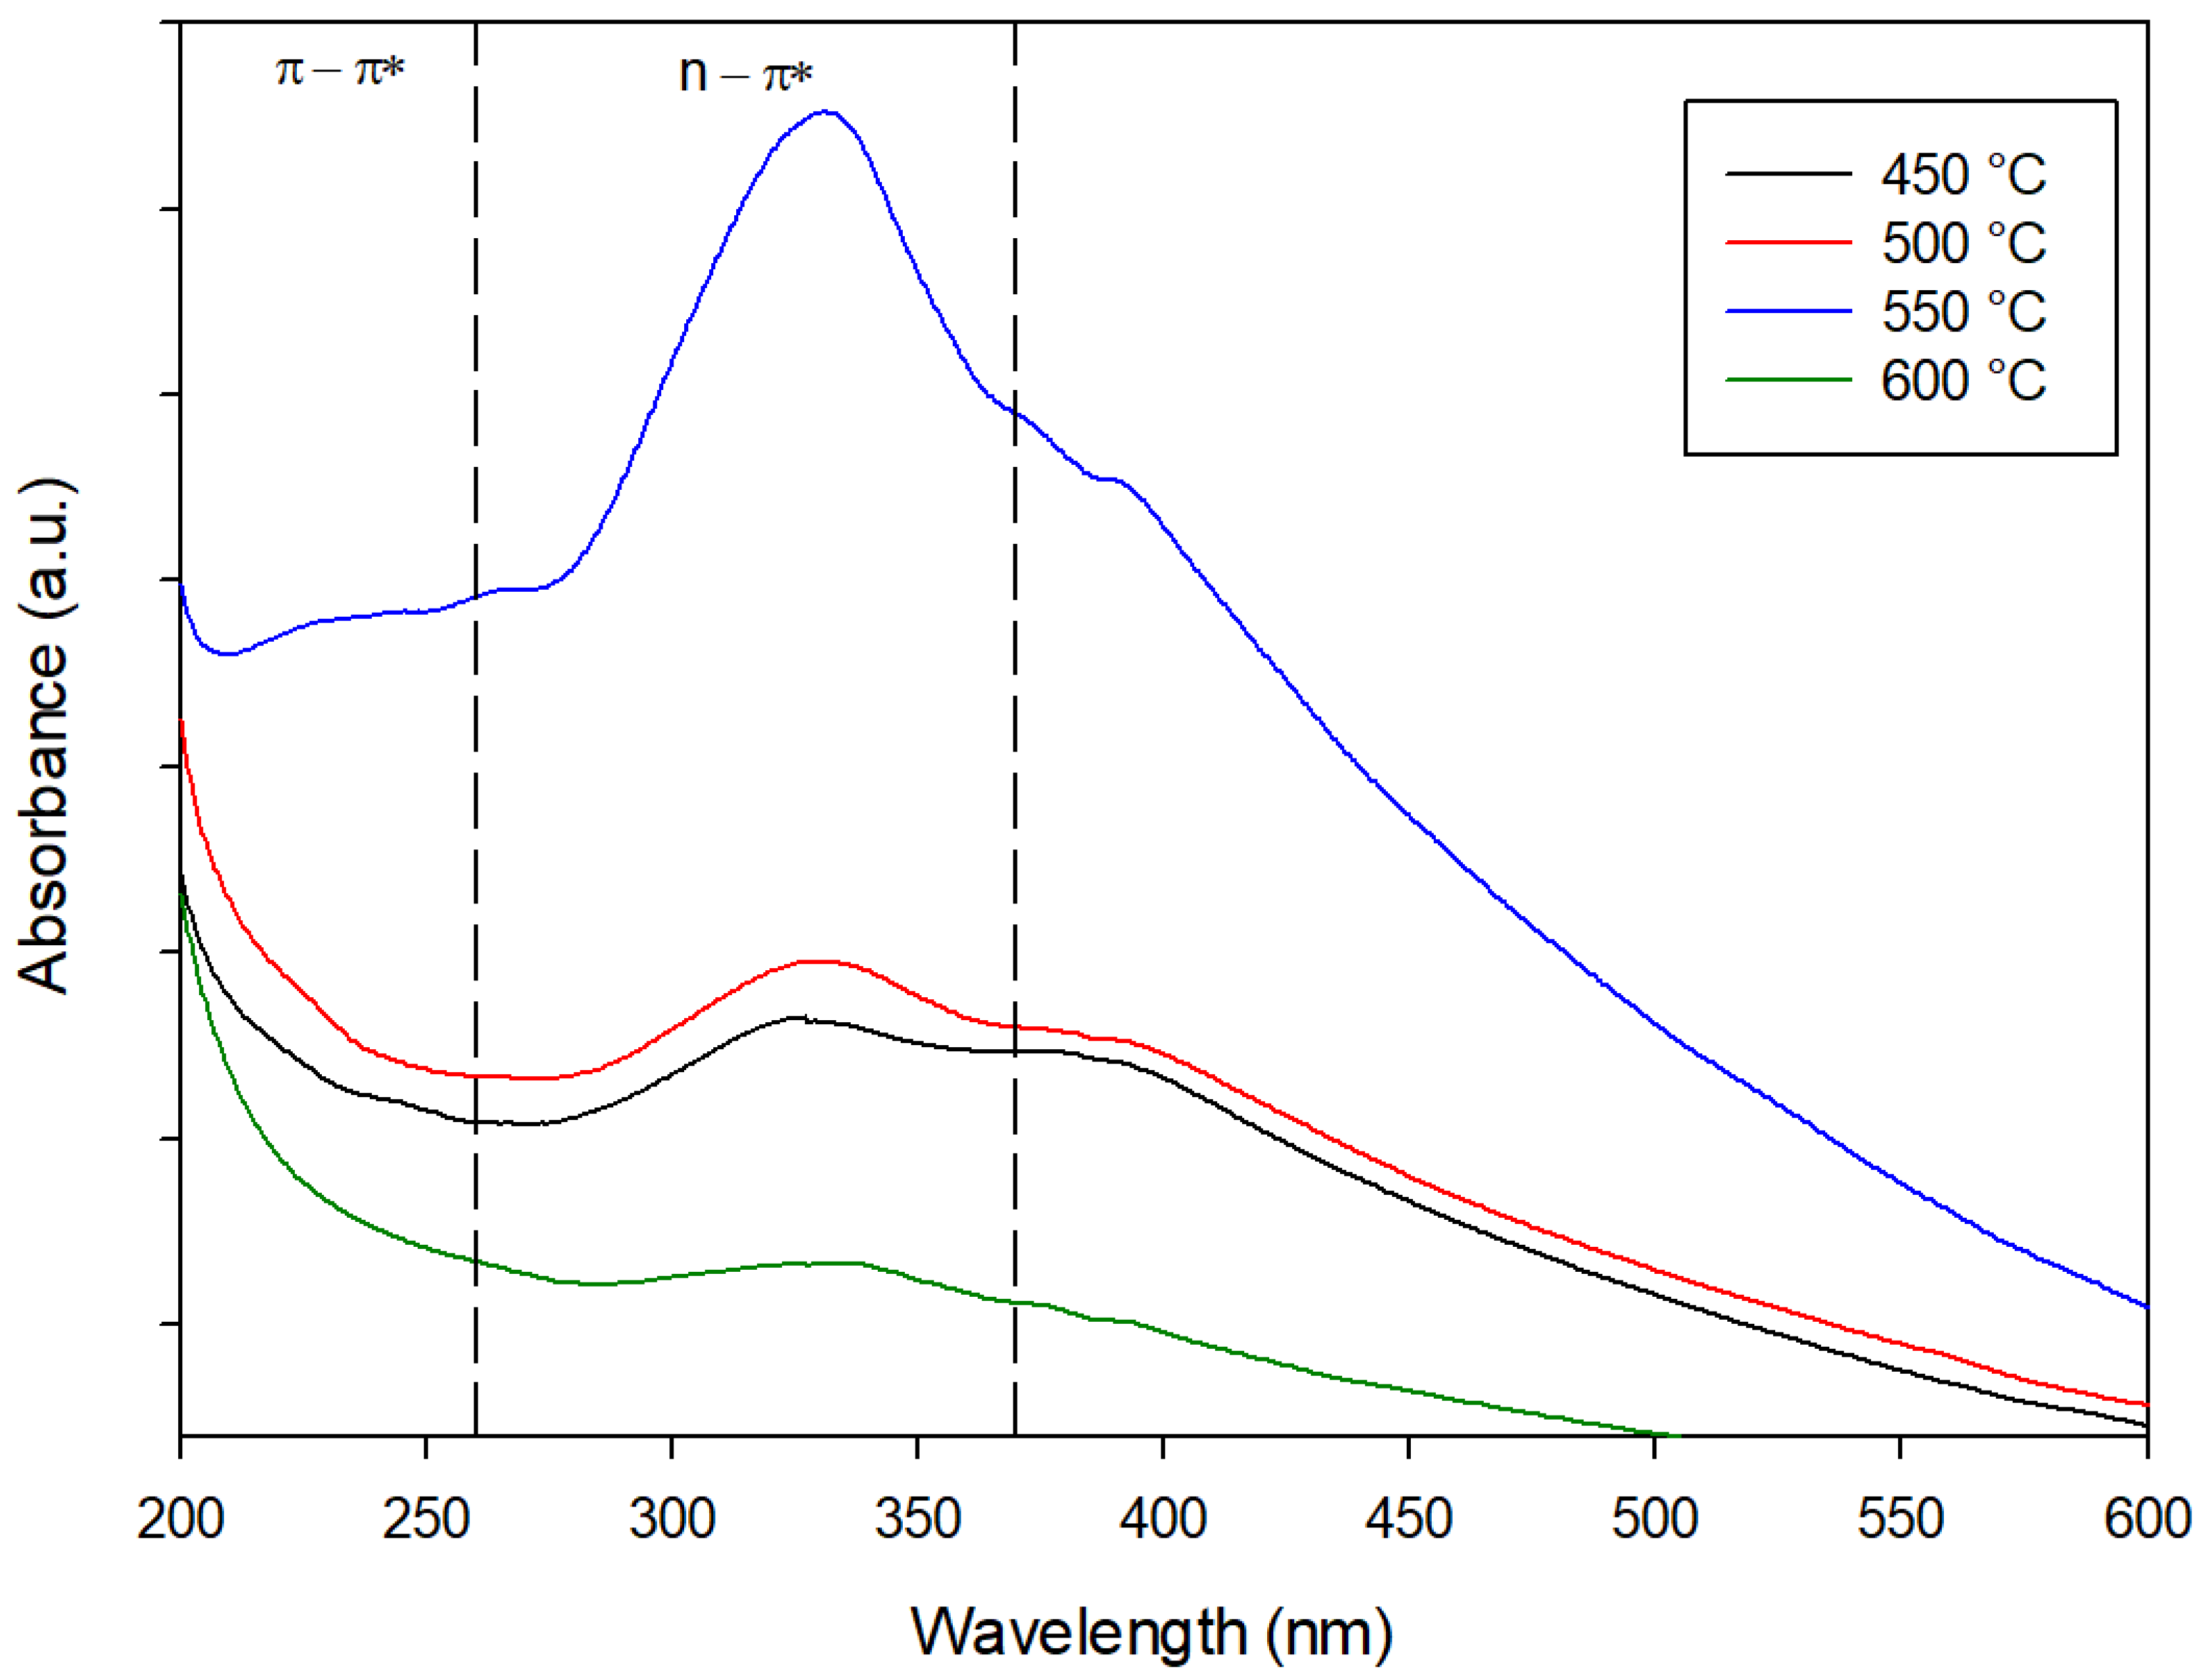
The UV/Vis spectra presented in Figure 2 correspond to g-C3N4 samples synthesized at different temperatures, ranging from 450 °C to 600 °C. All spectra exhibit two main absorption features, characteristic of polymeric carbon nitride. The first is an intense absorption band below 260 nm, which is attributed to π → π* electronic transitions within the aromatic s-triazine units. This band is prominent in all samples and confirms the presence of the conjugated aromatic system typical of g-C3N4 [12]. The second feature is a broader absorption band extending from approximately 270 to 400 nm, which corresponds to n → π* transitions involving lone pairs on nitrogen atoms in C–N bonds. This band reflects the presence of nonbonding electronic states and is sensitive to the local electronic environment, particularly to changes in structure and defects.
The Tauc plots corresponding to g-C3N4 samples synthesized at different temperatures (450–600 °C) are shown in Figure 3. For the sample synthesized at 450 °C, the extrapolated bandgap is approximately 2.75 eV. This value is characteristic of a partially polymerized g-C3N4 structure, suggesting that the condensation process is still incomplete, and the π-conjugated system is not yet fully developed. The corresponding UV/Vis spectrum supports this interpretation, showing moderate absorbance in the UV region and limited extension into the visible range. Table 1 summarizes the experimental bandgaps and the correlated maximum wavelengths associated with the electron migration from the valence band to the conduction band. Moreover, it shows the electric resistance for the diffusion of the electrons through the semiconductor domains and the flat potential band of the conduction band measured by impedance electrochemical spectroscopy and the corresponding flat potential of the valence band.
At 500 °C, the bandgap decreases to 2.66 eV, indicating a more advanced degree of condensation and a better-organized structure. This correlates with the increase in the n → π* transition band observed in the UV/Vis spectrum, pointing to an improved electronic configuration.
The sample obtained at 550 °C presents a higher bandgap compared to the preceding materials, 2.89 eV, and the most intense optical absorption among all samples. Although the bandgap increases slightly, this is likely due to a reduction in defect states and trap levels, which narrows the density of electronic states near the conduction and valence bands [14].
For the 600 °C sample, the bandgap increases to 3.30 eV, yet the UV/Vis spectrum reveals a significant drop in absorbance intensity, implying the beginning of structural degradation. The loss of chromophoric density and extended conjugation could adversely affect the optical performance of the material.

2.1.2. Electrochemical Characterization of Bare g-C3N4

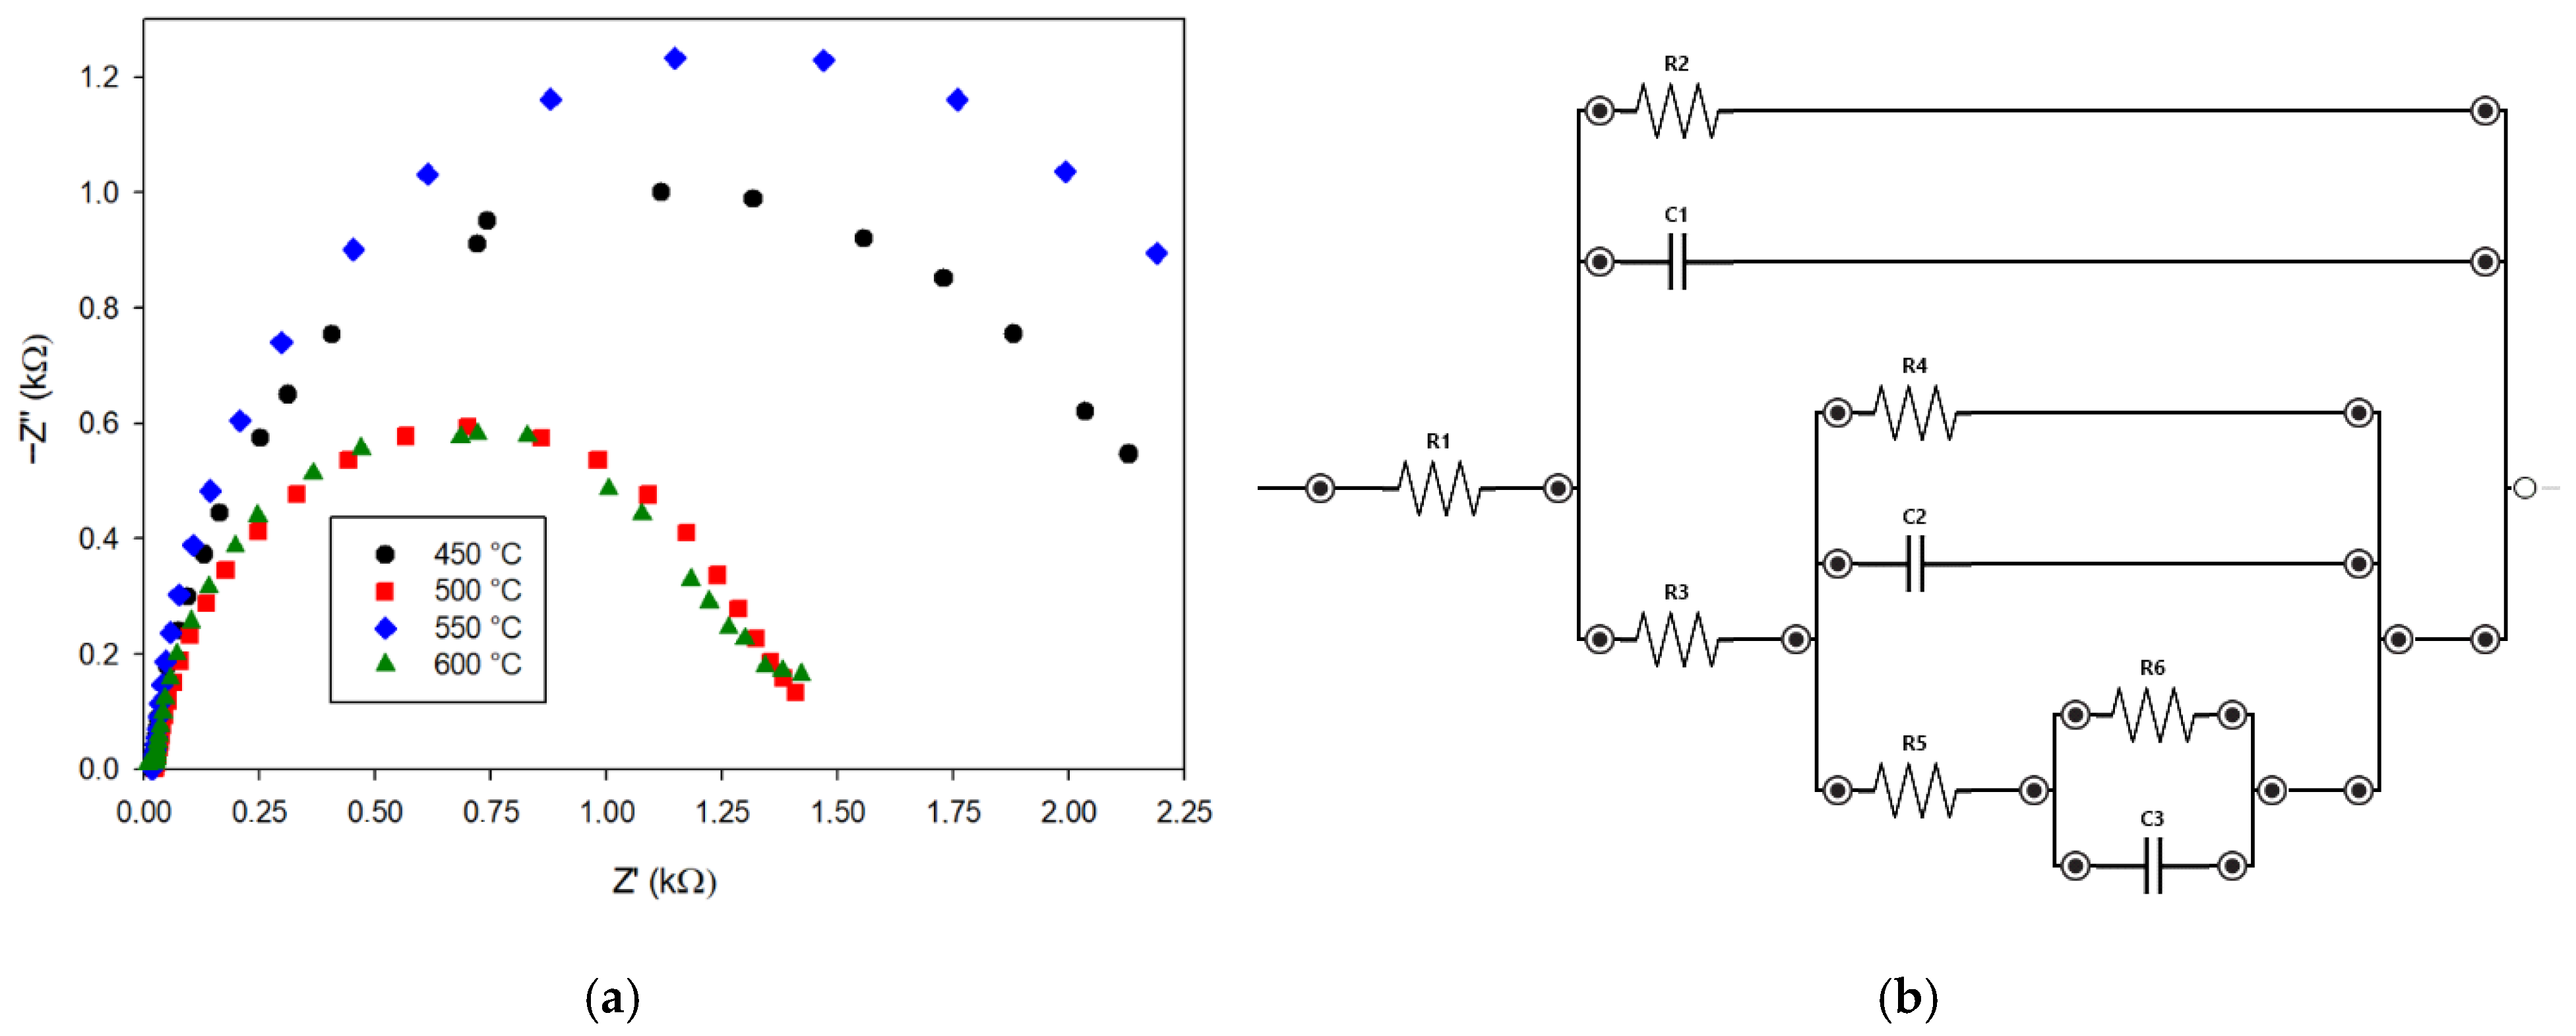
The electrochemical impedance spectroscopy (EIS) results presented in Figure 4a show the Nyquist plots for g-C3N4 materials synthesized at different temperatures (450–600 °C), while Figure 4b depicts the equivalent electrical circuit model used to fit the experimental data. The Nyquist plots represent the imaginary impedance component (−Z″) as a function of the real component (Z′) and provide valuable insight into the charge transport, interface properties, and resistive/capacitive behavior of the materials.
All spectra exhibit semicircular shapes, characteristic of mixed charge-transfer and diffusion-controlled processes in porous or semiconducting materials. The diameter of the semicircle is typically associated with the charge-transfer resistance, while deviations from a perfect semicircle suggest complex interfacial phenomena, such as distributed capacitance or multiple relaxation processes [15].
Among the samples, the one synthesized at 550 °C (blue diamonds) shows the largest semicircle diameter, corresponding to the highest charge-transfer resistance. This behavior is consistent with the highly ordered structure and lower defect density observed for this sample in the UV/Vis analysis in Figure 1 and Figure 2.
In contrast, the samples synthesized at 500 °C (red squares) and 600 °C (green triangles) show smaller semicircles, indicating lower charge-transfer resistance and potentially enhanced ionic or electronic conductivity [15]. The 450 °C sample (black circles) also exhibits relatively high resistance, limiting effective charge transport.
The Mott–Schottky (M–S) plots shown in Figure 5 correspond to g-C3N4 samples synthesized at different temperatures (450–600 °C) and were obtained with EIS. These plots display the inverse squared capacitance (1/C2) as a function of the applied potential versus Ag/AgCl, and they allow the estimation of the flat-band potential of the conduction band (ECB), as well as insights into the semiconductor type and charge-carrier behavior of the materials.
All curves exhibit a positive slope, characteristic of n-type semiconductors, which confirms that the majority carriers in the g-C3N4 samples are electrons. The flat-band potential (Table 1) can be extracted from the x-intercept of the linear region of the plots. As seen, it varies significantly with the synthesis temperature.
These values indicate a clear trend: the flat-band potential shifts toward more positive values as the synthesis temperature increases up to 550 °C, suggesting a progressive improvement in electronic structure and band alignment. The ECB can be seen in the fifth column of Table 1. Beyond 550 °C, the flat-band potential shifts back toward more negative values, as seen for the 600 °C sample.
In addition to the shift in ECB, the slope of the linear region also provides qualitative information about the carrier density. A smaller slope implies a higher charge-carrier density [15], and in this regard, the sample at 500 °C again appears optimal, with a moderately sloped linear region with respect to the other materials, indicating a balance between sufficient charge-carrier concentration and minimized recombination losses.
In summary, the combined structural, optical, electronic, and electrochemical analyses show that the properties of g-C3N4 are significantly influenced by the synthesis temperature.
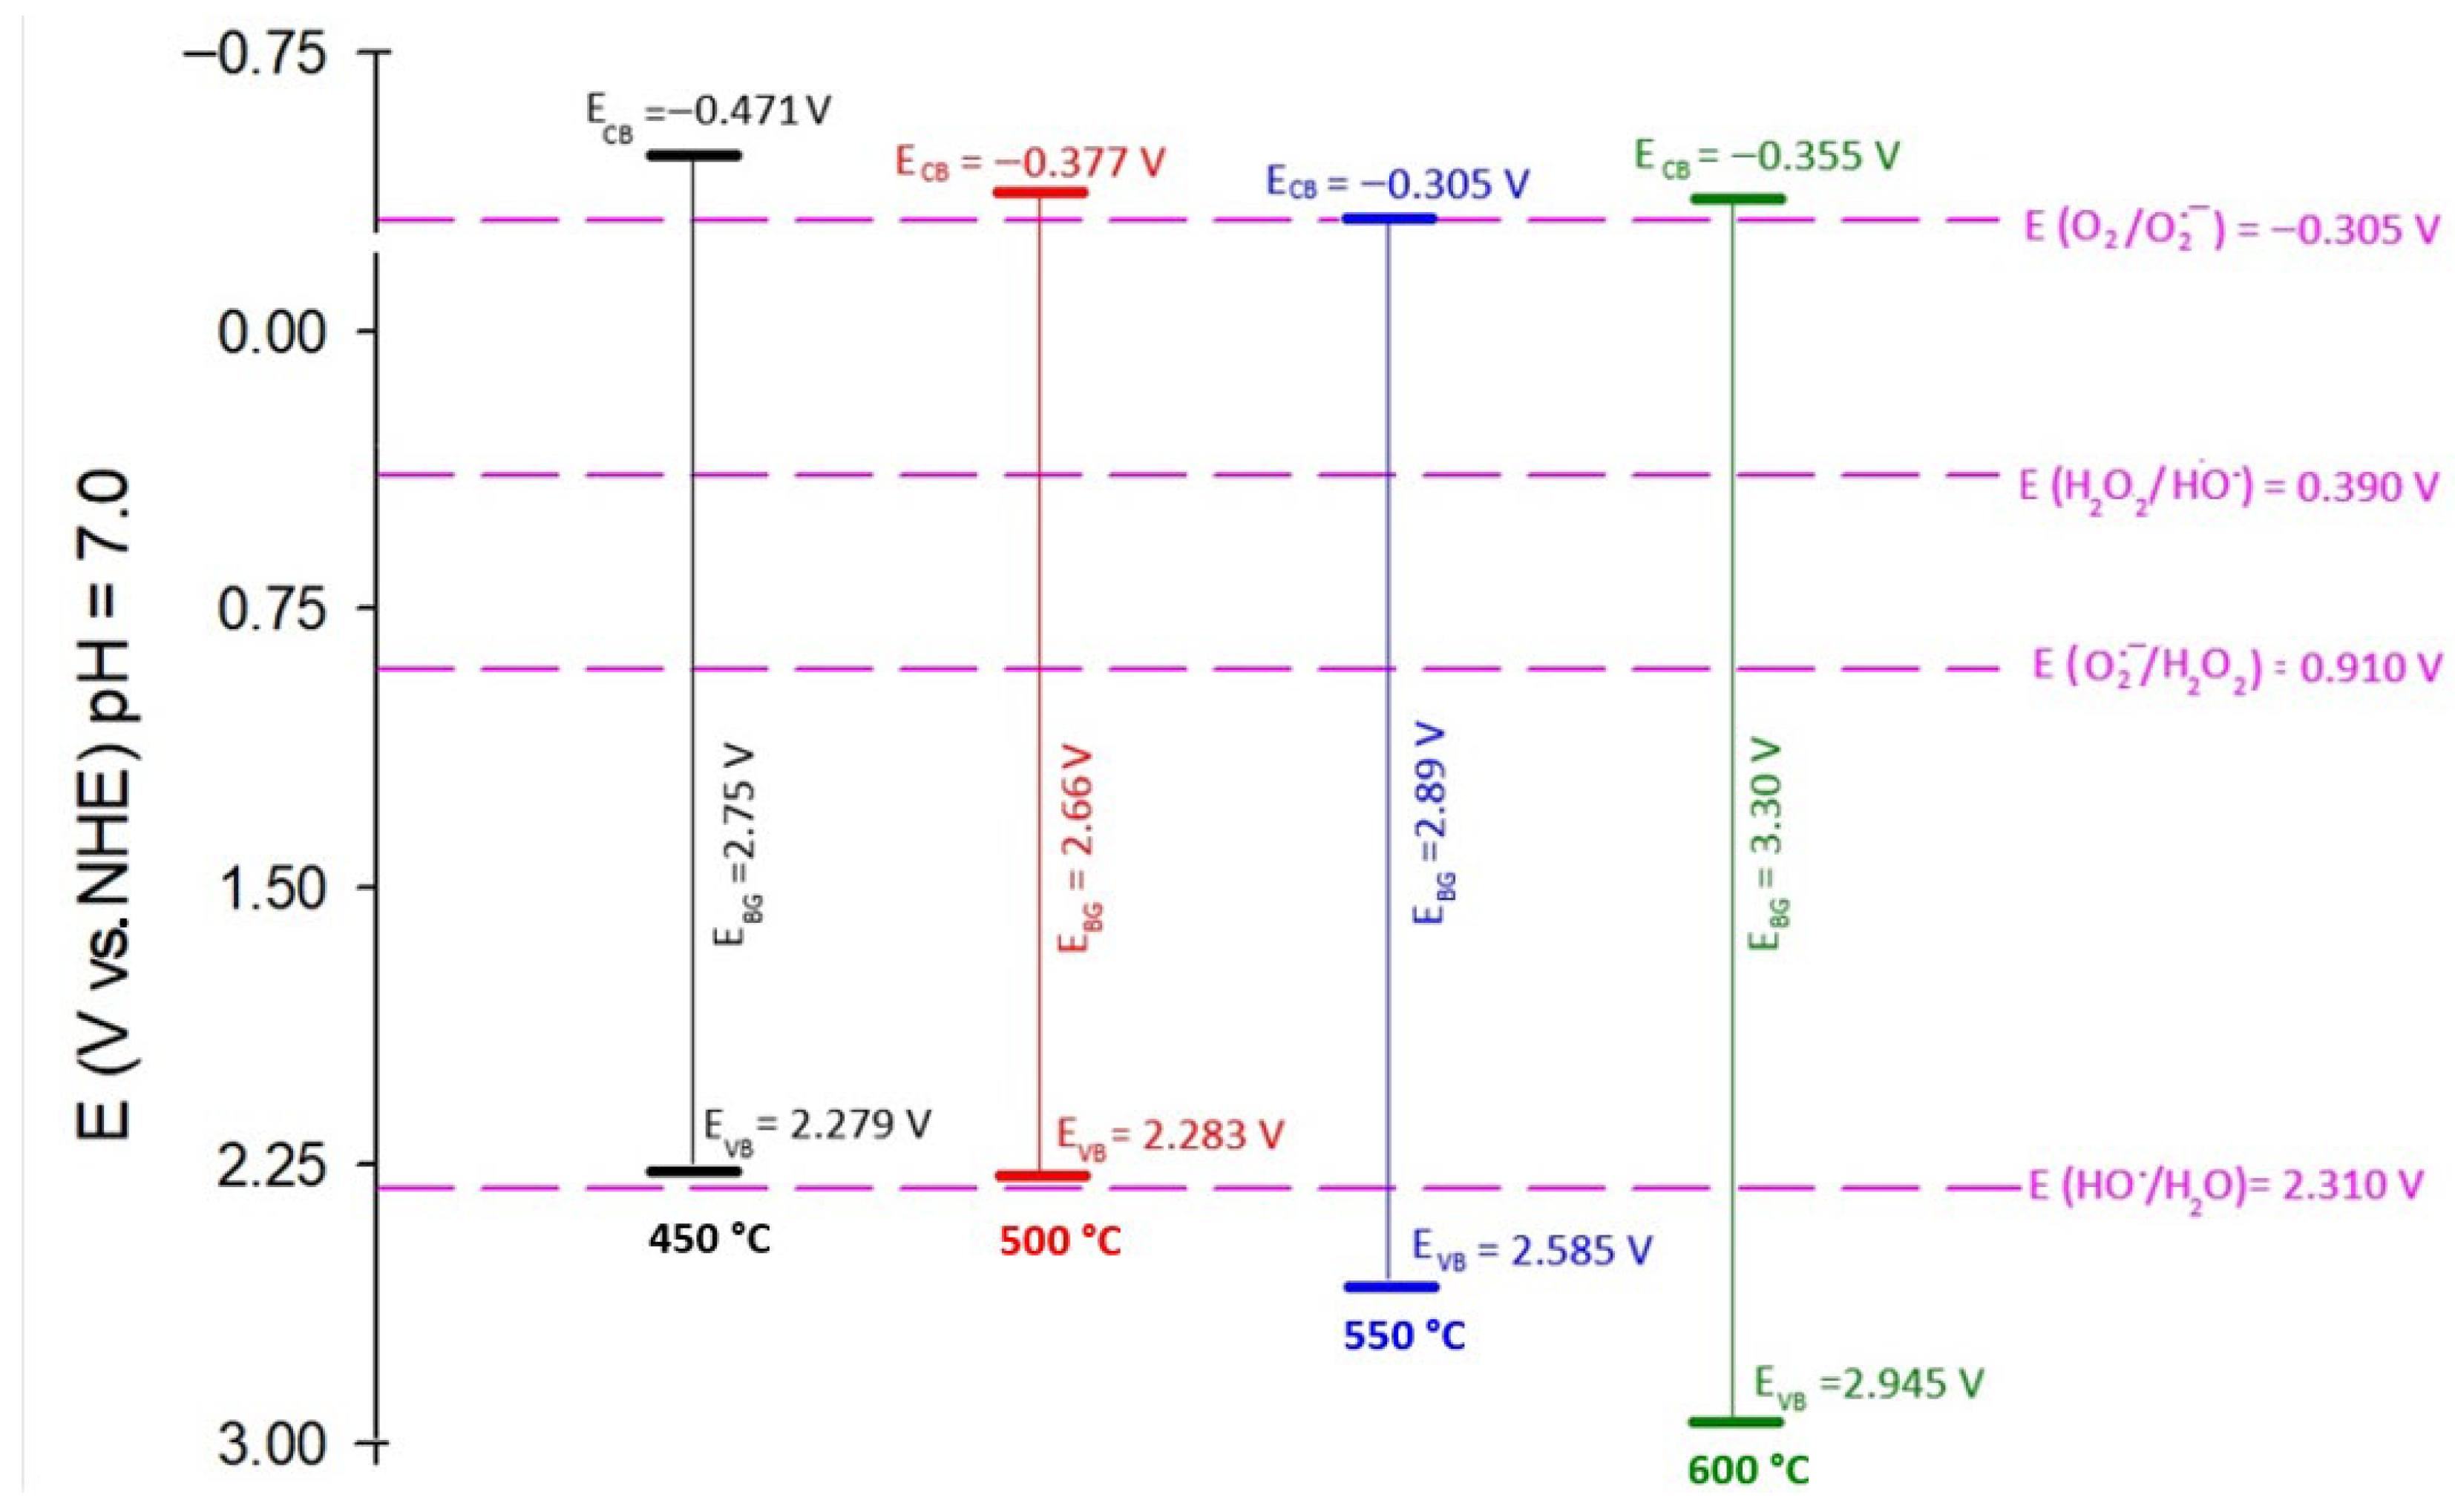
Figure 6 presents the redox potentials (referenced to the Normal Hydrogen Electrode, NHE, at pH 7.0) of selected reactions associated with the generation of reactive oxygen species (ROS), superimposed on the estimated conduction and valence band edges of the synthesized g-C3N4 materials. The band positions were inferred from the Tauc and Mott–Schottky analyses discussed previously.
The conduction band edges for all samples lie at more negative potentials than the O2/O2 redox couple (−0.305 V vs. NHE), indicating that photoexcited electrons in each material can thermodynamically reduce molecular oxygen to generate superoxide radicals (O2). However, differences are observed in the positions of the valence bands. Only the materials synthesized above 500 °C have a valence band edge more positive than the redox potential required for the oxidation of water to hydroxyl radicals (HO•), which takes places at 2.310 V vs. NHE. The valence band positions of the other samples fall below this threshold, meaning they cannot oxidize water to HO• via direct hole-driven oxidation under standard conditions.
As documented in the literature [16], the photocatalytic generation of reactive oxygen species (ROS) by g-C3N4 can also include the production of singlet oxygen (1O2). Mechanistic studies propose a sequential redox pathway involving (i) the reduction of molecular oxygen (O2) by photogenerated electrons (e) to form superoxide anion radicals (O2), followed by (ii) the oxidation of O2 by valence band holes (h+) to yield 1O2 (Equations (1) and (2)):
O2 + e → O2•−
O2•− + h+1O2
However, the thermodynamic feasibility of this two-step mechanism remains ambiguous due to the absence of experimentally validated standard reduction potentials E(O2/1O2). While the E(O2/O2) is well-established (−0.305 V vs. NHE at pH = 7.0), the potential required for O2 oxidation to 1O2 has not been systematically characterized.
Alternatively, 1O2 generation may proceed via energy transfer from photoexcited g-C3N4 to ground-state triplet oxygen (3O2). This pathway involves intersystem crossing (ISC) to populate triplet-excited states of g-C3N4, which transfer energy to 3O2 and subsequently promote the singlet-state (1Δg) formation.
The reactive oxidative species (ROS) predominant in a photocatalytic process depends on the relative contributions of these competing mechanisms. Further investigation should be carried out to identify the ROS formed under work conditions.
Based on these results, the samples synthesized at 450, 500, and 550 °C are considered promising, as they maintain structural integrity and present favorable optical and electronic properties. Meanwhile, the sample treated at 600 °C is classified as less promising due to signs of thermal degradation that negatively affect its physicochemical performance. Further photocatalytic testing will be necessary to confirm the practical implications of these findings.

2.2. Photocatalytic Evaluation of Bare g-C3N4 Synthesized at Different Temperatures

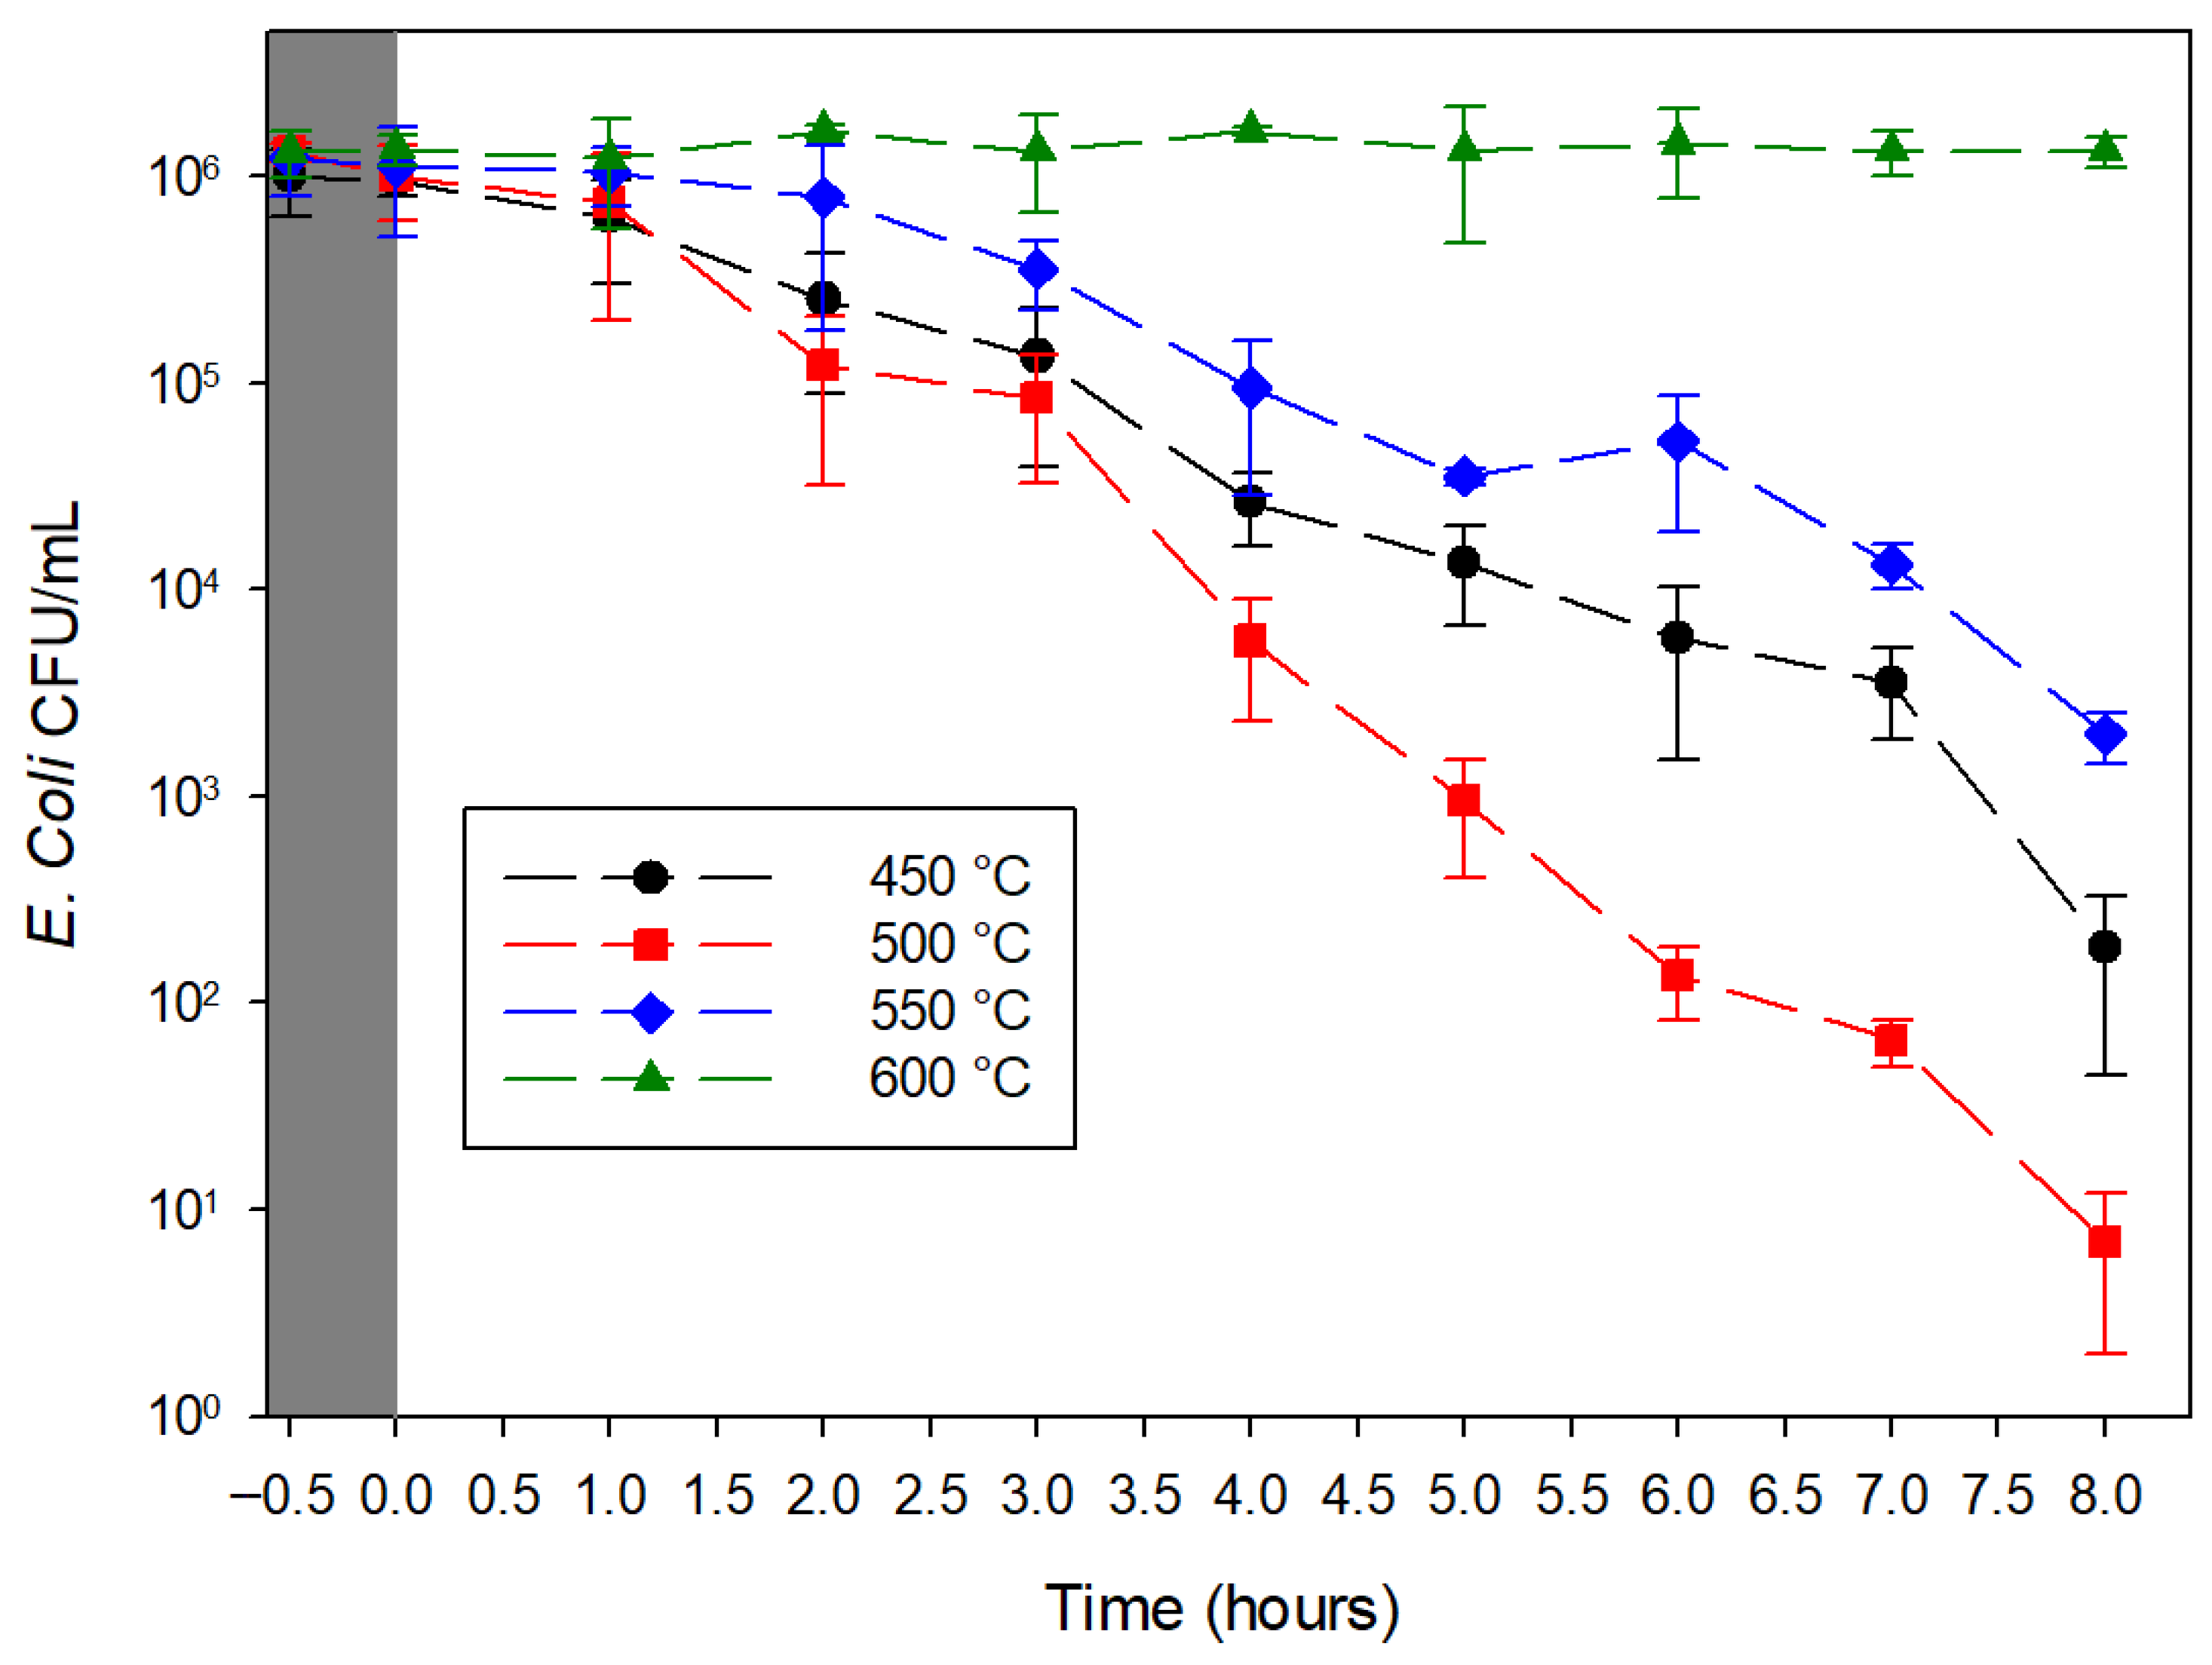
The disinfection profiles presented in Figure 7 show the photocatalytic inactivation of E. coli over time using g-C3N4 materials synthesized at different temperatures (450–600 °C). The results reveal a strong dependence of the antibacterial activity on the synthesis temperature, consistent with the structural, optical, electronic, and electrochemical characterizations previously discussed.
The material synthesized at 500 °C displays the fastest and most efficient bacterial inactivation, reducing the viable cell concentration by over 5 orders of magnitude within 8 h. This rapid disinfection correlates with the well-defined polymeric structure and properties of this sample, related to the strong light absorption and appropriate bandgap (UV/Vis and Tauc analyses), favorable flat-band potential (Mott–Schottky analysis), and relatively low charge-transfer resistance (EIS). These features likely contribute to more efficient generation and separation of photogenerated charge carriers, enhancing the production of reactive oxygen species (ROS), such as O2 or 1O2, which play a dominant role in microbial inactivation.
The 550 °C sample also shows photocatalytic disinfecting properties, though to a lower extent than those observed for the prepared samples at 450 and 500 °C. Despite its excellent optical absorption, its higher charge-transfer resistance (with EIS) may limit the efficiency of ROS generation and delay the inactivation kinetics. Meanwhile, the 450 °C sample shows intermediate activity, consistent with its capacity to generate O2 (Figure 6) or 1O2. However, its relatively lower light absorption, as shown in Figure 2, and incomplete polymerization may result in a decrease in photocatalytic activity.
In stark contrast, the sample synthesized at 600 °C exhibits negligible disinfection activity over the 8 h period. This might be due to the relatively high EBG needed to activate the catalysts. In fact, wavelengths lower than 375 nm are required for this sample, while, as shown in Figure S1, the LEDs used have an emission spectrum of λ ≥ 425 nm.
Considering all the physicochemical, optical, electronic, and photocatalytic results, the sample synthesized at 500 °C demonstrates the most balanced and effective performance. Therefore, this catalyst was selected to evaluate the influence of metal doping on photocatalytic activity.

2.3. Morphological, Crystallographic, and Spectroscopic Characterization of the Metal-Doped 500 °C g-C3N4 Material

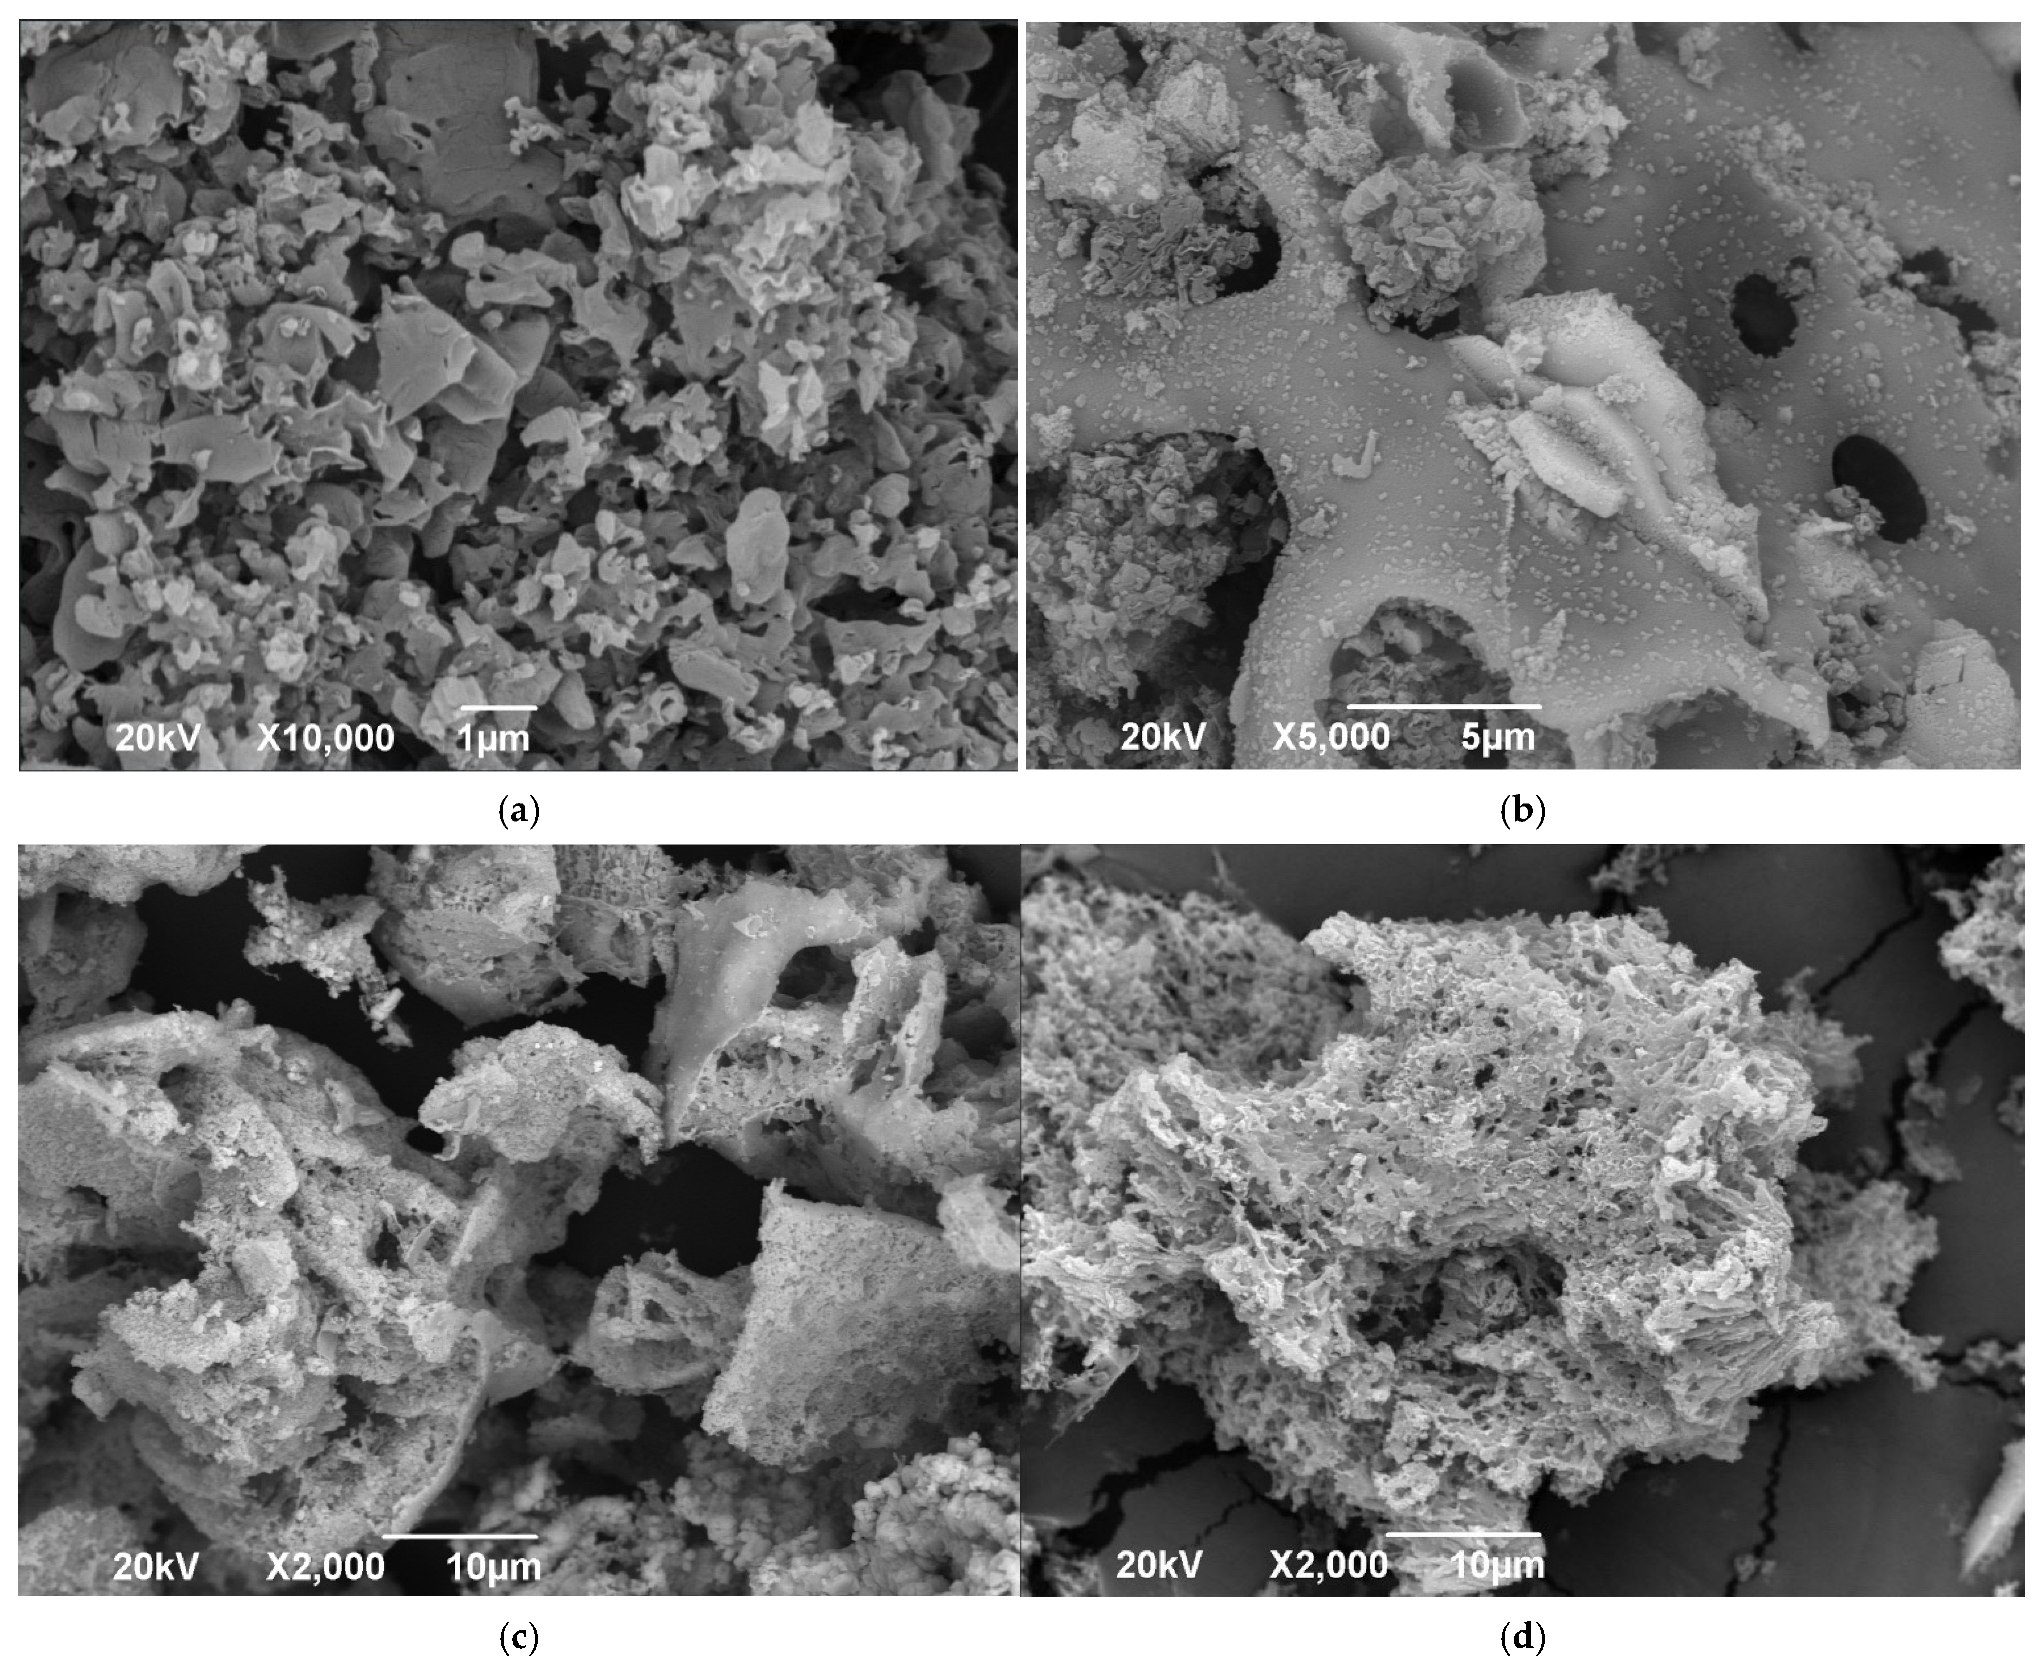
Co-, Mn-, and Cu-doped g-C3N4 synthesized at 500 °C was obtained. Figure 8 shows some selected SEM micrographs of the undoped and metal-containing samples. The undoped material exhibits the typical morphology reported for g-C3N4 materials corresponding to a sheet structure with a low thickness and a relatively low porosity [17]. Upon doping the organic semiconductor with the metal domains, modifications in the morphology are observed. For instance, for 500-Co-25% and 500-Cu-25%, solid particles with a relatively low diameter appear. However, there is not a noticeable difference regarding the porosity with respect to the undoped material. Interestingly, for the sample 500-Mn-25%, a marked difference in the porosity of the sample is appreciated with the development of meso- and microporosity.
Energy-dispersive spectrometer (EDS) analysis evidenced the presence of C and N atoms for all samples. The undoped material showed a C/N ratio of 1.475, which differs from the theoretical 0.75 value. This difference might be due to the corresponding processing for the obtention of the SEM micrographs. Nevertheless, the doped materials showed differences in this ratio with values of 1.445, 1.998, and 1.746 for 500-Mn-25%, 500-Cu-25%, and 500-Co-25%, respectively. These values seem to suggest that although Mn doping modifies the morphological properties of the semiconductor, it does not seem to substantially modify the semiconductor structure, while Co and Cu doping results in the loss of N fractions in the organic moieties. Regarding the metal-containing samples, values of 9.10, 46.51, and 18.96% were elucidated for the metals in the same order as previously mentioned.
To elucidate the crystalline nature of the samples, XRD analysis was performed, and the corresponding diffractograms are shown in Figure 9. The undoped material sample exhibits the typical diffractogram for pristine g-C3N4 with diffraction peaks at 12.9° and 27.6°, which correspond to the (1 0 0) and (0 0 2) planes of the in-plane tri-s-triazine repeated units due to π-π stacking [18]. Interestingly, the introduction of metals to the systems modifies the diffractograms. The peak corresponding to the plane (0 0 2) moves to higher values of 2θ for the samples 500-Co-25% and 500-Cu-25%, while under the experimental conditions, 500-Mn-25% does not seem to modify this value. These results suggest that Co and Cu atoms are being introduced into the organic structure of g-C3N4, while Mn does not seem to be introduced into the semiconductor structure. This analysis agrees with the invariant C/N ratio only for the 500-Mn-25% sample elucidated through EDS.
Nevertheless, in all cases, metal oxide crystalline structures were elucidated. The corresponding crystalline planes are shown directly in Figure 9, which corresponds to CuO (JCPDS Card No. 48-1545), Co3O4 (JCPDS Card No. 42-15467), and Mn3O4 (JCPDS Card No. 01-089-4837) for 500-Cu-25%, 500-Co-25%, and 500-Mn-25%, respectively.
Figure 9c shows the UV/Vis spectra of the metal-doped materials. Interestingly, 500-Cu-25% exhibited marked differences when compared to the pristine 500 °C sample. In agreement with the previous characterization results, this might suggest that Cu doping might affect the organic domain, substantially modifying the optical properties of the composites. On the other hand, although 500-Co-25% retains the main spectral features of the pristine 500 °C sample, a blueshift of the n → π* transition is seen. Instead, 500-Mn-25% shows an almost identical spectrum with lower absorption coefficients.
The EBG from the Tauc plot suggests the modification from 2.66 eV for the pristine 500 °C sample to 2.51 and 2.45 eV for 500-Mn-25% and 500-Co-25%, respectively. Nevertheless, for the 500-Cu-25% sample, the bandgap corresponds to 1.55 eV, which agrees with the reported value for CuO particles.

2.4. Evaluation of the Metal Type to Enhance the Photocatalytic Disinfection Performance of the 500 °C g-C3N4 Material

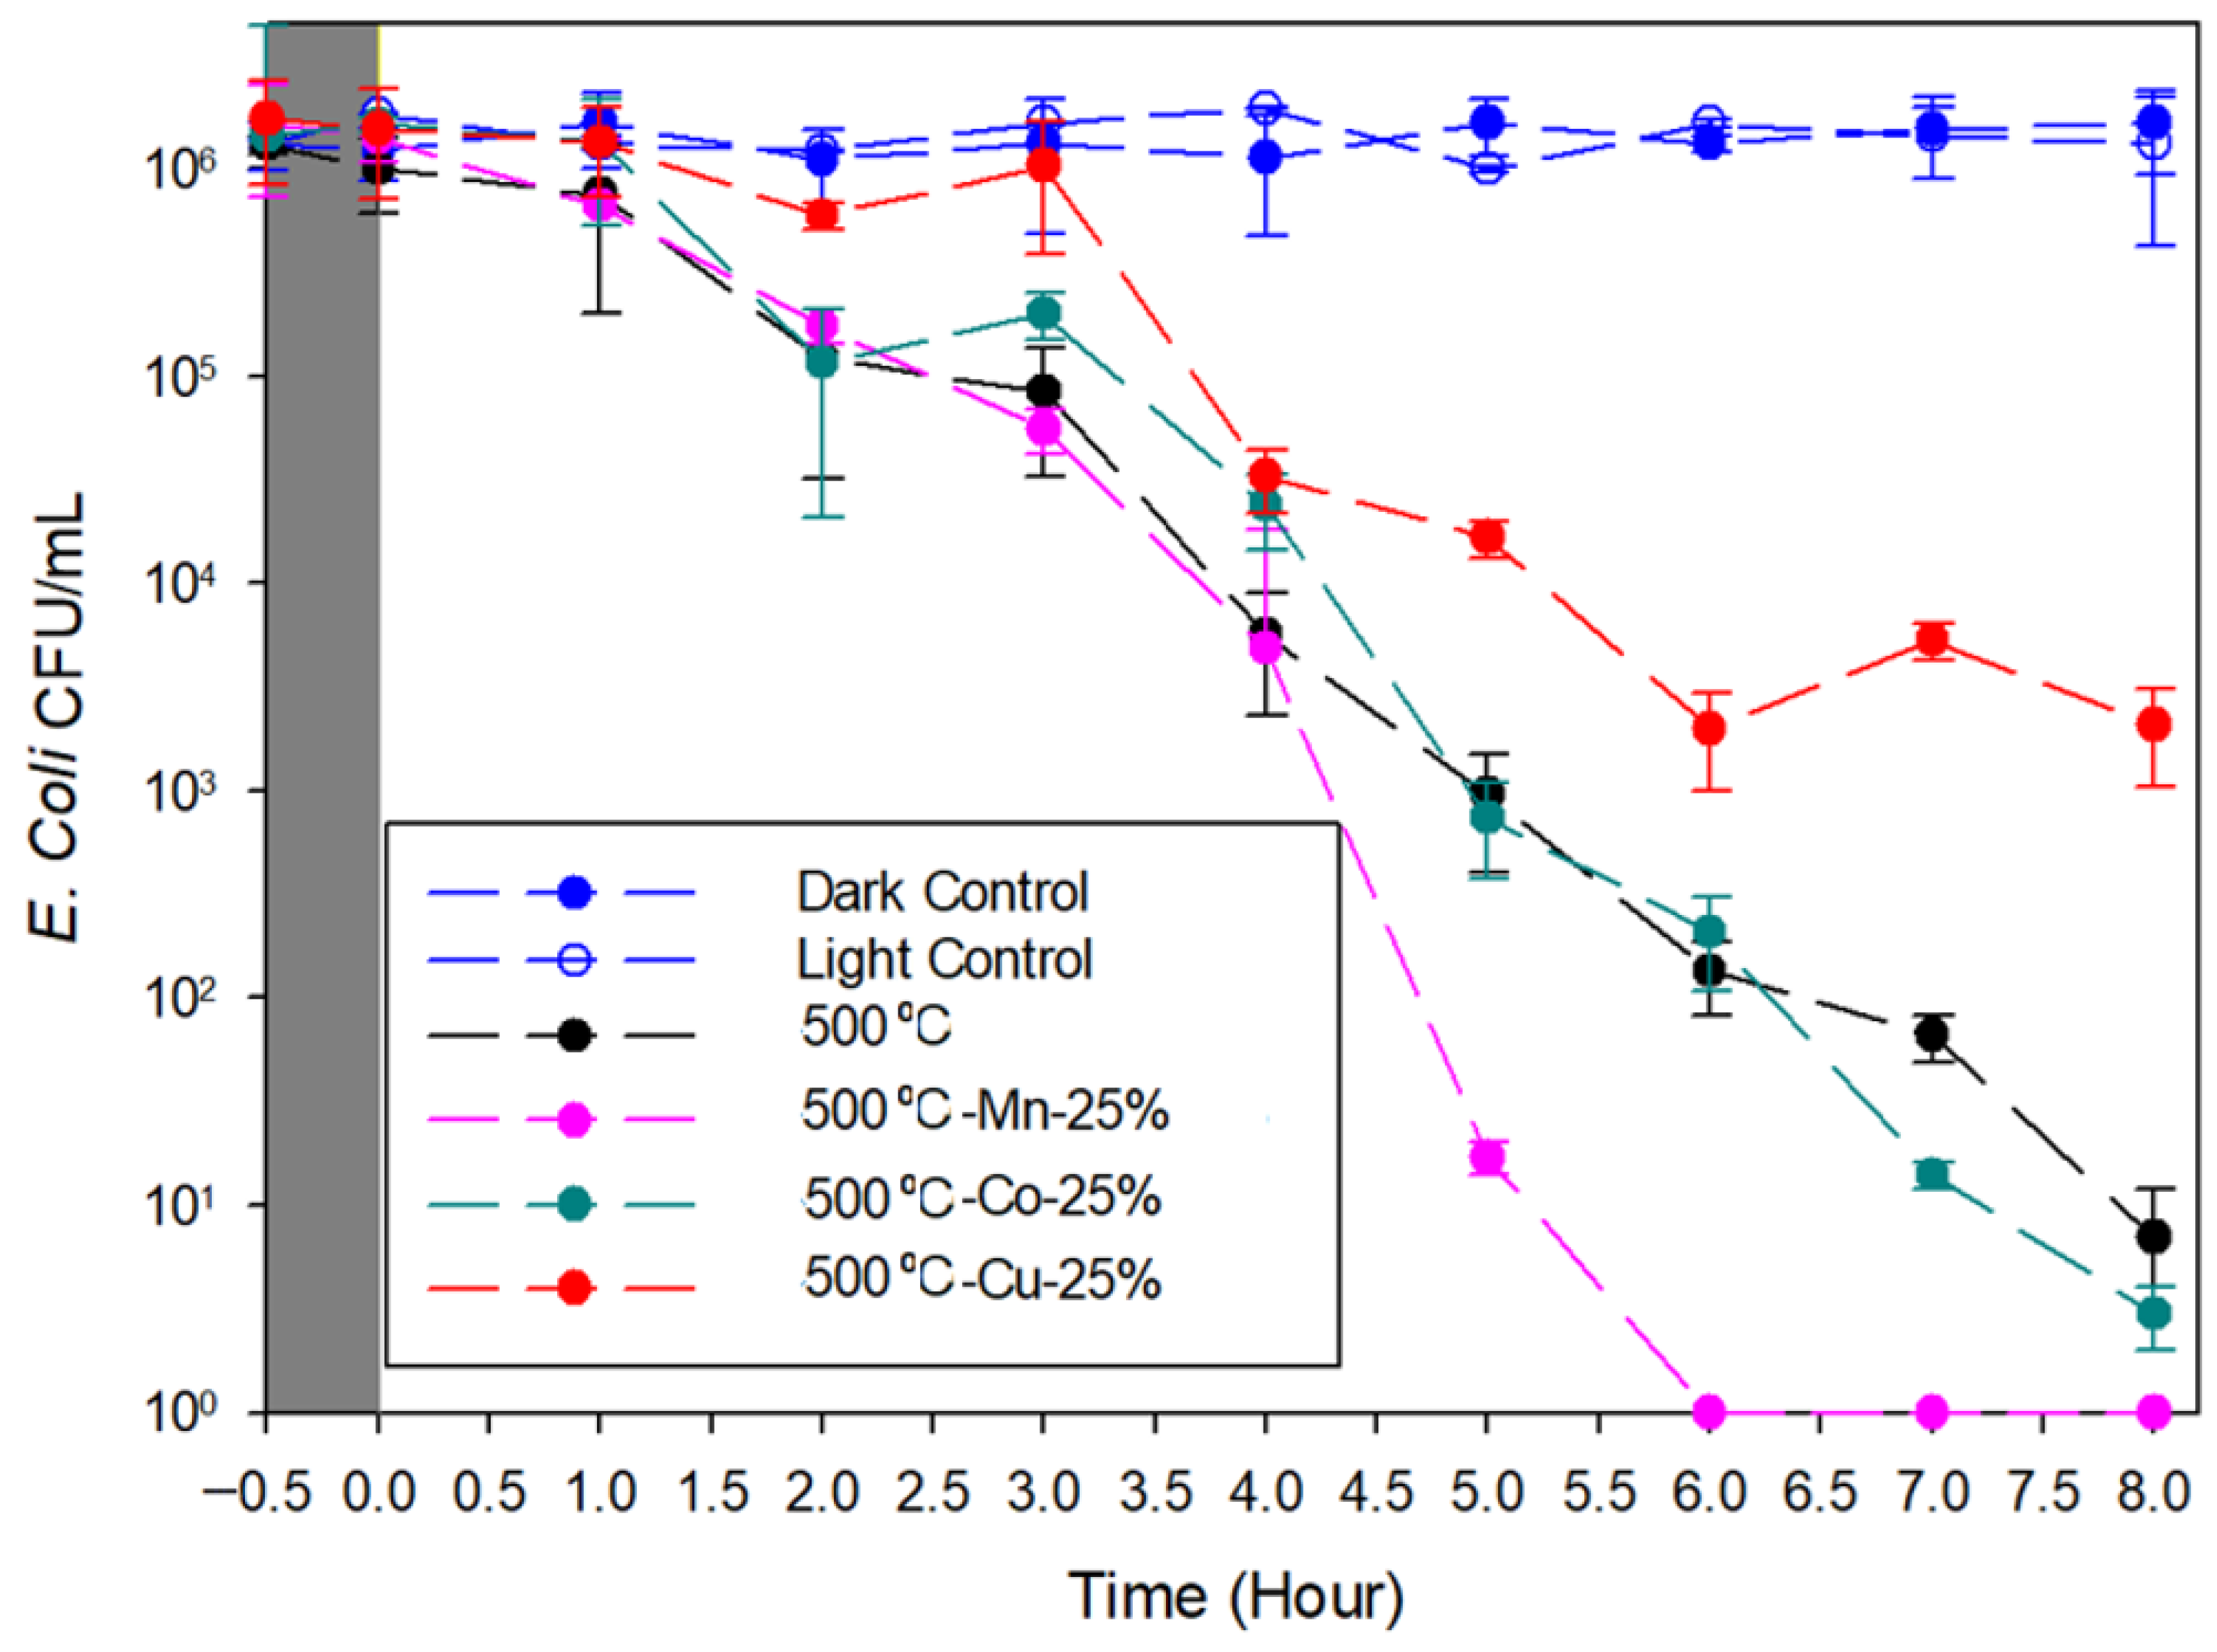
The disinfection profile shown in Figure 10 demonstrates the influence of metal doping on the photocatalytic activity of g-C3N4 synthesized at 500 °C, using Mn, Co, and Cu at 25% molar loading. The light and dark controls for the undoped material (blue circles) show a negligible reduction in the E. coli concentration over the 8 h period. Moreover, Figure S2 shows the same behavior in dark conditions in the presence of the doped materials. These latter results suggest that neither visible light nor the catalyst alone are sufficient for bacterial inactivation. This confirms that the observed disinfection is due to the photoinduced activity of the materials and not directly related to the oligotoxic effect.
The undoped 500 °C sample exhibits notable photocatalytic disinfection, achieving a reduction of over 5 log units in the E. coli concentration after 8 h. This performance agrees with its previously discussed favorable physicochemical properties.
Upon doping with Mn, a dramatic enhancement in photocatalytic performance was observed. The Mn-doped sample (500-Mn-25%) achieved total inactivation of E. coli within 6 h, outperforming all other materials. This improvement can be attributed to the role of Mn species in enhancing charge separation, reducing electron–hole recombination [19,20], and possibly participating in Fenton-like or redox cycling processes that amplify ROS generation [21]. In a previous paper, Wang et al., based on computational modeling, demonstrated the doping g-C3N4 with Mn affects the atomic arrangement and molecular orbital distribution of the g-C3N4 semiconductor, leading to an enhancement in photoinduced carrier separation [22].
The Co-doped sample (500-Co-25%) showed similar performance compared to the undoped catalyst, reaching nearly complete inactivation within 8 h. This result is consistent with the absorption spectra of both materials in the range of light emitted by the UV lamps used (Figure 9). This suggests that under experimental conditions, doping g-C3N4 with Co does not result in a kinetic improvement in the photodisinfection properties of the bare carbon nitride.
In contrast, the Cu-doped sample (500-Cu-25%) showed significantly lower photocatalytic activity. While a moderate reduction in bacterial concentration was observed in the first 3–4 h, the inactivation curve reached a plateau at 6 h, indicating limited further disinfection. This is consistent with the reduced light absorption of the material (Figure 9), which could be due to excessive modification of the pristine organic semiconductor structure induced by the introduction of Cu ions, as indicated by XRD and SEM-EDS analysis.
Overall, the data clearly demonstrate that metal doping has a strong influence on the photocatalytic disinfection performance of g-C3N4. These findings confirm the importance of dopant selection and its effect on charge dynamics. In this sense, several metal-doped g-C3N4 materials have been developed in the literature looking for improved E. coli disinfection (Table 2). Because of key differences such as the reactor type, volume of the reaction, matrix conditions, type of bacterial strain, catalyst charge, etc., a direct comparison among them is not an easy task. Considering the relatively low power used here, the reported efficiency of the developed materials in the current work is promising, which makes them of particular significance for incorporation into self-cleaning surfaces for indoor environments.
Among the tested dopants, Mn provides the most substantial enhancement in antibacterial activity, followed by Co, while Cu appears to suppress the performance of the base material. Thus, 500-Mn-25% was selected as the most efficient material for E. coli disinfection. In the case of heterogenous photocatalysts involving metallic catalysts, the lixiviation of the metal and its consequent contribution to the disinfection process is of special interest. Indeed, manganese is toxic in excess, but it has also been recognized as a critical micronutrient which acts as a cofactor for superoxide dismutase and protects bacteria against oxidative agents [23]. To further investigate this, Mn2+ ions in solution at the end of the treatment were determined by atomic absorption spectroscopy, and a concentration of 12.8 mg L−1 was found. Then, a new set of experiments to test the participation of Mn2+ ions (MnSO4) in E. coli disinfection was carried out, and the results are shown in Figure S3. As seen, no disinfection activity was observed even after 8 h of treatment. This result ruled out the participation of dissolved Mn2+ in the disinfection process.
Table 2. Performance of the different metal-doped g-C3N4 materials in E. coli disinfection.
MaterialPower (W)Initial CFU/mLFinal
CFU/mL
Time (h)References
Mn/g-C3N445 10606.0This work
Co/g-C3N445106100.58.0This work
Cu/g-C3N4451061036.0This work
MoS2/g-C3N410010700.3[24]
Ni/g-C3N42410802.2[25]
AgS2/g-C3N430010701.5[26]
MgTiO3/g-C3N4100010703.0[27]
TiO2/g-C3N430010300.5[28]
AgBr/g-C3N4300106.501.0[29]

2.5. Evaluation of the Metal Type to Enhance the Photocatalytic Disinfection Performance of the 500 °C g-C3N4 Material in Self-Cleaning Surfaces

The disinfection kinetics depicted in Figure 11 illustrate the antibacterial efficacy of self-cleaning surfaces functionalized with sodium-alginate-hydrogel-embedded g-C3N4-based photocatalysts, including pristine and transition metal-doped variants (Mn, Co, Cu). To enable direct comparison with liquid-phase suspended photocatalytic systems, an equivalent initial bacterial concentration of 106 CFU/mL was employed, though this microbial load presents a stringent challenge for solid-phase disinfection platforms due to the inherent physicochemical constraints of hydrogel matrices. The observed elongation of disinfection times in immobilized systems (Figure 11), relative to their suspended counterparts, arises from diffusional limitations imposed by the hydrogel’s crosslinked polymeric network, which limits reactive oxygen species (ROS) mobility and bacterial cell accessibility. Spatial heterogeneity in photocatalyst distribution, coupled with biofilm-like aggregation of E. coli at high cell densities, further exacerbates shielding effects, protecting subsurface cells from ROS-mediated oxidative damage. Additionally, photon flux attenuation within the hydrogel matrix—attributable to light scattering and absorption by the alginate scaffold—reduces the effective irradiation of embedded g-C3N4 active sites, diminishing photocatalytic activation efficiency. These collective factors underscore the critical influence of material architecture on disinfection kinetics, highlighting the need to optimize hydrogel porosity, catalyst dispersion, and optical transparency for applications where microbial loads are typically orders of magnitude lower than the experimental benchmark employed here.
Under visible-light irradiation for 24 h, the surfaces containing Mn-doped, Co-doped, and bare g-C3N4 all achieved a 6-log reduction in E. coli concentration, indicating complete bacterial inactivation. The key difference among these three materials lies in their kinetic response. The Mn-doped surface (500-Mn25%) exhibited the fastest inactivation, reaching more than 4 logs of reduction within 12 h and full disinfection by 24 h. As indicated, this performance enhancement is attributed to the capacity of Mn to promote efficient charge separation and increased ROS generation, likely through redox cycling and band structure modulation.
The Co-doped surface (500-Co25%) also demonstrated excellent antibacterial performance, achieving complete disinfection within the 24 h period, though at a slower rate than the Mn-doped system. This agrees with the suspended disinfection results.
In contrast, the Cu-doped surface (500-Cu25%) showed negligible antibacterial activity, with E. coli concentrations remaining nearly unchanged. This result is consistent with previous suspension-phase tests, where Cu incorporation was found to hinder photocatalytic activity.
The dark and light controls exhibited no significant change in bacterial concentration, confirming that the observed disinfection was exclusively due to photocatalytic processes and not due to thermal effects, photolysis, or passive adsorption by the hydrogel matrix.
Overall, the results confirm that g-C3N4 materials synthesized at 500 °C can be successfully integrated into alginate-based hydrogels to form functional self-cleaning surfaces with excellent photocatalytic disinfection capabilities. Among the tested dopants, Mn provides the fastest antibacterial response, followed by Co, while Cu fails to improve or maintain photocatalytic activity in the immobilized system.

3. Materials and Methods

3.1. Reagents

Urea (97% w/w), copper (II) sulfate (CuSO4), cobalt (II) sulfate hydrate (CoSO4.H2O), and manganese (II) sulfate hydrate (MnSO4.H2O), all with a purity of 97% w/w, and ammonium hydroxide (NH4OH), 30% v/v, were provided by Sigma Aldrich, Louis, MO, USA. Type I water was obtained from a Synergy® water purification system (18 MΩ).

3.2. g-C3N4 Synthesis

In all cases, 10 g of urea was placed in porcelain crucibles covered with a lid and with aluminum foil. The system was heated from 25 °C using a heating ramp of 1.6 °C min−1 to the corresponding temperature and maintained for 3 h. The obtained powders were resuspended 3 times in 100 mL H2O to remove any soluble impurity. The material was labeled with the temperature used in the synthesis. For instance, 500 is g-C3N4 pyrolyzed at 500 °C.

3.3. g-C3N4–Metal Composite Synthesis

For the synthesis, 2 g of graphitic carbon nitride (g-C3N4) was suspended in 150 mL of water under constant mechanical stirring for 30 min. Subsequently, a specific mass of the selected metal chloride precursor (Mn, Co, or Cu) was added. The metal precursor quantities correspond to 0.573 mmol per gram of g-C3N4.
Following the precursor’s addition, the system was kept under continuous magnetic stirring for two hours to ensure equilibrium in the adsorption–desorption process. Afterward, 10 mL of NH4OH (25% v/v) was added to the mixture. The obtained material was centrifuged and washed three times with distilled water, then dried at 80 °C for 24 h.
The resulting dried powder was subsequently calcined at 450 °C for 4 h. The calcined powders exhibited distinct coloration compared to the pristine graphitic carbon nitride precursor. The materials were purified by resuspension three times in water and ultrasonicated three times and then dried at 80 °C.
Figure 12 represents the synthesis procedure for obtaining the metal-doped composites.

3.4. Preparation of g-C3N4-Based Self-Cleaning Surfaces

A modified version of a previously reported protocol was employed [30]. Briefly, 1.2 g of sodium alginate was dissolved in preheated water at 90 °C under continuous stirring for 2 h. Simultaneously, 0.3 g of the selected g-C3N4 was dispersed in 20 mL of water and subjected to ultrasonication for 15 min before being incorporated into the alginate solution. The resulting mixture was stirred (300 rpm) at 25 °C for 24 h. Subsequently, 20 mL of the prepared suspension was transferred into a 10 cm diameter Petri dish and left undisturbed at 25 °C for 36 h.

3.5. E. coli Disinfection Tests

Disinfection experiments were conducted using an Escherichia coli strain (E. coli ATCC 8739) in a 0.8% saline solution. The irradiation source consisted of eight LED lamps with visible irradiation with a total power of 45 W. The corresponding irradiance spectrum is shown in Figure S1. E. coli was activated 24 h before disinfection, having undergone a cultivation process to ensure a bacterial population in the stationary phase. Following activation, the concentration was adjusted to 1.5 × 10⁸ CFU/mL based on the 0.5 McFarland scale, equivalent to an absorbance range of 0.08 to 0.13 at 650 nm.
The experiments were performed in duplicate, utilizing 50 mL flasks. In each flask, 10 mL of saline solution (0.8% wt) containing 5 mg of the respective material was subject-ed to 30 min of ultrasound action (50 kHz and 50 W/L). Subsequently, 100 μL of the McFarland bacterial suspension was added, resulting in an initial concentration of 1.5 × 10⁶ CFU/mL. The systems were placed on an orbital shaker operating at 150 rpm. Samples of 100 μL were extracted at 60 min intervals, except for the first 30 min.
For the final step, samples collected at the selected times were diluted to a 10−4 or 10−3 concentration and placed on agar plates for incubation at 37 °C during 24 h, prior to the counting of the growing colonies.
Another set of experiments was performed using self-cleaning surfaces (vide infra). For this purpose, the previous method was modified. In total, 10 mL of saline solution containing 1.5 × 10⁶ CFU/mL was deposited onto a Petri dish containing the g-C3N4-based surface. The system was then introduced into an incubator at 37 °C for 45 min to promote solvent evaporation. Then, the Petri dish was irradiated, as previously discussed. The recovery of the E. coli from the surface was conducted with two steps of 10 mL of saline solution, which was further diluted and treated, as indicated previously.

3.6. Material Characterization

UV/Vis spectroscopy of the materials was conducted to identify characteristic absorption bands associated with metallic and organic moieties. Measurements were performed using a PerkinElmer Lambda 25 UV/Vis spectrophotometer manufactured by PerkinElmer (Hopkinton, MA, USA), equipped with a BaSO4 integrating sphere, operating in the 200–800 nm wavelength range. For the analysis, 2 mL of a 100 ppm aqueous suspension of each material was placed in a quartz cell with an optical path length of 1 cm.
The bandgap energy of the materials was determined using a Tauc plot derived from the UV/Vis spectra, following Equation (3):
( α h ν ) n   =   A ( h ν     E B G )
where α represents the absorption coefficient, h is Planck’s constant, ν is the photon frequency, and n is the exponent defining the type of electronic transition. A is a proportionality constant, and EBG corresponds to the bandgap energy. The EBG value was estimated by extrapolating the linear region of the (αhν)n vs. hν plot.
The functional groups on the material surfaces were characterized using infrared (IR) spectroscopy with a Fourier transform infrared spectrophotometer (FTIR), model IRTracer-100 from Shimadzu (Beijing, China). The measurements were performed in the 4000–550 cm−1 range with a resolution of 4 cm−1. The analysis was conducted using an attenuated total reflectance (ATR) crystal, allowing direct measurement of the samples without the need for additional preparation.
Electrochemical characterization of the materials was carried out following the protocol previously reported [18]. The materials were supported over Fluorine-doped Tin Oxide (FTO). The measurements were conducted using a PalmSens4 Electrochemical interface provided by PalmSens BV (Houten, The Netherlands) and the corresponding software PSTrace 5.9.415.
The surface structure was investigated through scanning electron microscopy (SEM) utilizing a JEOL JSM-6490LV model manufactured by JEOL (Akishima, Tokyo, Japan). Furthermore, an energy-dispersive spectrometer (EDS) was integrated with SEM to ascertain the elemental composition.
The confirmation of the crystalline phase of selected samples was conducted using the X-ray diffraction (XRD) technique in a PANalytical Empyrean X-ray 2012 powder diffractometer (manufactured by Malvern Panalytical (Almelo, The Netherlands)), operated in reflection transmission spinner geometry with Cu-Kα radiation at 40 mA and 45 kV and in the reflection mode between 10 and 90° (2θ angle).
To evidence Mn leaching, atomic absorption spectroscopy was used. The final bacterial suspension and particles were centrifuged and then acidified with 1 mL of HNO3 [31].

4. Conclusions

In this study, g-C3N4 photocatalysts were successfully synthesized at different temperatures and systematically characterized to identify the optimal conditions for photocatalytic disinfection. Comprehensive structural, optical, electronic, and electrochemical analyses revealed that materials synthesized at 450–550 °C maintained favorable properties, with the 500 °C sample demonstrating the best balance between band structure, charge transport, and ROS generation capacity. Photocatalytic disinfection tests against E. coli confirmed that the 500 °C material exhibited the most rapid bacterial inactivation kinetics in aqueous suspension, leading to its selection for further modification via metal doping.
Doping the 500 °C g-C3N4 with transition metals (Mn, Co, Cu) revealed that Mn significantly enhanced the photocatalytic performance, while Cu doping hindered activity. Mn doping led to the most rapid inactivation kinetics.
The selected materials were then integrated into sodium alginate matrices to fabricate self-cleaning surfaces. These surfaces retained photocatalytic activity under visible light and achieved complete E. coli inactivation (6-log reduction) within 24 h. Among them, the Mn-doped g-C3N4 surface displayed the fastest response, achieving near-total disinfection within just 12 h, followed by the Co-doped and undoped surfaces. The Cu-doped material showed negligible activity in its immobilized form, which was consistent with its poor performance in suspension.
Overall, this work demonstrates the successful development of metal-doped g-C3N4-based self-cleaning surfaces with enhanced disinfection kinetics under visible light. The Mn-modified materials, especially in hydrogel form, offer a promising strategy for practical antimicrobial applications where rapid photocatalytic response is essential.

Supplementary Materials

The following supporting information can be downloaded at https://www.mdpi.com/article/10.3390/inorganics13080262/s1: Figure S1: Irradiance spectrum of the used LEDs. Figure S2. E. coli disinfection kinetic profiles promoted by g-C 3 N 4 obtained at 500 °C doped with 25% of the corresponding metal under dark conditions. Conditions: 10 mL of solution and 5 mg of the corresponding material. The error bars represent the standard deviation from duplicate treatments (n = 2) and Figure S3. E. coli disinfection kinetic profiles in presence of soluble Mn 2+ (12.8 mg/L) and under irradiation of indoor light. The error bars represent the standard deviation from duplicate treatments (n = 2).

Author Contributions

D.F.M.: conceptualization, methodology, software, validation, formal analysis, investigation, data curation, writing—original draft preparation, writing—review and editing, and visualization. I.C.O.B.: methodology, analysis, investigation, and data curation. G.C.V.: resources, supervision, and funding acquisition. R.A.T.-P.: conceptualization, methodology, investigation, writing—review and editing, visualization, supervision, project administration, and funding acquisition. All authors have read and agreed to the published version of the manuscript.

Funding

This research was funded by Sistema General de Regalias, grant number BPIN 2020000100587, entitled “Desarrollo de superficies autodesinfectantes basados en materiales con actividad fotoquímica y magnética. Valle de Aburrá Antioquia”.

Institutional Review Board Statement

Not applicable.

Informed Consent Statement

Not applicable.

Data Availability Statement

The original contributions presented in this study are included in the article/Supplementary Material. Further inquiries can be directed to the corresponding authors.

Acknowledgments

This undertaking was executed by the Universidad de Antioquia and secured financial backing from the Colombian “Sistema General de Regalias” through the “Convocatoria del Fondo de Ciencia, Tecnología e Innovación del Sistema General de Regalías para la Conformación de un Listado de Propuestas de Proyectos Elegibles encaminadas a la Formación de Capital Humano de Alto Nivel para las Regiones”—MinCiencias.

Conflicts of Interest

The authors declare no conflicts of interest. The funders had no role in the design of the study; in the collection, analyses, or interpretation of data; in the writing of the manuscript; or in the decision to publish the results.

References

  1. Flemming, H.-C.; Wingender, J.; Szewzyk, U.; Steinberg, P.; Rice, S.A.; Kjelleberg, S. Biofilms: An Emergent Form of Bacterial Life. Nat. Rev. Microbiol. 2016, 14, 563–575. [Google Scholar] [CrossRef]
  2. Ubaldi, F.; Valeriani, F.; Volpini, V.; Lofrano, G.; Spica, V.R. Antimicrobial Activity of Photocatalytic Coatings on Surfaces: A Systematic Review and Meta-Analysis. Coatings 2024, 14, 92. [Google Scholar] [CrossRef]
  3. Fujishima, A.; Zhang, X.; Tryk, D.A. TiO2 Photocatalysis and Related Surface Phenomena. Surf. Sci. Rep. 2008, 63, 515–582. [Google Scholar] [CrossRef]
  4. Xia, D.; Liu, H.; Jiang, Z.; Ng, T.W.; Lai, W.S.; An, T.; Wang, W.; Wong, P.K. Visible-Light-Driven Photocatalytic Inactivation of Escherichia coli K-12 over Thermal Treated Natural Magnetic Sphalerite: Band Structure Analysis and Toxicity Evaluation. Appl. Catal. B 2018, 224, 541–552. [Google Scholar] [CrossRef]
  5. Rengifo-Herrera, J.A.; Pulgarin, C. Why Five Decades of Massive Research on Heterogeneous Photocatalysis, Especially on TiO2, Has Not yet Driven to Water Disinfection and Detoxification Applications? Critical Review of Drawbacks and Challenges. Chem. Eng. J. 2023, 477, 146875. [Google Scholar] [CrossRef]
  6. Ong, W.-J.; Tan, L.-L.; Ng, Y.H.; Yong, S.-T.; Chai, S.-P. Graphitic Carbon Nitride (g-C3N4)-Based Photocatalysts for Artificial Photosynthesis and Environmental Remediation: Are We a Step Closer To Achieving Sustainability? Chem. Rev. 2016, 116, 7159–7329. [Google Scholar] [CrossRef]
  7. Mangiri, R.; Subramanyam, K.; Lee, J.; Lee, M.K.; Lee, C.; Khan, M.S.; Roy, N.; Joo, S.W.; Chung, E. Self-Assembled Flower-like ZnIn2S4 Coupled with g-C3N4@ZIF-67 Heterojunction for Improved Photocatalytic Hydrogen Performance. Surf. Interfaces 2024, 49, 104401. [Google Scholar] [CrossRef]
  8. Safari, F.; Poursalehi, R.; Delavari, H. Urea-Driven g-C3N4 Nanostructures for Highly Efficient Photoreduction of Cr(vi) under Visible LED Light: Effects of Calcination Temperature. RSC Adv. 2024, 14, 26943–26953. [Google Scholar] [CrossRef] [PubMed]
  9. Kalidasan, K.; Mallapur, S.; Munirathnam, K.; Nagarajaiah, H.; Reddy, M.B.M.; Kakarla, R.R.; Raghu, A.V. Transition Metals-Doped g-C3N4 Nanostructures as Advanced Photocatalysts for Energy and Environmental Applications. Chemosphere 2024, 352, 141354. [Google Scholar] [CrossRef] [PubMed]
  10. Zhu, D.; Liu, S.; Chen, M.; Zhang, J.; Wang, X. Flower-like-Flake Fe3O4/g-C3N4 Nanocomposite: Facile Synthesis, Characterization, and Enhanced Photocatalytic Performance. Colloids Surf. A Physicochem. Eng. Asp. 2018, 537, 372–382. [Google Scholar] [CrossRef]
  11. Zhang, H.; Jia, L.; Wu, P.; Xu, R.; He, J.; Jiang, W. Improved H2O2 Photogeneration by KOH-Doped g-C3N4 under Visible Light Irradiation Due to Synergistic Effect of N Defects and K Modification. Appl. Surf. Sci. 2020, 527, 146584. [Google Scholar] [CrossRef]
  12. Zhou, Y.; Zhang, L.; Huang, W.; Kong, Q.; Fan, X.; Wang, M.; Shi, J. N-Doped Graphitic Carbon-Incorporated g-C3N4 for Remarkably Enhanced Photocatalytic H2 Evolution under Visible Light. Carbon 2016, 99, 111–117. [Google Scholar] [CrossRef]
  13. Tauc, J. Optical properties and electronic structure of amorphous Ge and Si. Mater. Res. Bull. 1968, 3, 37–46. [Google Scholar] [CrossRef]
  14. Maarisetty, D.; Baral, S.S. Defect Engineering in Photocatalysis: Formation, Chemistry, Optoelectronics, and Interface Studies. J. Mater. Chem. A Mater. 2020, 8, 18560–18604. [Google Scholar] [CrossRef]
  15. Bisquert, J. Theory of the Impedance of Electron Diffusion and Recombination in a Thin Layer. J. Phys. Chem. B 2002, 106, 325–333. [Google Scholar] [CrossRef]
  16. Xu, L.; Li, L.; Yu, L.; Yu, J.C. Efficient Generation of Singlet Oxygen on Modified G-C3N4 Photocatalyst for Preferential Oxidation of Targeted Organic Pollutants. Chem. Eng. J. 2022, 431, 134241. [Google Scholar] [CrossRef]
  17. Yue, X.; Yi, S.; Wang, R.; Zhang, Z.; Qiu, S. Cadmium Sulfide and Nickel Synergetic Co-Catalysts Supported on Graphitic Carbon Nitride for Visible-Light-Driven Photocatalytic Hydrogen Evolution. Sci. Rep. 2016, 6, 22268. [Google Scholar] [CrossRef]
  18. Monje, D.S.; Mercado, D.F.; Ortega-Bedoya, I.C.; Valencia, G.C.; Amaya-Roncancio, S.; Torres-Ceron, D.A.; Vargas, R.; Restrepo-Parra, E.; Torres-Palma, R.A. Addition of Fe3O4 on Carbon Nitride Moves the ROS Formation from HO Radicals to Singlet Oxygen Leading to an Enhanced and Selective Disinfecting Action. ACS Omega, 2025; accepted. [Google Scholar]
  19. Javed, M.; Khalid, W.B.; Iqbal, S.; Qamar, M.A.; Alrbyawi, H.; Awwad, N.S.; Ibrahium, H.A.; Al-Anazy, M.M.; Elkaeed, E.B.; Pashameah, R.A.; et al. Integration of Mn-ZnFe2O4 with S-g-C3N4 for Boosting Spatial Charge Generation and Separation as an Efficient Photocatalyst. Molecules 2022, 27, 6925. [Google Scholar] [CrossRef]
  20. Li, A.; Wang, T.; Chang, X.; Cai, W.; Zhang, P.; Zhang, J.; Gong, J. Spatial Separation of Oxidation and Reduction Co-Catalysts for Efficient Charge Separation: Pt@TiO2@MnOx Hollow Spheres for Photocatalytic Reactions. Chem. Sci. 2016, 7, 890–895. [Google Scholar] [CrossRef] [PubMed]
  21. Zheng, J.; Lim, H.J.; Hedtke, T.; Kim, J.H.; Zhang, S. Manganese oxide for heterogeneous Fenton treatment: Catalyst or inhibitor? Appl. Catal. B 2024, 359, 124531. [Google Scholar] [CrossRef]
  22. Wang, J.C.; Cui, C.X.; Li, Y.; Liu, L.; Zhang, Y.P.; Shi, W. Porous Mn Doped G-C3N4 Photocatalysts for Enhanced Synergetic Degradation under Visible-Light Illumination. J. Hazard. Mater. 2017, 339, 43–53. [Google Scholar] [CrossRef]
  23. Waters, L.S.; Sandoval, M.; Storz, G. The Escherichia Coli MntR Miniregulon Includes Genes Encoding a Small Protein and an Efflux Pump Required for Manganese Homeostasis. J. Bacteriol. 2011, 193, 5887–5897. [Google Scholar] [CrossRef]
  24. Li, P.; Zhai, Y.; Liu, J.; Dai, Y.; Li, D.; Zhang, S. Rapid Inactivation of Bacteria by MoS2/g-C3N4 Nanohybrid Structures Driven by Visible Light. Sci. Rep. 2025, 15, 9266. [Google Scholar] [CrossRef]
  25. Parasuraman, V.; Sekar, P.P.; Akter, S.M.; Lee, W.R.; Park, T.Y.; Kim, C.G.; Kim, S. Improved Photocatalytic Disinfection of Dual Oxidation State (Dos)-Ni/g–C3N4 under Indoor Daylight. J. Photochem. Photobiol. A Chem. 2023, 434, 114262. [Google Scholar] [CrossRef]
  26. Zuo, W.; Liang, L.; Ye, F.; Zhao, S. Construction of Visible Light Driven Silver Sulfide/Graphitic Carbon Nitride p-n Heterojunction for Improving Photocatalytic Disinfection. Chemosphere 2021, 283, 131167. [Google Scholar] [CrossRef]
  27. Jiang, Z.; Wang, B.; Li, Y.; Chan, H.S.; Sun, H.; Wang, T.; Li, H.; Yuan, S.; Leung, M.K.H.; Lu, A.; et al. Solar-Light-Driven Rapid Water Disinfection by Ultrathin Magnesium Titanate/Carbon Nitride Hybrid Photocatalyst: Band Structure Analysis and Role of Reactive Oxygen Species. Appl. Catal. B 2019, 257, 117898. [Google Scholar] [CrossRef]
  28. Liu, Y.; Zeng, X.; Hu, X.; Hu, J.; Wang, Z.; Yin, Y.; Sun, C.; Zhang, X. Two-Dimensional g-C3N4/TiO2 Nanocomposites as Vertical Z-Scheme Heterojunction for Improved Photocatalytic Water Disinfection. Catal. Today 2019, 335, 243–251. [Google Scholar] [CrossRef]
  29. Deng, J.; Liang, J.; Li, M.; Tong, M. Enhanced Visible-Light-Driven Photocatalytic Bacteria Disinfection by g-C3N4-AgBr. Colloids Surf. B Biointerfaces 2017, 152, 49–57. [Google Scholar] [CrossRef]
  30. Shi, Y.; Jiang, S.; Zhou, K.; Bao, C.; Yu, B.; Qian, X.; Wang, B.; Hong, N.; Wen, P.; Gui, Z.; et al. Influence of G-C3N4 Nanosheets on Thermal Stability and Mechanical Properties of Biopolymer Electrolyte Nanocomposite Films: A Novel Investigation. ACS Appl. Mater. Interfaces 2014, 6, 429–437. [Google Scholar] [CrossRef]
  31. Monje, D.S.; Ruiz, O.S.; Valencia, G.C.; Mercado, D.F. Iron Oxide Nanoparticles Embedded in Organic Microparticles from Yerba Mate Useful for Remediation of Textile Wastewater through a Photo-Fenton Treatment: Ilex Paraguariensis as a Platform of Environmental Interest—Part 1. Environ. Sci. Pollut. Res. 2022, 29, 57127–57146. [Google Scholar] [CrossRef]
Figure 1. FTIR spectra for g-C3N4 synthesized at different temperatures.
Inorganics 13 00262 g001
Figure 2. UV/Vis spectra for g-C3N4 synthesized at different temperatures.
Inorganics 13 00262 g002
Figure 3. Tauc plots and bandgap energies of g-C3N4 synthesized at (a) 450 °C, (b) 500 °C, (c) 550 °C and (d) 600 °C.
Inorganics 13 00262 g003
Figure 4. (a) Nyquist plot obtained at −0.3 V vs. Ag/AgCl electrode of all bare g-C3N4 materials. (b) Equivalent electric circuit fitted for the Nyquist plots.
Inorganics 13 00262 g004
Figure 5. Mott–Schottky plots representing the Ag/AgCl of the g-C3N4 synthesized at (a) 450 °C, (b) 500 °C, (c) 550 °C and (d) 600 °C.
Inorganics 13 00262 g005
Figure 6. Redox potentials (E vs. NHE at pH 7.0) for selected reactions are graphically represented with the conduction and valence bands for all bare g-C3N4 materials.
Inorganics 13 00262 g006
Figure 7. Kinetic profiles of E. coli disinfection promoted by g-C3N4 obtained at different temperatures under irradiation of indoor light. Conditions: 10 mL and 5 mg of the corresponding material. The error bars represent the standard deviation from duplicate treatments (n = 2). The dark region denotes the time in which the LEDs were turned off.
Inorganics 13 00262 g007
Figure 8. Selected SEM micrographs of the (a) undoped 500 °C, (b) 500-Co-25%, (c) 500-Cu-25%, and (d) 500-Mn-25% samples.
Inorganics 13 00262 g008
Figure 9. (a) X-ray diffractograms for the synthesized materials at 500 °C. (b) Magnification of 500-Mn-25% and 500-Co-25%. (c) UV/Vis spectra of the synthesized materials at 500 °C.
Inorganics 13 00262 g009
Figure 10. Kinetic profiles of E. coli disinfection promoted by g-C3N4 obtained at 500 °C doped with 25% of the metal under irradiation of indoor light. The dark profile shown corresponds to the absence of any material. Conditions: 10 mL and 5 mg of the corresponding material. The error bars represent the standard deviation from duplicate treatments (n = 2). The dark region denotes the time in which the LEDs were turned off.
Inorganics 13 00262 g010
Figure 11. Kinetic profiles of E. coli disinfection promoted by g-C3N4 doped with 25% of the corresponding metal-based surfaces under irradiation of indoor light. Conditions: 10 mL of bacterial suspension and 10 cm diameter. The error bars represent the standard deviation from duplicate treatments (n = 2).
Inorganics 13 00262 g011
Figure 12. Schematic representation of the synthesis route of the metal-doped composites.
Inorganics 13 00262 g012
Table 1. Summary of the characterization of the materials synthesized. EBG: bandgap energy calculated from Tauc plots. λExc,max: maximum excitation wavelength obtained from Tauc plot [13]. Electric resistance and ECB (conduction band) and EVB (valence band) potential were obtained from the electrochemical characterization.
MaterialEBG (eV)λExc,max
(nm)
Electric Resistance (kΩ)ECB (V) vs. NHEEVB (V) vs. NHE
450 °C2.754511.9−0.4712.279
500 °C2.664661.1−0.3772.283
550 °C2.894292.3−0.3052.585
600 °C3.303751.1−0.3552.945
Disclaimer/Publisher’s Note: The statements, opinions and data contained in all publications are solely those of the individual author(s) and contributor(s) and not of MDPI and/or the editor(s). MDPI and/or the editor(s) disclaim responsibility for any injury to people or property resulting from any ideas, methods, instructions or products referred to in the content.