
Synthesis of Physically Activated Carbons from Vitellaria paradoxa Shells for Supercapacitor Electrode Applications

 , , , , and
Abstract
1. Introduction
2. Results and Discussion
2.1. Material Characterization
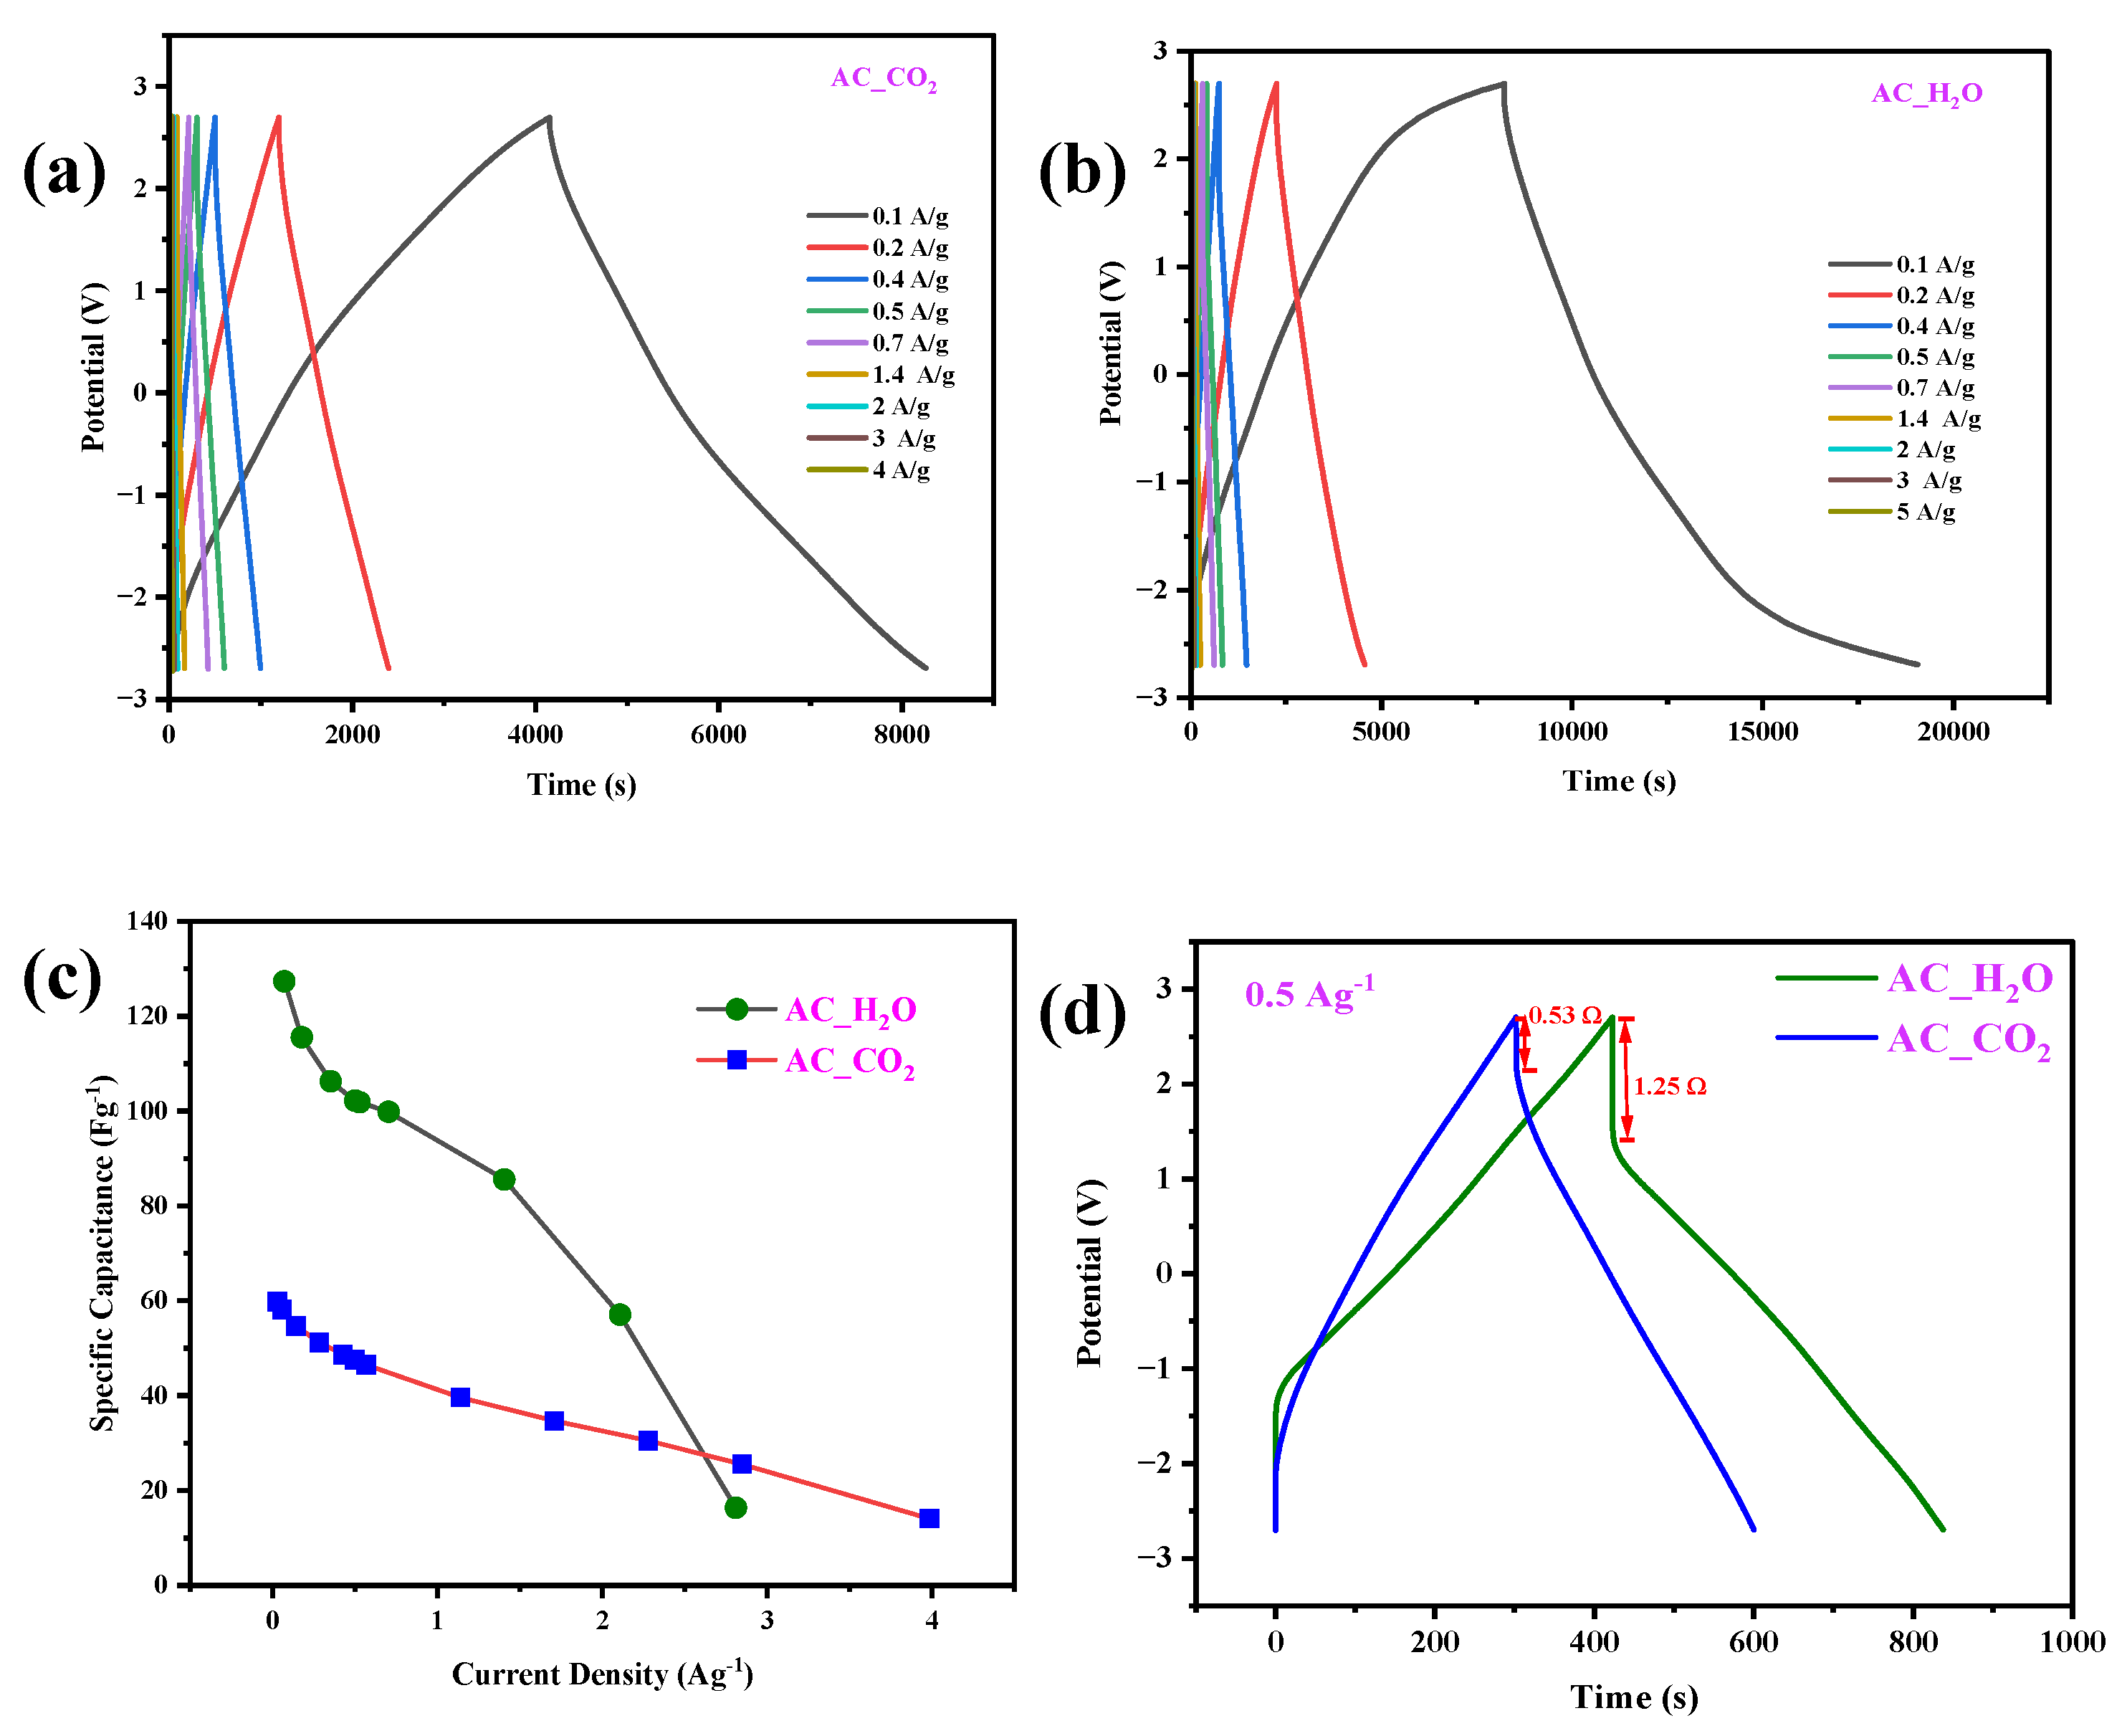
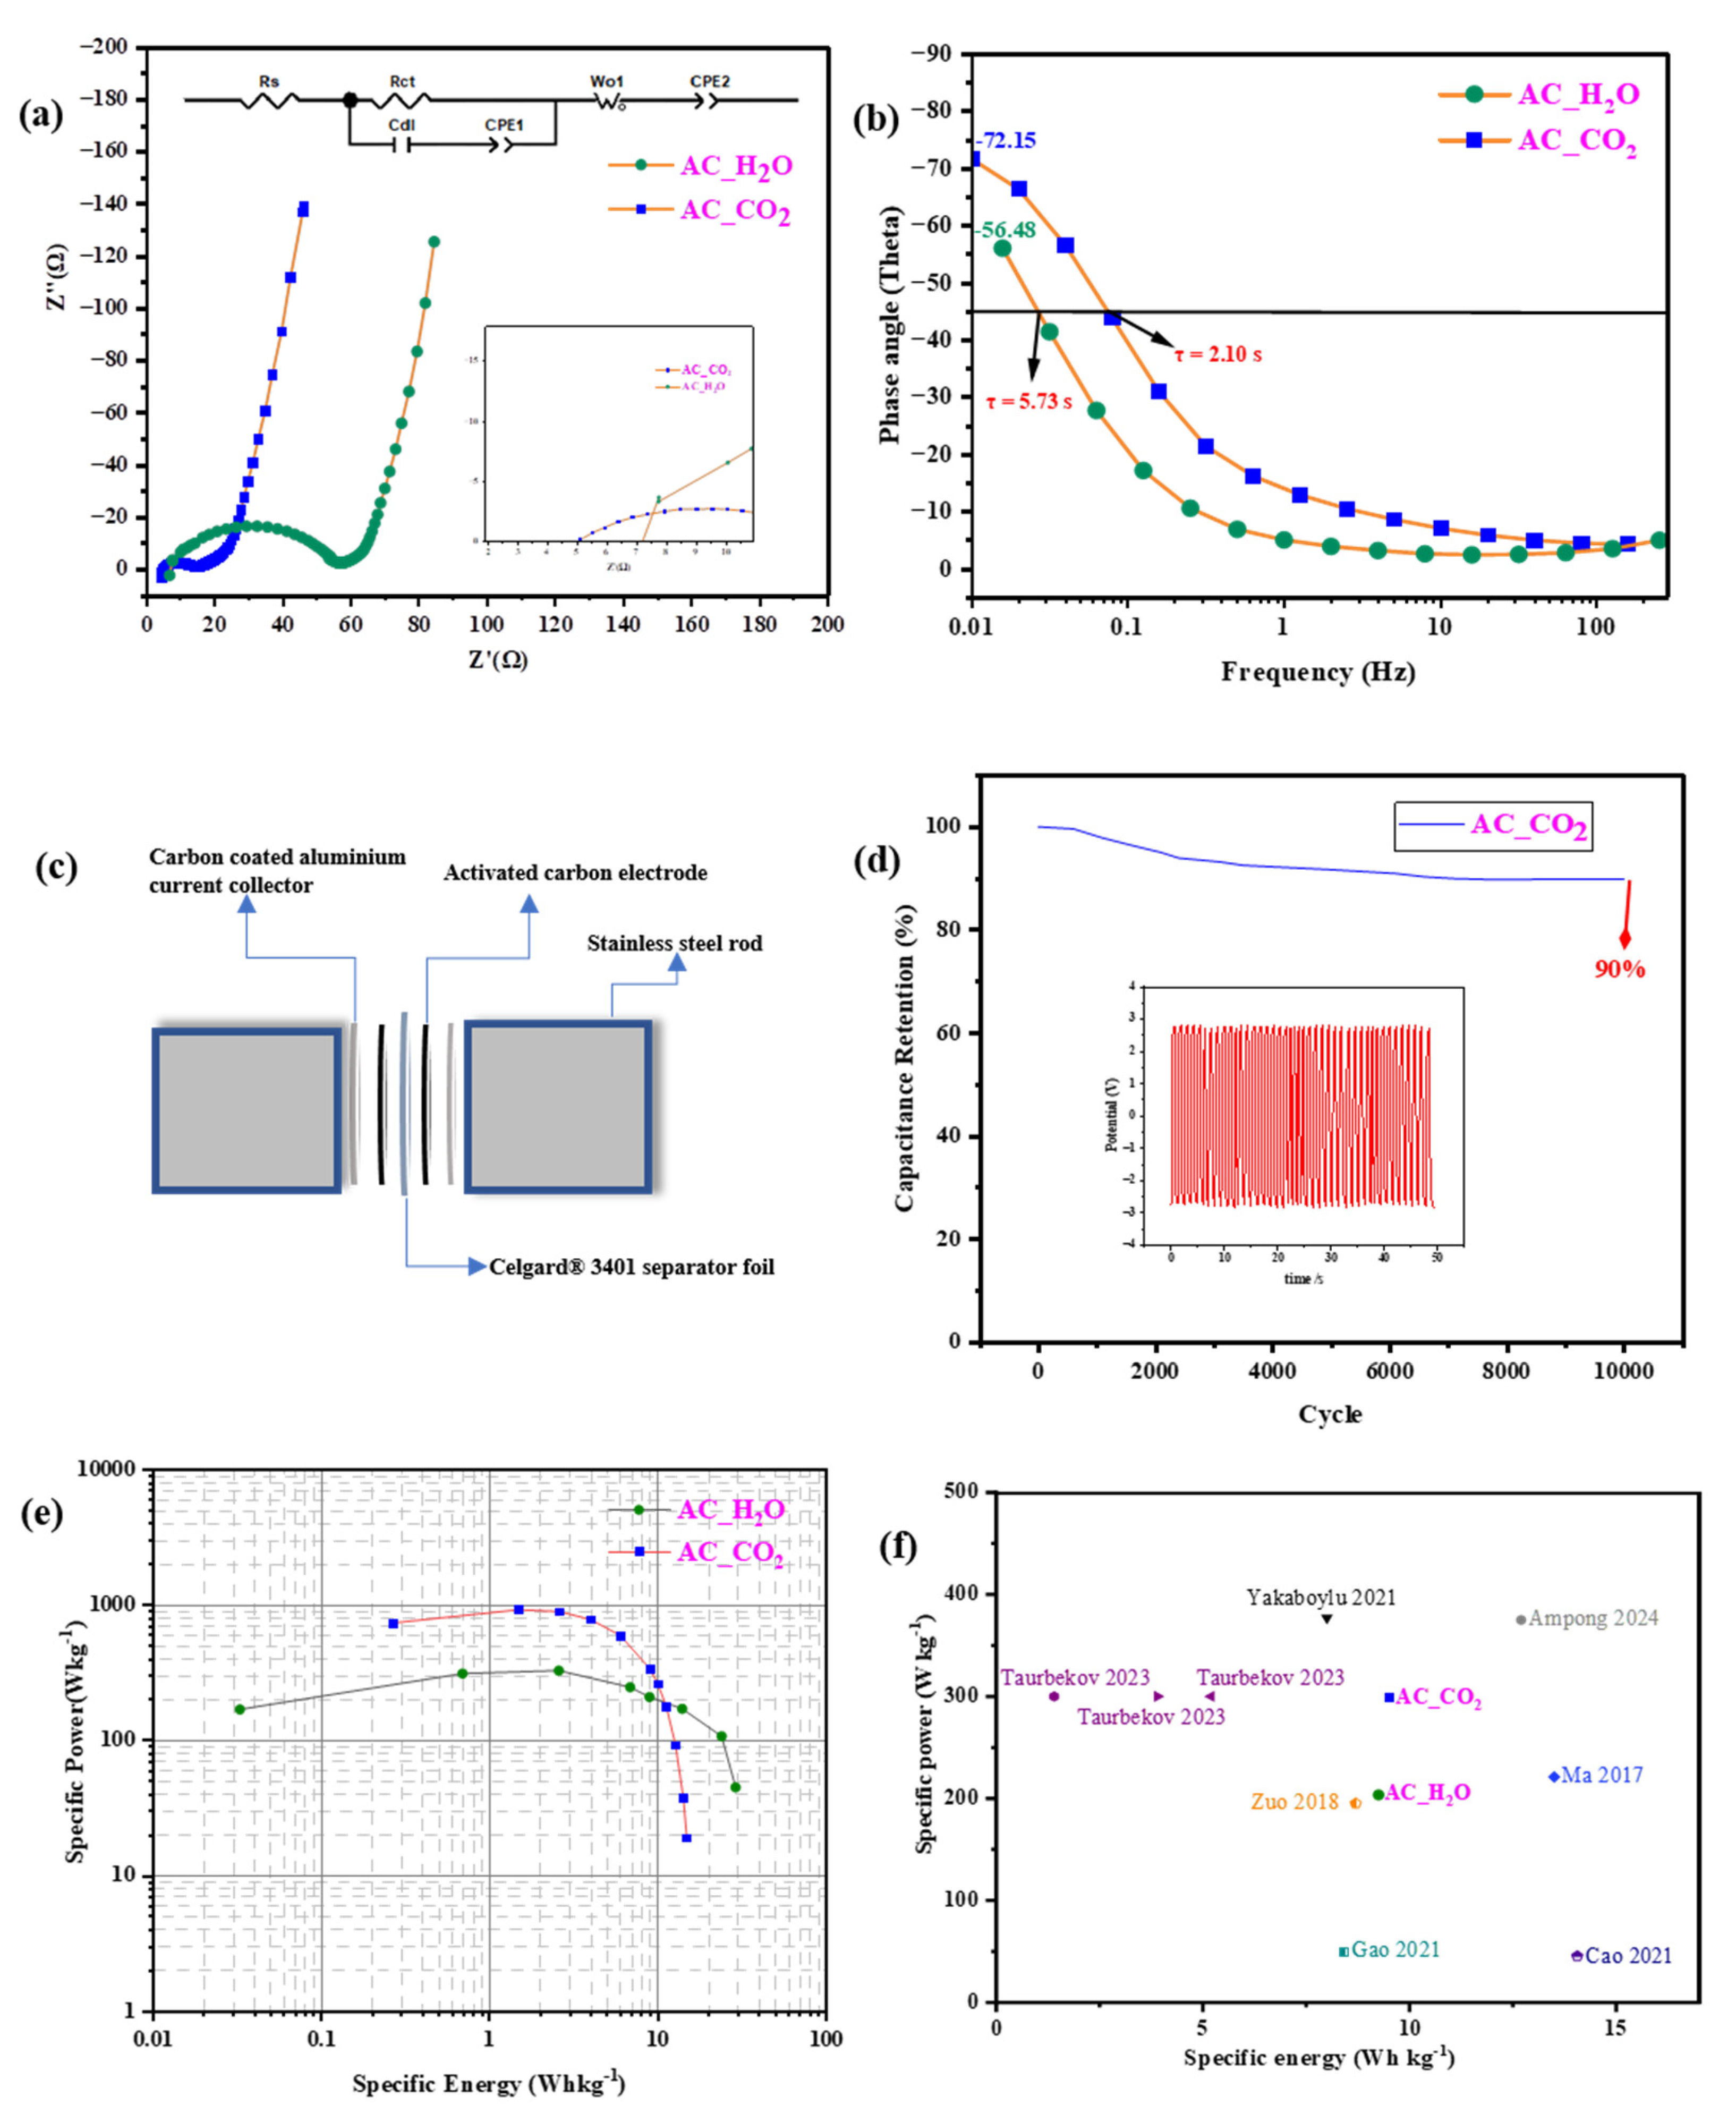
2.2. Electrochemical Characterization
3. Materials and Methods
3.1. Materials
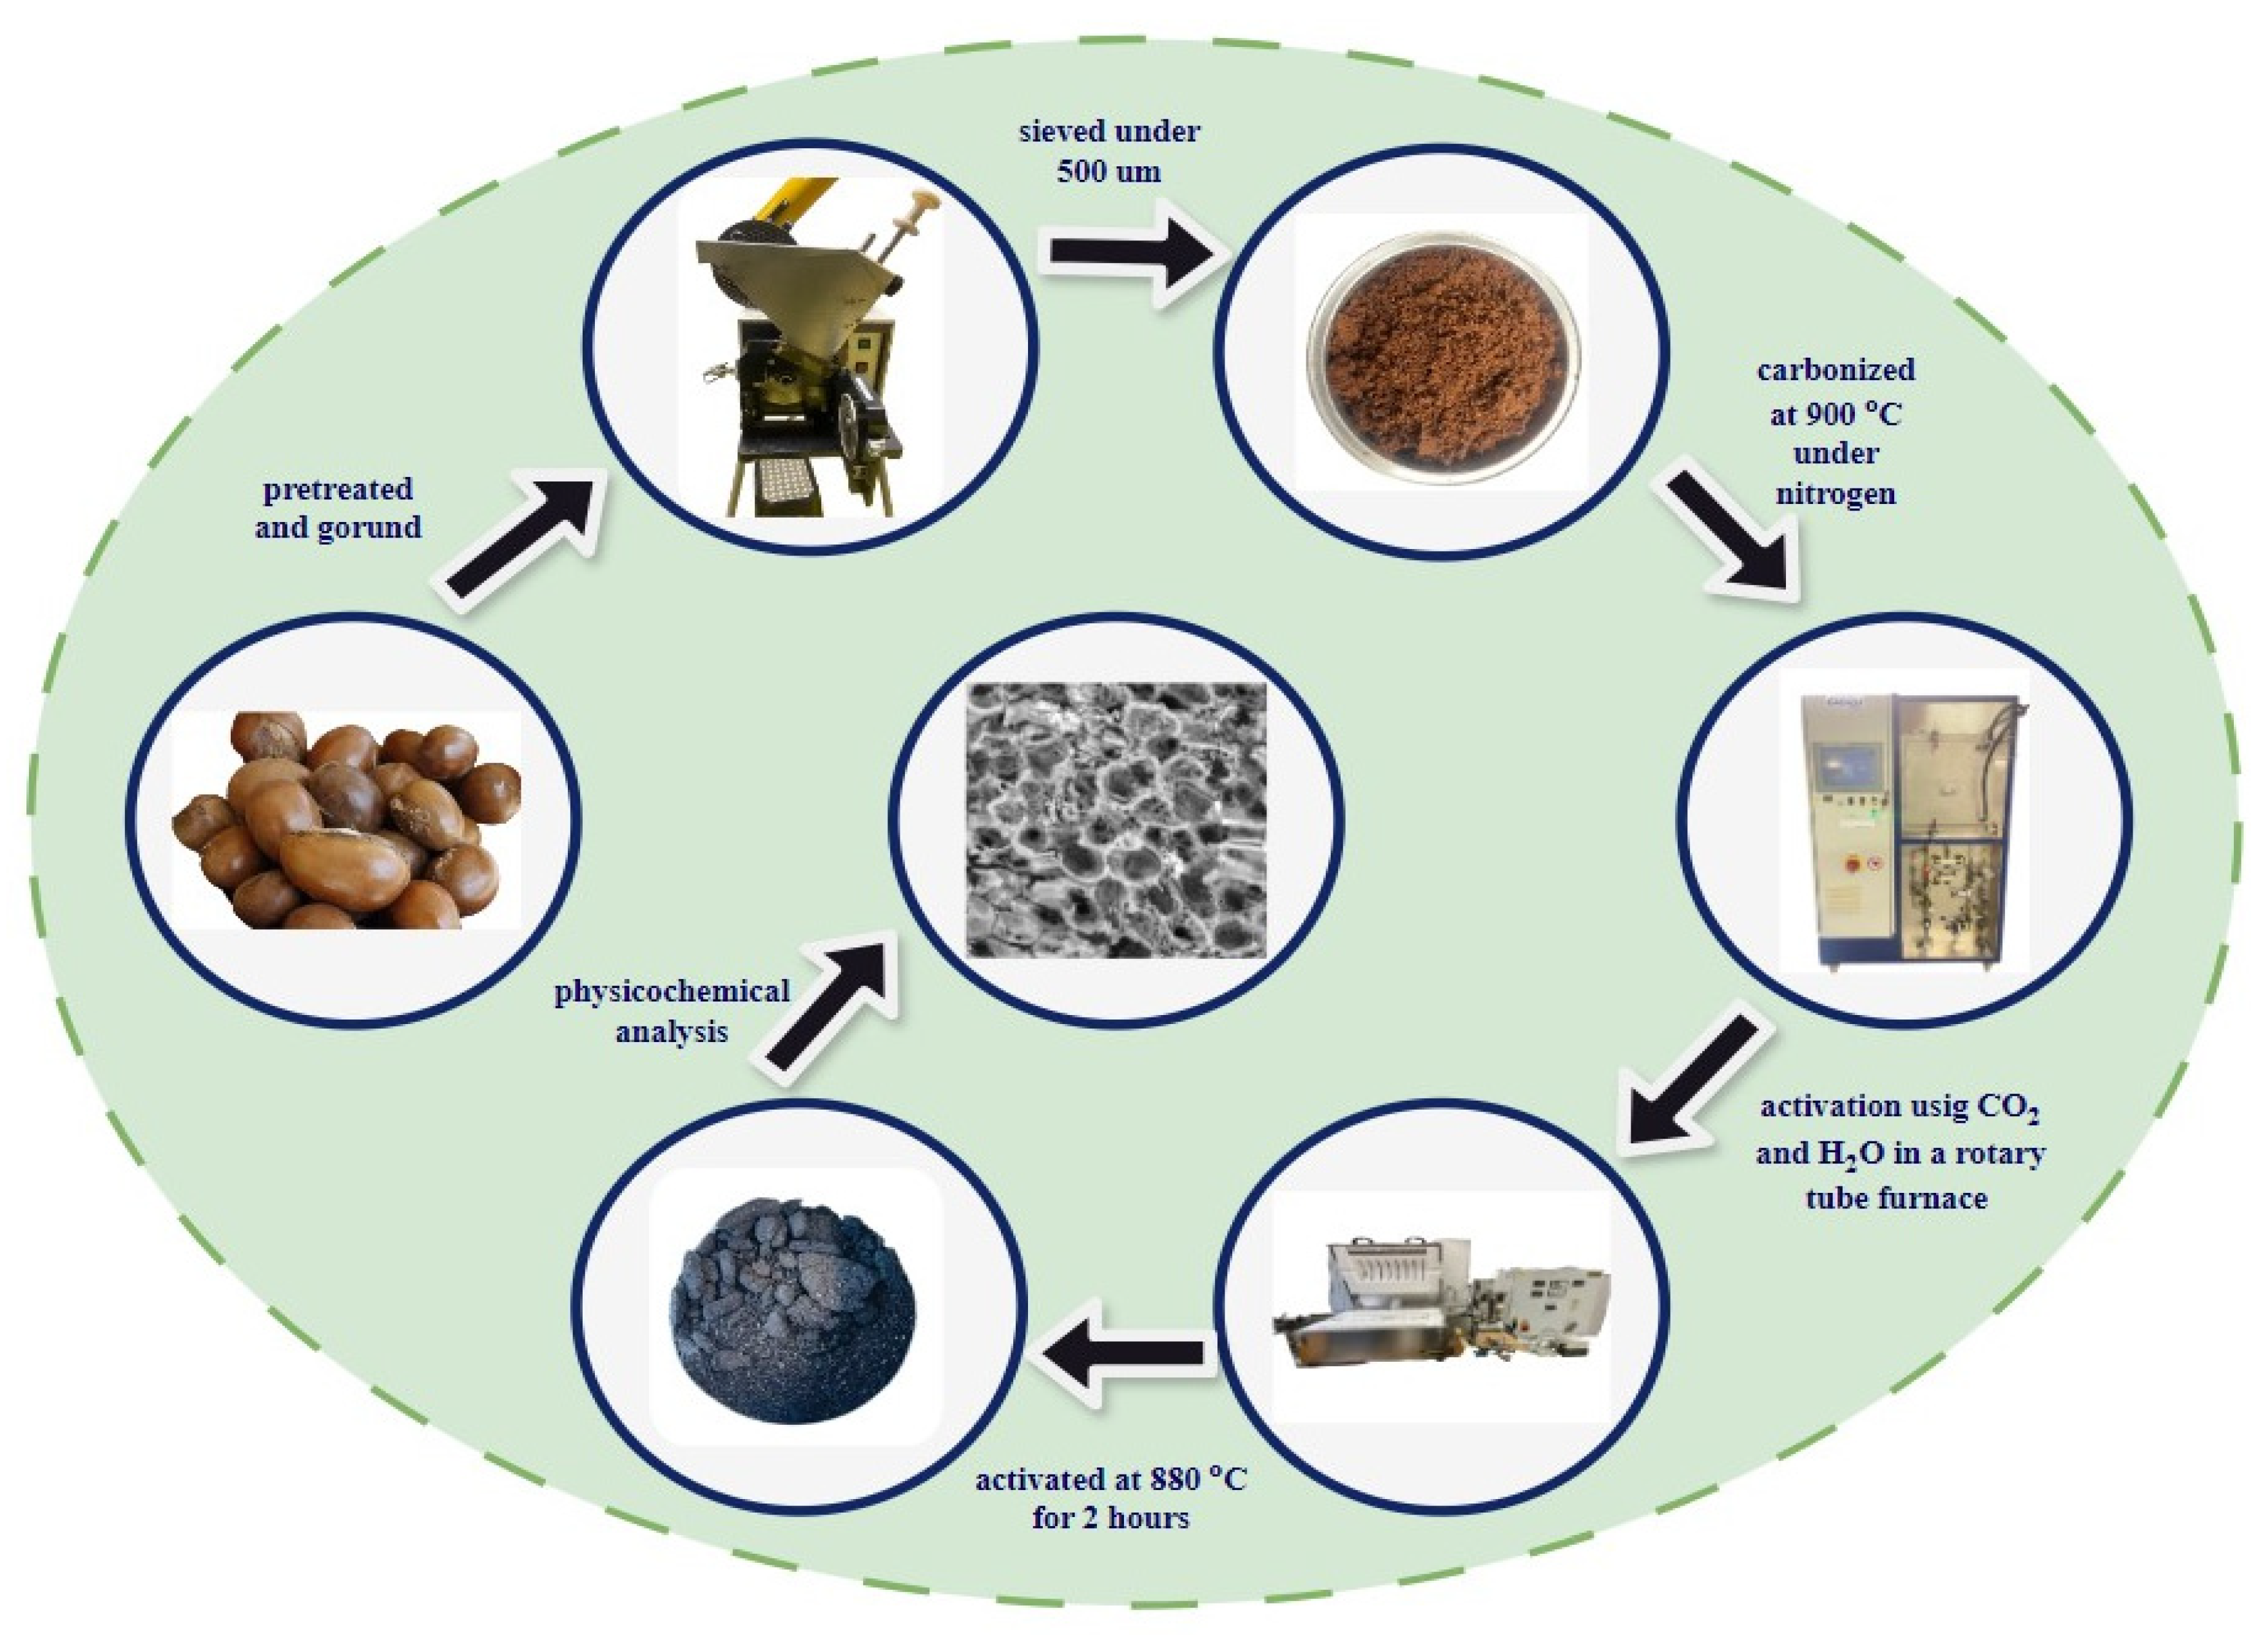
3.2. Activated Carbon Preparation
3.3. Characterization of Lignocellulosic Biomass and Activated Carbon
3.4. Electrode Fabrication and Characterization
4. Conclusions
Supplementary Materials
Author Contributions
Funding
Institutional Review Board Statement
Informed Consent Statement
Data Availability Statement
Conflicts of Interest
References
- Singh, S.; Singh, S. Advancements and challenges in integrating renewable energy sources into distribution grid systems: A comprehensive review. J. Energy Resour. Technol. 2024, 146, 090801. [Google Scholar] [CrossRef]
- Khalid, M. Smart grids and renewable energy systems: Perspectives and grid integration challenges. Energy Strategy Rev. 2024, 51, 101299. [Google Scholar]
- Oyedotun, K.O.; Mamba, B.B. New trends in supercapacitors applications. Inorg. Chem. Commun. 2024, 170, 113154. [Google Scholar] [CrossRef]
- Simon, P.; Gogotsi, Y. Materials for electrochemical capacitors. Nat. Mater. 2008, 7, 845–854. [Google Scholar] [CrossRef] [PubMed]
- Girirajan, M.; Bojarajan, A.K.; Pulidindi, I.N.; Hui, K.N.; Sangaraju, S. An insight into the nanoarchitecture of electrode materials on the performance of supercapacitors. Coord. Chem. Rev. 2024, 518, 216080. [Google Scholar] [CrossRef]
- Ampong, D.N.; Effah, E.; Tsiwah, E.A.; Kumar, A.; Agyekum, E.; Doku, E.N.A.; Issaka, O.; Agyemang, F.O.; Mensah-Darkwa, K.; Gupta, R.K. Advances and challenges in covalent organic frameworks as an emerging class of materials for energy and environmental concerns. Coord. Chem. Rev. 2024, 519, 216121. [Google Scholar]
- Ampong, D.N.; Mensah-Darkwa, K.; Gupta, R.K. Bio-Based Carbon for Supercapacitors, in NanoCarbon: A Wonder Material for Energy Applications: Volume 2: Fundamentals and Advancement for Energy Storage Applications; Springer: Berlin/Heidelberg, Germany, 2024; pp. 261–279. [Google Scholar]
- Ampong, D.N.; Lin, W.; de Souza, F.M.; Bharti, V.K.; Agyemang, F.O.; Andrews, A.; Mensah-Darkwa, K.; Dhakal, A.; Mishra, S.R.; Perez, F.; et al. Utilization of shea butter waste-derived hierarchical activated carbon for high-performance supercapacitor applications. Bioresour. Technol. 2024, 406, 131039. [Google Scholar]
- Devi, M.S.; Thangadurai, T.D.; Shanmugaraju, S.; Selvan, C.P.; Lee, Y.I. Biomass waste from walnut shell for pollutants removal and energy storage: A review on waste to wealth transformation. Adsorption 2024, 30, 891–913. [Google Scholar] [CrossRef]
- Singla, M.K.; Gupta, J.; Safaraliev, M.; Nijhawan, P.; Oberoi, A.S.; Menaem, A.A. Characterization of an activated carbon electrode made from coconut shell precursor for hydrogen storage applications. Int. J. Hydrogen Energy 2024, 61, 1417–1428. [Google Scholar] [CrossRef]
- Le Van, K.; Thi, T.T.L. Activated carbon derived from rice husk by NaOH activation and its application in supercapacitor. Prog. Nat. Sci. Mater. Int. 2014, 24, 191–198. [Google Scholar] [CrossRef]
- Abdallah, F.; Arthur, E.K.; Mensah-Darkwa, K.; Gikunoo, E.; Baffour, S.A.; Agamah, B.A.; Nartey, M.A.; Agyemang, F.O. Electrochemical performance of corncob-derived activated carbon-graphene oxide and TiO2 ternary composite electrode for supercapacitor applications. J. Energy Storage 2023, 68, 107776. [Google Scholar] [CrossRef]
- Zhan, Y.; Zhou, H.; Guo, F.; Tian, B.; Du, S.; Dong, Y.; Qian, L. Preparation of highly porous activated carbons from peanut shells as low-cost electrode materials for supercapacitors. J. Energy Storage 2021, 34, 102180. [Google Scholar] [CrossRef]
- Jain, A.; Tripathi, S. Nano-porous activated carbon from sugarcane waste for supercapacitor application. J. Energy Storage 2015, 4, 121–127. [Google Scholar] [CrossRef]
- Shen, H.-H.; Hu, C.-C. A high-voltage asymmetric electrical double-layer capacitors using propylene carbonate. Electrochem. Commun. 2016, 70, 23–27. [Google Scholar] [CrossRef]
- Nanzumani, N.M.; Agyemang, F.O.; Mensah-Darkwa, K.; Appiah, E.S.; Arthur, E.K.; Gikunoo, E.; Koomson, B.; Jadhav, A.R.; Raji, A. Molten salt synthesis of nitrogen-doped hierarchical porous carbon from plantain peels for high performance supercapacitor. J. Electroanal. Chem. 2022, 920, 116645. [Google Scholar] [CrossRef]
- Misnon, I.I.; Zain, N.K.M.; Jose, R. Conversion of oil palm kernel shell biomass to activated carbon for supercapacitor electrode application. Waste Biomass Valorization 2019, 10, 1731–1740. [Google Scholar] [CrossRef]
- Taer, E.; Apriwandi, A.; Ningsih, Y.; Taslim, R. Preparation of activated carbon electrode from pineapple crown waste for supercapacitor application. Int. J. Electrochem. Sci. 2019, 14, 2462–2475. [Google Scholar] [CrossRef]
- Ospino, J.; Parra-Barraza, J.P.; Cervera, S.; Coral-Escobar, E.E.; Vargas-Ceballos, O.A. Activated carbon from cassava peel: A promising electrode material for supercapacitors. Rev. Fac. De Ing. Univ. De Antioq. 2022, 102, 88–95. [Google Scholar]
- Kumar, R.; Singh, K.; Kumar, P.; Kaur, A. Highly porous activated carbon prepared from the bio-waste of yellow mustard seed for high-capacity supercapacitor applications. Mater. Chem. Phys. 2023, 304, 127869. [Google Scholar] [CrossRef]
- Subramani, K.; Sudhan, N.; Karnan, M.; Sathish, M. Orange peel derived activated carbon for fabrication of high-energy and high-rate supercapacitors. ChemistrySelect 2017, 2, 11384–11392. [Google Scholar] [CrossRef]
- Adazabra, A.N.; Viruthagiri, G.; Shanmugam, N. Management of spent shea waste: An instrumental characterization and valorization in clay bricks construction. Waste Manag. 2017, 64, 286–304. [Google Scholar] [PubMed]
- Agwuncha, S.C.; Owonubi, S.; Fapojuwo, D.P.; Abdulkarim, A.; Okonkwo, T.P.; Makhatha, E.M. Evaluation of mercerization treatment conditions on extracted cellulose from shea nut shell using FTIR and thermogravimetric analysis. Mater. Today Proc. 2020, 38, 958–963. [Google Scholar] [CrossRef]
- Abdullahi, Z.; Ajai, A.; Iyaka, Y. Removal of Lead and Cadmium from Aqueous Solution Using Activated Carbons from Desert Dates and Shea Nut Shells. 2017. Available online: http://irepo.futminna.edu.ng:8080/jspui/bitstream/123456789/9342/1/22Article%206.pdf (accessed on 17 June 2025).
- Musah, M.; Matthew, J.T.; Azeh, Y.; Badeggi, U.M.; Muhammad, A.I.; Abu, L.M.; Okonkwo, P.T.; Muhammad, K.T. Preparation and characterization of adsorbent from waste shea (vitellaria paradoxa) nut shell. Fudma J. Sci. 2024, 8, 338–344. [Google Scholar] [CrossRef]
- Breitenbach, S.; Lumetzberger, A.; Hobisch, M.A.; Unterweger, C.; Spirk, S.; Stifter, D.; Fürst, C.; Hassel, A.W. Supercapacitor Electrodes from Viscose-Based Activated Carbon Fibers: Significant Yield and Performance Improvement Using Diammonium Hydrogen Phosphate as Impregnating Agent. C 2020, 6, 17. [Google Scholar] [CrossRef]
- Zou, Y.; Wang, H.; Xu, L.; Dong, M.; Shen, B.; Wang, X.; Yang, J. Synergistic effect of CO2 and H2O co-activation of Zhundong coal at a low burn-off rate on high performance supercapacitor. J. Power Sources 2023, 556, 232509. [Google Scholar] [CrossRef]
- Li, L.; Tong, S.; Duan, L.; Zhao, C.; Shi, Z. Effect of CO2 and H2O on lignite char structure and reactivity in a fluidized bed reactor. Fuel Process. Technol. 2021, 211, 106564. [Google Scholar] [CrossRef]
- Wei, R.; Ren, L.; Geng, F. Gasification reactivity and characteristics of coal chars and petcokes. J. Energy Inst. 2021, 96, 25–30. [Google Scholar] [CrossRef]
- Breitenbach, S.; Duchoslav, J.; Mardare, A.I.; Unterweger, C.; Stifter, D.; Hassel, A.W.; Fürst, C. Comparative Behavior of Viscose-Based Supercapacitor Electrodes Activated by KOH, H2O, and CO2. Nanomaterials 2022, 12, 677. [Google Scholar] [CrossRef]
- Yang, H.; Yan, R.; Chen, H.; Lee, D.H.; Liang, D.T.; Zheng, C. Mechanism of palm oil waste pyrolysis in a packed bed. Energy Fuels 2006, 20, 1321–1328. [Google Scholar] [CrossRef]
- Yang, L.; Jiang, X.; Huang, T.; Jiang, W. Physicochemical characteristics and desulphurization activity of pyrolusite-blended activated coke. Environ. Technol. 2015, 36, 2847–2854. [Google Scholar] [CrossRef]
- Zhang, Y.J.; Xing, Z.J.; Duan, Z.K.; Li, M.; Wang, Y. Effects of steam activation on the pore structure and surface chemistry of activated carbon derived from bamboo waste. Appl. Surf. Sci. 2014, 315, 279–286. [Google Scholar] [CrossRef]
- Schott, J.A.; Do-Thanh, C.-L.; Shan, W.; Puskar, N.G.; Dai, S.; Mahurin, S.M. FTIR investigation of the interfacial properties and mechanisms of CO2 sorption in porous ionic liquids. Green Chem. Eng. 2021, 2, 392–401. [Google Scholar] [CrossRef]
- Le Ru, E.C.; Auguié, B. Enhancement factors: A central concept during 50 years of surface-enhanced Raman spectroscopy. ACS Nano 2024, 18, 9773–9783. [Google Scholar] [CrossRef] [PubMed]
- Cançado, L.G.; Monken, V.P.; Campos, J.L.E.; Santos, J.C.; Backes, C.; Chacham, H.; Neves, B.R.A.; Jorio, A. Science and metrology of defects in graphene using Raman spectroscopy. Carbon 2024, 220, 118801. [Google Scholar] [CrossRef]
- Wu, D.; Sun, F.; Qu, Z.; Wang, H.; Lou, Z.; Wu, B.; Zhao, G. Multi-scale structure optimization of boron-doped hard carbon nanospheres boosting the plateau capacity for high performance sodium ion batteries. J. Mater. Chem. A 2022, 10, 17225–17236. [Google Scholar] [CrossRef]
- Nazari, N.; Abadi, M.D.M.; Khachatourian, A.M.; Golmohammad, M.; Nemati, A. The effect of phosphorus and nitrogen dopants on structural, microstructural, and electrochemical characteristics of 3D reduced graphene oxide as an efficient supercapacitor electrode material. Diam. Relat. Mater. 2023, 137, 110144. [Google Scholar] [CrossRef]
- Zhang, X.; Hou, Z.; Jiang, M.; Peng, J.; Ma, H.; Gao, Y.; Wang, J.G. Molecular Engineering to Regulate the Pseudo-Graphitic Structure of Hard Carbon for Superior Sodium Energy Storage. Small 2024, 20, 2311778. [Google Scholar] [CrossRef]
- Thommes, M.; Kaneko, K.; Neimark, A.V.; Olivier, J.P.; Rodriguez-Reinoso, F.; Rouquerol, J.; Sing, K.S. Physisorption of gases, with special reference to the evaluation of surface area and pore size distribution (IUPAC Technical Report). Pure Appl. Chem. 2015, 87, 1051–1069. [Google Scholar] [CrossRef]
- Tan, Z.; Li, H.; Feng, Q.; Jiang, L.; Pan, H.; Huang, Z.; Shuai, M.; Kuang, Y. One-pot synthesis of Fe/N/S-doped porous carbon nanotubes for efficient oxygen reduction reaction. J. Mater. Chem. A 2019, 7, 1607–1615. [Google Scholar] [CrossRef]
- Du, J.; Chen, A.; Yu, Y.; Zhang, Y.; Lv, H.; Liu, L. Mesoporous carbon sheets embedded with vesicles for enhanced supercapacitor performance. J. Mater. Chem. A 2019, 7, 15707–15713. [Google Scholar] [CrossRef]
- Wang, M.; Liu, B.; Chen, H.; Yang, D.; Li, H. N/O codoped porous carbons with layered structure for high-rate performance supercapacitors. ACS Sustain. Chem. Eng. 2019, 7, 11219–11227. [Google Scholar] [CrossRef]
- Lei, W.; Guo, J.; Wu, Z.; Xuan, C.; Xiao, W.; Wang, D. Highly nitrogen and sulfur dual-doped carbon microspheres for supercapacitors. Sci. Bull. 2017, 62, 1011–1017. [Google Scholar] [CrossRef]
- Augustyn, V.; Simon, P.; Dunn, B. Pseudocapacitive oxide materials for high-rate electrochemical energy storage. Energy Environ. Sci. 2014, 7, 1597–1614. [Google Scholar] [CrossRef]
- Ike, I.S.; Sigalas, I.; Iyuke, S. Understanding performance limitation and suppression of leakage current or self-discharge in electrochemical capacitors: A review. Phys. Chem. Chem. Phys. 2016, 18, 661–680. [Google Scholar] [CrossRef]
- Qi, F.; Xia, Z.; Sun, R.; Sun, X.; Xu, X.; Wei, W.; Wang, S.; Sun, G. Graphitization induced by KOH etching for the fabrication of hierarchical porous graphitic carbon sheets for high performance supercapacitors. J. Mater. Chem. A 2018, 6, 14170–14177. [Google Scholar] [CrossRef]
- Pina, A.C.; Amaya, A.; Marcuzzo, J.S.; Rodrigues, A.C.; Baldan, M.R.; Tancredi, N.; Cuña, A. Supercapacitor electrode based on activated carbon wool felt. C 2018, 4, 24. [Google Scholar] [CrossRef]
- Krishnamoorthy, K.; Veerasubramani, G.K.; Radhakrishnan, S.; Kim, S.J. Supercapacitive properties of hydrothermally synthesized sphere like MoS2 nanostructures. Mater. Res. Bull. 2014, 50, 499–502. [Google Scholar] [CrossRef]
- Liu, Z.; Xiao, K.; Guo, H.; Ning, X.; Hu, A.; Tang, Q.; Fan, B.; Zhu, Y.; Chen, X. Nitrogen-doped worm-like graphitized hierarchical porous carbon designed for enhancing area-normalized capacitance of electrical double layer supercapacitors. Carbon 2017, 117, 163–173. [Google Scholar] [CrossRef]
- Ma, G.; Li, J.; Sun, K.; Peng, H.; Feng, E.; Lei, Z. Tea-leaves based nitrogen-doped porous carbons for high-performance supercapacitors electrode. J. Solid State Electrochem. 2017, 21, 525–535. [Google Scholar] [CrossRef]
- Taurbekov, A.; Abdisattar, A.; Atamanov, M.; Yeleuov, M.; Daulbayev, C.; Askaruly, K.; Kaidar, B.; Mansurov, Z.; Castro-Gutierrez, J.; Celzard, A.; et al. Biomass Derived High Porous Carbon via CO2 Activation for Supercapacitor Electrodes. J. Compos. Sci. 2023, 7, 444. [Google Scholar] [CrossRef]
- Zuo, S.; Chen, J.; Liu, W.; Li, X.; Kong, Y.; Yao, C.; Fu, Y. Preparation of 3D interconnected hierarchical porous N-doped carbon nanotubes. Carbon 2018, 129, 199–206. [Google Scholar] [CrossRef]
- Yakaboylu, G.A.; Jiang, C.; Yumak, T.; Zondlo, J.W.; Wang, J.; Sabolsky, E.M. Engineered hierarchical porous carbons for supercapacitor applications through chemical pretreatment and activation of biomass precursors. Renew. Energy 2021, 163, 276–287. [Google Scholar] [CrossRef]
- Cao, Y.; Han, K.; Teng, Z.; Li, J.; Ji, T.; Li, X.; Zhang, J. Optimized synergistic preparation of nitrogen-doped porous carbon derived from gasified carbon for supercapacitors. J. Alloys Compd. 2021, 860, 158385. [Google Scholar] [CrossRef]
- Gao, M.; Wang, L.; Zhao, B.; Gu, X.; Li, T.; Huang, L.; Wu, Q.; Yu, S.; Liu, S. Sandwich construction of chitosan/reduced graphene oxide composite as additive-free electrode material for high-performance supercapacitors. Carbohydr. Polym. 2021, 255, 117397. [Google Scholar]


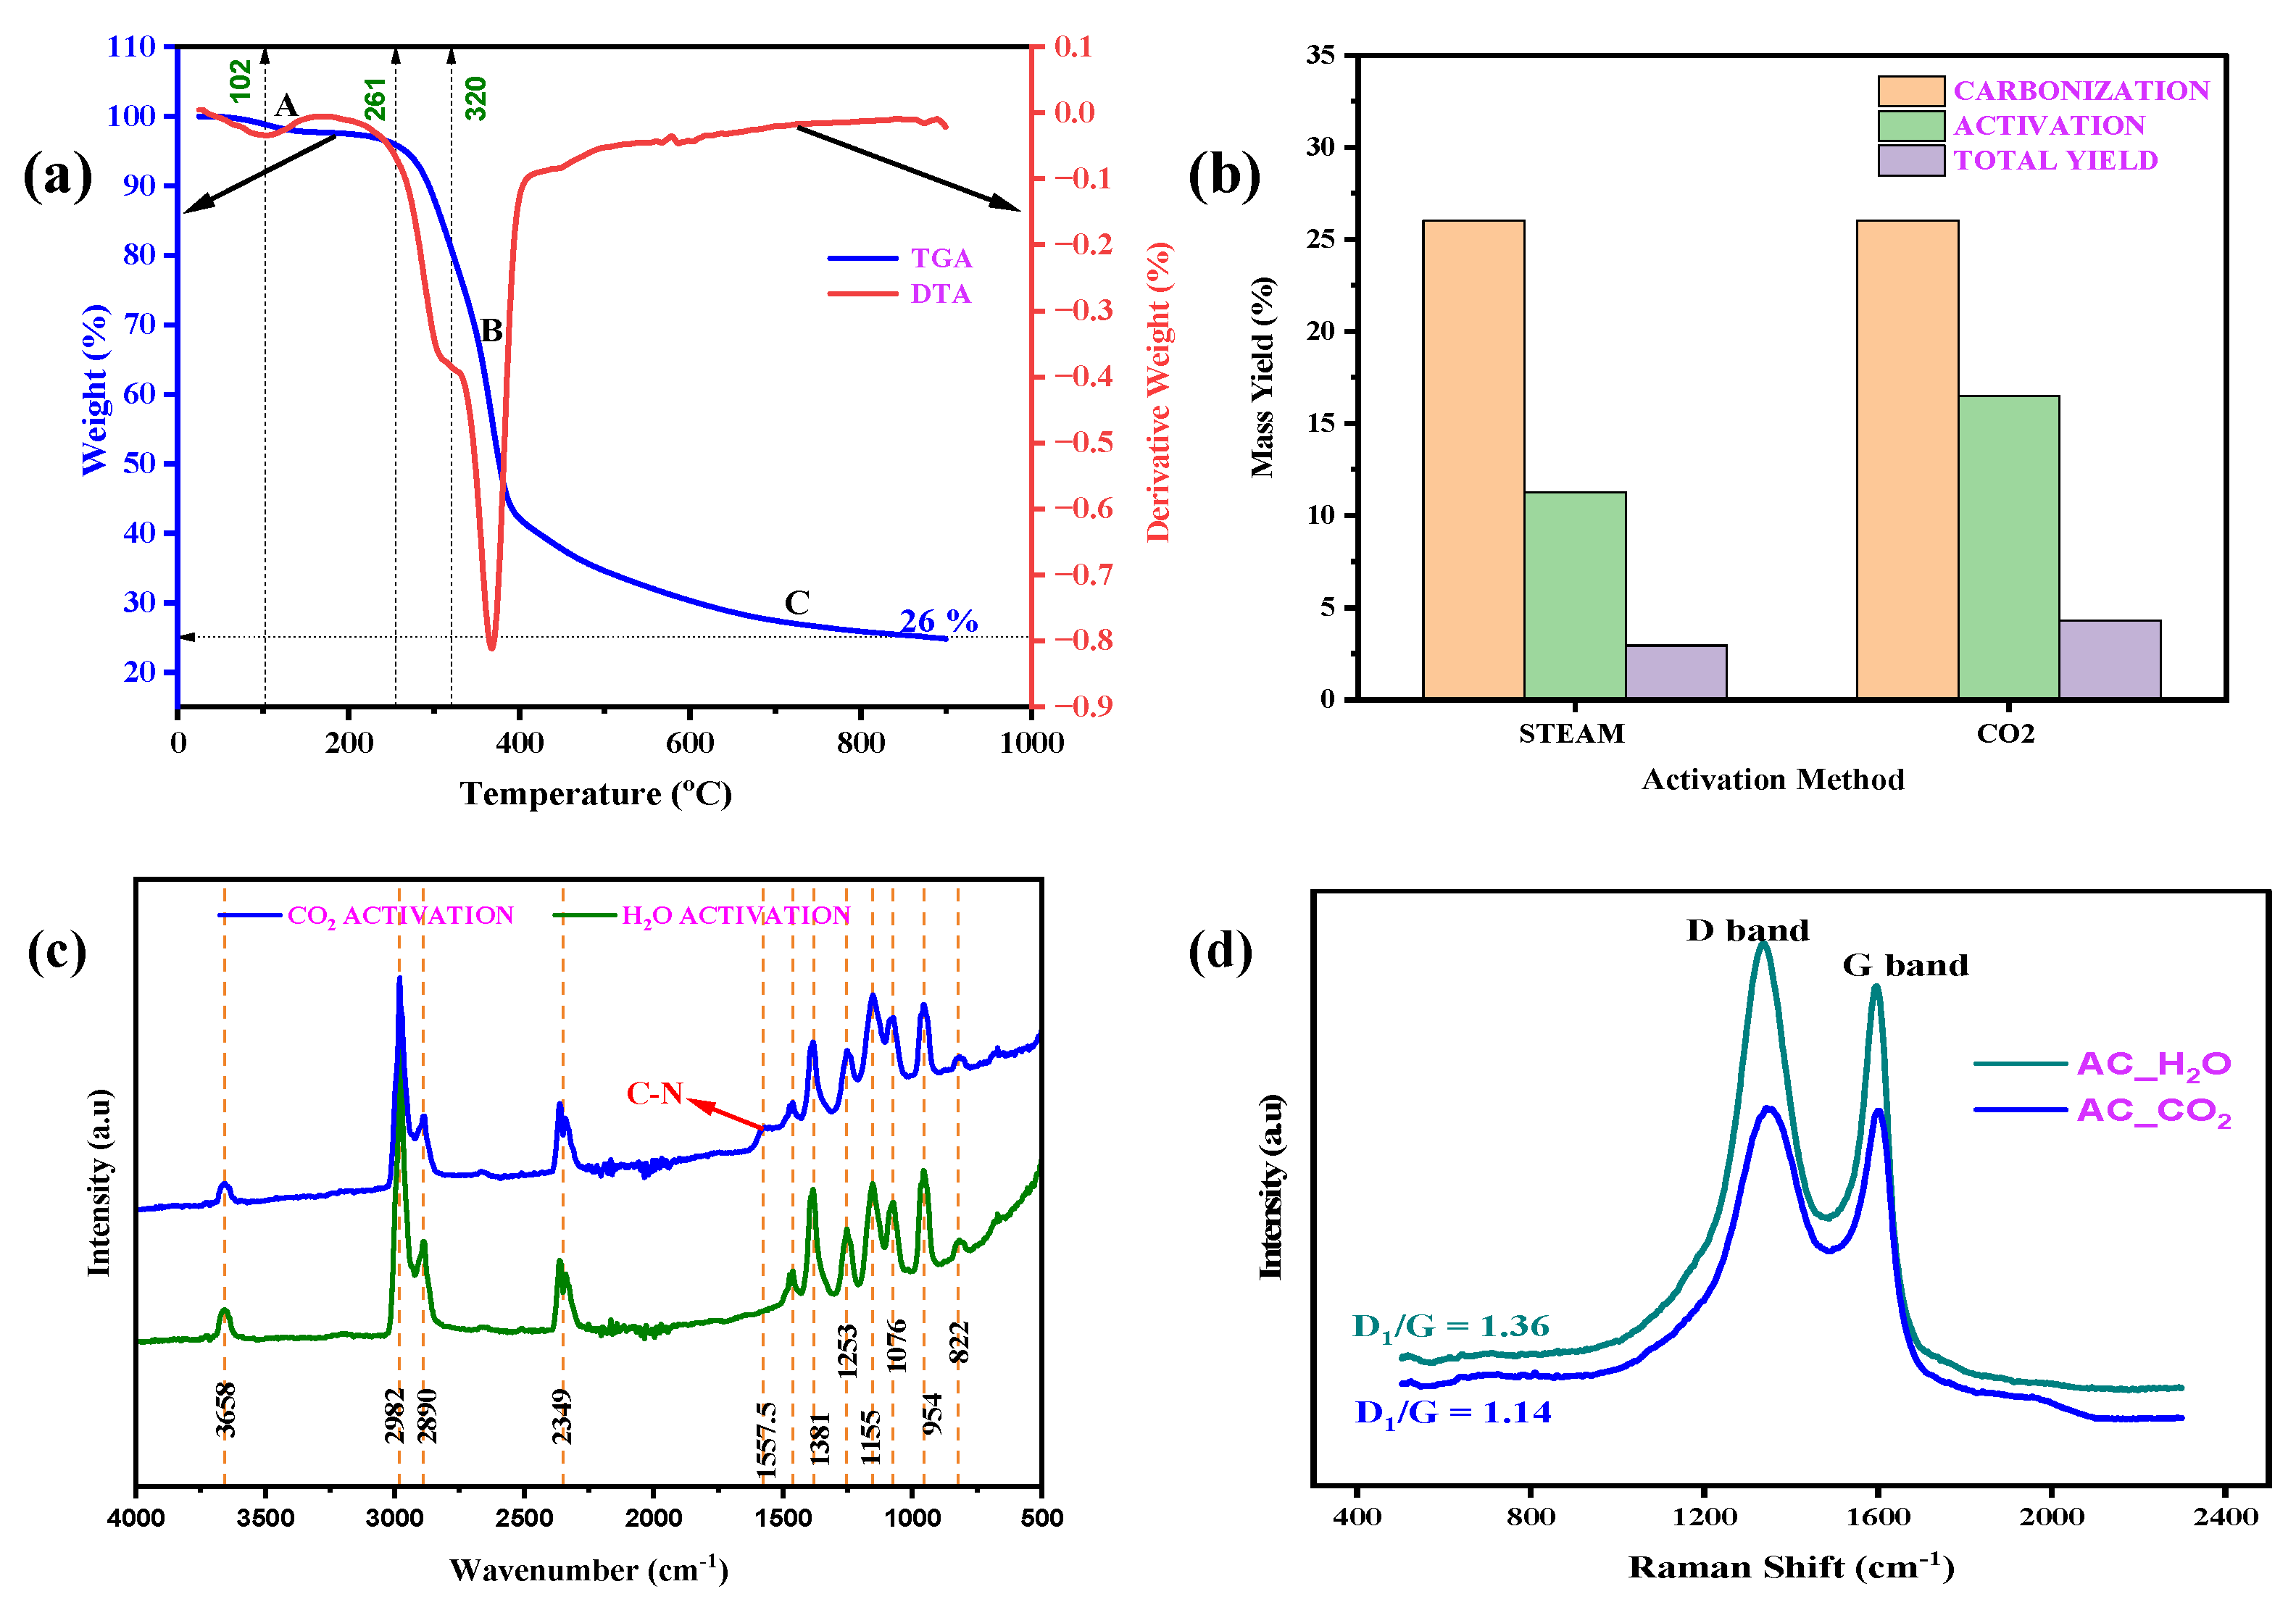
| Sample ID | ID1 (a.u) | ID3 (a.u) | ID4 (a.u) | IG | ID1/IG |
|---|---|---|---|---|---|
| AC_CO2 | 1595 | 506 | 154 | 1395 | 1.14 |
| AC_H2O | 2275 | 740 | 438 | 1669 | 1.36 |
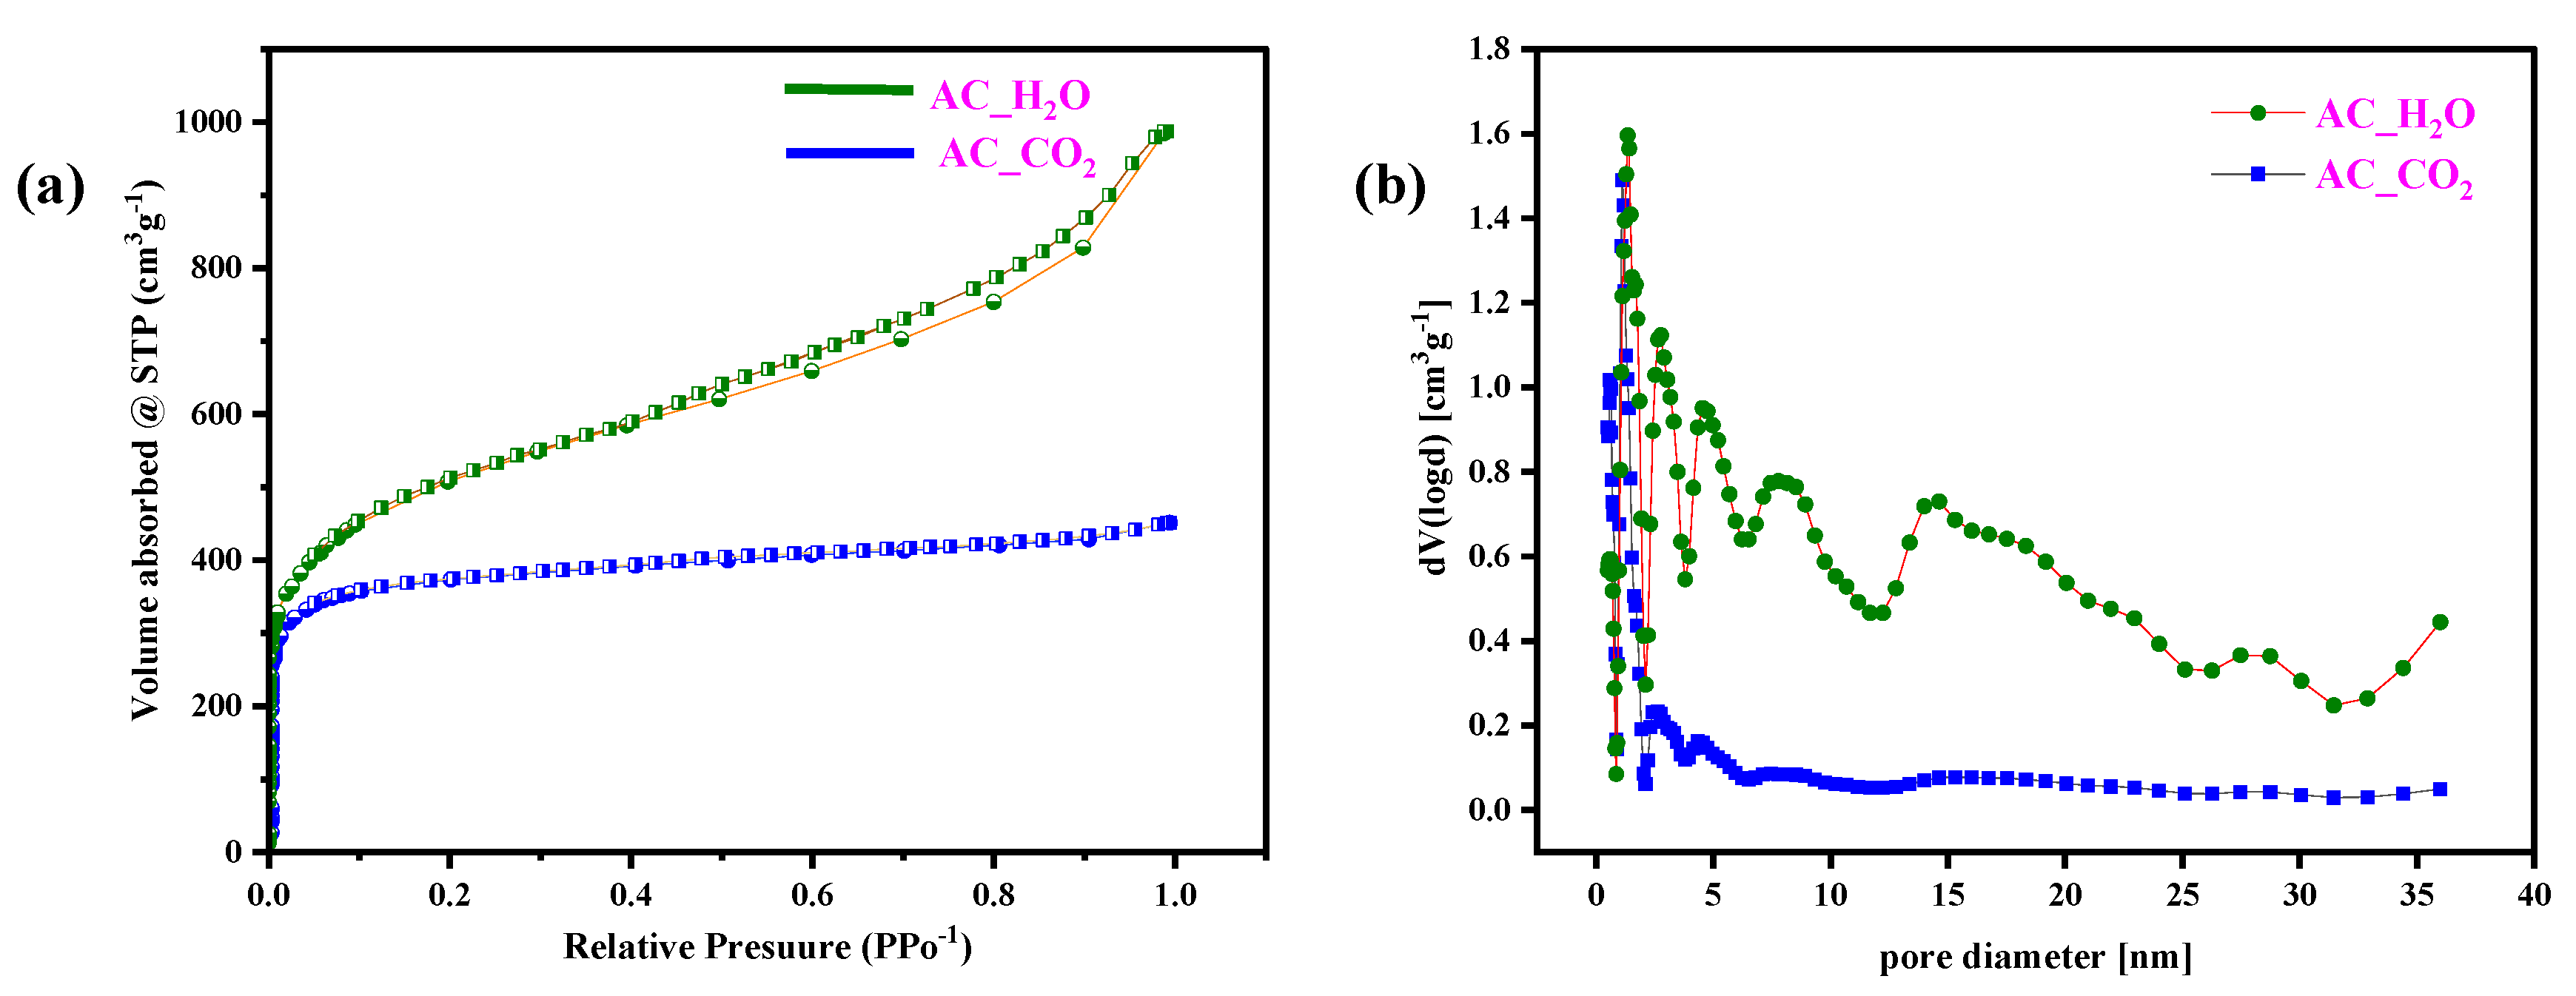
| Sample | SBET (m2 g−1) | VT (cm3 g−1) | Pore Diameter (nm) |
|---|---|---|---|
| AC_CO2 | 1528 | 0.72 | 1.95 |
| AC_H2O | 1842 | 1.57 | 3.41 |
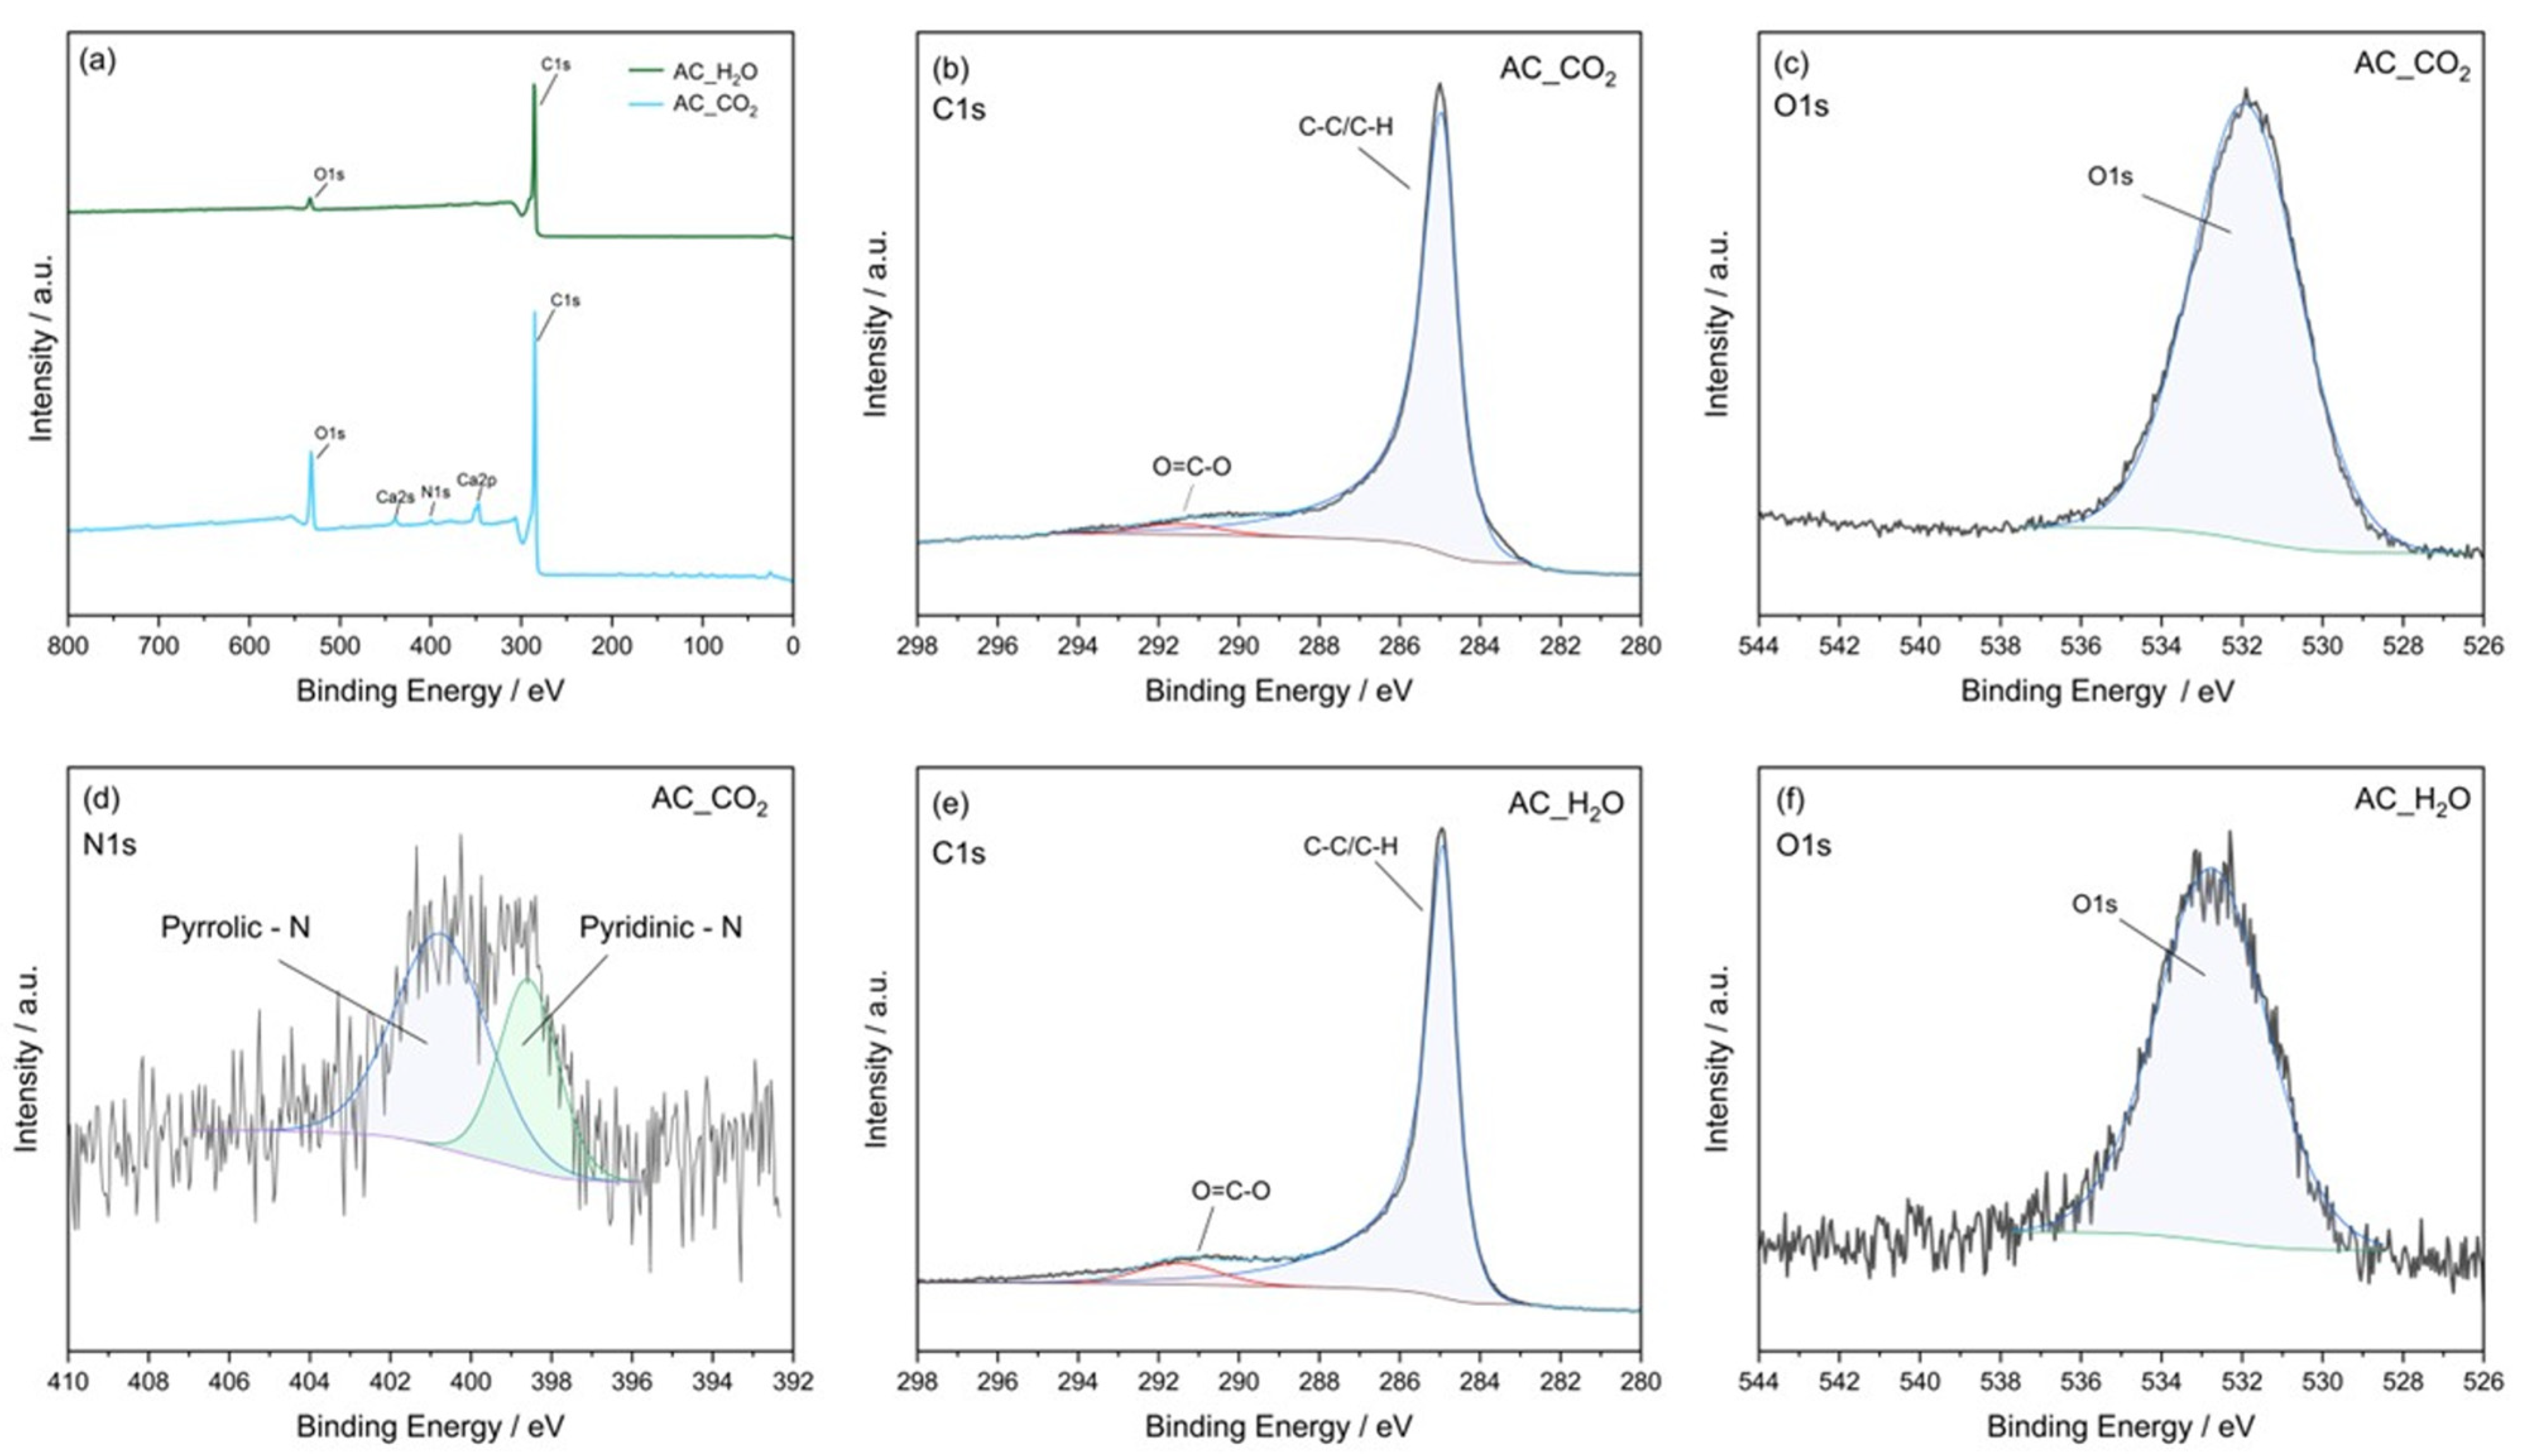
| Sample ID | Elemental Composition (at. %) | |||
|---|---|---|---|---|
| C | O | N | Ca | |
| AC_CO2 | 81.1 | 15.1 | 0.8 | 3.0 |
| AC_H2O | 96.5 | 3.5 | - | - |
Disclaimer/Publisher’s Note: The statements, opinions and data contained in all publications are solely those of the individual author(s) and contributor(s) and not of MDPI and/or the editor(s). MDPI and/or the editor(s) disclaim responsibility for any injury to people or property resulting from any ideas, methods, instructions or products referred to in the content. |
© 2025 by the authors. Licensee MDPI, Basel, Switzerland. This article is an open access article distributed under the terms and conditions of the Creative Commons Attribution (CC BY) license (https://creativecommons.org/licenses/by/4.0/).
Share and Cite
Alabi, J.A.; Nazari, N.; Ampong, D.N.; Agyemang, F.O.; Adom-Asamoah, M.; Opoku, R.; Zahrhuber, R.; Unterweger, C.; Mensah-Darkwa, K. Synthesis of Physically Activated Carbons from Vitellaria paradoxa Shells for Supercapacitor Electrode Applications. Inorganics 2025, 13, 224. https://doi.org/10.3390/inorganics13070224
Alabi JA, Nazari N, Ampong DN, Agyemang FO, Adom-Asamoah M, Opoku R, Zahrhuber R, Unterweger C, Mensah-Darkwa K. Synthesis of Physically Activated Carbons from Vitellaria paradoxa Shells for Supercapacitor Electrode Applications. Inorganics. 2025; 13(7):224. https://doi.org/10.3390/inorganics13070224
Chicago/Turabian StyleAlabi, Joshua Atta, Neda Nazari, Daniel Nframah Ampong, Frank Ofori Agyemang, Mark Adom-Asamoah, Richard Opoku, Rene Zahrhuber, Christoph Unterweger, and Kwadwo Mensah-Darkwa. 2025. "Synthesis of Physically Activated Carbons from Vitellaria paradoxa Shells for Supercapacitor Electrode Applications" Inorganics 13, no. 7: 224. https://doi.org/10.3390/inorganics13070224
APA StyleAlabi, J. A., Nazari, N., Ampong, D. N., Agyemang, F. O., Adom-Asamoah, M., Opoku, R., Zahrhuber, R., Unterweger, C., & Mensah-Darkwa, K. (2025). Synthesis of Physically Activated Carbons from Vitellaria paradoxa Shells for Supercapacitor Electrode Applications. Inorganics, 13(7), 224. https://doi.org/10.3390/inorganics13070224