Communication

Accessing the Magnetic Morphology of Ferromagnetic Molecular-Based Nanoparticles from Polarized Small-Angle Neutron Scattering

by
Grégory Chaboussant
Laboratoire Léon Brillouin, UMR12 CEA-CNRS, F-91191 Gif-sur-Yvette, France
Inorganics 2025, 13(6), 202; https://doi.org/10.3390/inorganics13060202
Submission received: 18 April 2025 / Revised: 22 May 2025 / Accepted: 4 June 2025 / Published: 16 June 2025
(This article belongs to the Section Coordination Chemistry)

Abstract

:
Polarized Small-Angle Neutron Scattering is a versatile low-energy neutron scattering technique that allows for the access of magnetic information on nanosize objects of size 2–100 nm, from individual properties like the magnetization distribution inside the object to the collective behaviors, e.g., spin-glass effects or long-range magnetic ordering. The multi-scale possibilities of this technique is particularly relevant to encompass simultaneously the individual and collective many-body phenomena. In this article, we report the direct measurement of the magnetic form factor of “Prussian Blue Analog” molecular-based Ferromagnetic nanoparticles Cs x I Ni II [ Cr III ( CN ) 6 ] embedded in a polymer matrix with use of Polarized Small-Angle Neutron Scattering. We show that PSANS is particularly adapted to evaluate the internal magnetization distribution in nanoparticles and determine their magnetic morphology.

Graphical Abstract

1. Introduction

Nanoparticles are the subject of intense research activities both for the peculiar properties offered by the size-controlled properties and for their applicative potential in a range of fields such as biology, medicine, optics, or even catalysis [1]. Magnetic Nanoparticles (MNPs) are considered potential candidates for high-density magnetic information storage or for magnetic microelectronic devices. Research has made significant progress on the synthesis side, and large efforts are being made to address the precise control of size/shape/composition of MNPs [2,3,4]. One known limitation to the use of MNPs is the “superparamagnetic” regime when decreasing the MNP size below some critical value. In such regime, MNPs are usually “single-domain”—meaning that the magnetization cannot form domain walls for instance—and thermal fluctuations are strong enough to restore spontaneous and collective reversal of the magnetization above the so-called blocking temperature T B . Below T B , the magnetization is blocked (usually ferromagnetically), but some subtlety may appear depending on structural and chemical parameters (size, shape, atomic magnetization, magneto-crystalline, and shape anisotropy). The collective behavior of an assembly of interacting MNPs is also a crucial point as the ability to control one single MNP in an assembly can be critical for potential applications. Inter-particle interactions, such as long-range dipolar interactions, should thus be considered as it can induce collective behavior (“super-ferromagnetism”, spin-glass phases) [5]. For this purpose, key parameters are usually the MNP spin-density, surface effects, and the media used to disperse the MNP. As a starting material for novel synthetic strategies to create original MNPs, the well-known family of Prussian Blue Analog (PBA) compounds has focused attention due to their wide-ranging intrinsic properties. These molecular-based compounds can be grown to MNPs in crystalline form of general formula A I M II [ M III ( CN ) 6 ] (where A is an alkali atom, and M and M’ are two metallic centers) [6]. As shown extensively, they exhibit a wide range of chemical, optical, or magnetic properties by changing the two metallic ions [7]. Amongst those compositions, the compound Cs x Ni II [ Cr III ( CN ) 6 ] is a prototypical paramagnetic example of this family (denominated CsNiCr in the following) [8,9]. The bulk compound is ferromagnetic ( T C = 90 K) [10] and the ordering temperature decreases in MNPs with decreasing particle size. The use of SANS to study the magnetic and structural properties of CsNiCr MNP [11] has exposed the specific influence of the MNP density in an electrically neutral polymer media (PVP in the present case). At low concentration, the single-MNP regime is observed while, at higher concentration, inter-particle (dipole) interactions play a key role in the collective organization of the particles in PVP. On the contrary, in a charged media (CTA+), electrostatic interactions between the media and the MNP induce a higher concentration of CTA on their surface. The crossover between individual and collective magnetic behavior in an assembly of CsNiCr superparamagnetic MNPs as a function of their size has been addressed using SANS [12].
All these issues related to the magnetic properties (individual as well as collective) can be addressed with Small-Angle Neutron Scattering (SANS) techniques, in particular when neutrons can be polarized as it allows for a more insightful investigation of the magnetic properties [13,14,15,16,17,18,19]. SANS is therefore a perfectly adapted tool to study structural and magnetic information in these systems. However, the direct access to the nuclear (structural) and magnetic form factors of the MNP can only be obtained when using polarized neutron SANS (PSANS). This technique is extremely powerful and insightful, as shown in a large range of magnetic systems [17,20]. As developed in this article, the use of Polarized SANS brings additional information and means of discrimination between nuclear and magnetic contributions to the SANS signal. It is an extra factor that eases the possibility to extract the magnetic information as compared to non-polarized SANS. The present article aims at exposing the experimental capabilities PSANS has to obtain direct access to the magnetic form factor of individual molecular-based PBA MNP. In this contribution, we show that the magnetic form factor in such molecular-based MNPs can be investigated using PSANS as the main experimental tool providing a ground for further studies in magnetic systems presenting intrinsically relatively low spin density.

2. Results and Discussion

While the general SANS expressions for nuclear and magnetic scattering are summarized in Appendix A.1 and Appendix A.2, respectively, the specific case of magnetic scattering by magnetic nanoparticles is described in Appendix A.3, treating non-polarized and polarized SANS situations. The magnetic contribution to SANS from MNPs (like also for bulk systems) can be more easily and straightforwardly extracted when using PSANS. The ability to separate the nuclear and magnetic contributions (with some limitation due to the non-perfect polarizer system) by differentiating the signals of opposite polarizations is a key asset of PSANS. Indeed, the PSANS measurements were done with successive neutron polarization UP(+) and DOWN(−), as explained in the experimental description above and the difference between the two PSANS signals. I ( Q ) and I + ( Q ) is considered in the following. The expressions I ± ( Q ) , for an assembly of non-interacting, or weakly interacting, particles are fully detailed in Appendix A.3.
As given in more detail in Appendix A.3 (see Equation (A23)), in the case of a non-perfect alignment of the particle magnetic moments along the magnetic field, we have
I ± ( Q ) = F ˜ N 2 + F ˜ M 2 2 P F ˜ N F ˜ M L ( x ) sin 2 α + F ˜ M 2 2 L ( x ) / x Y ( x ) sin 2 α ,
where F ˜ N 2 and F ˜ M 2 are the nuclear and magnetic form factors, respectively.
In this expression, α is the angle between the magnetization direction μ and the scattering wave-vector Q , and L ( x ) = coth ( x ) ( 1 / x ) is the Langevin function with argument x = μ m S H t o t / k B T . Note that Y ( x ) = L 2 ( x ) 1 + 3 L ( x ) / x is a term that vanishes when the magnetic moments align perfectly along the magnetic field. In this particular case, and taking into account the experimental setup parameters P and ϵ (see Appendix A.3, as well as Equations (A21) and (A24)), the difference Δ I ( Q ) thus becomes
Δ I ( Q ) = I ( Q ) I + ( Q ) = 2 P ( 1 + ϵ ) F ˜ N F ˜ M L ( x ) sin 2 α .
Hence, by differentiating the SANS signals from the two neutron polarization states, one can extract information on the magnetic form factor. By considering vertical direction ( α = π / 2 ) and horizontal direction ( α = 0 ), the nuclear and magnetic contributions can be separated with minimum assumption.
Figure 1 (left) shows 2D PSANS difference Δ I ( Q ) = I ( Q ) I + ( Q ) obtained at 5 K and 15 mT for Sample E2. The coercive magnetic field of these MNPs is about 7–10 mT as shown by previous magnetization curves [2,9,12] so that, at 15 mT, the magnetization is sizeable at low temperature. Figure 1 (right) shows 2D PSANS difference Δ I ( Q ) obtained at 10 K and 500 mT for Sample E3. At 500 mT, the low-T magnetization is essentially maximum [2,9,12]. The flipper “OFF” corresponds to I + ( Q ) , while the flipper “ON” stands for I ( Q ) . In both samples, the typical asymmetry pattern (“butterfly” shape) is visible, as this signal is entirely magnetic a soon as the system acquires some static magnetization, as it originates from the sin α dependence of the interference term (see Equation (A24) in Appendix A.3). Sectorial cuts (horizontal [ α = 0 ] and vertical [ α = π / 2 ] cuts, with angular spread ± 15 , are represented as solid white lines) are used in the following to extract the nuclear and magnetic form factors (cf Appendix A.3).
Figure 2 shows several 2D PSANS differences Δ I ( Q ) = I ( Q ) I + ( Q ) obtained under 15 mT at different temperatures between 10 and 60 K for Sample E2. As the temperature increases, the magnetic scattering contribution decreases and becomes immeasurable, within our background levels, above 70–80 K in agreement with magnetization data [2]. This is a signature of the relation between the temperature dependence of the magnetic form factor Δ I ( Q ) F ˜ M L ( x ) and the superparamagnetic behavior of the MNPs as described in Appendix A.3.
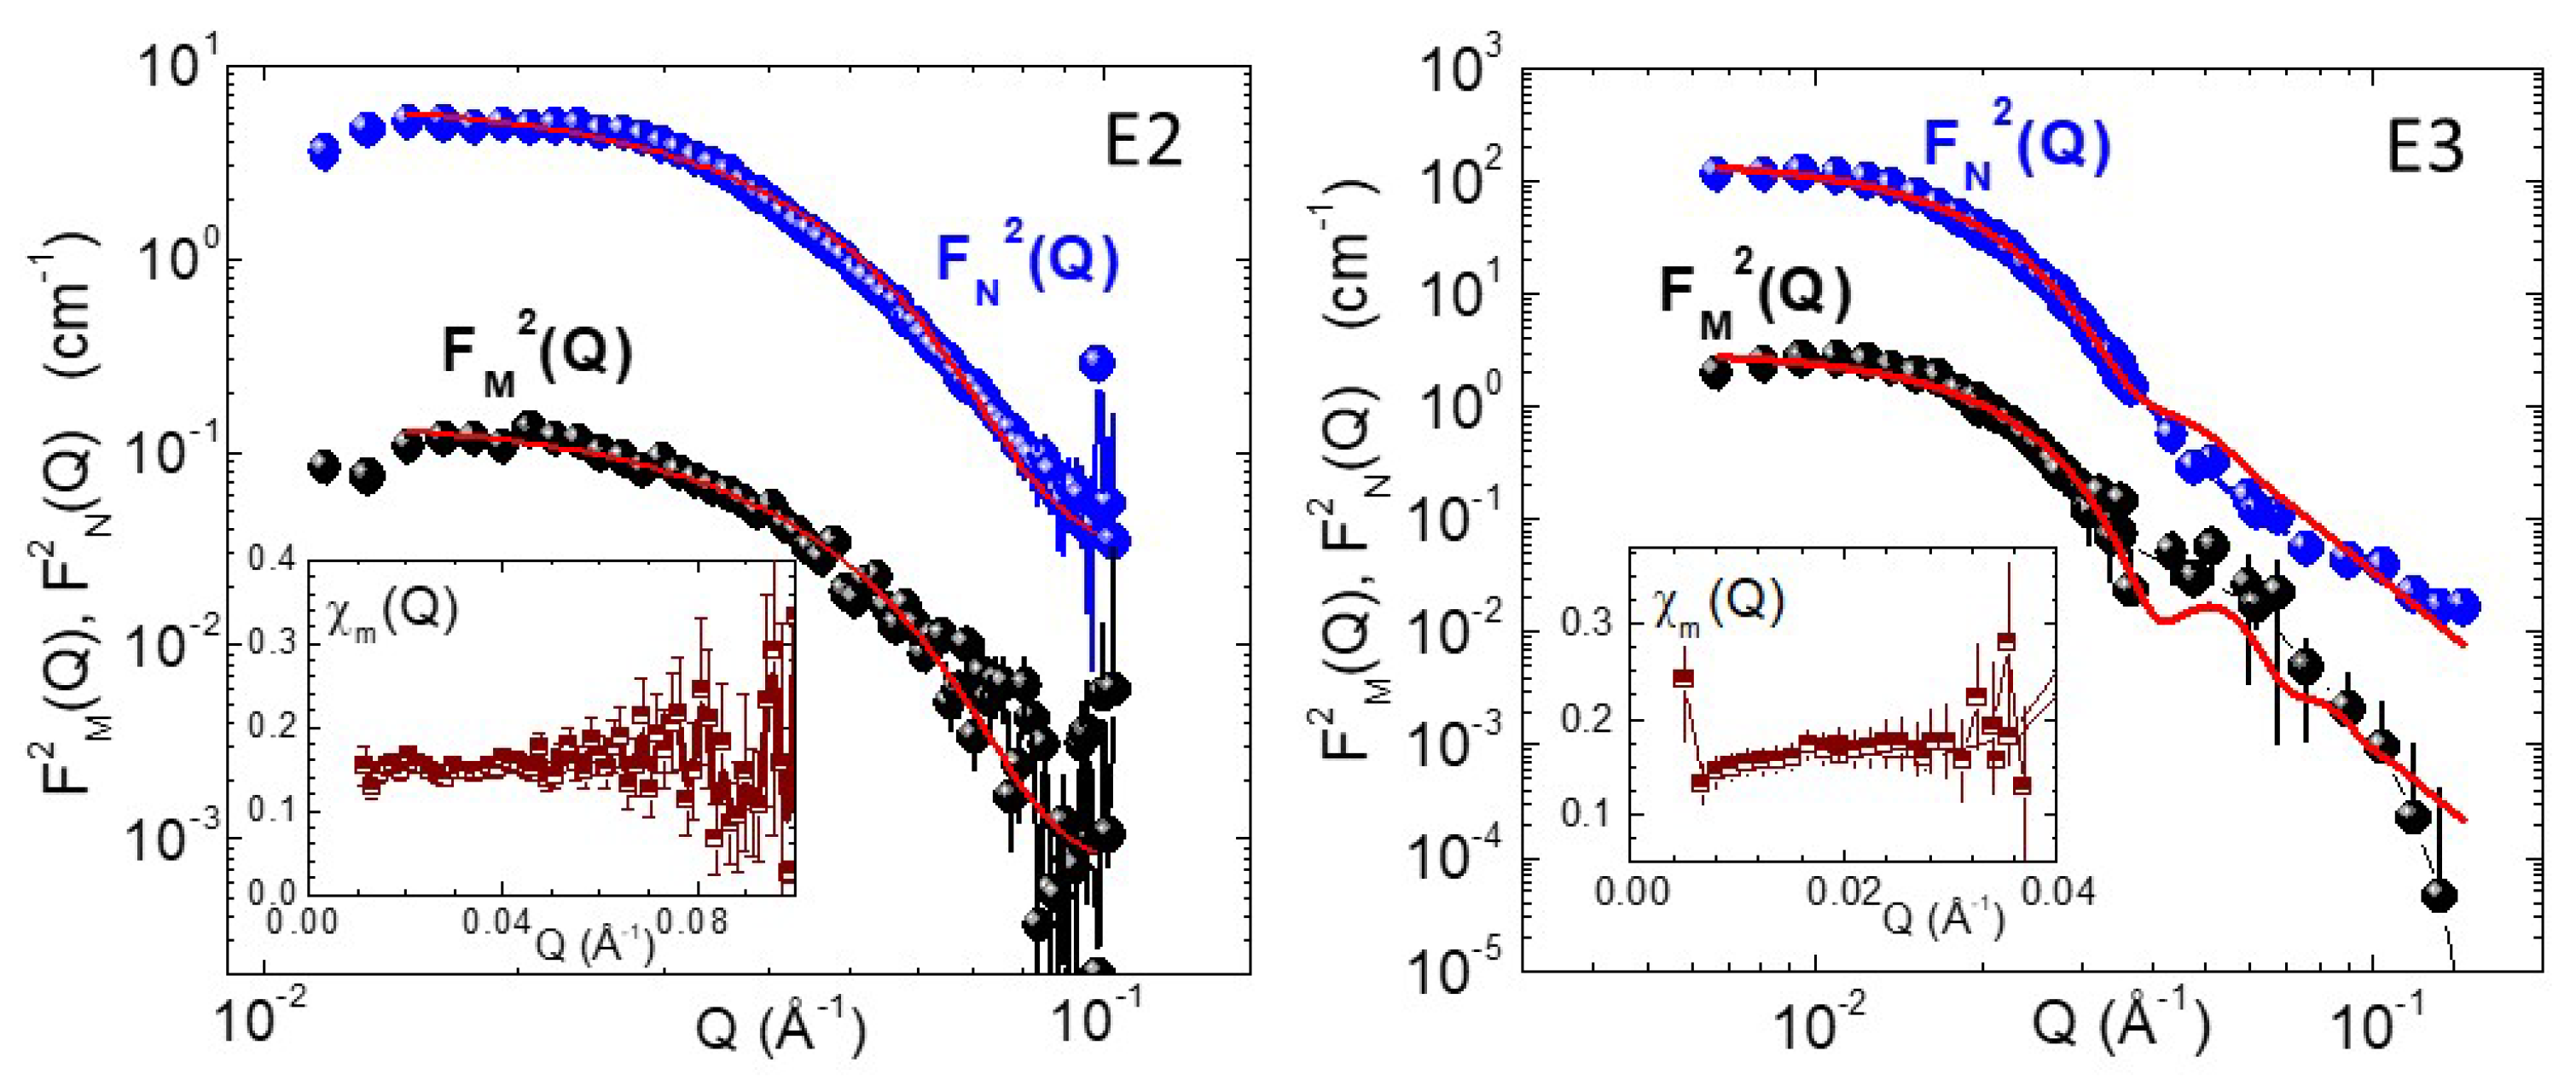
Figure 3 (left) shows the extracted nuclear and magnetic form factors, F N 2 ( Q ) and F M 2 ( Q ) , respectively, obtained from the PSANS data at 5 K and 15 mT for the E2 MNP. Taking the plateau-like shape of the form factor at about Q 0.02 Å−1, it is apparent that F M ( Q ) 0.15 F N ( Q ) for the E2 MNP.
The magnetic and nuclear form factors have been fitted using a spherical model with size-dispersion (see Appendix A.4 and [21]). The result indicates a MNP radius R = 4.5 ± 0.1 nm for both F M ( Q ) and F N ( Q ) with an intensity factor of 0.279 and 1.756, respectively, hence a ratio of 0.159. The size-dispersion is about 25%, a strong indication of significant size distribution. The inset of Figure 3 shows χ M = F M ( Q ) / F N ( Q ) . At low Q, the ratio χ M is indeed close to 0.15; however, very importantly, there is no significant deviation at higher Q values, at least up to Q = 0.08 Å−1. Above this value, the signal becomes noisier and less reliable. This means that, for the E2 MNP, the internal magnetization is a homogeneous function of the nuclear structure of the MNP. There is no measurable internal structure of the magnetization profile. As detailed in Appendix A.3, under some assumptions, χ M ( Q ) relates to the physical parameters of interest ( μ S , V p , and Δ ρ p ):
χ M ( Q ) = p ( μ S / μ B ) V p | Δ ρ p | 0.15 .
with this experimental value of χ M ( Q ) , V p = 330 nm3 and | Δ ρ p | = 2.30   ×   10 10 cm−2, one obtains μ S 4225 μ B for H = 15 mT. This experimental value is lower than the expected value for a fully magnetized MNP containing 4 Ni and 3.8 Cr ions per unit cell ( M S = 1.69 × 10 22 μ B / cm3): μ S , t h e o = 5550 μ B . Application of Equation (A15) leads to ρ m , S = 0.345 × 10 10 cm−2 with V m V p .
Figure 3 (right) shows similarly F N 2 ( Q ) and F M 2 ( Q ) , obtained from the PSANS data at 20 K and 0.5 T for the E3 MNP. Again, taking the plateau-like shape of the form factor at about Q 0.01 Å−1, we have F M ( Q ) 0.17 F N ( Q ) for the E3 MNP.
The magnetic and nuclear form factors are fitted using a spherical model with size-dispersion (see Appendix A.4 and [21]). The result indicates a MNP radius R = 10.5 ± 0.5 nm for both F M ( Q ) and F N ( Q ) with an intensity factor of 1.605 and 9.396, respectively, hence a ratio of 0.171. The size-dispersion is about 11%. The inset of Figure 3 shows a direct representation of χ M ( Q ) . Throughout the Q-range, the ratio χ M is close to 0.15–0.18, but we can observe a slight decrease of χ M at lower Q values: for Q 0.02 Å−1, we have χ M 0.17 , while for Q 0.01 Å−1, we have χ M 0.14 . With the experimental value χ M 0.17 , V p = 2700 nm3 and | Δ ρ p | = 2.30   ×   10 10 cm−2, one obtains μ S 43,590 μ B for H = 0.5 T which is very close to the expected value for a fully magnetized MNP ( μ S , t h e o = 45,630 μ B ). Application of Equation (A15) leads to ρ m , S = 0.436 × 10 10 cm−2 with V m V p .
Even if the effect is small, and could be impaired by the extraction procedure of the magnetic form factors, the low-Q decrease of χ M may be indicative that the magnetization of E3 MNP, as an ensemble of particles, is lower on average than the expected single-MNP magnetization. There could thus be some collective and/or surface effects that intervene to decrease the total magnetization of the system. This was shown to be the case in relatively large particles due to dipolar interactions [22] or Néel surface anisotropy [23]. This means that, for the E3 MNP, the internal magnetization is probably a homogeneous function of the nuclear structure of the MNP, but there are measurable effects acting upon the system to lower the total magnetization.
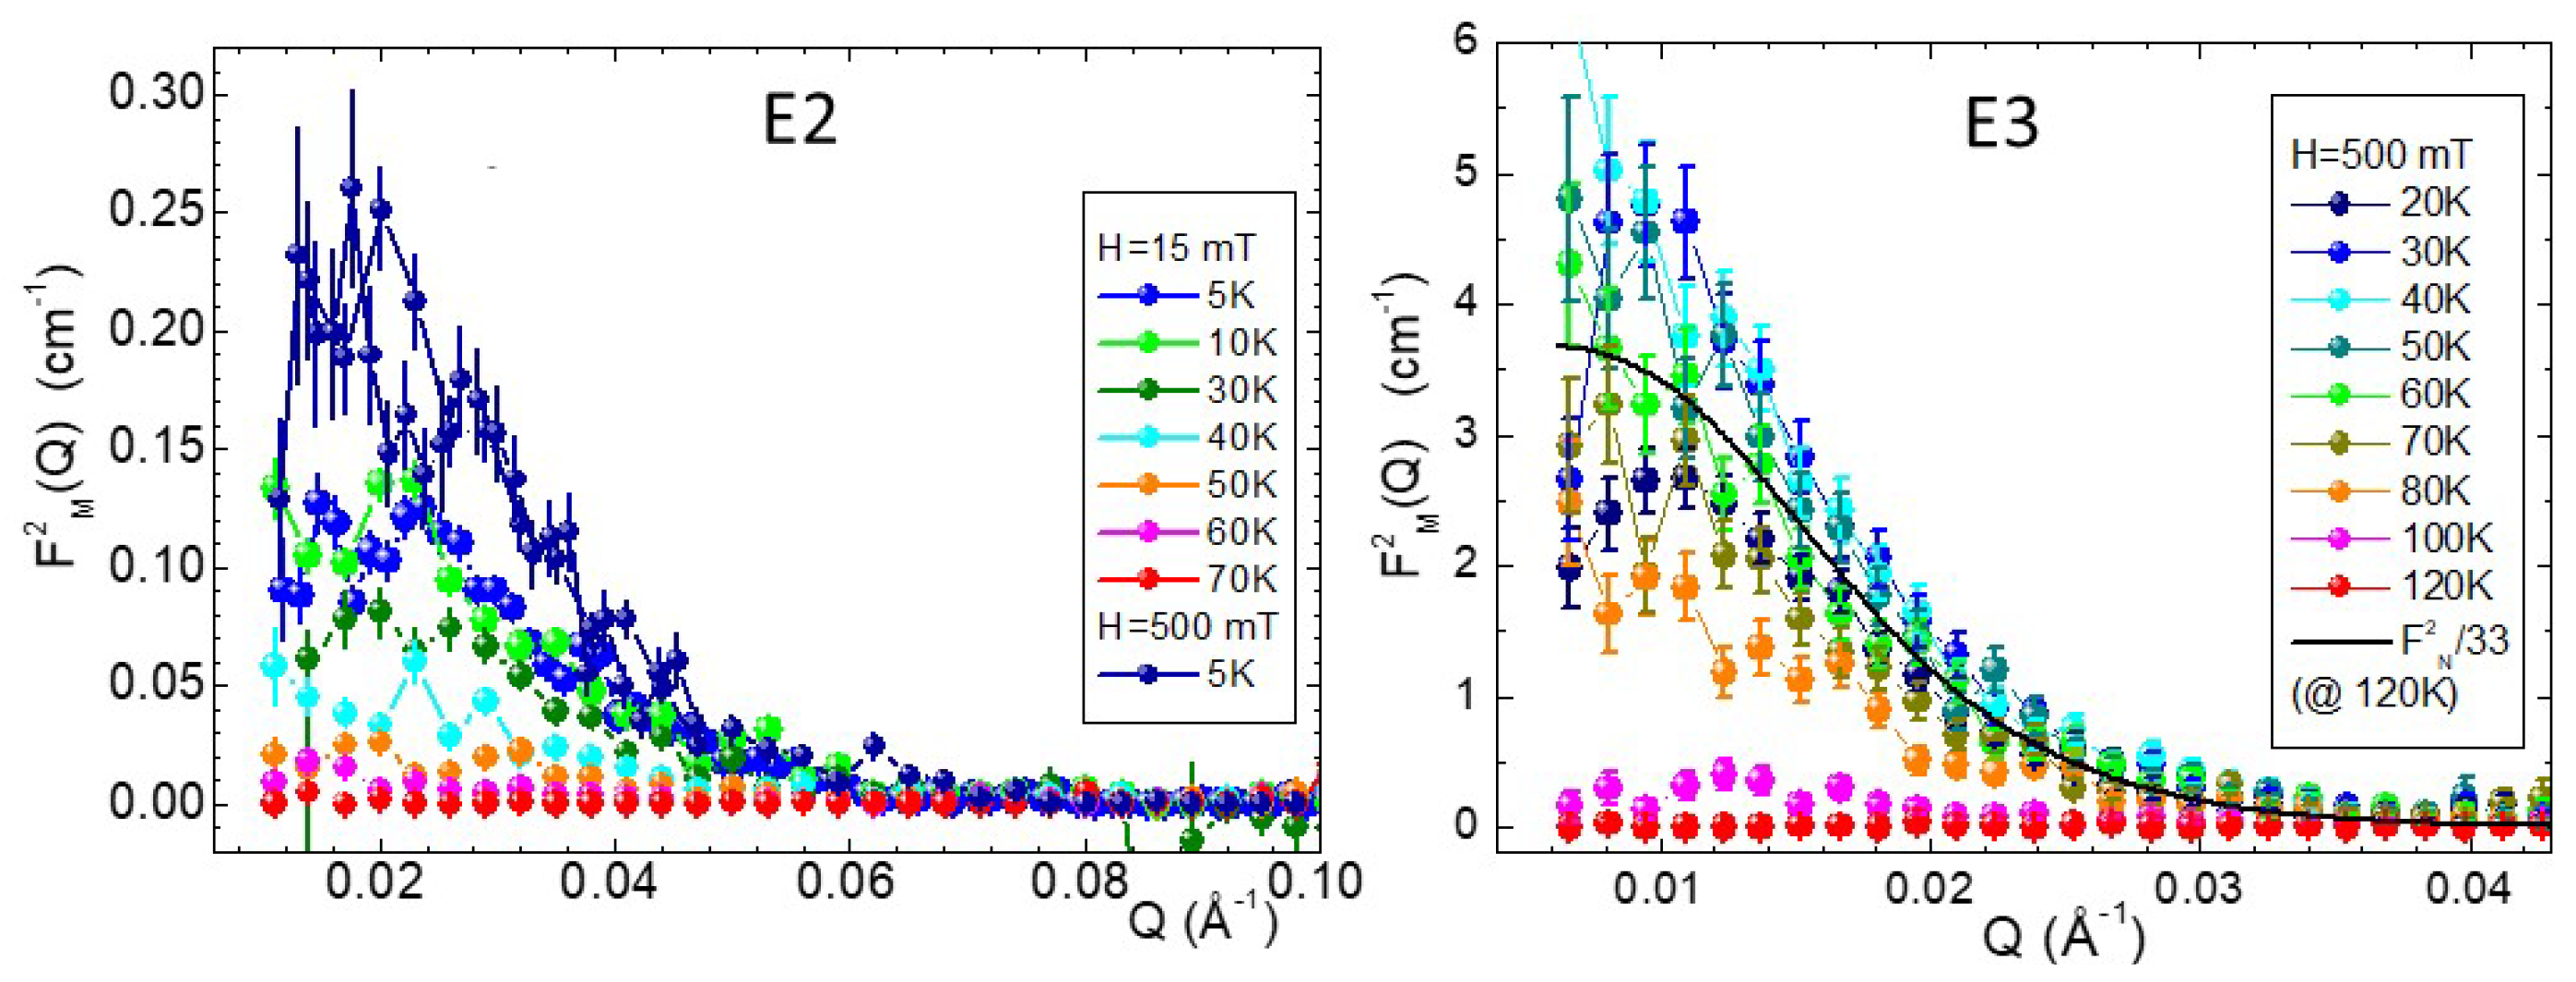
Figure 4 (left) shows the magnetic form factors, F M 2 ( Q ) , obtained from the PSANS data at various temperatures between 5 and 70 K, and magnetic fields (at the saturation field) for the E2 MNP. The temperature dependence clearly shows the vanishing intensity with increasing temperature. Above 60 K, there is essentially no magnetic signal left, in accordance with the magnetization data [2].
Similarly, Figure 4 (right) shows F M 2 ( Q ) obtained from the PSANS data at various temperature between 20 and 120 K at 0.5 T (the saturation field) for the E3 MNP. As in the case of E2 MNP, the intensity is vanishing with increasing temperature, and above 100 K, there is essentially no magnetic signal anymore, again in agreement with DC magnetization measurements.
Figure 5 shows the temperature evolution of the ratio χ M = F M ( Q ) / F N ( Q ) for the E2 and E3 MNPs (left and right panel, respectively). The temperature dependence clearly shows the vanishing intensity with increasing temperature. For the E2 MNP, the ratio is about χ M 0.15 at 5 K/15 mT and progressively decreases with increasing temperatures: χ M 0.13 at 30 K, χ M 0.07 at 50 K, and χ M 0.04 at 60 K. At T = 70 K, the magnetic form factor is essentially gone. At the largest field (500 mT), χ M is about 0.2, which corresponds to μ S 5630 μ B , in total agreement with the theoretical saturated magnetization of μ S , t h e o = 5550 μ B . For the E3 MNP, a similar trend is observed with χ M 0.15–0.2 at temperatures up to 70 L, and a sharp decrease is then observed above 80 K down to zero at the transition. In both MNPs, within the accuracy of the measurement, the ratio χ M mostly flat, showing no identifiable sign of Q-dependence in the relevant Q-range. It is worth noting that χ M ( Q ) remain mostly flat across the temperature range, even close to the magnetic transition temperature, which indicates that the magnetization decrease upon warming occurs most likely in a homogeneous way with the particle volume.

3. Materials and Methods

3.1. Samples

The CsNiCr MNP embedded in PVP (in concentration of 100 monomers of PVP per Ni ion) have been synthesized according to the method quoted in [11]. From structural analysis and diffraction data, the average radius size of the MNP are E2 (≈ 4.3 ( 1 ) nm) and E3 ( R 8.6 ( 2 ) nm) [11]. The samples used in the PSANS experiments consist in thin compacted dry powder lodged into an aluminum case and surrounded by a cadmium hollow ring with an inner diameter of 10 mm. Cadmium is a very strong neutron absorber that guarantees that all detected neutrons went through the samples. The samples thicknesses were 1 mm with weights ranging from 38 to 48 mg.

3.2. SANS Experimental Details

SANS experiments under magnetic field ( H applied horizontally and perpendicular to the neutron beam direction H k i ) were performed on the PA20 SANS beam line at LLB (Saclay) [24,25] with varied neutron wavelength λ (5 Å and 7 Å) and Sample-to-Detector distance d S D 2.2 16.2 m. The 3He neutron detector is a 64 × 64 cm2 2D grid with 5 mm pixel size ( 128 × 128 pixels). The direct beam position at the detector (central position) is absorbed by a Cd beam stopper. The wavelength spread of the monochromator (Astrium velocity selector type) is about 10%, which, added to the finite-size pixel resolution of the detector and the natural divergence of the incoming neutron beam, will contribute to the total resolution. A 7 mm slit collimation at the end of the collimator line is used to prevent high background arising from the cryomagnet. The samples were placed perpendicular to the incoming beam, and the data are represented as a function of the projection Q Q = ( 2 π / λ ) sin ( θ ) onto the detector plane of the scattering wave-vector Q = k F k i of norm | Q | = ( 4 π / λ ) sin ( θ / 2 ) . The accessible dynamical Q-range on PA20 is large, typically 0.001–1 Å−1, when combining and varying different neutron wavelengths λ and sample-to-detector distances d S D . After corrections for beam transmission and detector efficiency, the different I ( Q ) curves from the various settings are grouped together to form a single I ( Q ) curve for each set. The corrected data are also normalized from a 1 mm thick plate of plexiglas serving as the incoherent scattering standard for hydrogen. The data are represented as a function of the scattering wave-vector Q . The polarization of the neutrons (spin-1/2 “up” or “down”) is ensured by a transmission double V-shape polarizer (Swiss Neutronics) made of a 0.9 m long Si substrate, coated with a polarizing super-mirror Fe/Si (m = 4) under a 45 mT static magnetic field. At λ = 5–7 Å, the nominal neutron polarization is about P 0.94 . The polarization of the neutron beam can be reversed using a radio-frequency solenoid-type spin flipper (Mirrotron) working in the 130–150 kHz range. The spin flipper efficiency, ϵ 0.99 , has been inferred from neutron reflectivity measurements on a fully polarized ferromagnetic thin layer standard. The measured intensity is thus a function of the incoming beam I 0 , the polarization rate P, and the flipper efficiency ϵ . We note I ± the measured intensity for the UP (+) and DOWN (−) polarization states, flippers OFF or ON, respectively. The SANS data were reduced, analyzed, and presented in the figures using the GRASP software package developed at the ILL [26]. The instrumental resolution, including incident neutron wavelength spread, detector pixel size, and beam divergence, has been evaluated and is taken into account in the fits described in the present article. The errors bars shown in the figures are the result of the data treatment using GRASP.

4. Conclusions

In conclusion, a PSANS study of CsNiCr Ferromagnetic Molecular-based Nanoparticles (size 10–20 nm) is reported. It is shown that this technique constitutes a unique tool to probe the spatial magnetization inside nanoparticles of molecular origin. In the present case, the magnetization mapping is found relatively homogeneous, as no dead magnetic layer or significant decrease of the magnetization can be measured. The data analysis developed in the paper permits a straightforward way to derive the nuclear and magnetic form factors of molecular-based nanoparticles from the analysis of the PSANS data. This approach can be utilized for many types of molecular-based MNP, possessing intrinsically a low density of magnetic ions, thanks to the unique and capabilities of PSANS.

Funding

This research was funded by CNRS and CEA. The PA20 instrument at LLB was partially funded by CNANO regional funds (CNANO-IDF 2009–2010) and RTRA “Triangle de la Physique”.

Institutional Review Board Statement

Not applicable.

Informed Consent Statement

Not applicable.

Data Availability Statement

The raw data supporting the conclusions of this article will be made available by the authors on request.

Acknowledgments

The author wishes to acknowledge the technical support from Sébastien Gautrot, Marc Detrez. Talal Mallah, and Laure Catala are gratefully acknowledged for fruitful discussions and the sample preparation. Benoît Gobaut and Nicolas Martin are gratefully acknowledged for discussions during the experiments and data analysis.

Conflicts of Interest

The author declares that there are no conflicts of interest.

Abbreviations

The following abbreviations are used in this manuscript:
SANSSmall-Angle Neutron Scattering
SLD(neutron) Scattering Length Density
MNPMagnetic Nano-Particles
CTACetyltrimethylammonium C 19 H 42 N
PVPPolyvinylpyrrolidone C 6 H 9 NO

Appendix A. SANS from Magnetic Nanoparticles

Appendix A.1. Nuclear Scattering

The differential scattering cross-section d σ ( Q ) / d Ω of a sample is defined as the number of scattered neutrons of wavelength λ per unit time and per unit solid angle at Q and per unit volume of sample. The modulus of the scattering vector Q = k f k i is defined as | Q | = ( 4 π / λ ) sin ( θ / 2 ) , where θ is the scattering angle and | k i |   =   | k f |   =   2 π / λ . With all rigor, Q is given by the projection of Q onto the plane perpendicular to k i , that is the plane of the detector: Q Q .
For nano-particles with a general shape (spherical, cylindrical, etc.) the particle cross section is
d σ ( Q ) d Ω = V 2 Δ ρ 2 . i f i ( Q , u i ) 2 + i , j f i ( Q , u i ) . f j ( Q , u j ) . S i j ( Q , u i , u j ) ,
where V is the volume of particles, and Δ ρ = ρ p ρ m is the difference in the neutron Scattering Length Densities (SLD’s expressed in cm−2) between the particles and their medium (solvent, matrix).
For the nuclear part, ρ is given by
ρ = i c i b i V i ,
where c i , b i , and V i are the atomic concentration, the nuclear scattering length, and the atomic volume of the constituent i in the sample, respectively. The sum is over all the particles in the sample, and f i ( q , u i ) is the amplitude of the form factor for the i th particle with orientation given by the unit vector u i . The term S i j ( q , u i , u j ) is the partial structure factor.
The first term in Equation (A1) leads to the orientational averaged form factor:
F 2 ( Q ) = f 2 ( Q ) 0 .
For monodisperse spherical particles, the scattering intensity can be factorized in two terms, the form factor F 2 ( Q ) and the structure factor S ( Q ) :
I ( Q ) = d σ ( Q ) d Ω F 2 ( Q ) . S ( Q ) .
The structure factor S ( Q ) depends on eventual inter-particle interactions. For non-interacting particles, we have S ( Q ) = 1 .
The nuclear form factor of the nano-particles is defined as
F N ( Q ) = V p ( Δ ρ ) F N , g e o ( Q ) ,
where F N , g e o ( Q ) is the structural geometrical (dimensionless) form factor of the following particles:
F N , g e o ( Q ) = 1 V p . V p exp ( i . Q . r ) . dr ,
and V p and Δ ρ are the nano-particles structural volume and SLD structural contrast, respectively. Two cases of widely used form factors are detailed in Appendix A.4: the perfect sphere and the core-shell sphere.
The nuclear (structural) SANS intensity for an assembly of N p independent spherical particles dispersed in a sample volume V is then
I N ( Q ) = N p V F N 2 ( Q ) = N p V V p 2 ( Δ ρ ) 2 F N , g e o 2 ( Q ) = ϕ V p ( Δ ρ ) 2 F N , g e o 2 ( Q ) ,
where ϕ = ( N p V p ) / V is the volume occupation fraction of the particles in the sample.

Appendix A.2. Magnetic Scattering

We consider N p isolated spherical particles of structural volume V p and “magnetic” volume V m , with nuclear and magnetic Scattering Length Density (SLD) contrasts Δ ρ = ρ p ρ m e d and Δ ρ m = ρ m ρ m , m e d , respectively. Note that isolated refers to magnetically uncorrelated particles and there might be a magnetic structure factor in the case of correlated (long-range or short-range orders) magnetic particles. V m and V p are the particle’s magnetic volume and the particle’s structural volume, respectively, and emphasize the difference between magnetic neutron scattering (sensitive to V m ) and nuclear neutron scattering (sensitive to V p ). We assume first that the nuclear and magnetic SLDs are constant across the particle volume. ρ p and ρ m e d are the nuclear SLD’s for the particles and the matrix, respectively. ρ m and ρ m , m e d are the magnetic SLDs for the particles and the matrix, respectively. If the latter is zero, then Δ ρ m = ρ m .
The nuclear contribution will be controlled by the SLD values for the particles ( ρ p ) and the medium/matrix ( ρ m e d ), while the magnetic contribution from a magnetic particle of volume V m is related to the local magnetization through the “magnetic contrast density” Δ ρ m . The magnetic contribution will be controlled by the atomic SLD ρ m , i :
ρ m , i = p i c i μ i V p ,
where p = ( γ r 0 ) = e 2 γ / ( 2 m c 2 ) = 0.27 × 10 12 cm ( r 0 is the classical radius of the electron and γ = 1.913 is the Landé factor for neutrons). μ i (expressed in Bohr magnetons) is the projection of the magnetic moment of the i th atom onto the plane perpendicular to the scattering wave vector Q , and V i is the atomic volume. c i is the atomic population fraction of the ith magnetic species (carrying a magnetic moment μ i ) present in the particles. In this expression, it is implicitly assumed that 2 π / Q is large enough compared to the atom size so that the atomic form factor f i ( Q ) is very close to 1. For a macroscopic assembly of magnetic atoms forming a particle of volume V p , the SLD ρ m is given by
ρ m = p μ m V p ,
where μ m is the projection of the magnetic moment of the MNP perpendicular to Q .
The magnetic form factor of the MNP is defined as
F M ( Q ) = V m ( Δ ρ m ) F M , g e o ( Q ) ,
where F M , g e o ( Q ) is the magnetic geometrical (dimensionless) form factor of the following particles:
F N , g e o ( Q ) = 1 V p . V p exp ( i . Q . r ) . dr ,
and V m and Δ ρ m are the MNP “magnetic” volume and SLD magnetic contrast, respectively.
The magnetic scattering becomes
I M ( Q ) = N p V F M 2 ( Q ) = N p V V m 2 ( Δ ρ m ) 2 F M , g e o 2 ( Q ) = ϕ m V m ( Δ ρ m ) 2 F M , g e o 2 ( Q ) .
The total SANS intensity will be the direct sum of nuclear and magnetic scatterings (Equations (A7) and (A12)).

Appendix A.3. Scattering of Magnetized Particles

The term Δ ρ m controls the thermodynamics of the magnetic SANS signal, and it depends on several factors: temperature, magnetic field strength and direction, and magnetization strength and direction. Under a magnetic field H making an angle α with respect to the scattering vector Q , one considers the orientational probability of the magnetization of the following particles [27,28]:
P ( x ) = 1 ( 4 π ) 2 x . exp ( x ) sinh ( x ) ,
where x is related to the saturated magnetic moment of the particles μ m S , the total magnetic field H t o t , and the temperature k B T : x = μ m S H t o t / k B T . μ m S is the saturation magnetization which can be expressed as a function of the particle’s total spin S p through μ m S = ( g μ B ) S p ( S p + 1 ) . The dimensionless parameter x dictates the energy balance between the magnetization reversal energy and the thermal energy. The total magnetic field H t o t is the sum of the external magnetic field and the internal fields (dipolar, anisotropy, etc.). Neglecting inter-particle interactions and magneto-crystalline anisotropy, the magnetic moment follows the Langevin statistics, μ m = μ m S L ( x ) where L ( x ) = coth ( x ) ( 1 / x ) . If dipolar interactions are present, we may define a mean-field effective model for the the sample magnetization: L ( x ) becomes L ( x ) where x is expressed, self-consistently, as a function of the Langevin function: x = x + κ L ( x ) . The numerical factor κ depends on the dipolar field strength as: κ ( μ 0 / r 3 ) ( μ 2 / k B T ) where μ 0 is the vacuum permeability and r is the mean inter-particle direction. The magnetic SANS intensity, from non-polarized neutrons, of an assembly of non-interacting MNP under a magnetic field is then
I M ( Q ) = N p V V m 2 ( Δ ρ m S ) 2 1 3 L ( x ) x sin 2 α + 2 L ( x ) x F M , g e o 2 ( Q ) ,
where α is the angle between the magnetization direction μ and the scattering wave-vector Q , Δ ρ m , S = p i c i μ i S / μ B is the magnetic SLD of the particles at magnetic saturation with p = 0.27 × 10 12 cm, and c i is the atomic concentration of the i th species carrying a saturated atomic magnetic moment μ i S . The saturated magnetic moment of a particle can be written as μ S = V m i c i μ i S , thus we one obtains
Δ ρ m , S = p V m μ S μ B .
The above expression is correct providing that there is a perfect alignment between the magnetization μ and external magnetic field B . In the more general case where the alignment is not perfect [29], one has to modify the expression and replace “ sin 2 α ” by ( cos ϕ cos α cos α ) , where α is still the angle between μ and Q , α is the angle between B and Q , and ϕ is the angle between μ and B . When the magnetic vector is parallel to the magnetic field, we have α = α and ϕ = 0 and we recover the sin 2 α dependence.
We can easily consider two limiting situations: x 0 and x .
  • For x 0 (high temperature and/or low field), L ( x ) x / 3 and thus
    I M ( Q ) = N p V V m 2 ( Δ ρ m S ) 2 2 3 F M , g e o 2 ( Q ) .
    There is an equiprobable distribution of magnetization directions and the factor 2 / 3 originates from the orientational average of the magnetization vector.
  • For x (low temperature and/or high field), L ( x ) 1 and thus
    I M ( Q ) = N p V V m 2 ( Δ ρ m S ) 2 sin 2 α F M , g e o 2 ( Q ) .
    This is the expression for fully magnetized particles.
We now consider the observable magnetic scattering using polarized incoming neutrons but with no polarization analysis of the scattered neutrons [29,30,31]. We assume that the magnetic moments of the particles and the polarization vector of the neutron beam are parallel to the external magnetic field. The total scattering intensities, including both nuclear and magnetic scattering, for the two polarizations become then
I ± ( Q ) = F ˜ N 2 + ( F ˜ M 2 2 P F ˜ N F ˜ M ) sin 2 α ,
where P is the polarization defined as P = ( n + n ) / ( n + + n ) 0.9–1.0 with n + and n , the number of “up” and “down” neutrons, respectively. The angle α is the angle between the external magnetic field B and the scattering wave vector Q . ϵ is the spin-flipper efficiency. In Equation (A18), F ˜ N 2 and F ˜ M 2 are the nuclear and magnetic form factors, respectively:
F ˜ N 2 = N p V V p 2 ( Δ ρ ) 2 F N , g e o 2 ( Q ) F ˜ M 2 = N p V V m 2 ( Δ ρ m ) 2 F M , g e o 2 ( Q ) .
The sum and difference of the two intensities, I + and I , are commonly considered in the SANS data analysis:
Σ I ( Q ) = I + ( Q ) + I ( Q ) = 2 F ˜ N 2 + 2 F ˜ M 2 + F ˜ N F ˜ M P ( ϵ 1 ) sin 2 α Δ I ( Q ) = I ( Q ) I + ( Q ) = 2 P ( 1 + ϵ ) F ˜ N F ˜ M sin 2 α .
If the flipper efficiency is close to perfection ( ϵ = 1 ) and the polarization factor at its maximum, P = 1 , the equations simplify somewhat as
Σ I ( Q ) = 2 F ˜ N 2 + 2 F ˜ M 2 sin 2 α Δ I ( Q ) = 4 F ˜ N F ˜ M sin 2 α .
Σ I ( Q ) is equivalent to the expression for non-polarized neutrons through
1 2 Σ I ( Q ) = F ˜ N 2 + F ˜ M 2 sin 2 α = I N ( Q ) + I M ( Q ) .
Using the same Langevin approach as for non-polarized neutrons, the SANS intensities I + ( Q ) and I ( Q ) in the case of a non-perfect alignment of the particle magnetic moments along the magnetic field are
I ± ( Q ) = F ˜ N 2 + F ˜ M 2 2 P F ˜ N F ˜ M L ( x ) sin 2 α + F ˜ M 2 2 L ( x ) / x Y ( x ) sin 2 α ,
where x = μ m S H t o t / k B T , L ( x ) = coth ( x ) ( 1 / x ) and Y ( x ) = L 2 ( x ) 1 + 3 L ( x ) / x . The last term results only from the non-perfect alignment of the magnetic moments of individual particles. It vanishes when the alignment is perfect. The difference Δ I ( Q ) thus becomes
Δ I ( Q ) = I ( Q ) I + ( Q ) = 2 P ( 1 + ϵ ) F ˜ N F ˜ M L ( x ) sin 2 α .
In order to be able to derive experimentally the various relevant parameters, we now evaluate I ± ( Q ) for special directions of Q with respect to the external field and/or magnetization direction.
For α = 0 (which will be the case if H / / M / / Q ), we have
I α = 0 ± ( Q ) = F ˜ N 2 + F ˜ M 2 2 L ( x ) / x .
For α = π / 2 (which will be the case if H / / M Q ), we have (assuming here ϵ = 1 )
I α = π / 2 ± ( Q ) = F ˜ N 2 + F ˜ M 2 1 L ( x ) / x 2 P F ˜ N F ˜ M L ( x ) ,
so that, by difference,
Δ I α = π / 2 ( Q ) = 4 P F ˜ N F ˜ M L ( x ) .
Experimentally, the nuclear (magnetic) form factor, F ˜ N ( Q ) ( F ˜ M ( Q ) ) can then be extracted independently using the PSANS data along two special directions of the 2D scattering map, α = 0 and α = π / 2 :
F ˜ N ( Q ) ( x ) = I α = 0 ± ( Q ) ,
and
F ˜ M ( Q ) = Δ I α = π / 2 ( Q ) 4 P F ˜ N ( Q ) L ( x ) .
Thus,
F ˜ M ( Q ) L ( x ) = Δ I α = π / 2 ( Q ) 4 P I α = 0 ± ( Q ) .
The experimental ratio χ M ( Q ) = F ˜ M ( Q ) / F ˜ N ( Q ) can thus be directly derived:
χ M ( Q ) = F ˜ M ( Q ) F ˜ N ( Q ) = V m V p | Δ ρ m | | Δ ρ p | F M , g e o F N , g e o .
In the special case of uniformly magnetized MNP ( F M , g e o = F N , g e o ) and knowing that Δ ρ m = ρ m = ( p / V m ) . ( μ S / μ B ) , it follows that
χ M ( Q ) = p ( μ S / μ B ) V p | Δ ρ p | .

Appendix A.4. Geometrical Form Factors

The form factor F N , g e o ( Q ) for a perfect spherical object of radius R is given by
F N , g e o ( Q ) = 3 J 1 ( Q R ) Q R ,
where J 1 ( x ) is the Bessel function J 1 ( x ) = ( sin x x cos x ) ) / x 2 with x = Q R .
The nuclear SANS intensity of scattering for an assembly of N p independent spherical particles of radius R and volume V p in a sample volume V is thus
I N ( Q ) = ϕ V p ( Δ ρ ) 2 3 J 1 ( Q R ) Q R 2 ,
where ϕ = ( N p V p ) / V is the volume occupation fraction of the particles in the sample. Note that, in the low-Q limit, we have F N , g e o ( Q ) exp ( Q 2 R g 2 / 3 ) . This expression is only valid in the regime Q R g 1 where R g = 3 / 5 R = 0.77 R is the gyration radius of a spherical particle.
The form factor for a core-shell spherical object consisting in a core volume V c (of radius R c ) and a total (core+shell) volume V s (of radius R s ) is
F N , g e o ( Q ) = ( ρ c ρ s ) V c 3 J 1 ( Q R c ) Q R c + ( ρ s ρ m e d ) V s 3 J 1 ( Q R s ) Q R s ,
where ρ c , ρ s , and ρ m e d are the mean SLDs of the core, the outer shell, and the solvent/matrix, respectively. The nuclear SANS intensity of scattering for an assembly of N p independent spherical core-shell particles of core radius R c and outer radius R s in a sample volume V is thus
I N ( Q ) = N p V ( ρ c ρ s ) V c 3 J 1 ( Q R c ) Q R c + ( ρ s ρ m e d ) V s 3 J 1 ( Q R s ) Q R s 2 .
In most cases, we have a measurable size distribution of the particles. For a Gaussian distribution of spherical and homogeneous particles centered around R with a standard deviation σ , the SANS intensity is [21]
I N ( Q ) = N p V 8 π 2 ( Δ ρ ) 2 Q 6 1 + Q 2 ( R 2 + σ 2 ) F ( Q , R , σ ) exp 2 ( Q σ ) 2 I N ( Q ) = ϕ V p ( Δ ρ ) 2 9 / 2 ( Q R ) 6 1 + Q 2 ( R 2 + σ 2 ) F ( Q , R , σ ) exp 2 ( Q σ ) 2 ,
where V p is the average volume ( ( 4 π / 3 ) R 3 ) and F ( Q , R , σ ) is:
F ( Q , R , σ ) = [ 1 Q 2 ( R 2 3 σ 2 ) + 4 ( Q σ ) 4 ] cos ( 2 Q R ) + 2 Q R [ 1 + 2 ( Q σ ) 2 ] sin ( 2 Q R ) .

References

  1. Krahne, R.; Morello, G.; Figuerola, A.; George, C.; Deka, S.; Manna, L. Physical properties of elongated inorganic nanoparticles. Phys. Rep. 2011, 501, 75–221. [Google Scholar] [CrossRef]
  2. Prado, Y.; Lisnard, L.; Heurtaux, D.; Rogez, G.; Gloter, A.; Stéphan, O.; Dia, N.; Rivière, E.; Catala, L.; Mallah, T. Tailored coordination nanoparticles: Assessing the magnetic single-domain critical size. Chem. Commun. 2011, 47, 1051. [Google Scholar] [CrossRef] [PubMed]
  3. Bohra, M.; Alman, V.; Showry, A.; Singh, V.; Diaz, R.E.; Sowwan, M.; Grammatikopoulos, P. Aggregation vs Surface Segregation: Antagonism over the Magnetic Behavior of NiCr Nanoparticles. ACS Omega 2020, 5, 32883. [Google Scholar] [CrossRef]
  4. Bohra, M.; Battula, S.V.; Alman, V.; Annadi, A.; Singh, V. Design of various NiCr nanostructures and deducing their magnetic anisotropy. Appl. Nanosci. 2023, 13, 3205. [Google Scholar] [CrossRef]
  5. Bedanta, S.; Kleemann, W. Supermagnetism. J. Phys. D Appl. Phys. 2009, 42, 013001. [Google Scholar] [CrossRef]
  6. Catala, L.; Volatron, F.; Brinzei, D.; Mallah, T. Functional Coordination Nanoparticles. Inorg. Chem. 2009, 48, 3360. [Google Scholar] [CrossRef]
  7. Nakotte, H.; Shrestha, M.; Adak, S.; Boergert, M.; Zapf, V.S.; Harrison, N.; King, G.; Daemen, L.L. Magnetic properties of some transition-metal Prussian Blue Analogs with composition M[M(C,N)].xHO. J. Sci. Adv. Mater. Devices 2016, 1, 113. [Google Scholar] [CrossRef]
  8. Catala, L.; Gacoin, T.; Boilot, J.-P.; Rivière, E.; Paulsen, C.; Lhotel, E.; Mallah, T. Cyanide-Bridged CrIII–NiII Superparamagnetic Nanoparticles. Adv. Mater. 2003, 15, 826. [Google Scholar] [CrossRef]
  9. Prado, Y.; Mazérat, S.; Rivière, E.; Rogez, G.; Gloter, A.; Stéphan, O.; Catala, L.; Mallah, T. Magnetization Reversal in CsNiIICrIII(CN)6 Coordination Nanoparticles: Unravelling Surface Anisotropy and Dipolar Interaction Effects. Adv. Funct. Mater. 2014, 24, 5402. [Google Scholar] [CrossRef]
  10. Gadet, V.; Mallah, T.; Castro, I.; Verdaguer, M.; Veillet, P. High-TC molecular-based magnets: A ferromagnetic bimetallic chromium(III)-nickel(II) cyanide with TC = 90 K. J. Am. Chem. Soc. 1992, 114, 9213–9214. [Google Scholar] [CrossRef]
  11. Ridier, K.; Gillon, B.; André, G.; Chaboussant, G.; Catala, L.; Mazérat, S.; Mallah, T. Small-angle neutron scattering study of the short-range organization of dispersed CsNi[Cr(CN)6]. J. Appl. Phys. 2015, 118, 114304. [Google Scholar] [CrossRef]
  12. Ridier, K.; Gillon, B.; Chaboussant, G.; Catala, L.; Mazérat, S.; Rivière, E.; Mallah, T. Individual-collective crossover driven by particle size in dense assemblies of superparamagnetic nanoparticles. Eur. Phys. J. B 2017, 90, 77. [Google Scholar] [CrossRef]
  13. Lee, S.H.; Lee, D.H.; Jung, H.; Han, Y.-S.; Kim, T.-H.; Yang, W. Magnetic properties of SiO2-coated iron oxide nanoparticles studied by polarized small angle neutron scattering. Curr. Appl. Phys. 2015, 15, 915. [Google Scholar] [CrossRef]
  14. Kons, C.; Phan, M.-H.; Srikanth, H.; Arena, D.A.; Nemati, Z.; Borchers, J.A.; Krycka, K.L. Investigating spin coupling across a three-dimensional interface in core/shell magnetic nanoparticles. Phys. Rev. Mater. 2020, 4, 034408. [Google Scholar] [CrossRef]
  15. Honecker, D.; Ferńandez-Barquín, L.; Bender, P. Magnetic structure factor of correlated moments in small-angle neutron scattering. Phys. Rev. B 2020, 101, 134401. [Google Scholar] [CrossRef]
  16. Oberdick, S.D.; Borchers, J.A.; Krycka, K.L. Magnetic correlations of iron oxide nanoparticles as probed by polarized SANS in stretched magnetic nanoparticle elastomer composites. Appl. Phys. Lett. 2022, 120, 052401. [Google Scholar] [CrossRef]
  17. Honecker, D.; Bersweiler, M.; Erokhin, S.; Berkov, D.; Chesnel, K.; Venero, D.A.; Qdemat, A.; Disch, S.; Jochum, J.K.; Michels, A.; et al. Using small-angle scattering to guide functional magnetic nanoparticle design. Nanoscale Adv. 2022, 4, 1026. [Google Scholar] [CrossRef]
  18. Das, B.; Batley, J.T.; Krycka, K.L.; Borchers, J.A.; Quarterman, P.; Korostynski, C.; Nguyen, M.; Kamboj, I.; Aydil, E.S.; Leighton, C. Chemically Induced Magnetic Dead Shells in Superparamagnetic Ni Nanoparticles Deduced from Polarized Small-Angle Neutron Scattering. ACS Appl. Mater. Interfaces 2022, 14, 33491. [Google Scholar] [CrossRef]
  19. Kons, C.; Krycka, K.L.; Robles, J.; Ntallis, N.; Pereiro, M.; Phan, M.-H.; Srikanth, H.; Borchers, J.A.; Arena, D. Influence of Hard/Soft Layer Ordering on Magnetization Reversal of Bimagnetic Nanoparticles: Implications for Biomedical/Theranostic Applications. ACS Appl. Nano Mater. 2023, 6, 10986. [Google Scholar] [CrossRef]
  20. Mülhbauer, S.; Honecker, D.; Périgo, É.A.; Bergner, F.; Disch, S.; Heinemann, A.; Erokhin, S.; Berkov, D.; Leighton, C.; Eskildsen, M.R.; et al. Magnetic small-angle neutron scattering. Rev. Mod. Phys. 2019, 91, 015004. [Google Scholar] [CrossRef]
  21. Belloni, L. La Diffusion de Neutrons aux Petits Angles: Mécanique statistique des liquides et traitement des données. Collection SFN 2010, 11, 71. [Google Scholar] [CrossRef]
  22. Bersweiler, M.; Oba, Y.; Pratami Sinaga, E.; Peral, I.; Titov, I.; Adams, M.P.; Rai, V.; Metlov, K.L.; Michels, A. Fingerprint of vortexlike flux closure in an isotropic Nd-Fe-B bulk magnet. Phys. Rev. 2023, 108, 094434. [Google Scholar] [CrossRef]
  23. Adams, M.P.; Michels, A.; Kachkachib, H. Magnetic neutron scattering from spherical nanoparticles with Néel surface anisotropy: Atomistic simulations. J. Appl. Cryst. 2022, 55, 1488. [Google Scholar] [CrossRef]
  24. Chaboussant, G.; Désert, S.; Brûlet, A. Recent developments and projects in SANS instrumentation at LLB-Orphée. Eur. Phys. J. Spec. Top. 2012, 213, 313. [Google Scholar] [CrossRef]
  25. Chaboussant, G.; Désert, S.; Lavie, P.; Brûlet, A. PA20: A new SANS and GISANS project for soft matter, materials and magnetism. J. Phys. Conf. Ser. 2012, 340, 012002. [Google Scholar] [CrossRef]
  26. Dewhurst, C.D. Graphical reduction and analysis small-angle neutron scattering program: GRASP. J. Appl. Crystallogr. 2023, 56, 1595. [Google Scholar] [CrossRef]
  27. Kodama, R.H.; Berkowitz, A.E.; McNiff, E.; Foner, S. Surface spin disorder in NiFe2O4 nanoparticles. Phys. Rev. Lett. 1996, 77, 394. [Google Scholar] [CrossRef]
  28. Mirebeau, I.; Hennion, M. Diffusion de neutrons aux petits angles (DNPA) et magnétisme: Concepts et applications. J. Phys. IV 1999, 9, 51. [Google Scholar] [CrossRef]
  29. Wiedenmann, A.; Kammel, M.; Heinemann, A.; Keiderling, U. Nanostructures and ordering phenomena in ferrofluids investigated using polarized small angle neutron scattering. J. Phys. Cond. Mat. 2006, 18, 2713. [Google Scholar] [CrossRef]
  30. Wiedenmann, A. Polarized SANS for probing magnetic nanostructures. Physica B 2005, 356, 246. [Google Scholar] [CrossRef]
  31. Disch, S.; Wetterskog, E.; Hermann, R.P.; Wiedenmann, A.; Vainio, U.; Salazar-Alvarez, G.; Bergström, L.; Brückel, T. Quantitative spatial magnetization distribution in iron oxide nanocubes and nanospheres by polarized small-angle neutron scattering. New J. Phys. 2012, 14. [Google Scholar] [CrossRef]
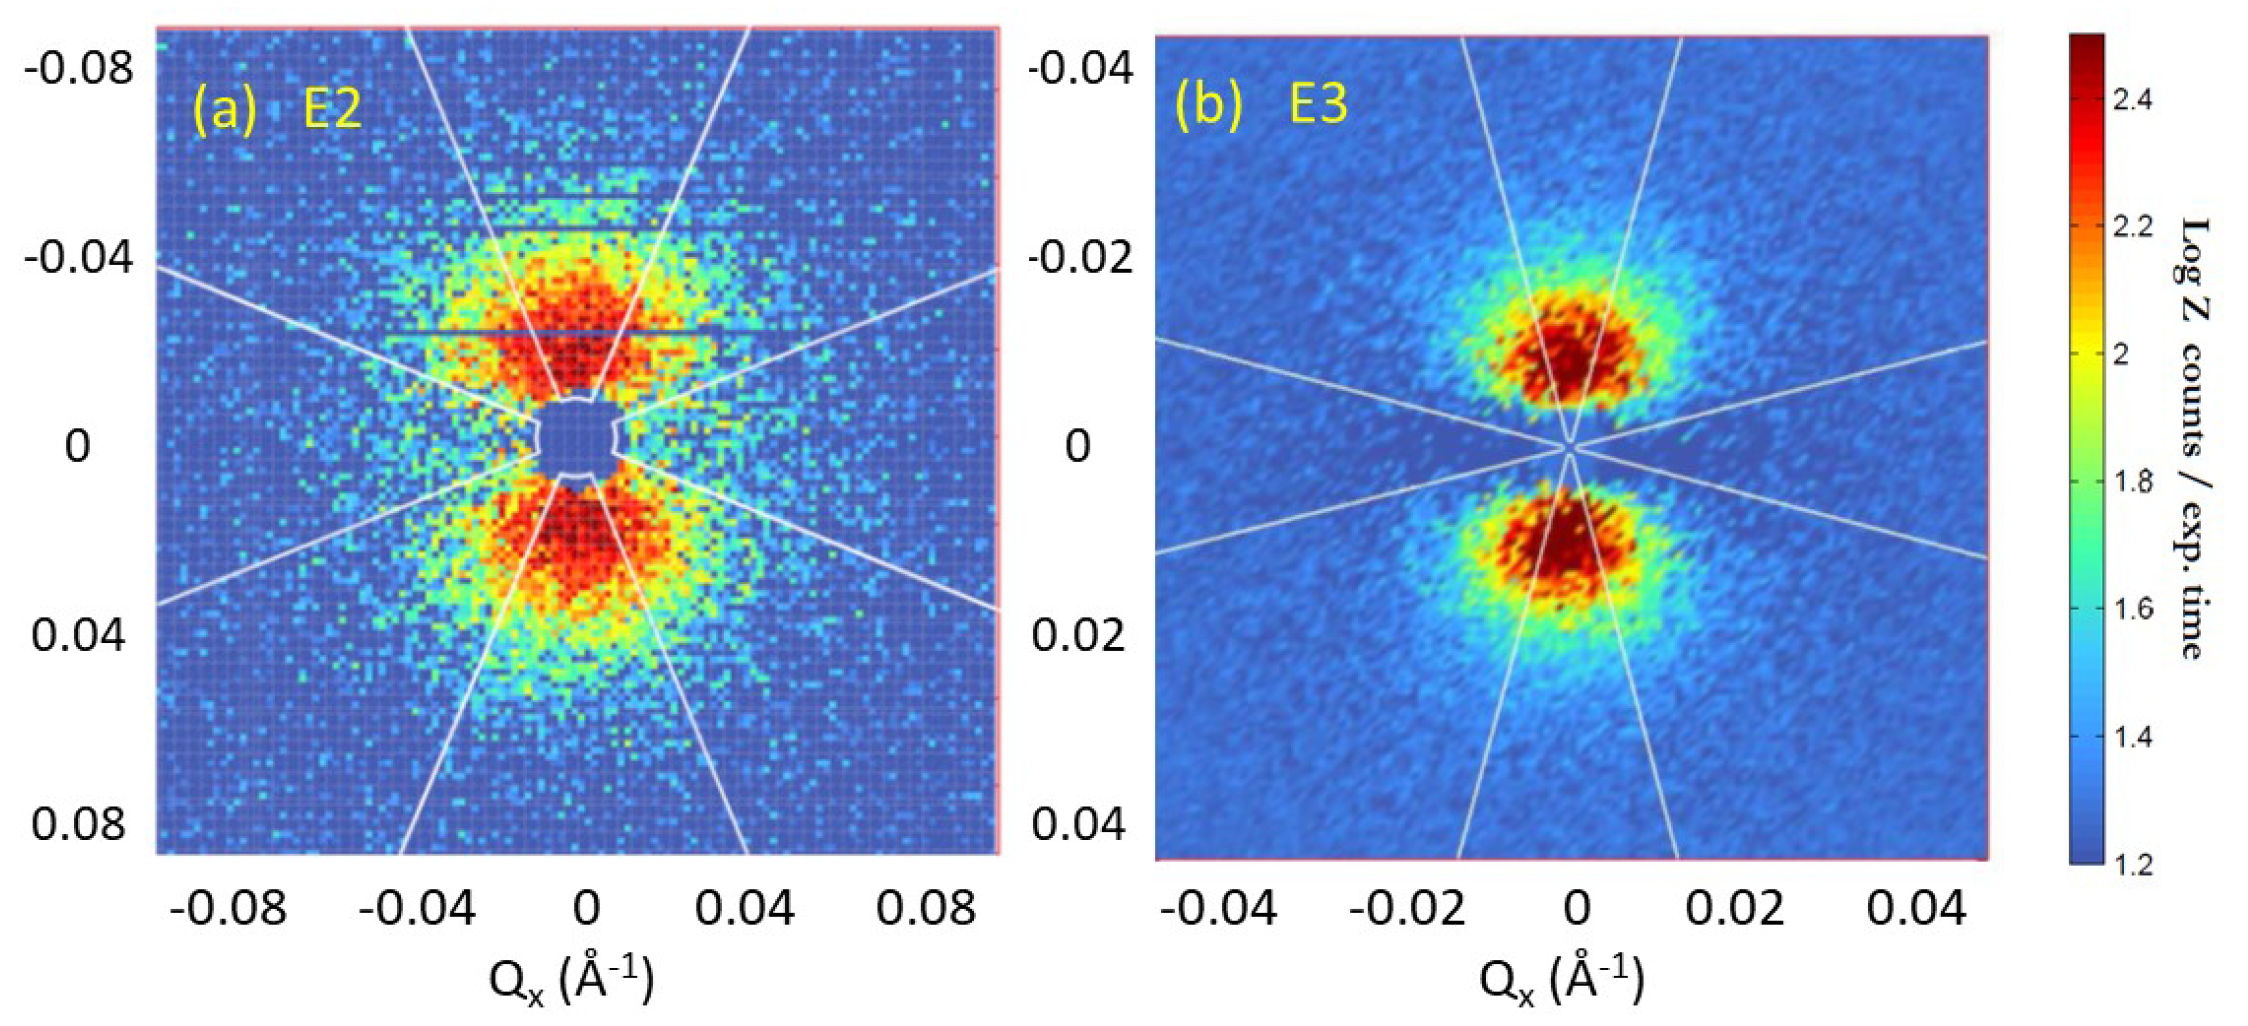
Figure 1. Polarized SANS of Sample E2 CsNiCr (left panel) and Sample E3 CsNiCr (right panel) obtained on the PA20 beam line at LLB at T = 5 K and under a saturating magnetic field. The images show the differential (magnetic) scattering data Δ I ( Q ) between SANS patterns obtained with neutron polarizations “+” and “−” ( Δ I ( Q ) = I ( Q ) I + ( Q ) ). The PA20 Instrument configurations used are as follows: (a) left panel: λ = 5 Å + d S D = 4.2 m, T = 5 K, B = 15 mT; (b) right panel: λ = 5 Å + d S D = 8.7 m, T = 10 K, B = 500 mT. The shown Q-range is Q = 0 0.09 Å−1 and Q = 0 0.05 Å−1 for the left and right panels, respectively. The color intensity is on a linear scale with deep blue corresponding to Δ I ( Q ) = 0 . Sectorial cuts (horizontal [ α = 0 ] and vertical [ α = π / 2 ] cuts, with angular spread ± 20 (E2) and ± 15 (E1), are represented as solid white lines).
Inorganics 13 00202 g001
Figure 2. Polarized SANS of Sample E2 CsNiCr obtained on the PA20 beam line at LLB at several temperatures between 10K and 60K. The instrument configuration is similar to the data shown in Figure 1 (left), and the images show the differential (magnetic) scattering data Δ I ( Q ) . The PA20 Instrument configuration is λ = 5 Å + d S D = 4.2 m. The color intensity is on a linear scale with deep blue corresponding to Δ I ( Q ) = 0 . Sectorial cuts (horizontal [ α = 0 ] and vertical [ α = π / 2 ] cuts represented as solid white lines with angular spread ± 15 ) are used in the following to extract the nuclear and magnetic form factors as detailed in Appendix A.3.
Inorganics 13 00202 g002
Figure 3. Left panel: Nuclear and magnetic form factors F N 2 ( Q ) and F M 2 ( Q ) of E2 MNP at 10 K and 15 mT. Right panel: F N 2 ( Q ) and F M 2 ( Q ) of the E3 MNP at 20 K and 500 mT. The 1D experimental curves are derived from 2D SANS patterns after extracting 1D sectorial cuts along “ α = 0 ” and “ α = π / 2 ” (as discussed in Figure 1 and Figure 2 and detailed in Appendix A.3). The continuous solid lines are best fits to the data using a spherical model with a Gaussian size distribution (see Equation (A38)). The inset panel in each main panels shows the ratio χ M ( Q ) = F M ( Q ) / F N ( Q ) .
Inorganics 13 00202 g003
Figure 4. Left panel: Magnetic form factor F M 2 ( Q ) of E2 MNP at 15 mT and varied temperatures (5–70 K). The 5 K/500 mT data is also shown for comparison with the E2 MNP data. Right panel: Magnetic form factor F M 2 ( Q ) of E3 MNP at 500 mT and varied temperatures (20–120 K). The 1D experimental curves are derived from 2D SANS patterns after extracting 1D sectorial cuts along “ α = 0 ” and “ α = π / 2 ” as explained in the text (see Appendix A). The continuous line represents the nuclear form factor F N 2 ( Q ) scaled by 1/3 so as to compare with the overall shape of F M 2 ( Q ) .
Inorganics 13 00202 g004
Figure 5. Left panel: Temperature dependence of χ M ( Q ) for the E2 MNP at 15 mT and varied temperatures (5–70 K). χ M ( Q ) for 5 K and 500 mT is also shown for comparison. Right panel: χ M ( Q ) for the E3 MNP at 500 mT and varied temperatures (20–120 K).
Inorganics 13 00202 g005
Disclaimer/Publisher’s Note: The statements, opinions and data contained in all publications are solely those of the individual author(s) and contributor(s) and not of MDPI and/or the editor(s). MDPI and/or the editor(s) disclaim responsibility for any injury to people or property resulting from any ideas, methods, instructions or products referred to in the content.