Article

Insight into the Oxygen-Sensing Mechanisms of TiO2–CeO2 Mixed Oxides Treated in a High-Energy Ball Mill: An XPS Analysis

by
Jelena N. Stevanović
1,*,
Ana G. Silva
2,
Nenad Bundaleski
2,
Dana Vasiljević-Radović
1,
Milija Sarajlić
1,
Orlando M. N. D. Teodoro
2 and
Srđan P. Petrović
1
1
Institute of Chemistry, Technology and Metallurgy, University of Belgrade, Njegoševa 12, 11000 Belgrade, Serbia
2
CeFiTec, Nova School of Science and Technology, New University of Lisbon, Campus da Caparica, 2829-516 Caparica, Portugal
*
Author to whom correspondence should be addressed.
Inorganics 2025, 13(5), 159; https://doi.org/10.3390/inorganics13050159
Submission received: 12 April 2025 / Revised: 6 May 2025 / Accepted: 8 May 2025 / Published: 9 May 2025
(This article belongs to the Special Issue Advanced Inorganic Semiconductor Materials, 3rd Edition)

Abstract

This study explored the oxygen-sensing mechanism of CeO2 modified with TiO2 via high-energy ball milling at different speeds. Different characterization techniques were employed to investigate the obtained materials. Quantitative surface analysis by X-ray photoelectron spectroscopy was conducted to elucidate their sensitivity mechanisms and assess the impact of the introduction of TiO2. A comparable concentration of oxygen vacancies was found in the samples milled at 350 and 450 rpm. Electrical measurements conducted at temperatures lower than required for semiconductor gas sensors revealed the higher sensitivity of these two samples in comparison to pure CeO2 at an oxygen concentration above 10%. In contrast, the samples derived from precursors milled at the highest speed exhibited the lowest sensitivity. This may be linked to a slight decrease in the vacancy concentration and the presence of a differentially charged carbon-containing phase. Eventually, the C 1s line provided significant insight into the surface characteristics of the materials. The uniform and non-uniform charging found for pure TiO2 and CeO2, respectively, along with the high charging of CeO2, suggest that TiO2 promotes the contact between the sensing layer and the overlayer. Sensor testing showed the significantly lower resistance of mixed oxides in comparison to CeO2, which increases the utility of metal oxide-based sensors.

Graphical Abstract

1. Introduction

The increase in CO2 emissions dates back to the Industrial Revolution and continues to this day [1]. The main contribution comes from human activities, primarily the burning of fossil fuels for electricity, heat, and transport. An effective way to reduce the carbon footprint is to control the internal combustion conditions of engines within the power and heating sectors. To achieve this, a reliable and fast response by the sensor used for monitoring the oxygen concentration is necessary [2]. Accurate oxygen measurement is also of great importance in a variety of industrial environments to predict hazards in real time when oxygen levels drop significantly due to oxidation or combustion [3]. Among the many types of oxygen sensors developed over time [4], semiconductor-based oxygen sensors have emerged as the most suitable for a wide range of industrial applications. Their simplicity, cost-effectiveness, and low power consumption make them ideal for integration into distributed sensor networks intended for monitoring the combustion processes and oxygen concentrations [4,5]. Due to its exceptional oxygen storage capacity, cerium dioxide (CeO2) is one of the most commonly used materials for oxygen-sensing applications. CeO2 efficiently absorbs and releases oxygen in response to changes in its concentration due to the reversible and fast Ce4+–Ce3+ redox transition. CeO2−x is a non-stoichiometric form of the oxide with a certain amount of Ce3+, accompanied by the creation of nearby oxygen vacancies that act as electron donors to chemisorbed oxygen [4,6,7,8,9]. CeO2 exhibits the highest oxygen sensitivity at a temperature of approximately 600–700 °C [4]. However, its poor thermostability leads to sintering at elevated temperatures, which significantly reduces its oxygen storage [10] and long-term response stability [4,6]. At lower temperatures, electrical measurements of metal oxide-based gas sensors often encounter difficulties due to the inherently high resistance of oxides [11]. A widely studied method for enhancing the electronic, catalytic, and sensing properties of metal oxide-based sensors is the introduction of a second oxide [6,12,13]. Over the past two decades, research has identified TiO2 as a particularly promising dopant for this purpose [14,15,16,17]. Various methods have been used for the preparation of TiO2–CeO2 materials, such as hydrothermal, co-precipitation, sol–gel, microemulsion, and incipient wetness impregnation [18]. In response to the growing need for sustainable methods with minimal environmental impact, this study employed high-energy ball milling. This type of mechanochemical synthesis offers significant advantages over conventional methods, including reduced energy consumption, elimination of harmful waste, and avoidance of toxic precursors and multistep procedures. Large quantities of the powder catalysts, alloys and ceramics can be obtained under ambient conditions in a short time span, making mechanochemistry a suitable tool for industrial applications [19,20,21,22,23,24,25,26,27,28,29]. During the milling process, energy is released through collision, shear, and friction between the balls and the reactants, and it is adsorbed by the solid reactants, stimulating chemical reactions. The intense mechanical stress and induced bond breakage lead to structural changes that increase the surface reactivity, decrease the particle and crystallite size, possibly increasing the specific surface area, and introduce dislocations and oxygen vacancies [21,26,27]. Among the numerous parameters that influence the milling process [24], the frequency (rotational speed) and time have been identified as critical [26].
Despite extensive research, the understanding of the sensing behavior of mixed oxide sensors remains insufficient. Since the initial step in the sensing process involves the atomic-level interactions between the oxygen and the top layer of the material [4,11], describing the surface characteristics is essential for elucidating the underlying sensing mechanisms. To this end, we conducted a comprehensive XPS analysis of TiO2-modified CeO2 materials (for simplicity, also referred to as TiO2–CeO2) that were high-energy ball-milled at three different rotational speeds: 350, 450 and 550 rpm. Thick sensing films were subsequently fabricated from the powder precursors. The resulting samples were labeled TiCe-1, TiCe-2, and TiCe-3, corresponding to milling speeds of 350, 450, and 550 rpm, respectively.
Our study focused on several key aspects: the efficiency of creating oxygen vacancies through high-energy ball milling, the effect of TiO2 on these defects, and the characterization of the overall surface chemistry of the resulting materials, including their dependence on the milling speed. Calculations derived via XPS were used to model the outermost surface layer. The structural and morphological properties were analyzed using the particle size distribution (PSD), X-ray diffraction (XRD), 2D profilometry, scanning electron microscopy (SEM), and Raman spectroscopy. By correlating the results of the characterization methods with the sensor response, we aimed to understand how materials’ structural features govern sensing performance. Given the limited research on the sensing properties of mechanochemically treated, TiO2-modified CeO2, this study also contributes to expanding the field of application of this treatment in the sensor fabrication industry.

2. Results

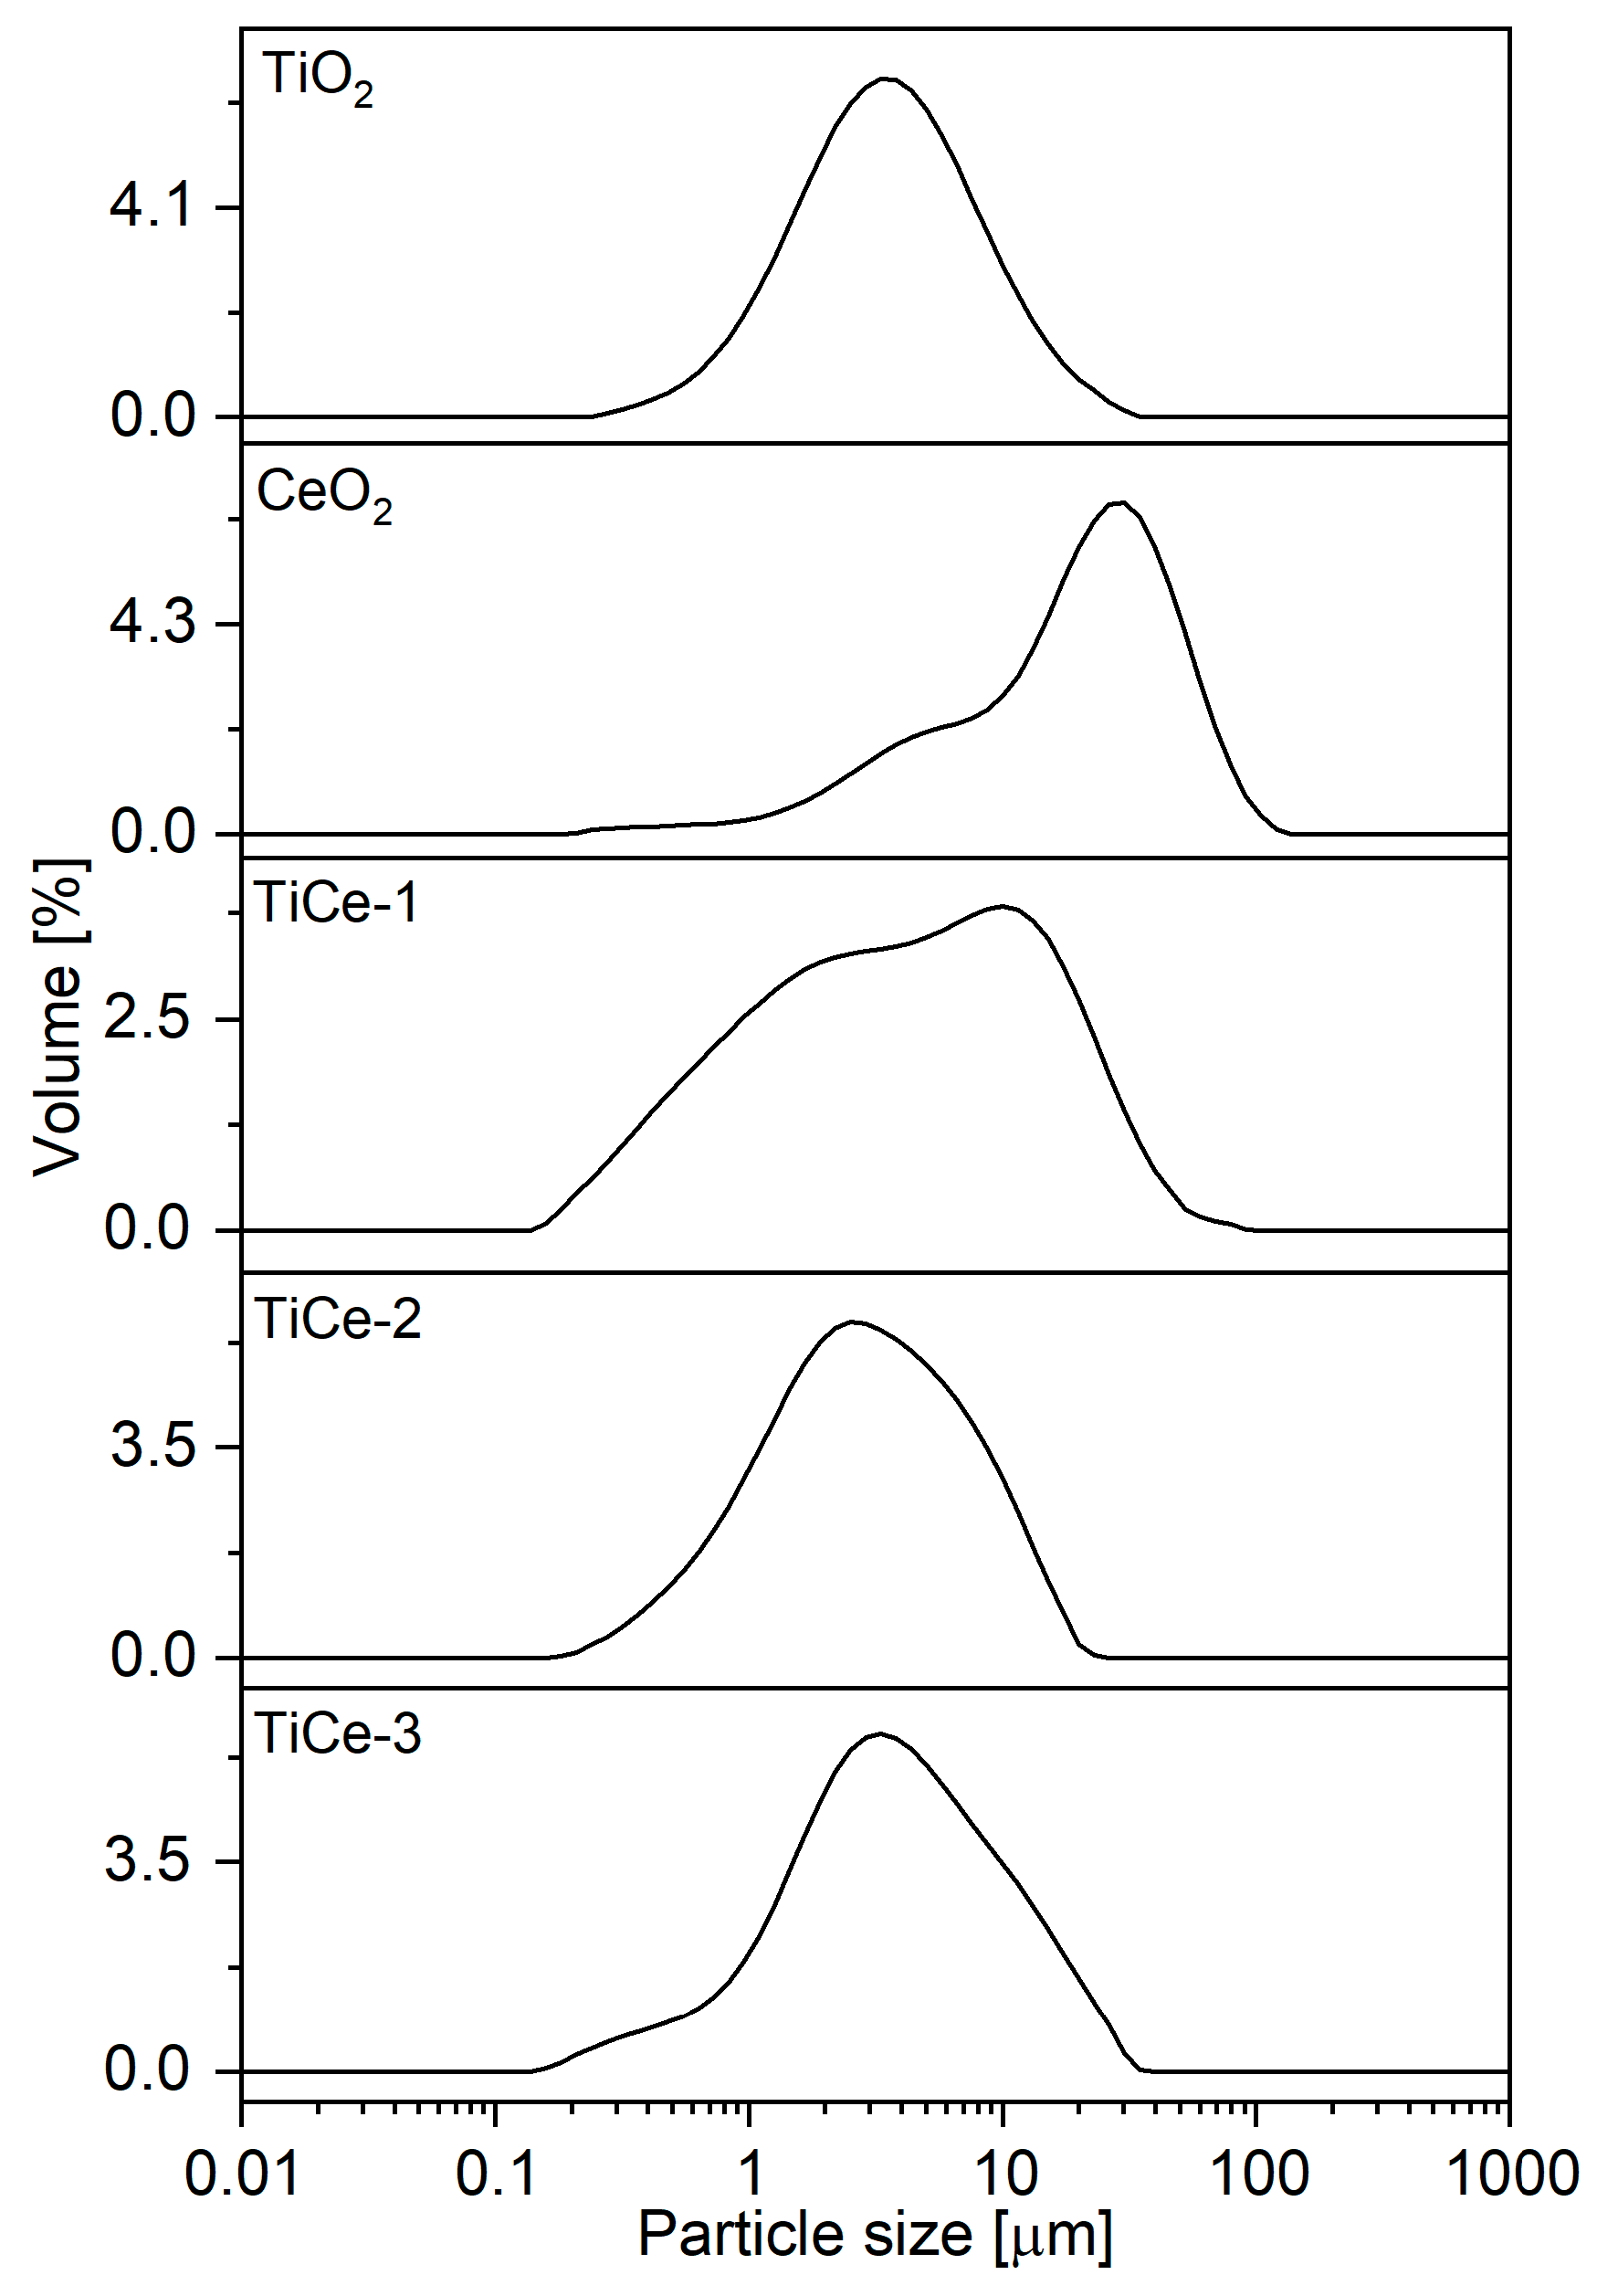
2.1. Particle Size Distribution (PSD) Analysis of Powders

Considering the crucial role of the particle size in affecting the functionality of semiconductor sensors [4,12], it is important to examine the granularity of the obtained ball-milled powders. Figure 1 shows the influence of different milling speeds on the particle size distribution (PSD) of TiO2–CeO2. The following characteristic diameters are listed in Table 1: d10 (10% of particles have a diameter smaller than this value), d50 (median value, sometimes taken as a measure of the average particle size), and d90 (90% of particles are smaller than this value). The width of the distribution is quantified by calculating the span as (d90 − d10)/d50 [30].
The fragmentation of agglomerates during the milling process is noticeable in the extended particle size distribution curve of the TiO2–CeO2 powders [31,32]. The bimodal and extensive distribution of the TiCe-1 powder indicates the lowest particle uniformity among the measured samples. The span of the particle size distributions (2.94) and the disappearance of the bimodal shape suggest the highest uniformity of TiCe-2 among the powders. With a further increase in the rotation speed, the second peak emerges again, and the distribution curve broadens. While the d10 value shows a minimal variation with the milling speed, a significantly greater variation is observed in the larger particle size dimensions, particularly in the d50 and, most notably, in the d90 values. The smallest median particle size is observed for the powder TiCe-2 milled at the second speed, 450 rpm (2.604 µm). The cause of the non-linear change in the particle size is attributed to the impact coefficient and impact frequency of the milling balls, both of which are amplified with the speed [33]. This leads to higher surface energy, and eventually, to particle agglomeration as a mechanism to reduce the energy under intense forces. Notably, the d10 increases linearly with the milling speed, indicating the coalescence of smaller particles and supporting this interpretation of the PSD measurements.

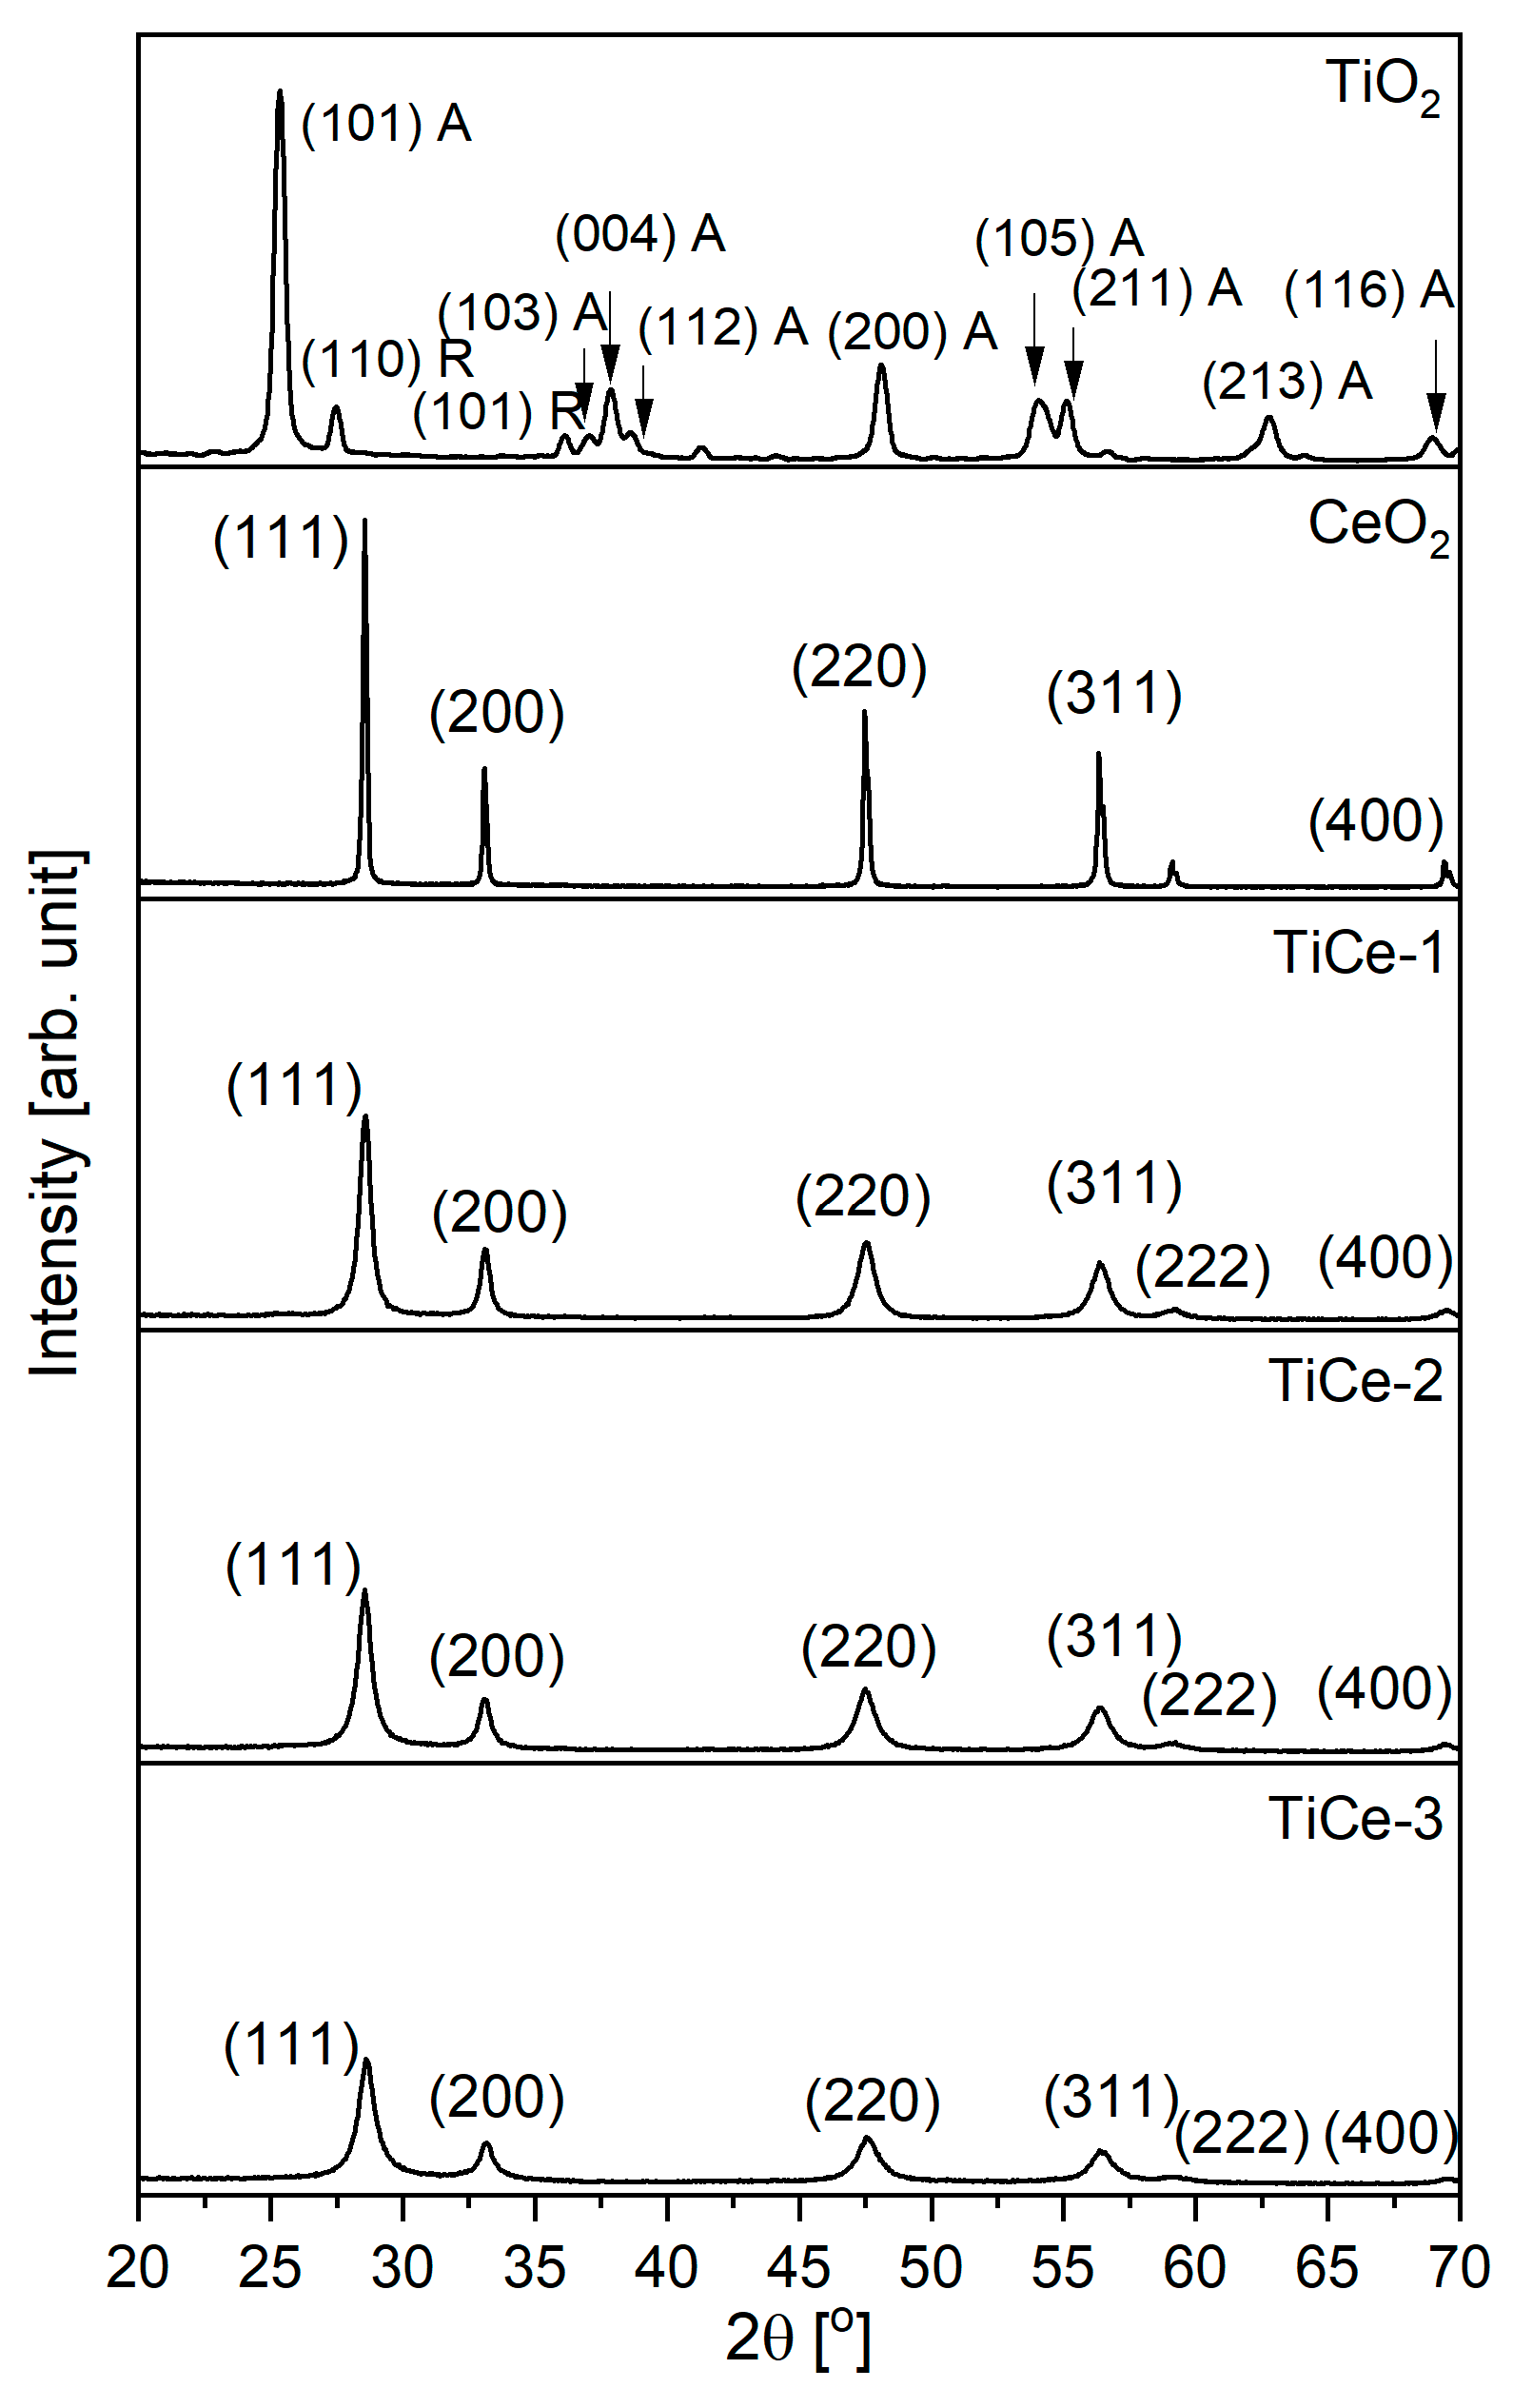
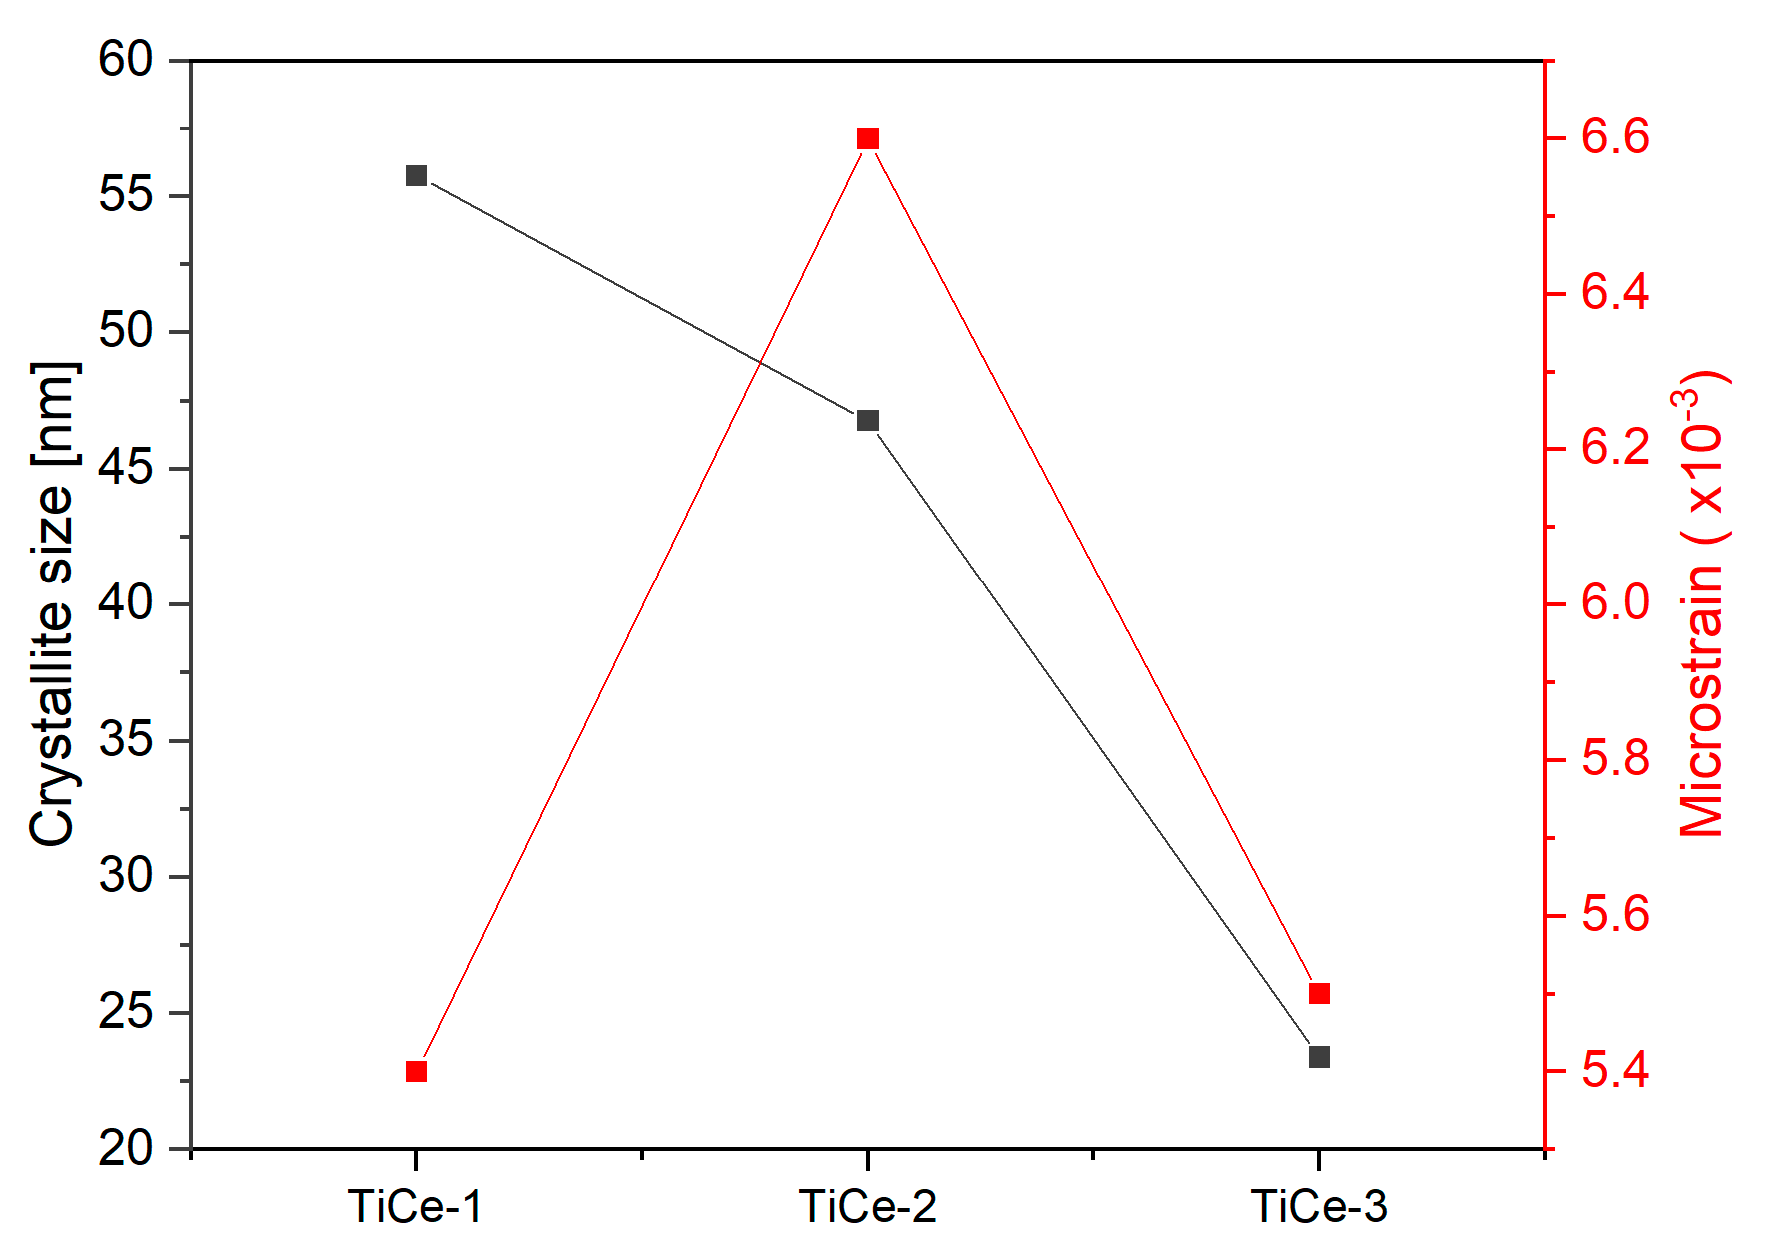
2.2. X-Ray Powder Diffraction (XRPD)

The diffractograms of the isolated and mixed oxide powders are presented in Figure 2. Characteristic reflections of the cubic form of CeO2 were identified in all the samples. The presence of TiO2 was not detected, possibly due to its low weight percentage compared to CeO2 or its small crystallite size [29]. No evidence of a chemical reaction between TiO2 and CeO2 was found, due to the absence of reflections corresponding to new crystal structures in the TiO2–CeO2 diffractograms [34]. This observation indicates a physical mixture of the two oxide phases rather than a chemical interaction.
The data obtained from the analysis of the most intense CeO2 (111) peak in the PANalytical X’pert software (version 4.9) are given in Table 2. Apart from the effect on the particle and crystal size, the synergy of the impact and frictional forces created a certain level of lattice distortion, also known as microstrain [35,36]. The localized atomic displacements induced by the ball milling or chemical dissimilarities showed up as dislocations, vacancies, and stacking faults [37,38]. The change in the particle size is thus a rather complex process influenced by both the surface-to-volume ratio and the lattice distortion [35].
The average crystallite size and microstrain were estimated using the Williamson–Hall plot. The obtained graphs are shown in the Supplementary Materials and numerical data are given in [39]. The results are presented in Figure 3. The analysis of the CeO2 revealed a crystallite size of 78.3 nm and a microstrain of 1.3∙10−4. The gradual weakening of the diffraction peaks indicated a reduction in the degree of crystallinity with an increasing rotation speed [40].
The influence of the mechanical action on the crystallite size was the most pronounced for the sample obtained at the highest milling speed (TiCe-3), whilst the largest lattice strain was found for the sample milled at the medium speed (TiCe-2), with the smallest average particles. The reduction in the lattice strain at the highest speed could be explained as follows: the effect of frictional forces and collisions during the milling led to the creation of so-called hotspots, characterized by a short-term sharp temperature surge in the ball–ball or ball–wall contact region [25,41]. As the milling speed increased, both the friction coefficient and the collision frequency amplified [41,42]. Sufficient localized heating facilitated the recovery and recrystallization processes, thereby minimizing the crystal lattice deformation and promoting grain growth [25,38,43].
The slight up-shift in the CeO2 reflections (Table 2) observed in the TiCe-3 diffractogram indicated a modification of the d-spacing [44,45]. Namely, the shift in the XRD peaks of the mixed oxide system suggested a change in the lattice parameters due to the incorporation of dopants into the host lattice [44]. In the TiO2–CeO2 system, the ionic radius of Ti4+ (0.068 nm) was significantly smaller than that of Ce4+ (0.093 nm) or Ce3+ (0.103 nm), which facilitated the substitution of cerium ions by titanium ions [46]. This resulted in the formation of a fluorite-type crystal structure with the formula Ce1−xTixO2. Such solid solutions of TiO2 and CeO2 have already been well documented in the literature [46,47,48]. Furthermore, the incorporation of Ti4+ into the fluorite-like structure of other tetravalent oxides has also been documented [49]. This may account for the absence of TiO2 peaks in the TiCe-3 diffractogram.

2.3. Two-Dimensional Profilometry of Sensing Layers

The roughness and thickness of the TiO2–CeO2 films was determined using 2D profilometric measurement. The surface roughness can affect the gas sensitivity of the film, as higher roughness may lead to an increased contact area with the gaseous species [50]. The thickness of the sensing material governs the sensor response by affecting the morphology, porosity, and finally, roughness. However, there is inconsistency among studies regarding the observed changes in the sensing properties with increasing thickness [51]. The average surface roughness is given in the form of the arithmetic average height (Ra), which is defined as the arithmetic mean of the absolute values of the vertical deviation from the mean line passing through the profile of a film. As a parameter that is more sensitive to larger deviation than the Ra, the root mean square roughness (Rq) is also used for describing the surface [52]. The values of the surface roughness parameter and thickness of the mixed oxides are shown in Table 3. Numerical data and calculation of their values are given in [39]. Considering that the effect of screen printing and the particle size on the roughness and thickness of the films is not the focus of this research, a discussion on these properties, as well as 2D profiles of a surface, can be found in the Supplementary Materials.

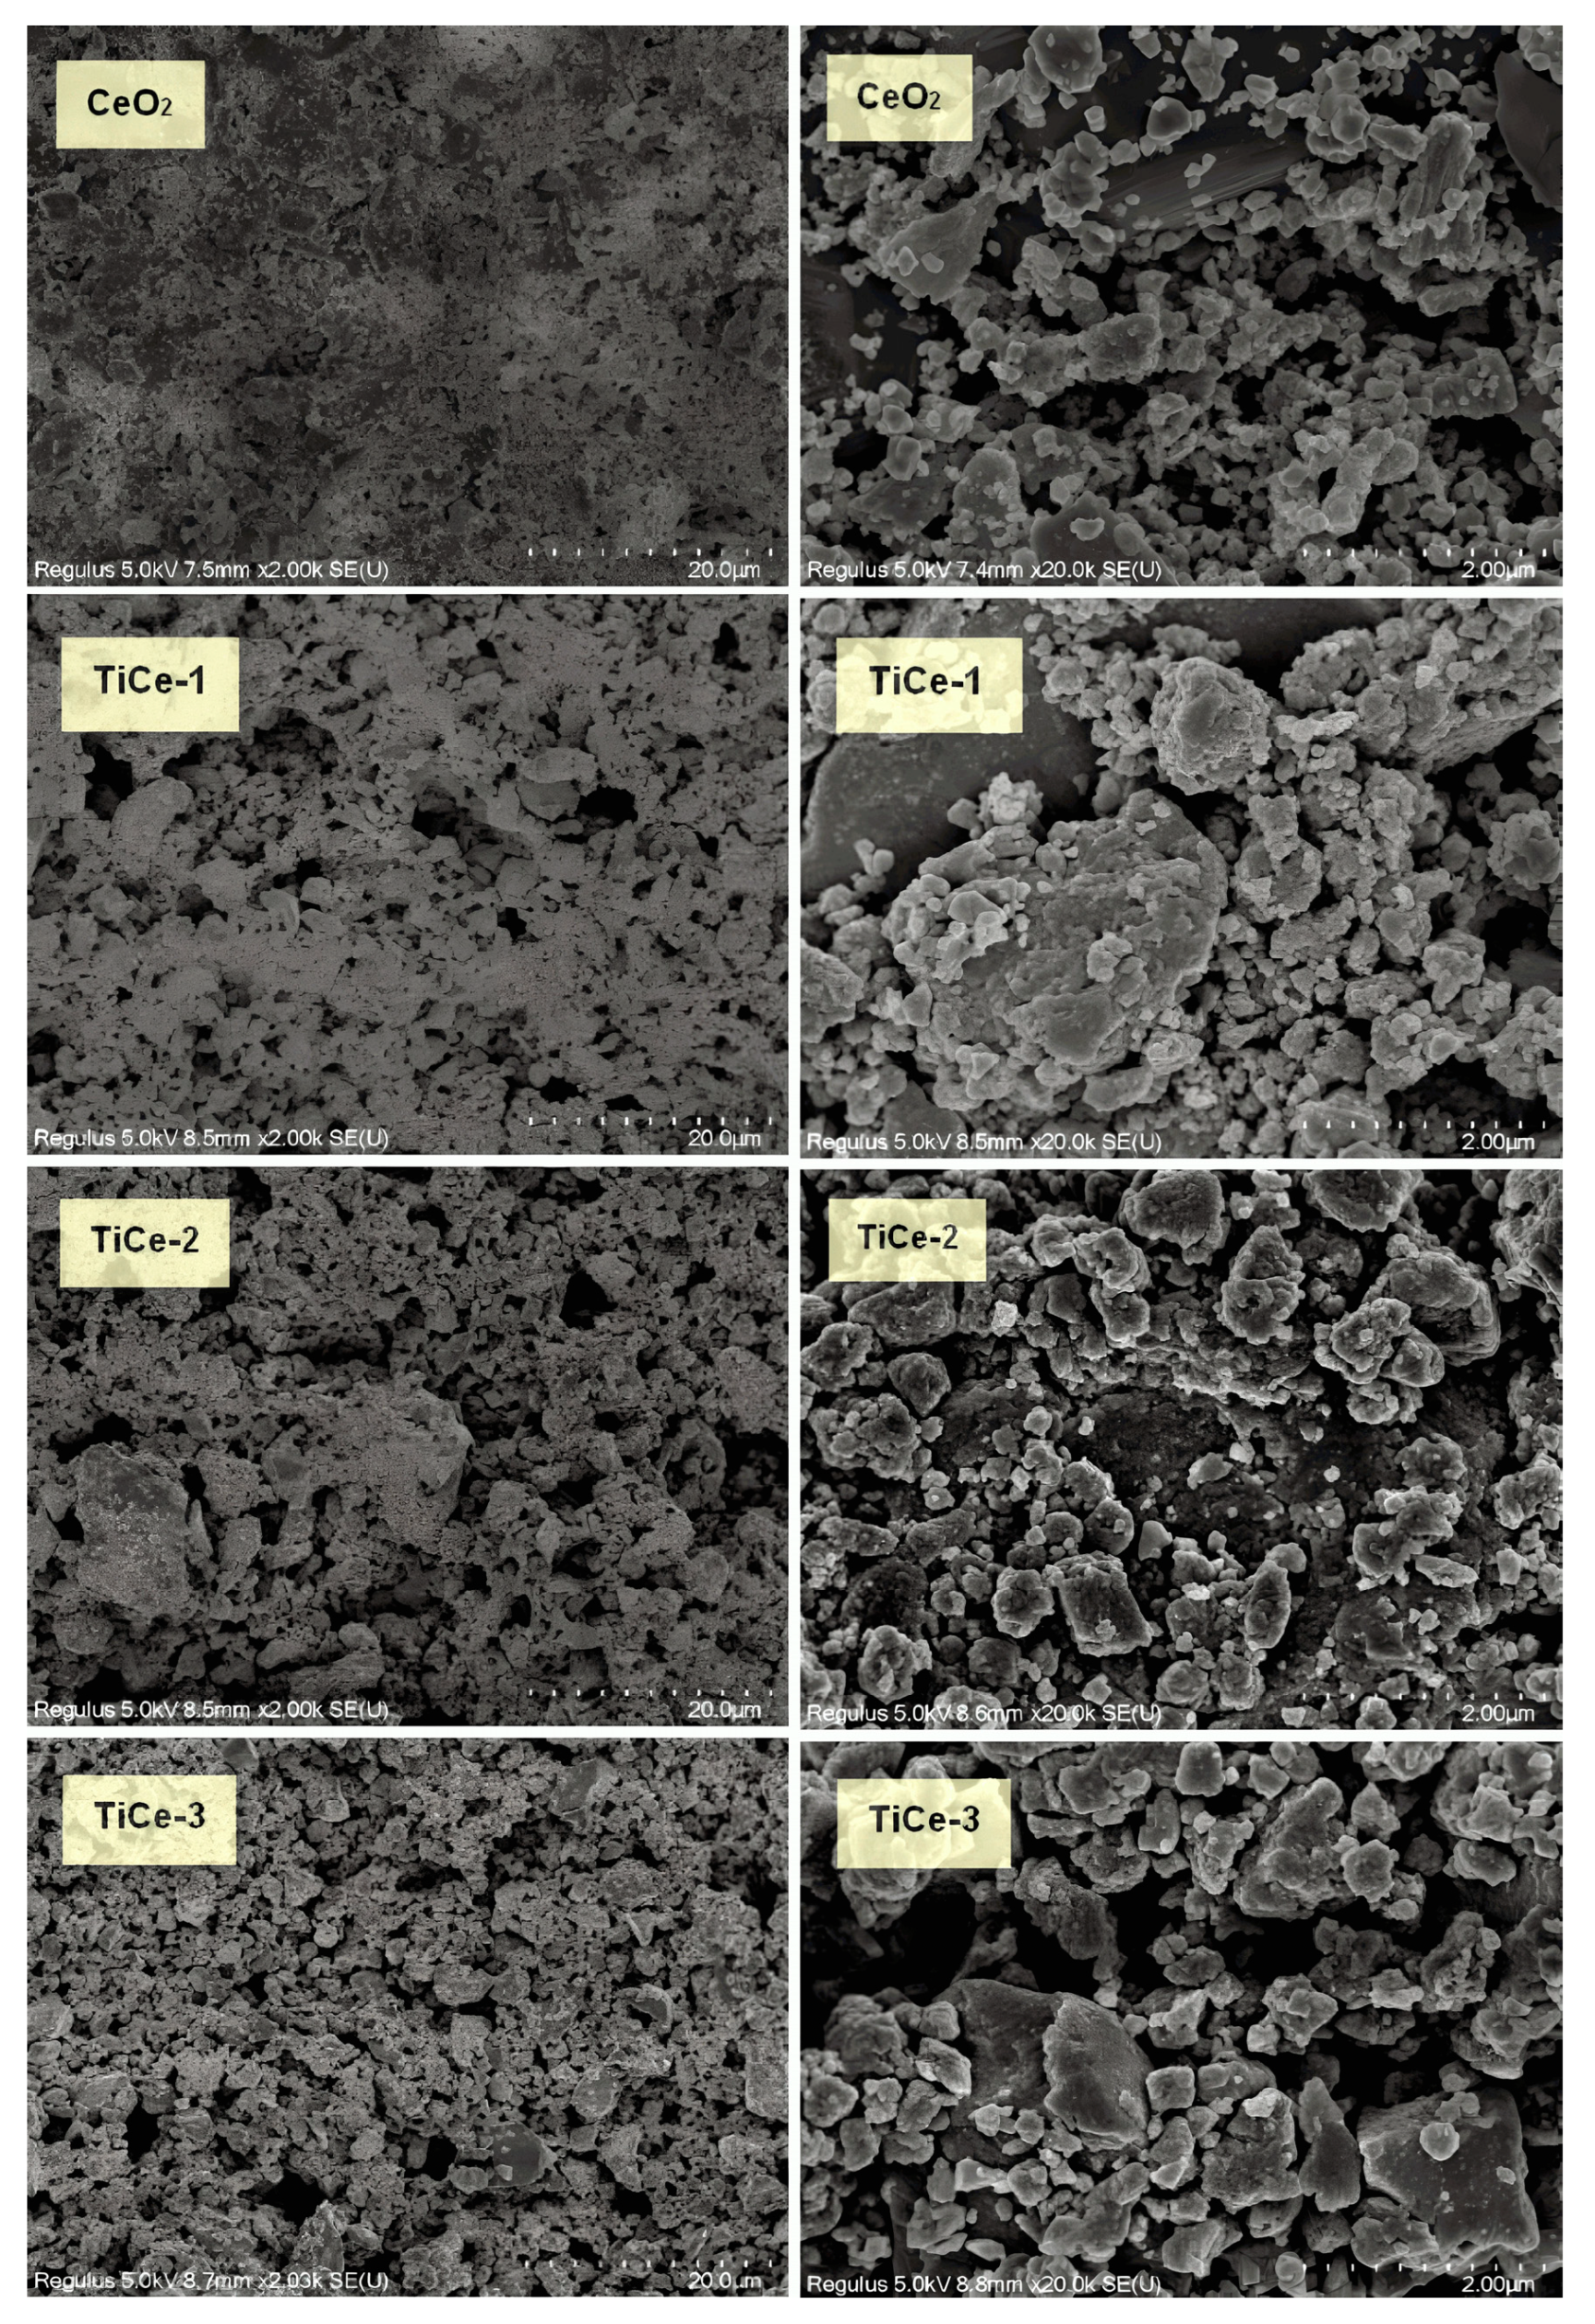
2.4. Scanning Electron Spectroscopy (SEM) and Energy Dispersive Spectroscopy (EDS) of Sensing Layer

SEM inspection of the CeO2 film surface (Figure 4 revealed a randomly organized structure of larger flake-like particles and smaller ones that appeared spherical. Many agglomerates allocated beneath the smaller grains formed a discontinuous structure with visible cracks. The surface of the mixtures appeared to be slightly different from that of the pure CeO2, featuring fewer agglomerates and better cross-linking of the particles (Figure 4). All the mixtures exhibited similar surface characteristics, displaying a lack of particle ordering. The morphology of both TiO2–CeO2 and CeO2 arises from the wide range of particle size distributions present in the powders and the chosen method of preparation.
The EDS analysis was performed on a surface of 6.5 × 5 μm and the results are summarized in Table 4 (images and graphs can be found in the Supplementary Materials). The ratio of Ti and Ce on the surface of the mixtures did not correspond to the initial ratio of the oxides (1:4). We attribute this discrepancy to random experimental errors that may have been introduced during the multiple steps of the paste preparation, to the retention of powder on the walls of the milling vessel, but mainly to the non-homogeneous distribution of the two oxides across the film depth. Moreover, given the poor sensitivity of the EDS technique for the detection of elements with a low atomic number, it is likely that the actual presence of oxygen is underestimated, which may have affected the accuracy of the quantitative analysis.
The significant amount of carbon detected in all the samples probably belongs to the decomposition products of the organic matter formed during the heating in argon flow during the sensor fabrication. Namely, the heat treatment of organic compounds in an oxygen-free environment, a process known as pyrolysis, yields carbon-containing products when using CeO2 as a catalytic material [53]. The highest percentage of carbon was found in the sample milled at the highest speed, TiCe-3. Lastly, the small amount of aluminum identified in all the mixtures suggested that the surface of the alumina substrate was not completely or uniformly covered by the sensing layer.

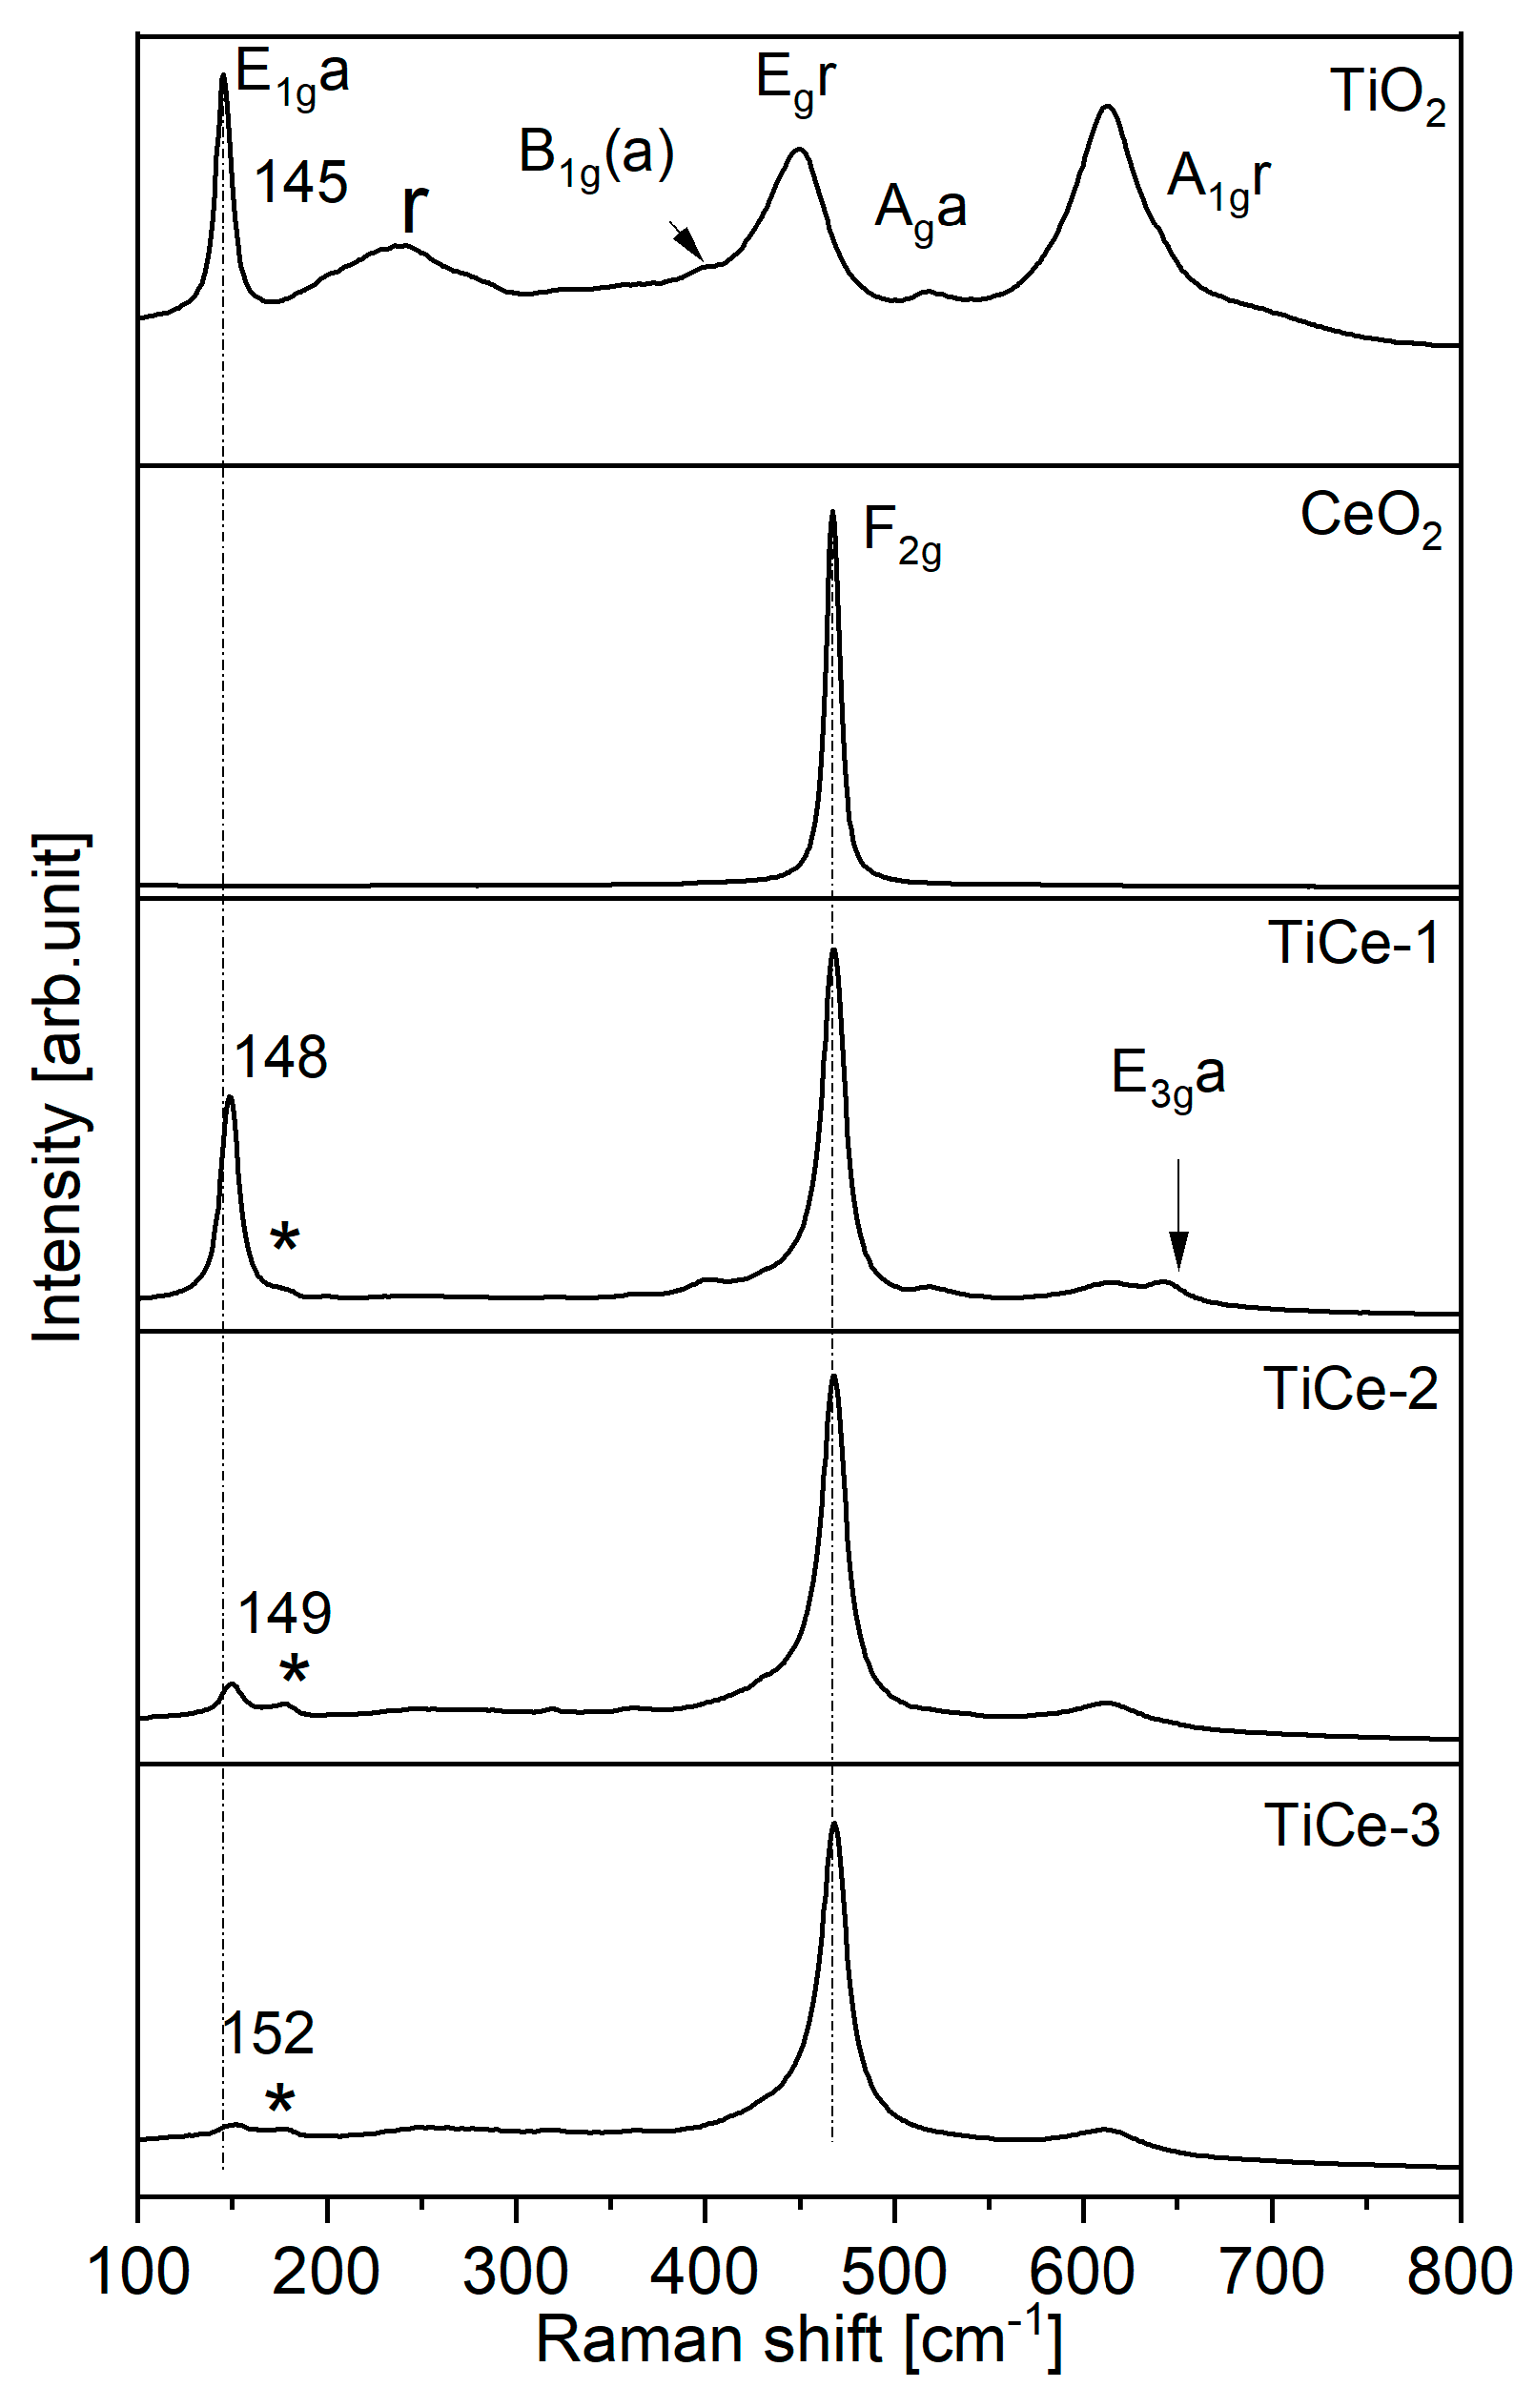
2.5. Raman Spectroscopy of Sensing Layers

Figure 5 shows the Raman spectra of the film of the starting oxides and mixtures. In agreement with the literature data, the starting TiO2 shows distinctive Raman bands of anatase and rutile phases, while the CeO2 exists in the fluorite cubic form [54,55]. The most intense TiO2 band is assigned to the E1g mode [56], while the single CeO2 band corresponds to the F2g mode [57]. No compounds between TiO2 and CeO2 are detected.
The feature at 642 cm−1, present only in the TiCe-1 spectra, is assigned to the vibrations of a moderately distorted anatase lattice (E3g mode) [56,58]. A reason for its absence in the spectra of the TiO2 is masking by the intense rutile band A1g (A1gr in Figure 5). The origin of the band at 177 cm−1 observed for all the mixed oxides (marked with an asterisk) remains unclear. According to the literature, the similar features at 181 cm−1 [59] and 170 cm−1 [60] are correlated with the TiO2 II phase, which is irreversibly formed from anatase or rutile at high pressures. Earlier studies have documented the phase transformation from anatase to TiO2 II through high-energy ball milling [60,61].
The relative intensities of the E1g anatase to the A1g rutile mode (Ia–Ir) in the mixtures differ from those in the spectrum of the pure TiO2 (Table 5). A significant rise in the anatase–rutile intensity ratio in the spectrum of TiCe-1 implies that the presence of CeO2 impedes the anatase-to-rutile transformation [10,62]. The Raman spectra of TiCe-2 and TiCe-3 reveal an exactly opposite effect: the weakening of the anatase band and a decrease in the Ia:Ir ratio, which is indicative of the promotion of the anatase-to-rutile transition. The phase transformation is presumably driven by additional impact energy and heat generated upon a rise in the rotation speed [63,64]. Namely, it has been found that the Ce atom effectively stabilizes the anatase crystals, but only up to a critical temperature point [65]. Another possible explanation is that ball milling induces the amorphization of the anatase phase. Notably, at the medium rotation speed, a significant loss of anatase is observed, yet TiO2 II remains present. As the rotation speed increases, TiO2 II also diminishes, ultimately resulting in a predominantly rutile phase.
The composition of the TiO2 phase can be of great importance from the aspect of gas detection. Materials composed of CeO2 and rutile–TiO2 have been demonstrated to possess a higher content of Ce3+ compared to materials involving CeO2 with other TiO2 phases [66]. The broad and asymmetric nature of the bands, as observed for F2g in mixed oxides’ spectra, is commonly attributed to the grain size reduction, the inhomogeneous strain, and the presence of defects [67,68,69]. The blue shift of the anatase band, E1g, observed in the spectra of the mixtures reaches about 7 cm−1 for the TiCe-3 sample. This may be attributed to the change in the materials’ crystal cell [44,70,71,72,73], although it also can be due to the change in the background slope.

2.6. X-Ray Photoelectron Spectroscopy (XPS) of Sensing Layers
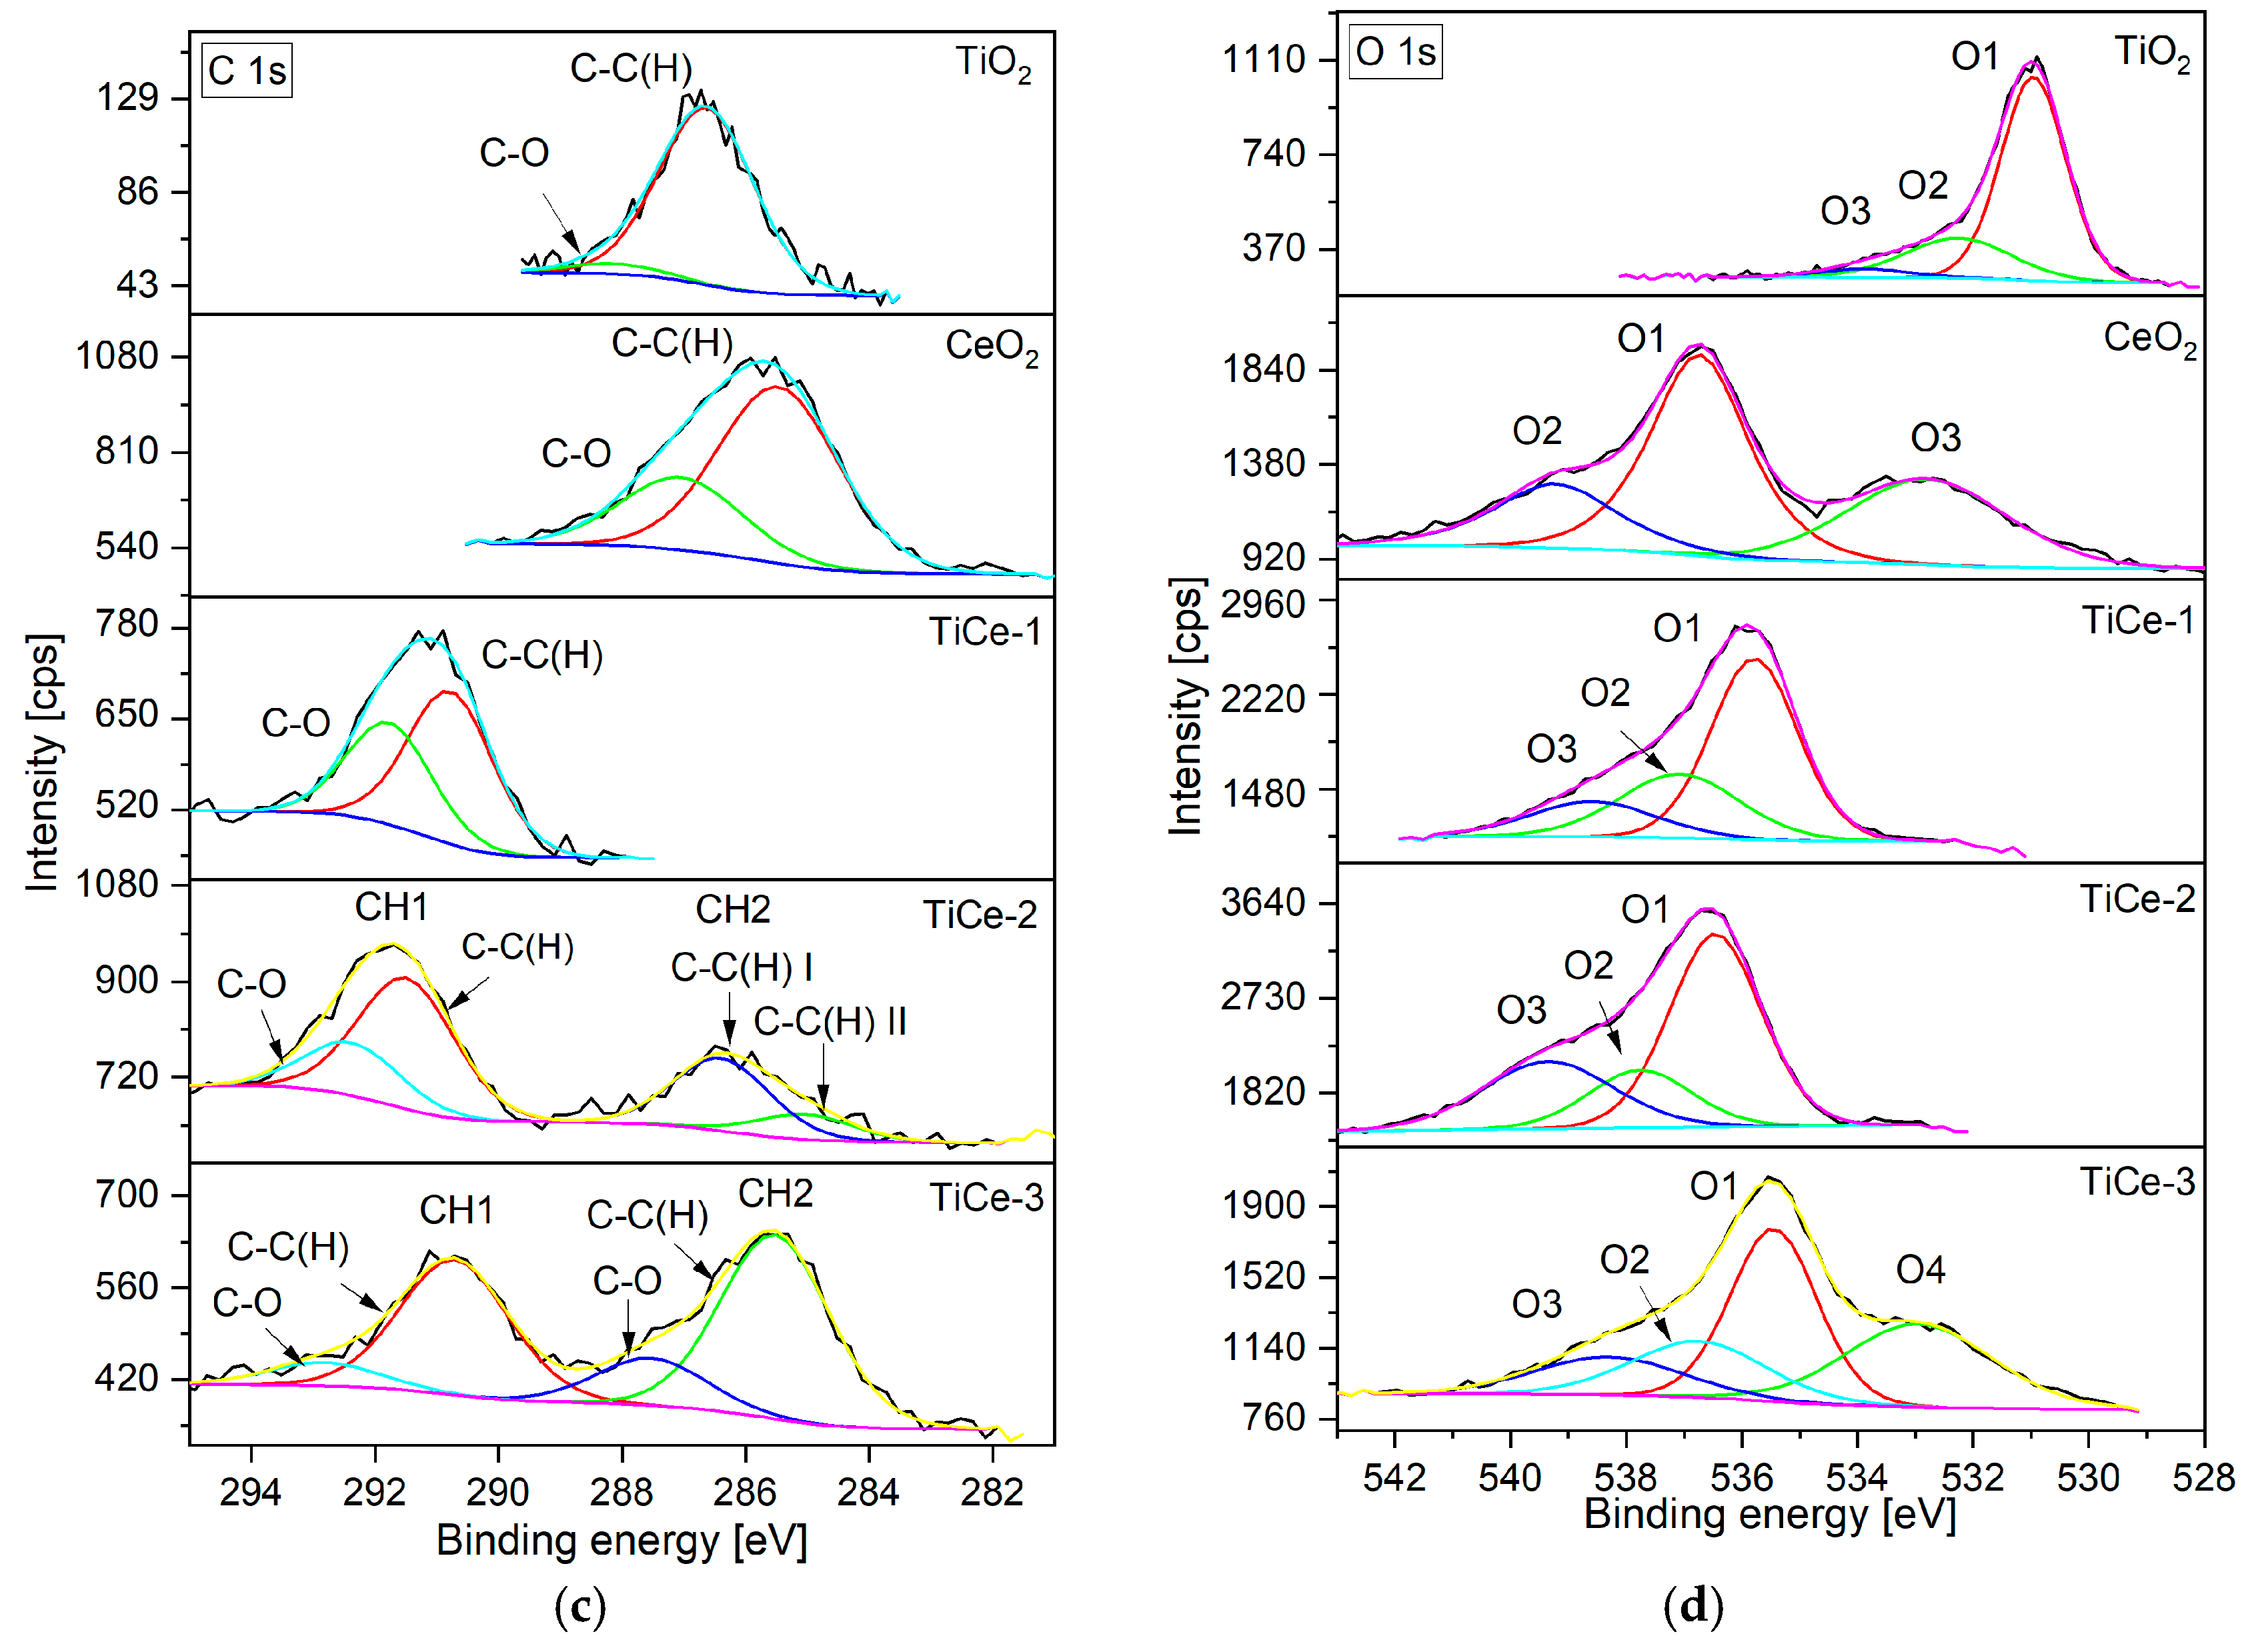
The XPS measurements of the TiO2, CeO2, and mixed oxides were characterized by sample charging caused by their reduced conductivity, particularly at room temperatures. The most obvious consequence of the sample charging during the XPS measurements was the shift of the photoelectron and Auger peaks to higher binding energy. However, the effects of non-uniform charging, where different regions of the analyzed sample showed different electrical potentials, required a more detailed analysis. Non-uniform (or differential) charging contributes to the broadening of all the photoelectron lines and in some cases deforms the line shapes, making it impossible to follow even modest changes in the binding energy attributed to different chemical bonds. In the most severe cases of non-uniform charging, the same photoelectron line may appear at two positions in the spectrum. This phenomenon arises from sudden changes in the electrical potential between two surface regions, potentially representing separate chemical phases with different electron (or hole) transport properties. If the actual binding energy of a particular phase is known, the measured binding energy can be used to calculate the electric potential of a sample, or of a part of the sample containing that phase. If two photoelectron lines have distinctively different binding energy shifts, they obviously originate from different sample regions and consequently cannot belong to the same chemical phase. Similar ideas have been recently used to separate the chemical phases from samples with strong non-uniform charging. Since the exact shape of a photoelectron line carries information about the spatial distribution of a certain element, lines of the same chemical phase should have the same shape [74]. By applying these considerations to the XPS analysis within this study, it appeared that the seemingly least significant photoelectron lines in our samples, that is, the C 1s lines from adventitious carbon, carried potentially very important information about the overall surface structure of the samples. Therefore, it is in our interest to properly describe and quantify the overlayer(s) of the hydrocarbons that are inevitable contaminants in air-exposed samples.

2.6.1. TiO2 Sample

Detailed spectra taken from the reference TiO2 sample are shown in Figure 6a,c,d. The fitting of the Ti 2p line was performed with the spin–orbit pair of only one contribution, which corresponded to the TiO2 phase (Figure 6a). Contributions attributed to Ti2O3 or TiO, which would appear at lower binding energies, were not observed. If the Ti 2p3/2 line originated from TiO2, its position should be at 458.6 eV [75]. Accordingly, the atoms of the TiO2 phase should be at the potential of 1.6 V. The dominant peak of the C 1s line (Figure 6c), corresponding to adventitious carbon, was situated at about 1.8 eV relative to its expected position [75], implying rather uniform surface charging. Three contributions were observed in the spectrum of the O1s line (Figure 6d), which can be addressed (from right to left) as bulk metal oxide O1, always accompanied by defective/hydroxylated surface oxygen O2, and oxygen of organic compounds O3 [76]. We were applying the same peak model for the O 1s line for all the samples. As the sample was charged, all the peaks appeared to shift about 1.6 eV toward the higher binding energies (Figure 6d). C–O bonds could be also identified in the C 1s line (Figure 6c).

2.6.2. CeO2 Sample

The overall shape of the Ce 3d photoelectron line (Figure 6b), taken from the CeO2 sample, was successfully reconstructed using the fitting model proposed by Burroughs et al. [77]. The small discrepancies between the fitting results and the experiment can be attributed to the background calculation and carbon contamination that preferentially screens the Ce 3d signal on the high binding energy side. The line was fitted to eight peaks, four for each value of the angular momentum (j = 5/2, 3/2). The sets of “v” and “u” peaks belonged to the Ce 3d5/2 and Ce 3d3/2 photoelectron line, respectively. The peak v/u was the main contribution of the CeO2 phase, v′/u′ corresponded to the Ce3+ oxidation state and the rest of the peaks represented satellites attributed to the CeO2 phase. By comparing the measured position of the main Ce 3d5/2 (the peak v) with that expected in the non-charged sample [78], the potential of CeO2 was found to be about 7.2 V. The amount of Ce atoms in the +3 oxidation state evaluated from the sum of the v′ and u′ peak areas relative to the overall line intensity was determined to about 18.4%. If all the Ce3+ were placed at the surface, implying their sole origin from oxygen vacancies, and given that the introduction of one vacancy results in the formation of two Ce3+ ions [79], we may roughly estimate the upper limit of these defects to be about 9% relative to the total Ce surface concentration. The hydrocarbon layer with C–O bonds (Figure 6c) and the metallic oxide phase (Figure 6a,b) were on different potentials, which is an example of non-uniform charging, contrary to the TiO2 sample. We presume the reason for this is the lack of ohmic contact between the hydrocarbon layer and the Ce–oxide, which would otherwise enable equal transport and distribution of electrons through the two distinct phases.

2.6.3. TiCe-1 Sample

Both the Ce 3d5/2 and Ti 2p3/2 photoelectron lines were shifted for about 6.1 eV relative to their reference positions (882.3 eV and 458.6 eV, respectively), implying uniform charging of the two oxide phases. A hydrocarbon layer on top of this sample was found to follow the potential of the metallic oxides. By comparing with the results obtained for the single oxide samples, it appeared that the TiO2 grains established a galvanic contact between the CeO2 and the hydrocarbon layer.
The expected position of the O1 line in the CeO2 phase, calculated from its relative position with respect to the Ce 3d5/2 line [76], was 529.5 eV, practically coinciding with that of the O1 peak of the TiO2 phase (529.7 eV [75]). Therefore, the O 1s line was successfully fitted to three contributions, as in the case of the single oxide phase samples. The same peak fitting model was then applied for the samples TiCe-2 and TiCe-3.

2.6.4. TiCe-2 Sample

The metallic oxide phases of the TiCe-2 sample appear to be on a rather uniform electric potential of about 6.7 V during the XPS measurements (Figure 6a,b). Yet, the C 1s line shows up in the form of two distinct peaks separated for 5 eV, which indicates that TiCe-2 is non-uniformly charged (Figure 6c). The structure at the higher binding energy CH1 has a contribution of adventitious carbon and an additional one that we attribute to C–O bonds. Its position corresponds to that of the metallic oxides. The signal at the lower energies CH2 also has two peaks that we attribute to adventitious carbon from two differentially charged regions. This interpretation is supported by the fitting of the O 1s line, consisting of only three contributions being on the same potential as the oxide phases (Figure 6d). After correcting for charging (6.7 V), the O3 is found at 532.6 eV, further confirming that the CH1 structure lies at the same potential as the metallic oxides and that the region from which CH2 originates does not contain oxygen.

2.6.5. TiCe-3 Sample

Strong non-uniform charging is also observed while measuring the TiCe-3 sample, as seen from the detailed spectra of the C 1s line (Figure 6c). The potential of the structure CH1 is equal to the common potential of metal oxides, which is for this sample approximately 5.8 V. The peak of the highest intensity belongs to a differentially charged structure, CH2, with an electric potential of 0.8 V. The O 1s line is fitted to four peaks. Apart from the bulk and surface metallic oxide contributions O1 and O2, two contributions for organic oxygen have to be added: one for each of the differentially charged hydrocarbon regions CH1 (O3) and CH2 (O4). The relative position of the O1 peak with respect to the metallic photoelectron lines for TiCe-3 is O1-Ti 2p3/2 = 71.1 eV and Ce 3d5/2-O1 = 352.9 eV, being identical, in the frame of the experimental uncertainty, with the other samples. After correcting the binding energies for the potential of the structures CH1 and CH2, the peaks O3 and O4 are both situated at 532.5 eV. Their position practically coincides with the binding energies of organic oxygen in the previous spectra. From the relative positions of the metal and O 1s photoelectron lines, it appears that the pure and mixed oxides have the same chemical bonds: Ti is present as TiO2, while Ce is present dominantly as CeO2, with a certain amount of Ce3+.

2.6.6. XPS Quantitative Analysis

Employing the same approach as for CeO2, the Ce3+ percentage in TiCe-1, TiCe-2 and TiCe-3 is calculated to be 19.1%, 17.8%, and 14.9%, respectively. Considering the various sources of uncertainty, we can say that the amount of Ce3+ in the mixtures and pure CeO2 (18.4%) is constant except in the last sample, where a certain decrease in the amount of Ce3+ ions is evident. The binding energies of all the contributions in the Ti 2p, Ce 3d, C 1s and O 1s lines are listed in the Table 6. In contrast to the reference TiO2, CeO2, and TiCe-1, the spectra of TiCe-2 and TiCe-3 reveal two distinct hydrocarbon contributions (Figure 6c). This observation suggests a lack of electrical conductivity between the CH1 and CH2 components, with only one of these acting as the top layer of the film.
Through bond identification, we have determined that the covering layer of TiCe-1 shares the same potential as the bulk of the oxides. Consequently, we propose that the CH1 structure in the C1s spectra of TiCe-2 and TiCe-3 originates from the hydrocarbon layer atop both the TiO2 and CeO2 in the respective samples. This can be confirmed by calculating its thickness. The fraction of the total carbon layer covering TiO2 is denoted as θTi, while the part covering the CeO2 patches is θCe. The details of the quantitative analysis, the relevant literature sources [23,80,81,82,83,84,85,86], as well as the modeling of the TiO2-modified CeO2 film, are given in the Supplementary Materials. The numerical data and calculation within the quantitative analysis can be found in [39]. The results derived from the analysis based on the hypothesized model are listed in Table 7. According to the data, the thickness of the carbon-containing overlayer above the mixed oxides is significantly smaller than that on the pure CeO2. The thinnest overlayer is found for TiCe-1 sample, which contains the highest surface coverage of TiO2 patches (θTi) among the mixed oxides.

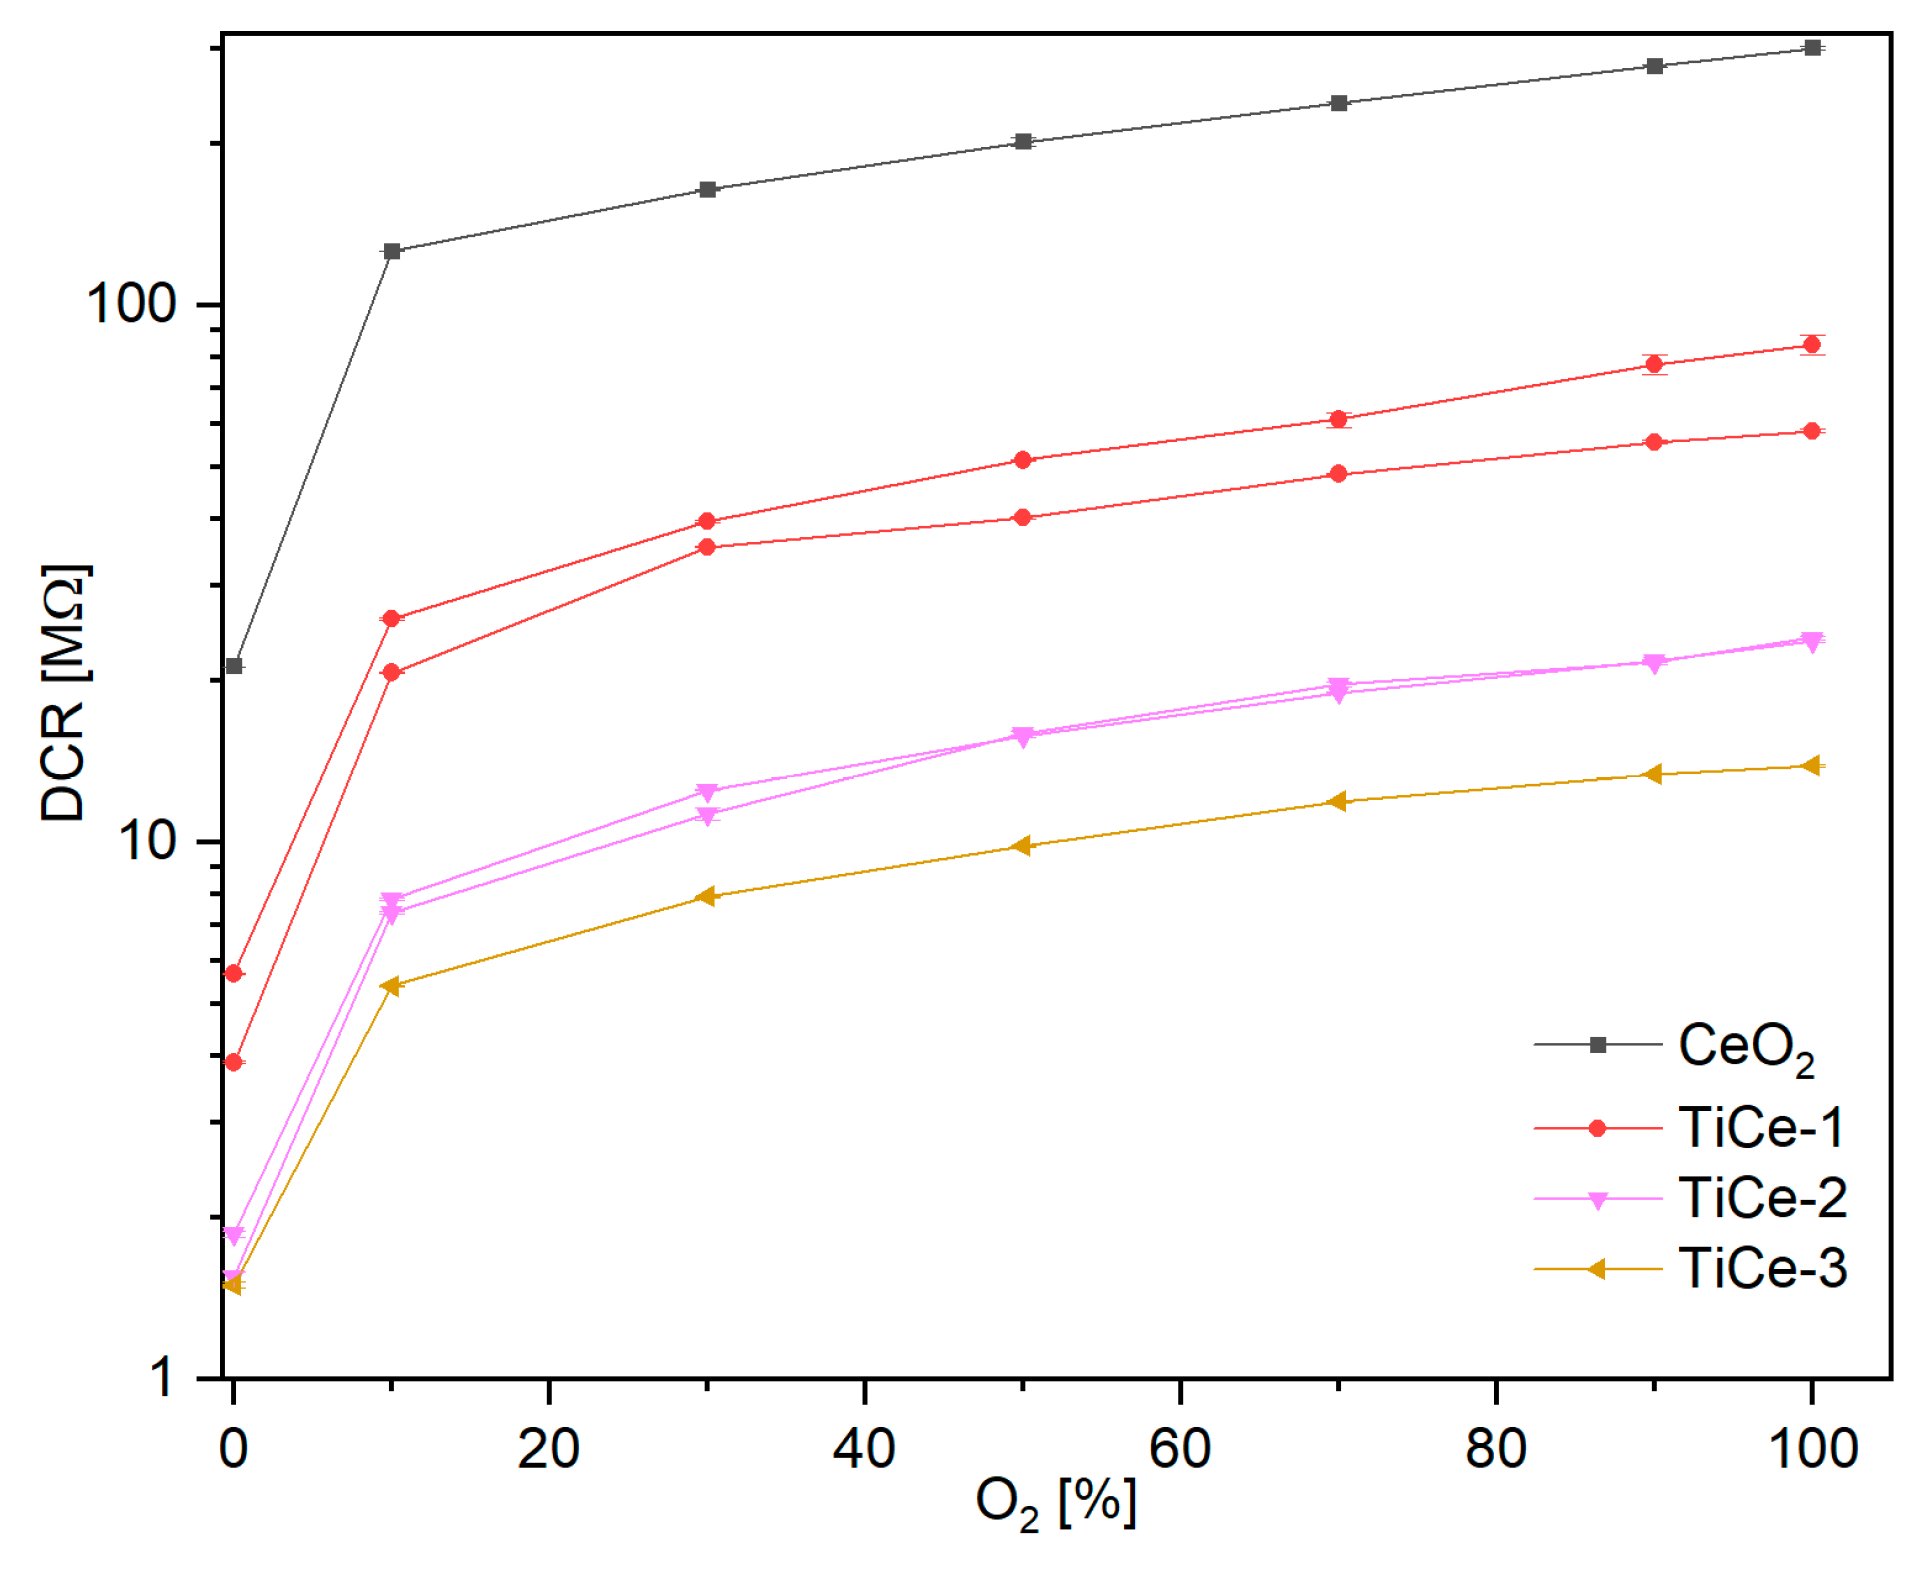
2.7. Results of Electrical Measurements
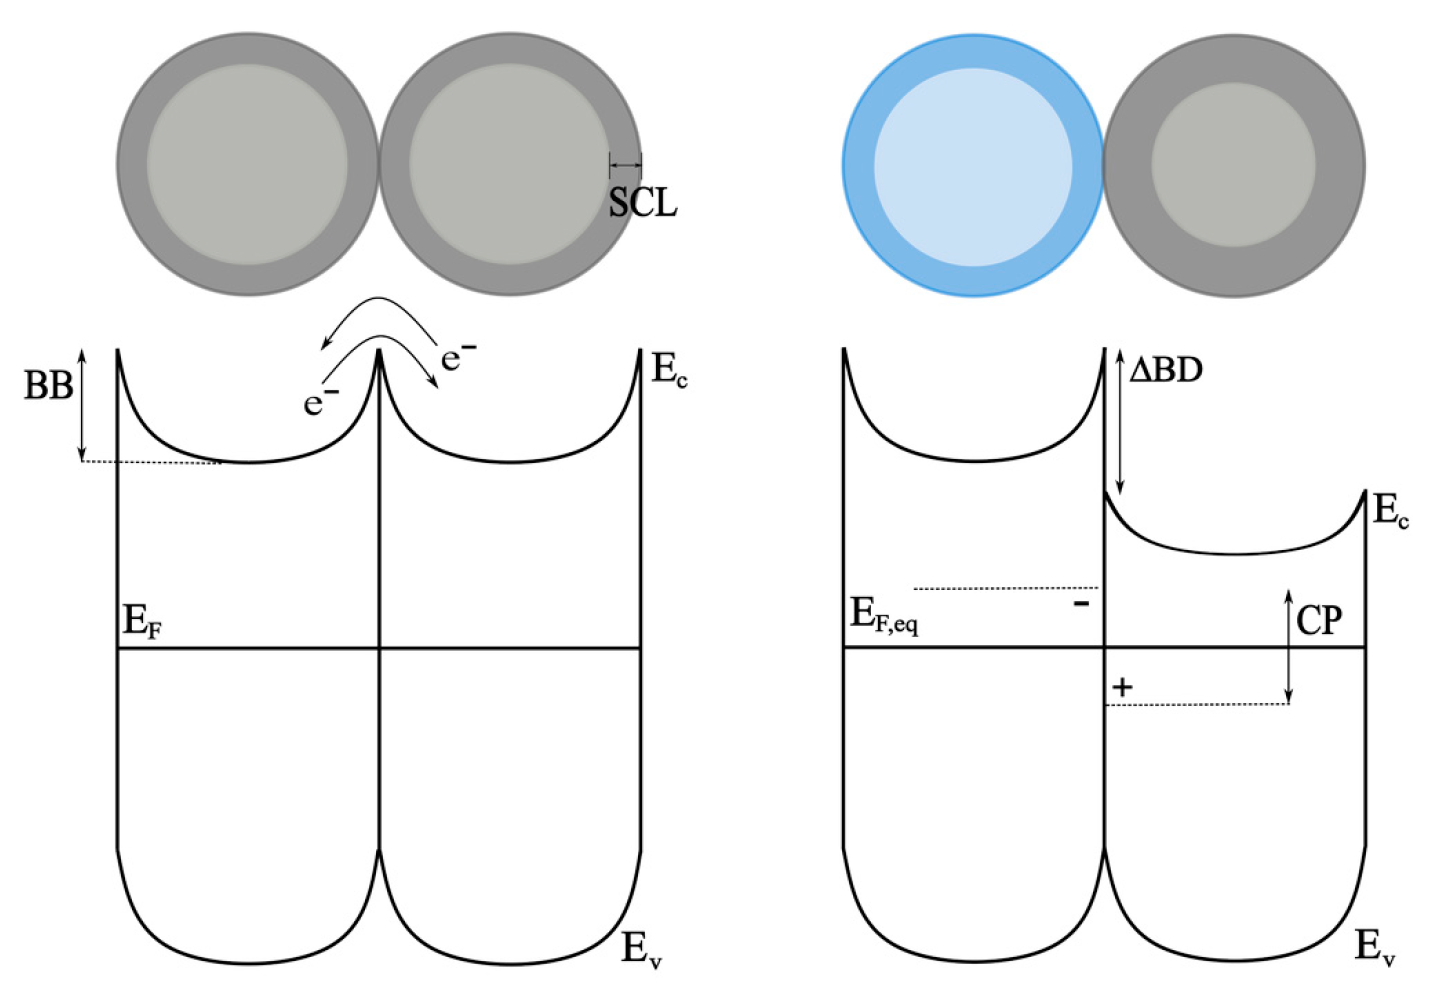
The measurements of the TiO2–CeO2 sensor (hereinafter referred to as the TCO sensor) presented in this study were performed at 310 °C. This operating temperature was selected because it represents the minimum temperature at which the resistance of the sensor over the entire O2 concentration range is low enough to be measured by most available instruments, while the stability of the response is satisfactory. To investigate the sensing behavior of the obtained TiO2–CeO2 materials, we measured the current–voltage curves of the TCO sensors at the chosen working temperature, using the Keithley 2450 Source Meter Unit (SMU) (Solon, OH, USA). It was found that all the mixtures exhibited ohmic contact characteristics, as can be seen in the example given in the Supplementary Materials.
The resistance values were recorded for 15 min at each O2 concentration. As an example, the result of the time-dependent electrical measurements for TiCe-3 is given in the Supplementary Materials. The resistance value for each O2 percentage as well as the standard deviation were calculated from the final 200 s of exposure. The dependence of the DCR values of the sensor on the oxygen percentage is presented in Figure 7. The data plotted with a linear scale are shown in the Supplementary Materials. To evaluate the reproducibility of the sensing layer fabrication process, two mixtures were screen-printed twice and their response to O2 was measured. Plots of the same color in Figure 7 belong to TCO sensors manufactured from identical mixtures.
Variations in parameters such as the squeegee pressure and amount of paste during the manual application of each layer may affect the repeatability of a process, which can be reflected in the performance of the final sensing material. The responses of two TiCe-1 sensors based on identical mixtures showed slight differences, although the resistance values at the same O2 exposure tended to cluster (Figure 7). This discrepancy may also arise from random errors in the paste preparation and the wide particle size distribution of the milled powders. Indeed, the sensor responses of the two TiCe-2 samples, made from powder with a narrower span in the particle size distribution (Table 1), appeared to match. However, the small inconsistency in the sensor response did not affect the application of high-energy ball milling for fabrication of the sensing layer: each sensor will be calibrated before use.
The highest change in the sensors’ resistance was in the range of low oxygen concentrations (0–10%), approaching saturation thereafter. The high resistance of the CeO2 film, reaching several hundreds of MΩ, posed a challenge for practical applications due to the difficulties in measuring the resistances of this order. Even at the low O2 percentages, its resistance exceeded 100 MΩ. In contrast, the sensor based on the TiO2–CeO2 films showed significantly lower resistance over the entire O2 concentration range, whilst preserving a similar relative change in the resistance. The resistance of the mixed oxide films decreased with increasing milling. It was also observed that TiCe-2 and TiCe-3 showed a similarity in the DCR value at identical O2 concentrations, while the mixture milled at the lowest speed (TiCe-1) exhibited greater resistance by about an order of magnitude. In this study, the sensitivity was calculated as the slope of the DCR-O2 dependence curve divided by the resistance value at 0% O2, labeled as DCRAr [87]:
S = ∆DCR⁄∆O2∙1⁄DCRAr
The sensitivity, presented in Figure 8, is a function of the oxygen partial pressure due to the non-linear response of the sensors (Figure 7). The sensitivity strongly depended on the O2 concentration, with a maximum observed in the 0–10% region, followed by a sharp decrease to a saturated value. At lower percentages of O2 (0–10%), the best oxygen sensitivity was observed for the pure CeO2, which was about 0.06 above that of TiCe-1. At higher partial pressures of O2, TiCe-1 and TiCe-2 were more sensitive than CeO2, while the TiCe-3 film (obtained by the highest rotation speed) had the lowest sensitivity throughout the whole concentration range.

3. Discussion

At the grain surface, oxygen molecules extract electrons from the conduction band, trapping them at the surface in the form of ions, which induces upward band bending. This causes the formation of an electron-depleted region (space charge layer within the grain), which represents a potential barrier that hinders the movement of electrons between the two grains (Figure 9). Consequently, the electron mobility, as well as the number of electrons free to act as a carrier, is reduced, resulting in a decrease in the electrical conductivity of the n-type semiconductor as the oxygen partial pressure increases, following the Equation (2):
σ = A∙exp∙(−EA∙(k∙T))∙pO1/N
Here, σ represents the conductivity, A is a constant, EA is the activation energy for conductivity, k is the Boltzmann constant, T stands for the operating temperature, and pO is the oxygen partial pressure. N is a value that depends on the type and number of the defects, and for the case of n-type semiconductors, it is negative [4]. The increase in the DC resistance with the rising O2 concentration suggests that TiO2-modified CeO2 acts like a single n-type oxide over the entire partial pressure range. The trend observed in Figure 8 arises from the increasing probability of vacancy filling during the exposure to higher O2 concentrations. At sufficiently elevated O2 levels, saturation occurs: vacancies become fully occupied, rendering further oxygen exposure inert. Consequently, the resistance stabilizes as it reaches its maximum value [4,11].
Figure 9. Schematic illustration of the homo-contact between the grains of the same semiconductor (left) and the hetero-contact between two types of semiconductors (right) in contact after reaching equilibrium; “SCL” stands for the width of the space charge layer, “BB” for the banding of the valence and conduction band, “CP” for the contact (hetero) potential and “∆BD” for the band edge difference. Two different colors (blue and gray) represent different types of semiconductors.
Inorganics 13 00159 g009
Increasing the number of oxygen vacancies is expected to enhance the sensitivity of the detection process [4,6]. However, the X-ray photoelectron spectroscopy (XPS) analysis reveals that the relative amount of Ce3+ remains consistent in both the CeO2 and the mixtures (approximately 18%), although there is a slight reduction noted for the TiCe-3 (14.9%). These findings suggest that increasing the milling speed within the tested range does not significantly affect the formation of oxygen vacancies until a certain threshold (TiCe-2), beyond which it appears to act as an inhibitor. The presence of TiO2 also does not affect the formation of vacancies in TiO2–CeO2 mixtures. According to the Ce 3d and Ti 2p detailed spectra, oxygen vacancies are generated exclusively in the CeO2 domains. The XPS did not detect Ti3+ ions, indicative of the presence of oxygen vacancies at room temperature. The difference in the amount of defects will persist under elevated temperatures and oxygen-deficient conditions, due to the substantial differences in stability between the two oxides.
The effects of the so-called “poisoning” of a surface by carbon-containing species can lead to the occupation of the active sites and the reduction in the concentration of oxygen species adsorbed [88]. Two different hydrocarbon phases (CH1 and CH2) are identified on the surfaces of TiCe-2 and TiCe-3. In the case of TiCe-3, both are partially oxidized, while for the TiCe-2, they appear to be just differentially charged adventitious carbons, with no evidence of oxidation. The two carbon-containing phases are galvanically isolated, indicating the absence of physical contact between them. Otherwise, we would expect to observe some deformation of the C 1s line, rather than a complete separation into two distinct regions. Therefore, only one of these phases can be considered an overlayer. We propose that it is the one with the same potential as the oxide phases, CH1, found in all three mixtures. All the evidence suggests that CH2 is present on the samples’ surface but is physically displaced by metal oxides. It is possible that this phase resides at the boundaries between two identical or different grains. Grain boundaries, whether a homo- or hetero-interface, represent a type of microstructural defect characterized by an electronic property that differs from that of the surrounding surface [17]. This distinctive electronic structure may cause a different charging of the CH2 phase, which could partially or completely coat the grain surface, somehow alternating the electron transport or oxygen diffusion. Since it is not observed for the TiCe-1 mixture, such carbon-containing species could have been introduced during the milling at a rotational speed above 350 rpm. Nevertheless, the common potential of the metallic lines suggests that CH2 does not inhibit the contact between TiO2 and CeO2.
The presence of differentially charged oxidized species is not detected in the cases of TiCe-1 and TiCe-2. Both samples demonstrate higher sensitivity than TiCe-3 across the entire range of oxygen concentrations and CeO2 for the concentrations above 10%. TiCe-1 is also characterized by the absence of a differentially charged CH2 phase, the smallest thickness of the carbon overlayer, and the highest surface roughness. Increasing the powder precursors’ milling speed up to 550 rpm reduces the sensitivity of the layer, potentially due to the introduction of oxygen-containing CH2 species, causing a small decrease in the surface roughness, but most likely due to the lowest amount of oxygen vacancies. It is also worth noting that the EDS results also show that the TiCe-3 sample contains the highest amount of carbon. This observation further supports the hypothesis that the CH2 phase is not a surface contaminant but rather is located in the sub-surface microstructure of the sample. However, the role of the CH2 phase in reducing the sensitivity of TiCe-3 remains inconclusive without XPS experiments conducted at elevated temperatures. This phase, due to the oxygen present in its structure, may potentially inhibit the binding of ambient oxygen that penetrates through defects (gaps) in the overlayer and reaches the grain boundaries. The content of the TiO2 crystalline phases does not affect the sensitivity in the expected manner, but its incorporation in the CeO2 layer reduces the amount of surface contamination, i.e., the thickness of the overlayer, d (Table 7). The average surface roughness, Ra, of the mixtures (Table 3) appears to decrease with the increasing thickness of the carbon-containing overlayer CH1, d (Table 7).
The homo-contact established at the boundary between two grains is a decisive factor in the free carrier transport in semiconductor devices. The mechanism of electron transfer from one domain to another in the presence of a potential barrier caused by the existence of a depletion region is described with the double Schottky barrier [6,17,89]. The charge carrier mobility through the barrier occurs at elevated temperatures and governs the conversion of the reaction into an electrical signal [90]. By assembling semiconductors with different physical properties or working functions into one structure, apart from the homo-contacts, hetero-contacts and band edge differences are created. The hetero-contact represents a thin double layer of physically separated positive and negative charges at the interface of the grains of dissimilar semiconductors. The formed potential reduces the mobility of electrons moving in the direction against it, without affecting the electrons coming from other directions toward the positive side of the interface. Yet, their role in shaping the sensing functions is significant only if the structure of the sensing layer is properly designed. In such cases, the response of the sensor to the target gas is doubly affected: by oxygen-binding-induced changes in the surface electron density and by the reduced mobility of electrons passing through the contact, leading to a remarkably higher sensitivity [89,91]. The surface structure of the TiO2–CeO2 mixtures consists of irregularly distributed grains of varying sizes forming agglomerates, as observed in the SEM images. N. Yamazoea and K. Shimanoea [89] proposed that mixing the grains of two semiconductor materials almost halves the resistance of the resulting structure, regardless of the presence of the target gas and the combination of materials. This chaotic arrangement allows current to flow through paths of lower resistance, primarily homo-contacts, while hetero-contacts play a minor role in electron transport [88,91]. Indeed, the main difference in the response of the TCO compared to the pure CeO2 sensor is precisely the markedly lower electrical resistance in the entire range of O2 concentrations. The latter makes TCO sensors much more suitable, while the sensitivity is slightly lower only for the lowest oxygen concentrations. While the contact potential modulates the drift mobility of the electrons, the band edge difference plays an important role in establishing an exchange current under the unbiased condition [91].
As already said, the common potentials of the Ti 2p and Ce 3d lines suggest the establishment of well-defined contact between TiO2 and CeO2, facilitating electronic transport between these two phases. The formation of the well-defined contact is further supported by the Raman spectroscopy, which indicates a noticeable effect of CeO2 on the phase composition of TiO2. Given that neither ball-milled nor thermally induced chemical reactions are detected, it is likely that the interactions occurring at the interface between the two oxides are predominantly physical in nature. However, it remains uncertain whether this contact resembles the one depicted in Figure 9 The presence of a rectifying contact within a domain significantly smaller than the overall TiO2-modified CeO2 layer cannot be directly observed, as the I–V curves reflect the behavior of the entire sensing material. Even if rectifying properties form at the oxide–oxide interface, they do not significantly affect the sensitivity of the TiO2–CeO2 system, that is, not to an observable extent.

4. Materials and Methods

4.1. High-Energy Ball Milling

Three different TiO2-modified CeO2 powders were obtained in a high-energy ball mill (Planetari Micro Mill Pulverisette 7, Fritsch, Germany) at three different rotational speeds. TiO2 (purity > 99%, Alfa Aesar, Kandel, Germany) and CeO2 (99.9% purity, Johnson Matthey-Alfa, Karlsruhe, Germany) powders served as the starting materials. Milling was carried out under atmospheric conditions in an 80 cm3 silicon nitride vial with 25 silicon nitride balls (10 mm diameter), maintaining a ball to powder mass ratio of 10:1 and a total powder weight of 4.87 g. A CeO2:TiO2 mass ratio of 0.8:0.2 was chosen for this study. Milling lasted 160 min, with a 5 min break every 20 min, at speeds of 350, 450 and 550 rpm for each powder. Thick sensing films were made from these powders as described in the following section. The resulting samples were designated as TiCe-1, TiCe-2, and TiCe-3 based on their respective milling speeds: 350, 450 and 550 rpm.

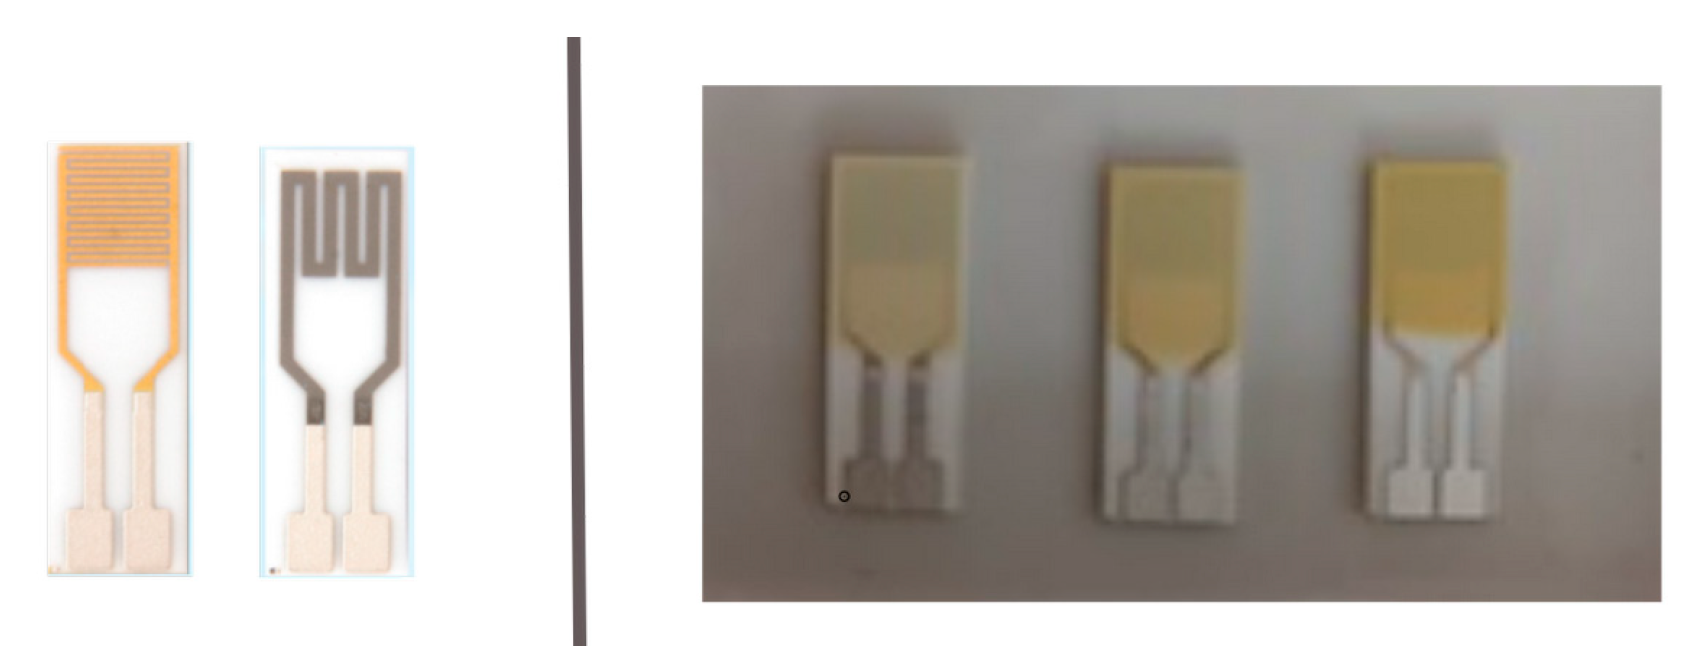
4.2. Paste Preparation and Sensor Fabrication

CeO2 and mixed oxide pastes were prepared according to the recipe for TiO2 paste production for dye-sensitized solar cells established by Ito and colleagues [92]. Prior to applying each layer, the pastes were homogenized by stirring on a magnetic stirrer (MR 3001 K, Heidolph, Wood Dale, IL, USA). Six layers were screen-printed on an alumina substrate using custom-made screen equipment. Commercial substrates with interdigitated gold electrodes and a platinum heater on the back side were used (DropSense with interdigitated Gold Electrode/200 μm lines and gaps, IDEAU200-HPT-WB, Metrohm AG, Herisau, Switzerland). Following the printing of each layer, the substrate was dried on a hotplate (PZ28-2, Prazitherm, Harri Gestigkeit GmbH, Dusseldorf, Germany) at 125 °C for 6 min. The samples were then sintered in an oven under an argon flow gradually rising to 800 °C. Prior to this, the samples were briefly exposed to a flow of synthetic air at 400 °C to remove organic components from the paste. By triggering the growth of the so-called neck between the particles, the sintering improved the electromechanical bonding of the particles [93]. The thick film of CeO2 and the mixtures showed good attachment to the alumina substrate. The resulting structures were mounted between two pairs of copper connector wires, which were custom-made in our facilities.

4.3. Characterization of Powders

To determine the effect of the milling speed on the average particle size of the TiO2–CeO2 powders, particle size distribution (PSD) analysis was employed. The used instrument was the laser-diffraction-based Mastersizer 2000 (Malvern Panalytical, Malvern, UK) analyzer, covering the particle size range of 0.02–2000 µm. To perform the PSD measurements, the powders were dispersed in ethanol and subjected to ultrasonic treatment at a frequency of 40 kHz and power of 50 W. The crystal structure of the powders after undergoing mechanochemical treatment was investigated by the X-ray powder diffraction (XRPD) technique. Diffraction data were acquired in Bragg–Brentano geometry over the range of the scattering angle from 15° to 99°, with a step size of 2θ = 0.05° and a scan step time of 55.245 s. Measurements were performed using a PANalytical X’Pert PRO MPD diffractometer (Almelo, The Netherlands) equipped with an X’Celerator Ultrafast 1D detector based on Real Time Multiple Strip (RTMS) technology. The CuKα source with a wavelength of 1.542 Å was used. The peak analysis was performed with PANalytical X’pert (version 4.9) software to identify the phases and determine their position, full width at half maximum (FWHM or β), and d-spacing. The Williamson–Hall plot was constructed based on the obtained results to distinguish the contributions of the crystallite size and microstrain of the milled powders.

4.4. Characterization of Sensing Material

The roughness and thickness of the screen-printed films were determined using a Rank Taylor Hobson Ltd. profilometer (Leicester, UK), with a step setting of 0.04 mm for the thickness and 0.02 mm for the roughness measurements. The roughness and thickness were calculated as the average values of data collected from the three, i.e., five regions on the sample, and shown in Table 3. The surface profile was obtained by applying the roughness filter (0.33 Hz) of the instrument. The results of the 2D profile measurements of the films are given in the Supplementary Materials. Scanning electron microscopy (SEM) and energy dispersive spectroscopy (EDS) (Zeiss Auriga with Oxford XMax 150 EDS, Jena, Germany) were employed to investigate the morphology of the CeO2 and TiO2–CeO2 films on the substrate. The Raman spectra were acquired using a DXR Raman microscope (Thermo Fisher Scientific, Medison, WI, USA), equipped with a research optical microscope and a CCD detector. A frequency-stabilized single-mode diode laser with an excitation wavelength of 532 nm was employed. The laser power was adjusted to 2 mW and the exposure time to 5 s. The XPS measurements were performed on a XPS system with a Class 100 energy analyzer (VSW, Bushey, UK), which was part of an experimental setup Multitécnica assembled for the surface investigation [94]. The survey spectrum was recorded in a fixed transmission mode with a pass energy of 44 eV (FAT 44), an energy step of 0.5 eV and a dwell time of 0.5 s. Due to the overall low signal intensity and charging problems introducing line broadening, detailed spectra of the Ce 3d core-level were also recorded in FAT 44 mode, with an energy step of 0.2 eV and dwell times of 8 s and 12 s per scan. A non-monochromatic Mg Kα line with photon energy of 1253.6 eV was used as an excitation source. Calibration of the energy axis was performed using a single Ag (110) crystal and polycrystalline Au previously cleaned by Ar ion sputtering. The energy was calibrated to the peak positions of the Ag 3d5/2 and Au 4f7/2 core-level spectra, with binding energies of 368.22 eV and 83.96 eV, respectively. The samples were in a high vacuum for 24 h prior to the measurements.

4.5. Sensor Response Measurements

Electrical measurements of the obtained sensing structures (Figure 10) were conducted to explore the sensing behavior of the TiO2-modifed CeO2. A scheme of the setup for measuring the sensor response in the gas flow regime developed for testing the TCO sensors is given in [29]. The sensors were exposed to varying volumetric concentrations of O2, ranging from 0 to 100%. To achieve different O2 concentrations, the flow rates of O2 (5 N purity) and Ar (5 N purity) were adjusted using two mass flow controllers (MC-200SCCM-D/5M, Alicat Scientific, Tucson, AZ, USA).
The total gas mixture flow remained at 200 SCCM during all the measurements. Monitoring of the O2 concentration was carried out by measuring the response of the reference sensor (AA428-210 (AO2) Citicel, Honeywell City Technology, Bangalore, India) with a multimeter (34461A, Keysight, Santa Rosa, CA, USA). The TCO sensor mounted in a copper holder was placed in a closed glass flask with inlets for the gas mixture and electrical contacts, and gas outlets. The sensor was heated by connecting a back-side platinum heater to a direct current power supply (9174B, B&K Precision, Yorba Linda, CA, USA), labeled DCPS. The supply voltage level was set to 7 V, 8 V, and 9 V to obtain different operating temperatures of the TCO sensor (270 °C, 310 °C, and 350 °C). The direct current resistance (DCR) of the sensors was measured using a multimeter (34410A, Agilent, Santa Clara, CA, USA), with a range for measuring the resistance up to 1 GΩ.

5. Conclusions

The surface properties of TiO2-modified CeO2 layers, treated in a high-energy ball mill at three different rotational speeds, were examined to elucidate their sensing behavior when exposed to oxygen. The TiCe-1 sample prepared from precursors milled at the lowest speed (350 rpm) exhibited the highest oxygen sensitivity. Both TiCe-1 and TiCe-2 (450 rpm) outperformed pure CeO2 in terms of the sensitivity at oxygen concentrations above 10%. All the measurements of the sensor response were conducted at operating temperatures lower than those typical for single metal oxide-based sensors. The XPS analysis revealed that incorporating TiO2 in the CeO2 layer helped in reducing the surface contamination, i.e., decreasing the thickness of the overlayer of adventitious carbon. At the speeds above 350 rpm, a new carbon-containing phase, CH2, in introduced. This phase is hypothesized to be physically separated from the carbon overlayer and located near the grain boundaries, potentially modifying the electron transport properties of the TiCe-2 (450 rpm) and TiCe-3 (550 rpm) layers. The TiCe-3 sample, treated at the highest milling speed, exhibited the lowest sensitivity among the tested samples. Potential contributing factors to this are the partially oxidized structure of the CH2 phase or a slightly reduced number of oxygen vacancies in comparison to the other samples. Furthermore, the XPS results indicated that oxygen vacancies, the primary active sites for oxygen adsorption, were exclusively formed within the CeO2 domains. This suggests that while TiO2 enhances electrical conductivity, its role in oxygen reactions is minimal or indirect. It is worth noting that the addition of TiO2 also significantly lowered the resistance of the CeO2 sensor across the entire range of O2 concentrations, thereby simplifying the practical application of the sensor.

Supplementary Materials

The following supporting information can be downloaded at https://www.mdpi.com/article/10.3390/inorganics13050159/s1, Figure S1: Williamson-Hall plot for CeO2 and mixed oxides; Table S1: Position of peaks used for the construction of Williamson-Hall plot for the CeO2 powder; Figure S2: Thickness measurements of TiCe-1, TiCe-2, and TiCe-3 film using a 2D profilometer; Table S2: Position of peaks used for the construction of Williamson-Hall plot for the TiCe-1 powder; Figure S3: Surface roughness of TiCe-1, TiCe-2, and TiCe-3 measured on five different regions; Table S3: Position of peaks used for the construction of Williamson-Hall plot for the TiCe-2 powder; Figure S4: Elemental EDS mapping of Al K series, C K series, Ce L series, Ti K series, and O K series on the center of the TiCe-1 film; Table S4: Position of peaks used for the construction of Williamson-Hall plot for the TiCe-3 powder; Figure S5: EDS layered image taken in the center of the TiCe-1 film; Table S5: Data obtained from EDS mapping for sample TiCe-1; Figure S6: EDS map spectrum of the TiCe-1 film taken from the center; Table S6: Data obtained from EDS mapping for sample TiCe-2; Figure S7: Elemental EDS mapping of Al K series; C K series; Ce L series; Ti K series, and O K series on the center of the TiCe-2 film; Table S7: Data obtained from EDS mapping for sample TiCe-3; Figure S8: EDS layered image taken in the center of the TiCe-2 film; Figure S9: EDS map spectrum of the TiCe-2 film taken from the center; Figure S10: Elemental EDS mapping of Al K series, C K series, Ce L series, Ti K series, and O K series on the center of the TiCe-3 film; Figure S11: EDS layered image taken in the center of the TiCe-3 film; Figure S12: EDS map spectrum of the TiCe-3 film taken from the center; Figure S13: Current-voltage characteristics of a TiCe-1-based sensor at 10, 50 and 90% of O2 at 310 °C; Figure S14: Example of resistance time tracking at different volume concentrations of O2 for the sample TiCe-3; Figure S15: Relative change of resistance with for the sample TiCe-3; Figure S16: DC resistance of CeO2 and mixed oxides when exposed to different volume concentrations of O2 at a temperature of 310 °C; Figure S17: Schematic representation of the experimental setup for measuring the sensor response. References [23,80,81,82,83,84,85,86] are cited in Supplementary Materials.

Author Contributions

Conceptualization, J.N.S. and S.P.P.; methodology, M.S. and N.B.; validation, D.V.-R. and S.P.P.; formal analysis, A.G.S., N.B. and S.P.P.; investigation, J.N.S., A.G.S. and N.B.; resources, O.M.N.D.T.; writing—original draft preparation, M.S.; writing—review and editing, A.G.S., N.B. and S.P.P.; visualization, D.V.-R. and S.P.P.; supervision: S.P.P.; project administration, D.V.-R.; funding acquisition, D.V.-R. and O.M.N.D.T. All authors have read and agreed to the published version of the manuscript.

Funding

This work was founded by the Ministry of Science, Technological Development and Innovation of the Republic of Serbia (grant number 451-03-136/2025-03/200026) and the Unidade CEFITEC: Centro de Física e Investigação Tecnológica (the funding of the project UIDB/00068/2025). The mass flow controllers (MFCs) used in the experiments were obtained through funding from the Science Fund of the Republic of Serbia, grant number 6057070, Gramulsen project.

Institutional Review Board Statement

Not applicable.

Informed Consent Statement

Not applicable.

Data Availability Statement

Data for this article, including the raw, processed and calculated data for all the spectra and calculations, are available at Mendeley Data: https://data.mendeley.com/datasets/5wck88xj8g/3 (accessed on 17 July 2014) DOI: 10.17632/5wck88xj8g.3.

Acknowledgments

We thank Smilja Marković (Particle size analysis) and Danica Bajuk-Bogdanović (Raman spectra acquisition) for their scientific assistance. The authors also acknowledge the staff of Cenimat (FCT-UNL), Daniela Gomes (SEM images acquisition) and Joana Vaz Pinto (XRD data acquisition).

Conflicts of Interest

The authors declare no conflicts of interest.

References

  1. Sekereci, Y.; Petrovskii, S. Global Warming Can Lead to Depletion of Oxygen by Disrupting Phytoplankton Photosynthesis: A Mathematical Modelling Approach. Geosciences 2018, 8, 201. [Google Scholar] [CrossRef]
  2. Manandhar, S.; Batu, A.K.; Deveraj, A.; Shuttanandan, V.; Thevuthasan, S.; Ramana, C.V. Rapid response high temperature oxygen sensor based on titanium doped gallium oxide. Sci. Rep. 2020, 10, 178. [Google Scholar] [CrossRef] [PubMed]
  3. Willett, M. Oxygen sensing for industrial safety—Evolution and new approaches. Sensors 2014, 14, 6084–6103. [Google Scholar] [CrossRef] [PubMed]
  4. Dey, A. Semiconductor metal oxide gas sensor: A review. Mater. Sci. Eng. B 2018, 229, 206–217. [Google Scholar] [CrossRef]
  5. Nikolic, M.V.; Milovanovic, V.; Vasiljevic, Z.Z.; Stamenkovic, Z. Semiconductor gas sensors: Materials, technology, design, and application. Sensors 2022, 20, 6694. [Google Scholar] [CrossRef]
  6. Li, P.; Chen, X.; Li, Y.; Schwank, J.W. A review on oxygen storage capacity of CeO2-based materials: Influence factors, measurement techniques, and applications in reactions related to catalytic automotive emissions control. Catal. Today 2019, 327, 90–115. [Google Scholar] [CrossRef]
  7. Nakagawa, K.; Murata, Y.; Kishida, M.; Adachi, M.; Hiro, M.; Susa, K. Formation and reaction activity of CeO2 nanoparticles of cubic structure and various shaped CeO2–TiO2 composite nanostructures. Mater. Chem. Phys. 2007, 104, 30–39. [Google Scholar] [CrossRef]
  8. Liu, C.; Zang, W.; Pan, J.; Qian, J.; Wang, Y.; Chen, F.; Zhou, Y.; Song, Y. Low temperature CO oxidation on cerium dioxide nanorods. Mater. Res. Express 2019, 6, 075060. [Google Scholar] [CrossRef]
  9. Choudhury, B.; Chetri, P.; Choudhury, A. Oxygen defects and formation of Ce3+ affecting the photocatalytic performance of CeO2 nanoparticles. RSC Adv. 2014, 4, 4663–4671. [Google Scholar] [CrossRef]
  10. Fang, J.; Bi, X.; Si, D.; Jiang, Z.; Huang, W. Spectroscopic studies of interfacial structures of CeO2-TiO2 mixed oxides. Appl. Surf. Sci. 2007, 253, 8952–8961. [Google Scholar] [CrossRef]
  11. Kortocenkov, G. Metal oxides for solid state gas sensors: What determines our choice. Mater. Sci. Eng. B 2007, 139, 1–23. [Google Scholar] [CrossRef]
  12. Saruhan, B.; Fomekong, R.L.; Nahirniak, S. Influences of semiconductor metal oxide properties on gas sensing characteristics. Front. Sens. 2021, 2, 657931. [Google Scholar] [CrossRef]
  13. Luo, S.; Nguyen-Phan, T.; Johnston-Peck, A.C.; Barrio, L.; Sallis, S.; Arena, D.A.; Kundu, S.; Xu, W.; Piper, L.F.J.; Stach, E.A.; et al. Hierarchical heterogeneity at the CeOx-TiO2 Interface: Electronic and geometric structural influence on the photocatalytic activity of oxide on oxide nanostructures. J. Phys. Chem. C 2019, 119, 2669–2679. [Google Scholar] [CrossRef]
  14. Watanabe, S.; Ma, X.; Song, C. Characterization of structural and surface properties of nanocrystalline TiO2-CeO2 mixed oxides by XRD, XPS, TPR, and TPD. J. Phys. Chem. C 2009, 113, 14249–14257. [Google Scholar] [CrossRef]
  15. Zeng, Y.; Haw, K.G.; Wang, Y.; Zhang, S.; Wang, Z.; Zhong, Q.; Kawi, S. Recent progress of CeO2-TiO2 based catalysts for selective catalytic reduction of NOx by NH3. ChemCatChem 2021, 13, 491–505. [Google Scholar] [CrossRef]
  16. Gionco, C.; Giamello, E.; Mino, L.; Paganini, M.C. The interaction of oxygen with the surface of CeO2-TiO2 mixed systems: An example of fully reversible surface-to-molecule electron transfer. Phys. Chem. Chem. Phys. 2014, 16, 21438–21445. [Google Scholar] [CrossRef]
  17. Zhang, J.; Qin, Z.; Zeng, D.; Xie, C. Metal-oxide-semiconductor based gas sensors: Screening, preparation, and integration. Phys. Chem. Chem. Phys. 2017, 19, 6313–6329. [Google Scholar] [CrossRef]
  18. Stefa, S.; Lykaki, M.; Fragkoulis, D.; Binas, V.; Pandis, P.K.; Stathopoulos, V.N.; Konsolakis, M. Effect of the preparation method on the physicochemical properties and the CO oxidation performance of nanostructured CeO2/TiO2 Oxides. Processes 2020, 8, 847. [Google Scholar] [CrossRef]
  19. Rožić, L.; Petrović, S.; Lončarević, D.; Grbić, B.; Radić, N.; Stojadinović, S.; Jović, V.; Lamovec, J. Influence of annealing temperature on structural, optical and photocatalytic properties of TiO2-CeO2 nanopowders. Ceram. Int. 2019, 45, 2361–2367. [Google Scholar] [CrossRef]
  20. Petrović, S.; Rožić, L.; Jović, V.; Stojadinović, S.; Grbić, B.; Radić, N.; Lamovec, J.; Vasilic, R. Optimization of a nanoparticle ball milling process parameters using the response surface method. Adv. Powder. Technol. 2018, 29, 2129–2139. [Google Scholar] [CrossRef]
  21. Petrović, S.; Rožić, L.; Grbić, B.; Radić, N.; Stefanov, P.; Stojadinović, S.; Jović, V.; Lamovec, J. Effect of high energy ball milling on the physicochemical properties of TiO2-CeO2 mixed oxide and its photocatalytic behavior in the oxidation reaction. React. Kinet. Mech. Catal. 2019, 127, 175–186. [Google Scholar] [CrossRef]
  22. Burmeister, C.F.; Kwade, A. Process engineering with planetary ball mills. Chem. Soc. Rev. 2013, 42, 7660. [Google Scholar] [CrossRef] [PubMed]
  23. Furlani, E.; Aneggi, E.; Leitenburg, C.; Maschio, S. High energy ball milling of titania and titania-ceria powder mixtures. Powder Technol. 2014, 254, 591–596. [Google Scholar] [CrossRef]
  24. Leonardi, M.; Villacampa, M.; Menendez, J.C. Multicomponent mechanochemical synthesis. Chem. Sci. 2018, 9, 2042–2064. [Google Scholar] [CrossRef]
  25. James, S.L.; Adams, C.J.; Bolm, C.; Braga, D.; Collier, P.; Frišćić, T.; Grepioni, F.; Harris, K.D.M.; Hyett, G.; Jones, W.; et al. Mechanochemistry: Opportunities for new and cleaner synthesis. Chem. Soc. Rev. 2012, 41, 413–447. [Google Scholar] [CrossRef]
  26. Amrute, A.P.; De Bellis, J.; Felderhoff, M.; Schüth, F. Mechanochemical synthesis of catalytic materials. Chem. Eur. J. 2021, 27, 6819–6847. [Google Scholar] [CrossRef]
  27. Szczesniak, B.; Choma, J.; Jaroniec, M. Recent advances in mechanochemical synthesis of mesoporous metal oxides. Mater. Adv. 2021, 2, 2510–2523. [Google Scholar] [CrossRef]
  28. El-Eskandarany, M.S. (Ed.) The history and necessity of mechanical alloying. In Mechanical Alloying, 2nd ed.; William Andrew Publishing: New York, NY, USA, 2015; p. 23. [Google Scholar]
  29. Stevanović, J.N.; Petrović, S.P.; Tadić, N.B.; Cvetanović, K.; Silva, A.G.; Radović, D.V.; Sarajlić, M. Mechanochemical synthesis of TiO2-CeO2 mixed oxides utilized as a screen-printed sensing material for oxygen sensor. Sensors 2023, 23, 1313. [Google Scholar] [CrossRef]
  30. Balanč, B.; Trifković, K.; Đorđević, V.; Marković, S.; Pjanović, R.; Nedović, V.; Bugarski, B. Novel resveratrol delivery systems based on alginate-sucrose and alginate-chitosan microbeads containing liposomes. Food Hydrocoll. 2016, 61, 832–842. [Google Scholar] [CrossRef]
  31. Šepelák, V.; Düvel, A.; Wilkening, M.; Decker, K.D.; Heitjans, P. Mechanochemical reactions and syntheses of oxides. Chem. Soc. Rev. 2013, 42, 7507–7520. [Google Scholar] [CrossRef]
  32. Baláž, M. Ball milling of eggshell waste as a green and sustainable approach. Adv. Colloid. Interface Sci. 2018, 256, 256–275. [Google Scholar] [CrossRef] [PubMed]
  33. Rinaudo, M.G.; Beltrán, A.M.; Fernández, M.A.; Cadús, L.E.; Morales, M.R. Tailoring materials by high-energy ball milling: TiO2 mixtures for catalyst support application. Mater. Today Chem. 2020, 17, 100340. [Google Scholar] [CrossRef]
  34. Yuesong, S.; Dahai, Z.; Bo, Y.; Songbo, N.; Shemin, Z. Synergetic catalyst of ceria and titania for selective reduction of NO. J. Rare Earths 2012, 30, 431–436. [Google Scholar] [CrossRef]
  35. Nath, A.K.; Jiten, C.; Chandramani Singh, K. Influence of ball milling parameters on the particle size of barium titanate nanocrystalline powders. Phys. B Condens. 2010, 405, 430–434. [Google Scholar] [CrossRef]
  36. Singh, P.; Abhash, A.; Yadav, B.N.; Shafeeq, M.; Singh, I.B.; Mondal, D.P. Effect of milling time on powder characteristics and mechanical performance of Ti4wt%Al alloy. Powder Technol. 2018, 342, 275–287. [Google Scholar] [CrossRef]
  37. Ungár, T. Microstructural parameters from X-ray diffraction peak broadening. Scr. Mater. 2004, 51, 777–781. [Google Scholar] [CrossRef]
  38. Pang, Y.; Liu, Y.; Zhang, X.; Gao, M.; Pan, H. Role of particle size, grain size, microstrain and lattice distortion in improved dehydrogenation properties of the ball-milled Mg(AlH4)2. Int. J. Hydrogen Energy 2013, 38, 1460–1468. [Google Scholar] [CrossRef]
  39. Stevanovic, J.; Silva, A.C.; Bundaleski, N.; Vasiljevic-Radovic, D.; Sarajlic, M.; Teodoro, O.M.N.D.; Petrovic, S. Oxygen Sensitivity of Titania-Ceria Mixtures Treated in a High-Energy Ball Mill: Potential for Improved Detection. Mendeley Data, v3. Available online: https://data.mendeley.com/datasets/5wck88xj8g/3 (accessed on 17 July 2024).
  40. Arbain, R.; Othman, M.; Palaniandy, S. Preparation of iron oxide nanoparticles by mechanical milling. Miner. Eng. 2011, 24, 1–9. [Google Scholar] [CrossRef]
  41. Venkataraman, K.S.; Narayanan, K.S. Energetics of collision between grinding media in ball mills and mechanochemical effects. Powder Technol. 1998, 96, 190–201. [Google Scholar] [CrossRef]
  42. Rajamani, R.K.; Songfack, P.; Mishra, B.K. Impact energy spectra of tumbling mills. Powder Technol. 2000, 108, 116–121. [Google Scholar] [CrossRef]
  43. Dhara, S.; Giri, P.K. Size Dependent anisotropic strain and optical properties of strained Si nanocrystals. J. Nanosci. Nanotechnol. 2011, 11, 9215–9221. [Google Scholar] [CrossRef] [PubMed]
  44. Torres-Romero, A.; Cajero-Juárez, M.; Nuñez-Anita, R.E.; Contreras-García, M.E. Ceria-doped titania nanoparticles as drug delivery system. J. Nanosci. Nanotechnol. 2020, 20, 3971–3980. [Google Scholar] [CrossRef] [PubMed]
  45. Cullity, B.D. Elements of X-Ray Diffraction, 2nd ed.; Addison-Wesley Publishing Company: Boston, MA, USA, 1956; pp. 259–295. [Google Scholar]
  46. Vieira, G.B.; Jose, H.J.; Peterson, M.; Baldissarelli, V.Z.; Alvarez, P.; Moreira, R.F.P.M.M. CeO2/TiO2 nanostructures enhance adsorption and photocatalytic degradation of organic compounds in aqueous suspension. J. Photochem. Photobiol. A 2018, 352, 325–336. [Google Scholar] [CrossRef]
  47. Reddy, B.M.; Khan, A.; Yamada, Y.; Kobayashi, T.; Loridant, S.; Volta, J.C. Structural characterization of CeO2-TiO2 and V2O5/CeO2-TiO2 catalysts by Raman and XPS techniques. J. Phys. Chem. B 2003, 107, 5162–5167. [Google Scholar] [CrossRef]
  48. Baidya, T.; Gayen, A.; Hedge, M.S.; Ravishankar, N.; Dupont, L. Enhanced reducibility of Ce1x2212;xTixO2 compared to that of CeO2 and higher redox catalytic activity of Ce1x2212;xx2212;yTixPtyO2x2212;δ compared to that of Ce1−xPtxO2−δ. J. Phys. Chem. B 2006, 110, 5262–5272. [Google Scholar] [CrossRef]
  49. Cheng, F.; Zhang, F.; Liu, Y.; Guo, M.; Cheng, C.; Hou, J.; Miao, Y. Ti4+-incorporated fluorite-structured high-entropy oxide (Ce,Hf,Y,Pr,Gd)O2−δ: Optimizing preparation and CMAS corrosion behavior. J. Adv. Ceram. 2022, 11, 1801–1814. [Google Scholar] [CrossRef]
  50. Ramshanker, N.; Ganapathi, K.L.; Bhat, M.S.; Mohan, S. RF sputtered CeO2 thin films-based oxygen sensors. IEEE Sens. J. 2019, 19, 10821–10828. [Google Scholar] [CrossRef]
  51. Sakai, G.; Baik, N.S.; Miura, N.; Yamazoe, N. Gas sensing properties of tin oxide thin film fabricated from hydrothermally treated nanoparticles: Dependence of CO and H2 response of film thickness. Sens. Actuators B Chem. 2001, 77, 116–121. [Google Scholar] [CrossRef]
  52. Gadelmawla, E.S.; Koura, M.M.; Maksoud, T.M.A.; Elewa, I.M.; Soliman, H.H. Roughness parameters. J. Mater. Process. Technol. 2002, 123, 133–145. [Google Scholar] [CrossRef]
  53. Deka, K.; Nath, N.; Saikia, B.K.; Deb, P. Kinetic analysis of ceria nanoparticle catalyzed efficient biomass pyrolysis for obtaining high-quality bio-oil. J. Therm. Anal. Calorim. 2017, 130, 1875–1883. [Google Scholar] [CrossRef]
  54. Porto, S.P.S.; Fleury, P.A.; Damen, T.C. Raman spectra of TiO2, MgF2, ZnF2, FeF2, and MnF2. Phys. Rev. 1967, 154, 522. [Google Scholar] [CrossRef]
  55. Robert, T.D.; Laude, L.D.; Geskin, V.M.; Lazzaroni, R.; Gouttebaron, R. Micro-Raman spectroscopy study of surface transformations induced by excimer laser irradiation of TiO2. Thin Solid Film. 2003, 440, 268–277. [Google Scholar] [CrossRef]
  56. Hardcastle, F.; Ishihara, H.; Sharma, R.; Boris, A.S. Photoelectroactivity and Raman spectroscopy of anodized titania (TiO2) photoactive water-splitting catalysts as a function of oxygen-annealing temperature. J. Mater. Chem. 2011, 21, 6337–6345. [Google Scholar] [CrossRef]
  57. Reddy, B.M.; Khan, A.; Yamada, Y.; Kobayashi, T.; Loridant, S.; Volta, J.C. Structural characterization of CeO2-MO2 (M = Si4+, Ti4+, and Zr4+) mixed oxides by Raman spectroscopy, X-ray photoelectron spectroscopy, and other techniques. J. Phys. Chem. B 2003, 107, 11475–11484. [Google Scholar] [CrossRef]
  58. Siuzdak, K.; Sawczak, M.; Klein, M.; Nowaczyk, G.; Jurgac, S.; Ceniana, A. Preparation of platinum modified titanium dioxide nanoparticles with the use of laser ablation in water. Phys. Chem. Chem. Phys. 2014, 16, 15199–15206. [Google Scholar] [CrossRef]
  59. Nicol, M.; Fong, M.Y. Raman spectrum and polymorphism of titanium dioxide at high pressures. J. Chem. Phys. 1971, 54, 3167–3170. [Google Scholar] [CrossRef]
  60. Gajović, A.; Stubičar, M.; Ivanda, M.; Furić, K. Raman spectroscopy of ball-milled TiO2. J. Mol. Struct. 2001, 563–564, 315–320. [Google Scholar] [CrossRef]
  61. Begin-Colin, S.; Girot, T.; Mocellin, A.; Le Caër, G. Kinetics of formation of nanocrystalline TiO2 II by high energy ball-milling of anatase TiO2. Nanostruct. Mater. 1999, 12, 195–198. [Google Scholar] [CrossRef]
  62. Gyakwaa, F.; Aula, M.; Alatarvas, T.; Vuolio, T.; Shu, Q.; Huttula, M.; Fabritius, T. Application of Raman spectroscopy for characterizing synthetic non-metallic inclusions consisting of calcium sulphide and oxides. Appl. Sci. 2020, 10, 2113. [Google Scholar] [CrossRef]
  63. Ellouzi, I.; Oualid, H.A. Efficient and eco-friendly mechanical milling preparation of anatase/rutile TiO2-glucose composite with energy gap enhancement. Proceedings 2019, 3, 3. [Google Scholar] [CrossRef]
  64. Takacs, L.; McHenry, J.S. Temperature of the milling balls in shaker and planetary mills. J. Mater. Sci. 2006, 41, 5246–5249. [Google Scholar] [CrossRef]
  65. López, T.; Rojas, F.; Alexander-Katz, R.; Galindo, F.; Balankin, A.; Buljan, A. Porosity, structural and fractal study of sol-gel TiO2-CeO2 mixed oxides. J. Solid. State Chem. 2004, 177, 1873–1885. [Google Scholar] [CrossRef]
  66. Yao, X.; Zhao, R.; Chen, L.; Du, J.; Tao, C.; Yang, F.; Dong, L. Selective catalytic reduction of NOx by NH3 over CeO2 supported on TiO2: Comparison of anatase, brookite, and rutile. Appl. Catal. B Environ. 2017, 208, 82–93. [Google Scholar] [CrossRef]
  67. Carter, J.H.; Shah, P.M.; Nowicka, E.; Freakley, S.J.; Morgan, D.J.; Golunski, S.; Hutchings, G.J. Enhanced activity and stability of gold/ceria-titania for the low temperature water-gas shift reaction. Front. Chem. Sec. Catal. Photocatal. 2019, 7, 443. [Google Scholar] [CrossRef]
  68. Ma, W.; Lu, Z.; Zhang, M. Investigation of structural transformations in nanophase titanium dioxide by Raman spectroscopy. Appl. Phys. A 1998, 66, 621–627. [Google Scholar] [CrossRef]
  69. Loridant, S. Raman spectroscopy as a powerful tool to characterize ceria-based catalysts. Catal. Today 2021, 373, 98–111. [Google Scholar] [CrossRef]
  70. Rezaee, M.; Khoie, S.M.M.; Liu, K.H. The role of brookite in mechanical activation of anatase-to-rutile transformation of nanocrystalline TiO2: An XRD and Raman spectroscopy investigation. CrystEngComm 2011, 13, 5055–5061. [Google Scholar] [CrossRef]
  71. Dhara, S.; Giri, P.K. Size-dependent visible absorption and fast photoluminescence decay dynamics from freestanding strained silicon nanocrystals. Nanoscale Res. Lett. 2011, 6, 320. [Google Scholar] [CrossRef]
  72. Zhao, L.; Chang, H.; Zhao, W.; Luan, Z.; Tian, X.; Tan, C.; Huang, Y. Coexistence of doping and strain to tune electronic and optical properties of GaN monolayer. Superlattices Microstruct. 2019, 130, 93–102. [Google Scholar] [CrossRef]
  73. Swamy, V. Size-dependent modifications of the first-order Raman spectra of nanostructured rutile TiO2. Phys. Rev. B 2008, 77, 195414. [Google Scholar] [CrossRef]
  74. Stamenković, T.; Bundaleski, N.; Barudžija, T.; Validžić, I.; Lojpur, V. XPS study of iodine and tin-doped Sb2S3 nanostructures affected by non-uniform charging. Appl. Surf. Sci. 2021, 567, 150822. [Google Scholar] [CrossRef]
  75. Biesinger, M.C.; Lau, L.W.M.; Gerson, A.R.; Smart, R.S.C. Resolving surface chemical states in XPS analysis of first row transition metals, oxides and hydroxides: Sc, Ti, V, Cu and Zn. Appl. Surf. Sci. 2010, 257, 887–898. [Google Scholar] [CrossRef]
  76. Beamson, G.; Briggs, D. High Resolution XPS of Organic Polymers: The Scienta ESCA300 Database; Wiley Interscience: Chichester, UK, 1992. [Google Scholar]
  77. Burroughs, P.; Hamnett, A.; Orchard, A.F.; Thornton, G.J. Satellite Structure in the X-Ray Photoelectron Spectra of some Binary and Mixed Oxides of Lanthanum and Cerium. J. Chem. Soc. Dalton Trans. 1967, 17, 1686–1698. [Google Scholar] [CrossRef]
  78. Gawande, M.B.; Bonifácio, V.D.B.; Varma, R.S.; Nogueira, I.D.; Bundaleski, N.; Ghumman, C.A.A.; Teodoro, O.M.N.D.; Branco, P.S. Magnetically recyclable magnetite-ceria (Nanocat-Fe-Ce) nanocatalyst—Applications in multicomponent reactions under benign condition. Green. Chem. 2013, 15, 1226–1231. [Google Scholar] [CrossRef]
  79. Han, Z.K.; Zhang, L.; Liu, M.; Ganduglia-Pirovano, M.V. The structure of oxygen vacancies in the near-surface of reduced CeO2 (111) under strain. Front. Chem. 2019, 7, 436. [Google Scholar] [CrossRef]
  80. Riemer, D.E. The Theoretical Fundamentals of the Screen Printing Process. Microelectron. Int. 1989, 6, 8–17. [Google Scholar] [CrossRef]
  81. Averardi, A.; Cola, C.; Zeltmann, S.E.; Gupta, N. Effect of particle size distribution on the packing ofpowder beds: A critical discussion relevant to additive manufacturing. Mater. Today Commun. 2018, 24, 75–78. [Google Scholar] [CrossRef]
  82. Spierings, A.B.; Herres, N.; Levy, G. Influence of the particle size distribution on surface quality andmechanical properties in AM steel parts. Rapid Prototyp. J. 2011, 17, 195–202. [Google Scholar] [CrossRef]
  83. Yeh, J.J.; Lindau, I. Atomic subshell photoionization cross sections and asymmetry parameters: 1 ≤ Z ≤ 103. Atom. Data Nucl. Data 1985, 32, 1–155. [Google Scholar] [CrossRef]
  84. Powell, C.J.; Jablonski, A. Effective Attenuation Length Database; Version 1.3, SRD 82; National Institute of Standards and Technology, NIST: Gaithersburg, MD, USA, 2011. [Google Scholar]
  85. Tanuma, S.; Powell, C.J.; Penn, D.R. Calculations of electron inelastic mean free paths. V. Data for 14organic compounds over the 50–2000 eV range. Surf. Interface Anal. 1994, 21, 165–176. [Google Scholar] [CrossRef]
  86. Seah, M.P.; Gilmore, I.S. Quantitative AES. VIII: Analysis of auger electron intensities from elementaldata in a digital auger database. Surf. Interface Anal. 1998, 26, 908–929. [Google Scholar] [CrossRef]
  87. Lewis, S.E.; De Boer, J.R.; Gole, J.L.; Hesketh, P.J. Sensitive, selective, and analytical improvements to a porous silicon gas sensor. Sens. Actuators B Chem. 2005, 110, 54–65. [Google Scholar] [CrossRef]
  88. Korotcenkov, G.; Cho, B.K. Instability of metal oxide-based conductometric gas sensors and approaches to stability improvement (short survey). Sens. Actuators B Chem. 2011, 156, 527–538. [Google Scholar] [CrossRef]
  89. Yamazoe, N.; Shimanoe, K. Proposal of contact potential promoted oxide semiconductor gas sensor. Sens. Actuators B Chem. 2013, 187, 162–167. [Google Scholar] [CrossRef]
  90. Wang, C.; Yin, L.; Zhang, L.; Xiang, D.; Gao, R. Review: Metal oxide gas sensors: Sensitivity and influencing factors. Sensors 2010, 10, 2088–2106. [Google Scholar] [CrossRef]
  91. Yamazoe, N.; Shimanoe, K. Basic approach to the transducer function of oxide semiconductor gas sensors. Sens. Actuators B Chem. 2011, 160, 1352–1362. [Google Scholar] [CrossRef]
  92. Ito, S.; Chen, P.; Comte, P.; Nazeeruddin, M.K.; Liska, P.; Péchy, P.; Grätze, M. Fabrication of screen-printing pastes from TiO2 powders for dye-sensitized solar cells. Prog. Photovolt. Res. Appl. 2017, 15, 603–612. [Google Scholar] [CrossRef]
  93. Gonzalez-Gutierrez, J.; Cano, S.; Schuschnigg, S.; Kukla, C.; Sapkota, J.; Holzer, C. Additive manufacturing of metallic and ceramic components by the material extrusion of highly-filled polymers: A review and future perspectives. Materials 2018, 11, 840. [Google Scholar] [CrossRef]
  94. Teodoro, O.M.N.D.; Silva, J.A.M.C.; Moutinho, A.M.C. Multitechnique surface analysis system: Apparatus description. Vacuum 1995, 46, 1205–1209. [Google Scholar] [CrossRef]
Figure 1. Volume-based particle size distribution of the pure and milled powders.
Inorganics 13 00159 g001
Figure 2. XRD patterns of the starting and milled powders. “A” denotes anatase, while “R” denotes rutile.
Inorganics 13 00159 g002
Figure 3. Average crystallite size and microstrain of the milled mixtures.
Inorganics 13 00159 g003
Figure 4. SEM images showing the surfaces of pure CeO2 and TiO2-modified CeO2 at magnifications of 2 k (left) and 20 k (right). All the images are taken from the center of the paste region.
Inorganics 13 00159 g004
Figure 5. Raman spectra of the starting oxides and mixtures; an asterisk (*) denotes the band at 177 cm−1, while “r” is ascribed to multiple phonons scattering on the rutile phase.
Inorganics 13 00159 g005
Figure 6. Detailed spectra of (a) the Ti 2p line; (b) the Ce 3d line (the shaded peaks belong to Ce3+, while the set of “v” peaks is assigned to the angular momentum 5/2, and “u” to 3/2); (c) the C 1s line; and (d) the O 1s line.
Inorganics 13 00159 g006aInorganics 13 00159 g006b
Figure 7. DC resistance of the CeO2 and mixed oxides when exposed to different volumetric concentrations of O2 at a temperature of 310 °C: data plotted with a logarithmic scale.
Inorganics 13 00159 g007
Figure 8. Change in the sensitivity with the O2 concentration for CeO2 and the sensors based on mixtures.
Inorganics 13 00159 g008
Figure 10. TCO sensor, on the (left): top side of a substrate with electrodes and underside of a substrate with heater; on the (right): final products.
Inorganics 13 00159 g010
Table 1. Characteristic diameters (d10, d50, and d90) and span values of the particle size distributions.
Sampled10 [µm]d50 [µm]d90 [µm]Span
TiO21.253.7010.612.53
CeO23.8022.5855.812.30
TiCe-10.674.4621.064.57
TiCe-20.752.648.532.94
TiCe-30.903.37512.013.29
Table 2. CeO2 (111) peak position and interplanar, or d-spacing, in the pure and TiO2-modified oxides.
SamplePeak Position [°]d-Spacing [Å]
CeO228.553.124
TiCe-128.543.125
TiCe-228.533.126
TiCe-328.613.117
Table 3. Surface roughness parameters and thicknesses of the mixed oxides obtained from the 2D profilometry data.
SampleRa [nm]Rq [nm]Thickness [μm]
TiCe-1660820≈7.7
TiCe-2543752≈4.4
TiCe-3562711≈4.7
Table 4. Results of the EDS elemental analysis of the TiCe-1, TiCe-2 and TiCe-3.
SampleWeight (%)Ti:Ce Weight Ratio
Expected/Calculated
TiCeOCAl
TiCe-111.0061.9320.795.990.290.25/0.18
TiCe-211.2364.7117.775.960.330.25/0.17
TiCe-310.4459.8321.288.120.330.25/0.17
Table 5. Intensity ratio of the anatase-to-rutile phase.
SpectrumIa–Ir
TiO21.12
TiCe-15.49
TiCe-21.46
TiCe-31.12
Table 6. Binding energies [eV] of the Ti 2p, Ce 3d, C 1s, and O 1s core-level peaks. Only one component of the spin–orbit splitting for Ti 2p and Ce 3d is shown.
Ti 2pCe 3dC 1sO 1s
3/2vv′v″v‴C-C(H)C-OO1O2O3O4
TiO2460.1////286.6288.1531.0532.3533.9/
CeO2/889.5891.9896.3905.5285.5287.0536.7539.2532.8/
TiCe-1464.7888.6890.6895.4904.6290.8291.8535.8537.1538.6/
TiCe-2465.3889.2891.2896.0905.2291.5 (CH1)
286.4 (CH2 I)
285.0 (CH2 II)
292.4 (CH1)536.5537.8539.3/
TiCe-3464.4888.4890.6895.2907.0290.7 (CH1)
285.5 (CH2)
292.8 (CH1)
287.5 (CH2)
535.4536.7538.3533.0
Table 7. The surface coverage values (θTi and θCe), hydrocarbon layer thickness (d), and concentration ratio (O:Ti–O:Ce).
SampleθTi:θCe [%]d [nm]O:Ti–O:Ce
TiO2 1.15O:Ti = 1.98
CeO2 2.73O:Ce = 2.52
TiCe-143:571.51O:Ce = 2.65
TiCe-231.7:68.32.42O:Ce = 2.72
TiCe-334.5:65.52.15O:Ce = 2.70
Disclaimer/Publisher’s Note: The statements, opinions and data contained in all publications are solely those of the individual author(s) and contributor(s) and not of MDPI and/or the editor(s). MDPI and/or the editor(s) disclaim responsibility for any injury to people or property resulting from any ideas, methods, instructions or products referred to in the content.

