Article

Lanthanide Heterometallic MOFs with 5-Iodosophthalate Linkers: Tuning of Luminescent Properties by Varying of Metal Composition

by
Mikhail A. Bondarenko
1,
Roman V. Redkin
1,2,
Elizaveta A. Pilyukova
1,2,
Nikita A. Korobeynikov
1,
Alexander S. Zaguzin
1,
Marianna I. Rakhmanova
1,
Tatiana Ya. Guselnikova
1,
Evgeny A. Maksimovsky
1,
Vladimir P. Fedin
1 and
Sergey A. Adonin
1,3,*
1
Nikolaev Institute of Inorganic Chemistry, Siberian Branch, Russian Academy of Sciences, Novosibirsk 630090, Russia
2
Faculty of Natural Sciences, Novosibirsk State University, Novosibirsk 630090, Russia
3
Favorsky Irkutsk Institute of Chemistry, Siberian Branch, Russian Academy of Sciences, Irkutsk 664033, Russia
*
Author to whom correspondence should be addressed.
Inorganics 2025, 13(5), 154; https://doi.org/10.3390/inorganics13050154
Submission received: 18 April 2025 / Revised: 1 May 2025 / Accepted: 4 May 2025 / Published: 7 May 2025
(This article belongs to the Section Coordination Chemistry)

Abstract

:
Coordination polymers [Gd2(5-iip)3(DMF)4]·0.4DMF (1) and [Dy2(5-iip)3DMF2]·0.33DMF (2) (5-iip2−—5-iodoisophthalate) feature two different structural types, as follows from X-ray diffractometry data. We prepared and characterized an extended series of corresponding heterometallic complexes of the composition [GdxDy2−x(5-iip)3DMF2]·0.33DMF and [EuxDy2−x(5-iip)3DMF2]·0.33DMF, where x = 0.2, 0.4…1.8, and examined the changes of their luminescent properties induced by variations of metal composition, finding the promising white emission sources with high light purity.

1. Introduction

For a long time, metal–organic frameworks (MOFs) remain one of the major topics in modern coordination chemistry and related materials science, attracting numerous research teams from all over the world [1,2,3,4,5,6,7]. This interest is related to numerous useful properties demonstrated by this class of hybrid porous materials. They can be used in separation of complex mixtures of gases [8,9,10,11,12,13,14] and/or liquid organic substrates [15,16,17,18], catalysis [19,20], design of sensors [21,22,23], etc. Using combinations of organic linkers of different topology, it is possible to prepare coordination polymers of highly diverse structural types, thereby providing virtually unlimited opportunities for molecular design of desired 3D MOFs.
From the point of view of supramolecular chemistry, it is quite obvious that sorption properties of porous MOF towards certain organic or inorganic substances depend not only on the geometry of pores but also on the ability of MOF linker ligands to form a certain system of non-covalent interactions with the abovementioned substrates which can be responsible for the appearance of sorption and/or sensing selectivity. Usually, hydrogen bonds (HBs) play the most important role here. However, in recent years it has been shown that so-called halogen bond (XB), a specific type of non-covalent interactions involving halogen atoms which is being extensively studied currently [24,25,26,27,28,29], can be an efficient additional tool for “fine tuning” of MOF properties [30,31,32]. This option can be implemented by using halogen (especially iodine)-substituted linkers.
Probably the most widespread linker ligands in MOF chemistry are polycarboxylates [33,34,35,36,37,38,39], especially those which are not only commercially available but also affordable, such as terephthalate or isophthalate. From this point of view, the use of their iodinated derivatives can be a promising strategy in terms of appearance of XB-related effects in resulting MOFs. Earlier, we demonstrated [40] that this approach indeed works well for 2-iodoterephthalate-based heteroleptic polymeric complexes.
Ln3+ coordination polymers are being studied mostly due to their luminescent behavior [41,42,43]. These properties can be tuned by isomorphous substitution of Ln3+ (preparation of heterometallic complexes) [44].
In this work, we prepared 5-iodoisophthalate (5-iip) Ln3+-MOFs (Ln = Gd (1), Dy (2)), as well as a series of heterometallic GdxDy2−x-, EuxDy2−x-derivatives. Compounds 1 and 2 are not isostructural; they are characterized using X-ray diffraction. Mixed-metal frameworks are isostructural to 2, regardless of the element ratio, according to X-ray powder diffraction data. The exact ratio of lanthanides was determined using ICP OES, after which the luminescent properties were studied.

2. Results and Discussion

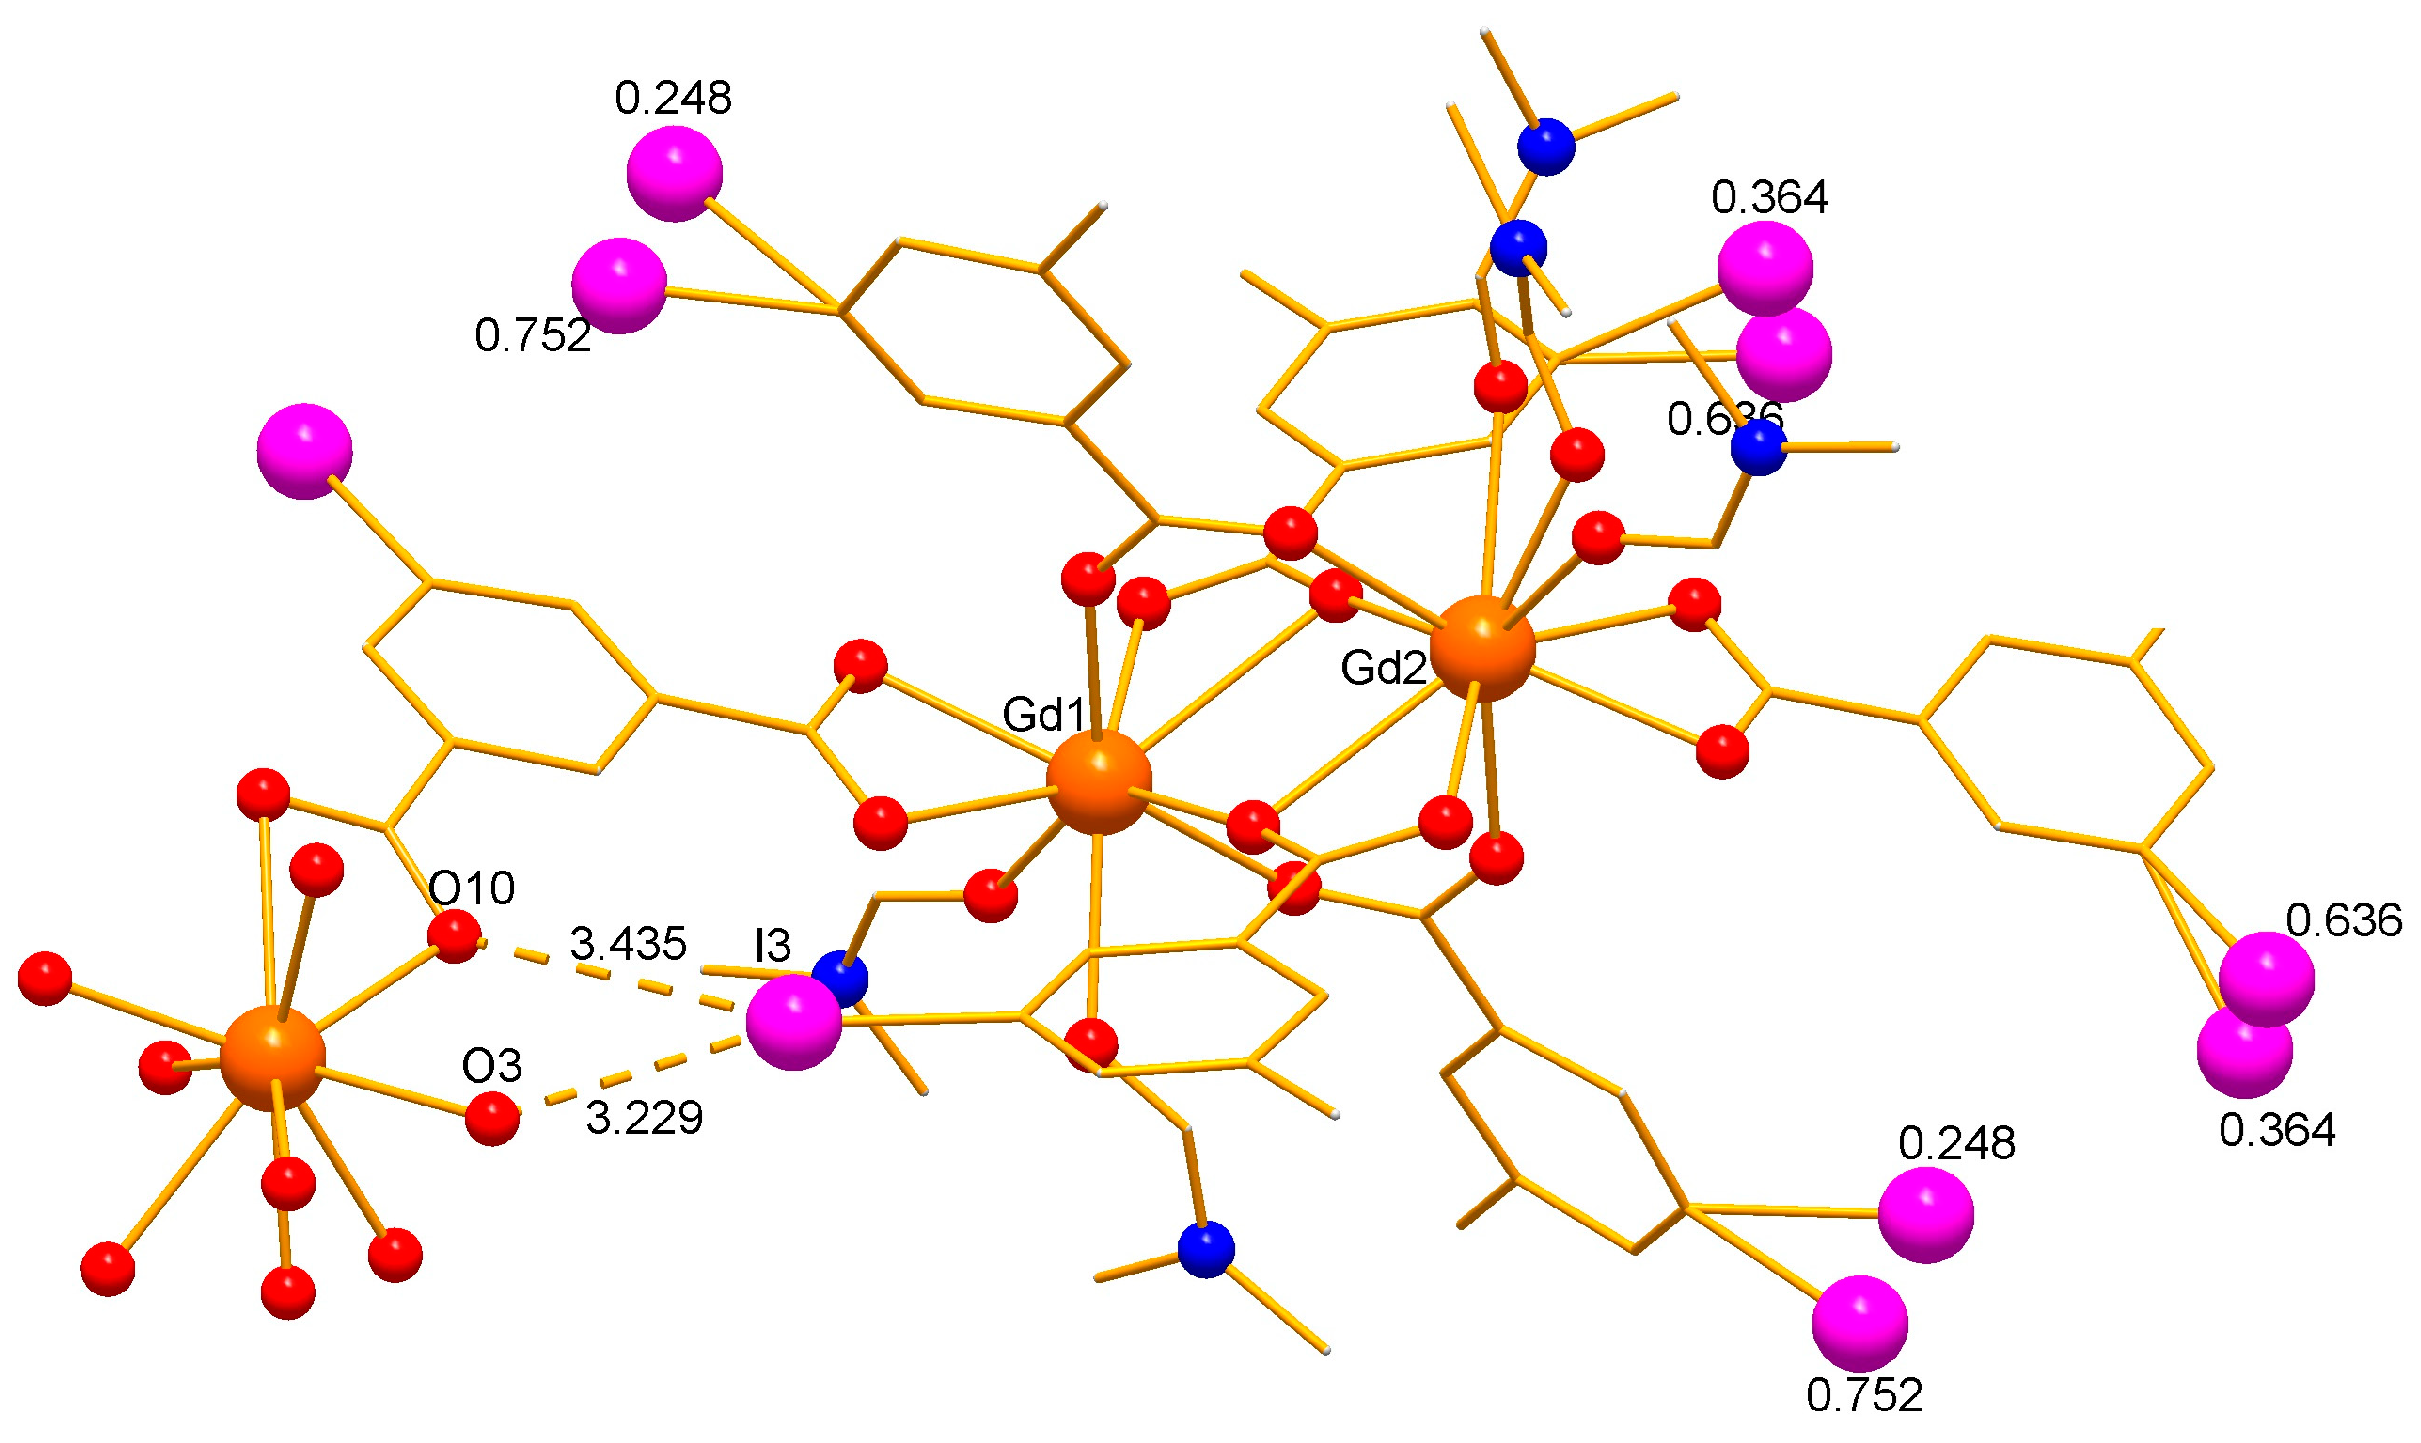
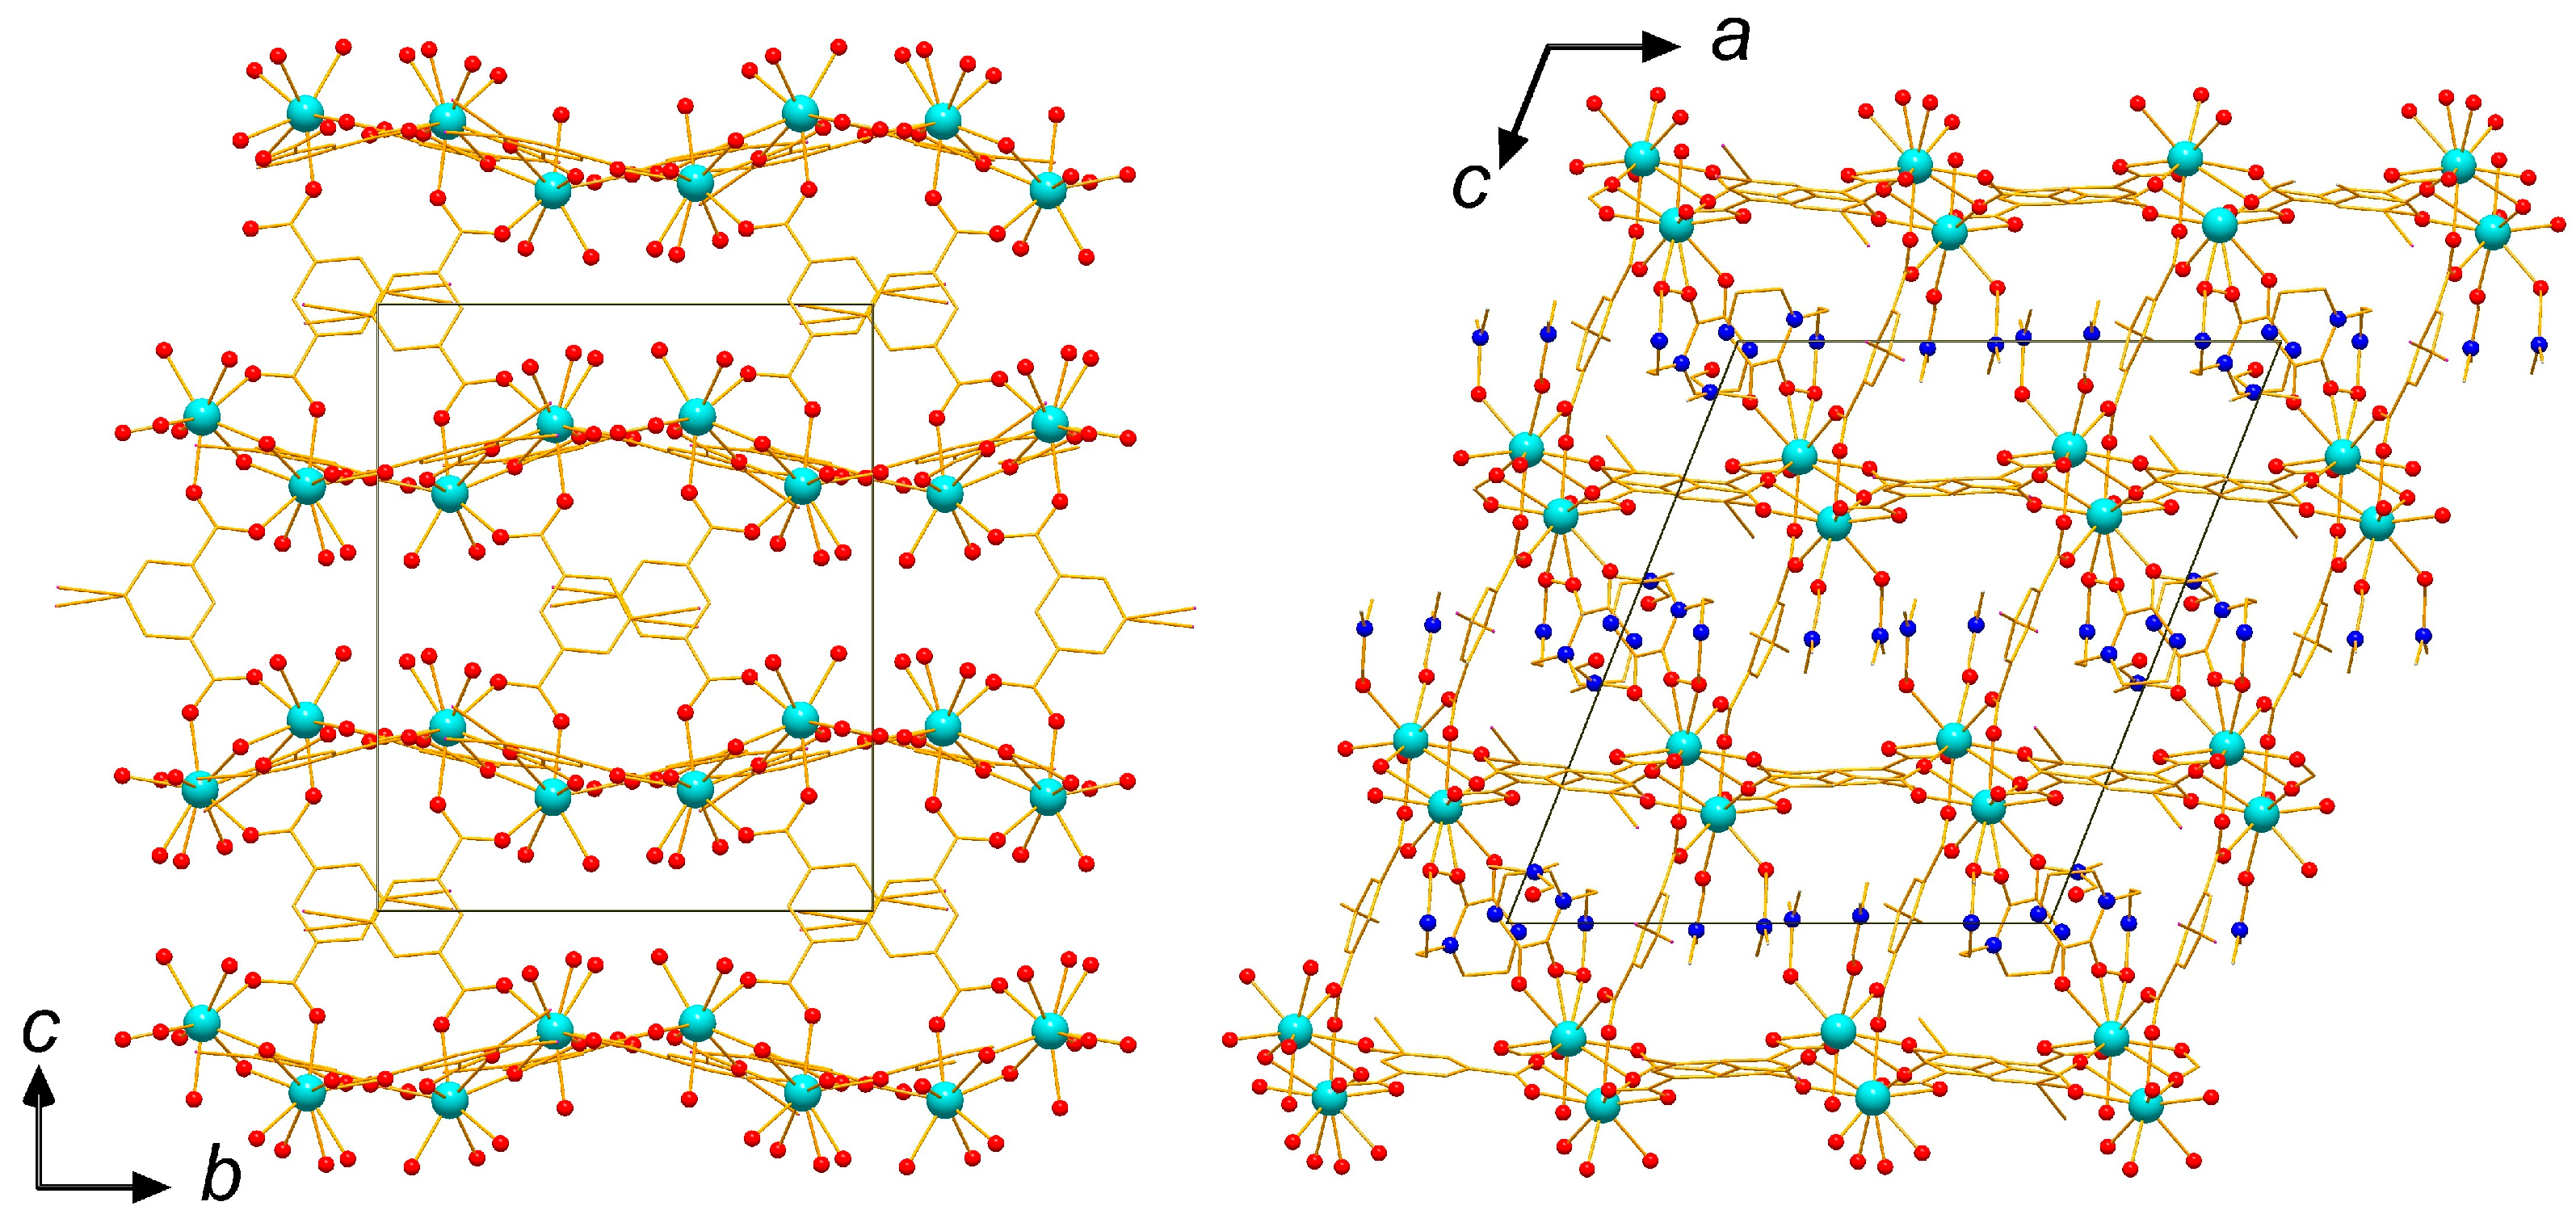
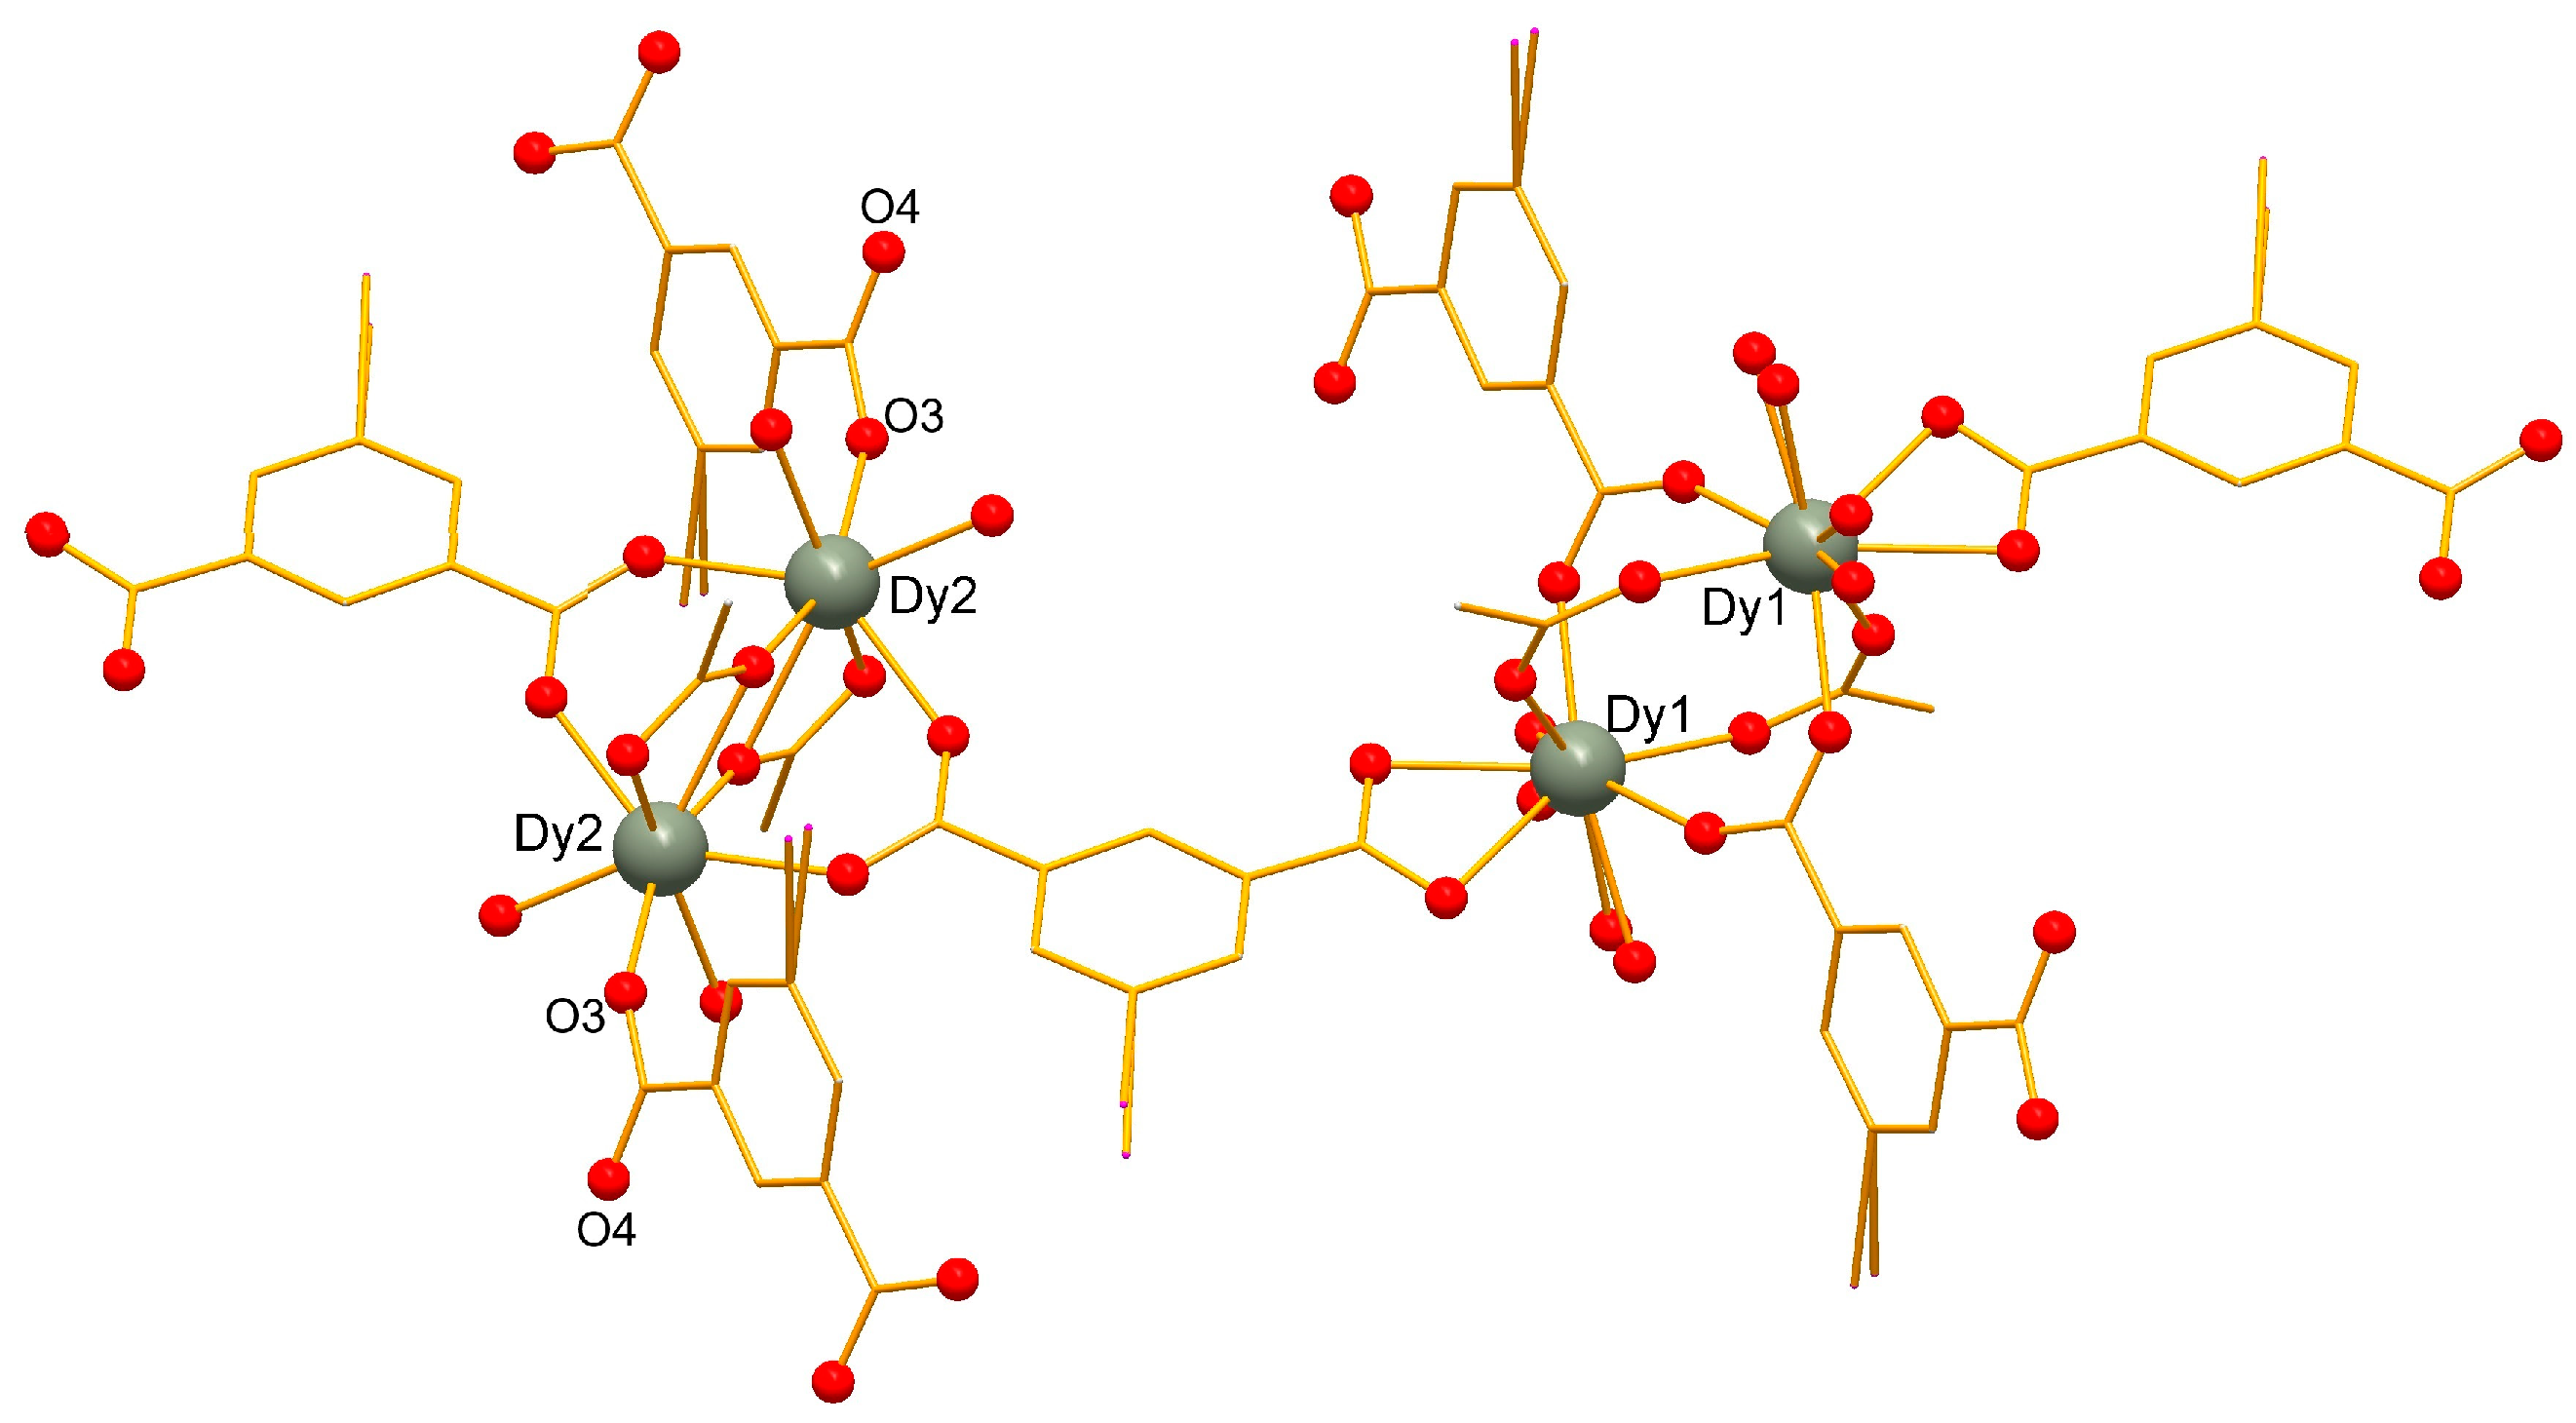
2.1. Crystal Structure of the Complexes 1 and 2

According to Cambridge Crystallographic Data Centre (CCDC), 1 and 2 are the first examples of homometallic coordination polymers of lanthanides with 5-iodoisophtalic acid. Only two samarium(III)-gallium(III) metallacrowns were reported in 2020 [45]. For d-metals, 5-iip was considered as an XB donor in MOFs [46,47,48,49,50].
The complexes crystallize in monoclinic (1, space group P21/c) and triclinic (2, space group P-1) crystal systems, respectively. Both feature the same formula and 3D motif but significantly differ from the structural point of view. Building block of 1 is given in Figure 1. Both Gd atoms are interconnected into one dimeric unit via four bridging 5-iip anions. As can be seen in Figure 2, along b axis there are layers of dimeric units which are combined into layers in ABAB manner. 5-iiP molecules interconnect these layers into 3D framework. Solvent accessible volume is 560.9 Å3/cell (11.5%); it is partially filled with DMF molecules with occupancy 0.4. DMF; Gd2 were refined as disordered with occupancies of 0.75:0.50:0.75 to represent two molecules. All coordinated DMF molecules are oriented into voids thus diminishing voids accessible volume.
For non-disordered I moieties, I···O contacts can be found only in 1 (Figure 1)—3.229 (I3-O3) and 3.435 Å (I3-O10), which is below the Bondi’s van der Waals radii sum (3.50 Å [51]). The disordered I atoms are oriented toward {COO} groups or coordinated DMF molecules (in 2), and there is not much space for interaction with any possible guest molecules.
For structure 2, all I atoms were refined with total occupancy 0.95, since it resulted in a much better refinement quality. However, other techniques suggest that 5-iodoisophtalic acid used in experiments was pure. In 2, there are two slightly different dimeric building blocks around two crystallographically independent Dy atoms (Figure 3). Atom Dy1 is surrounded by 4 bridging, two chelating 5-iip units and two disordered DMF molecules. In contrast, DMF molecules coordinated to Dy2 are not disordered. In addition, one of the 5-iisoPh molecules connected only through one oxygen atom—Dy2-O3 distance is 2.235 Å, which is the shortest for 1 and 2. Interestingly, “free” O4 atom is not involved in any kind of non-covalent interactions while facing into the accessible void (Figure 4). The size of these voids is even smaller than in 1 (3.5% for 2 80.6 Å3/cell); they are filled with DMF (1/3 occupancy) molecules.

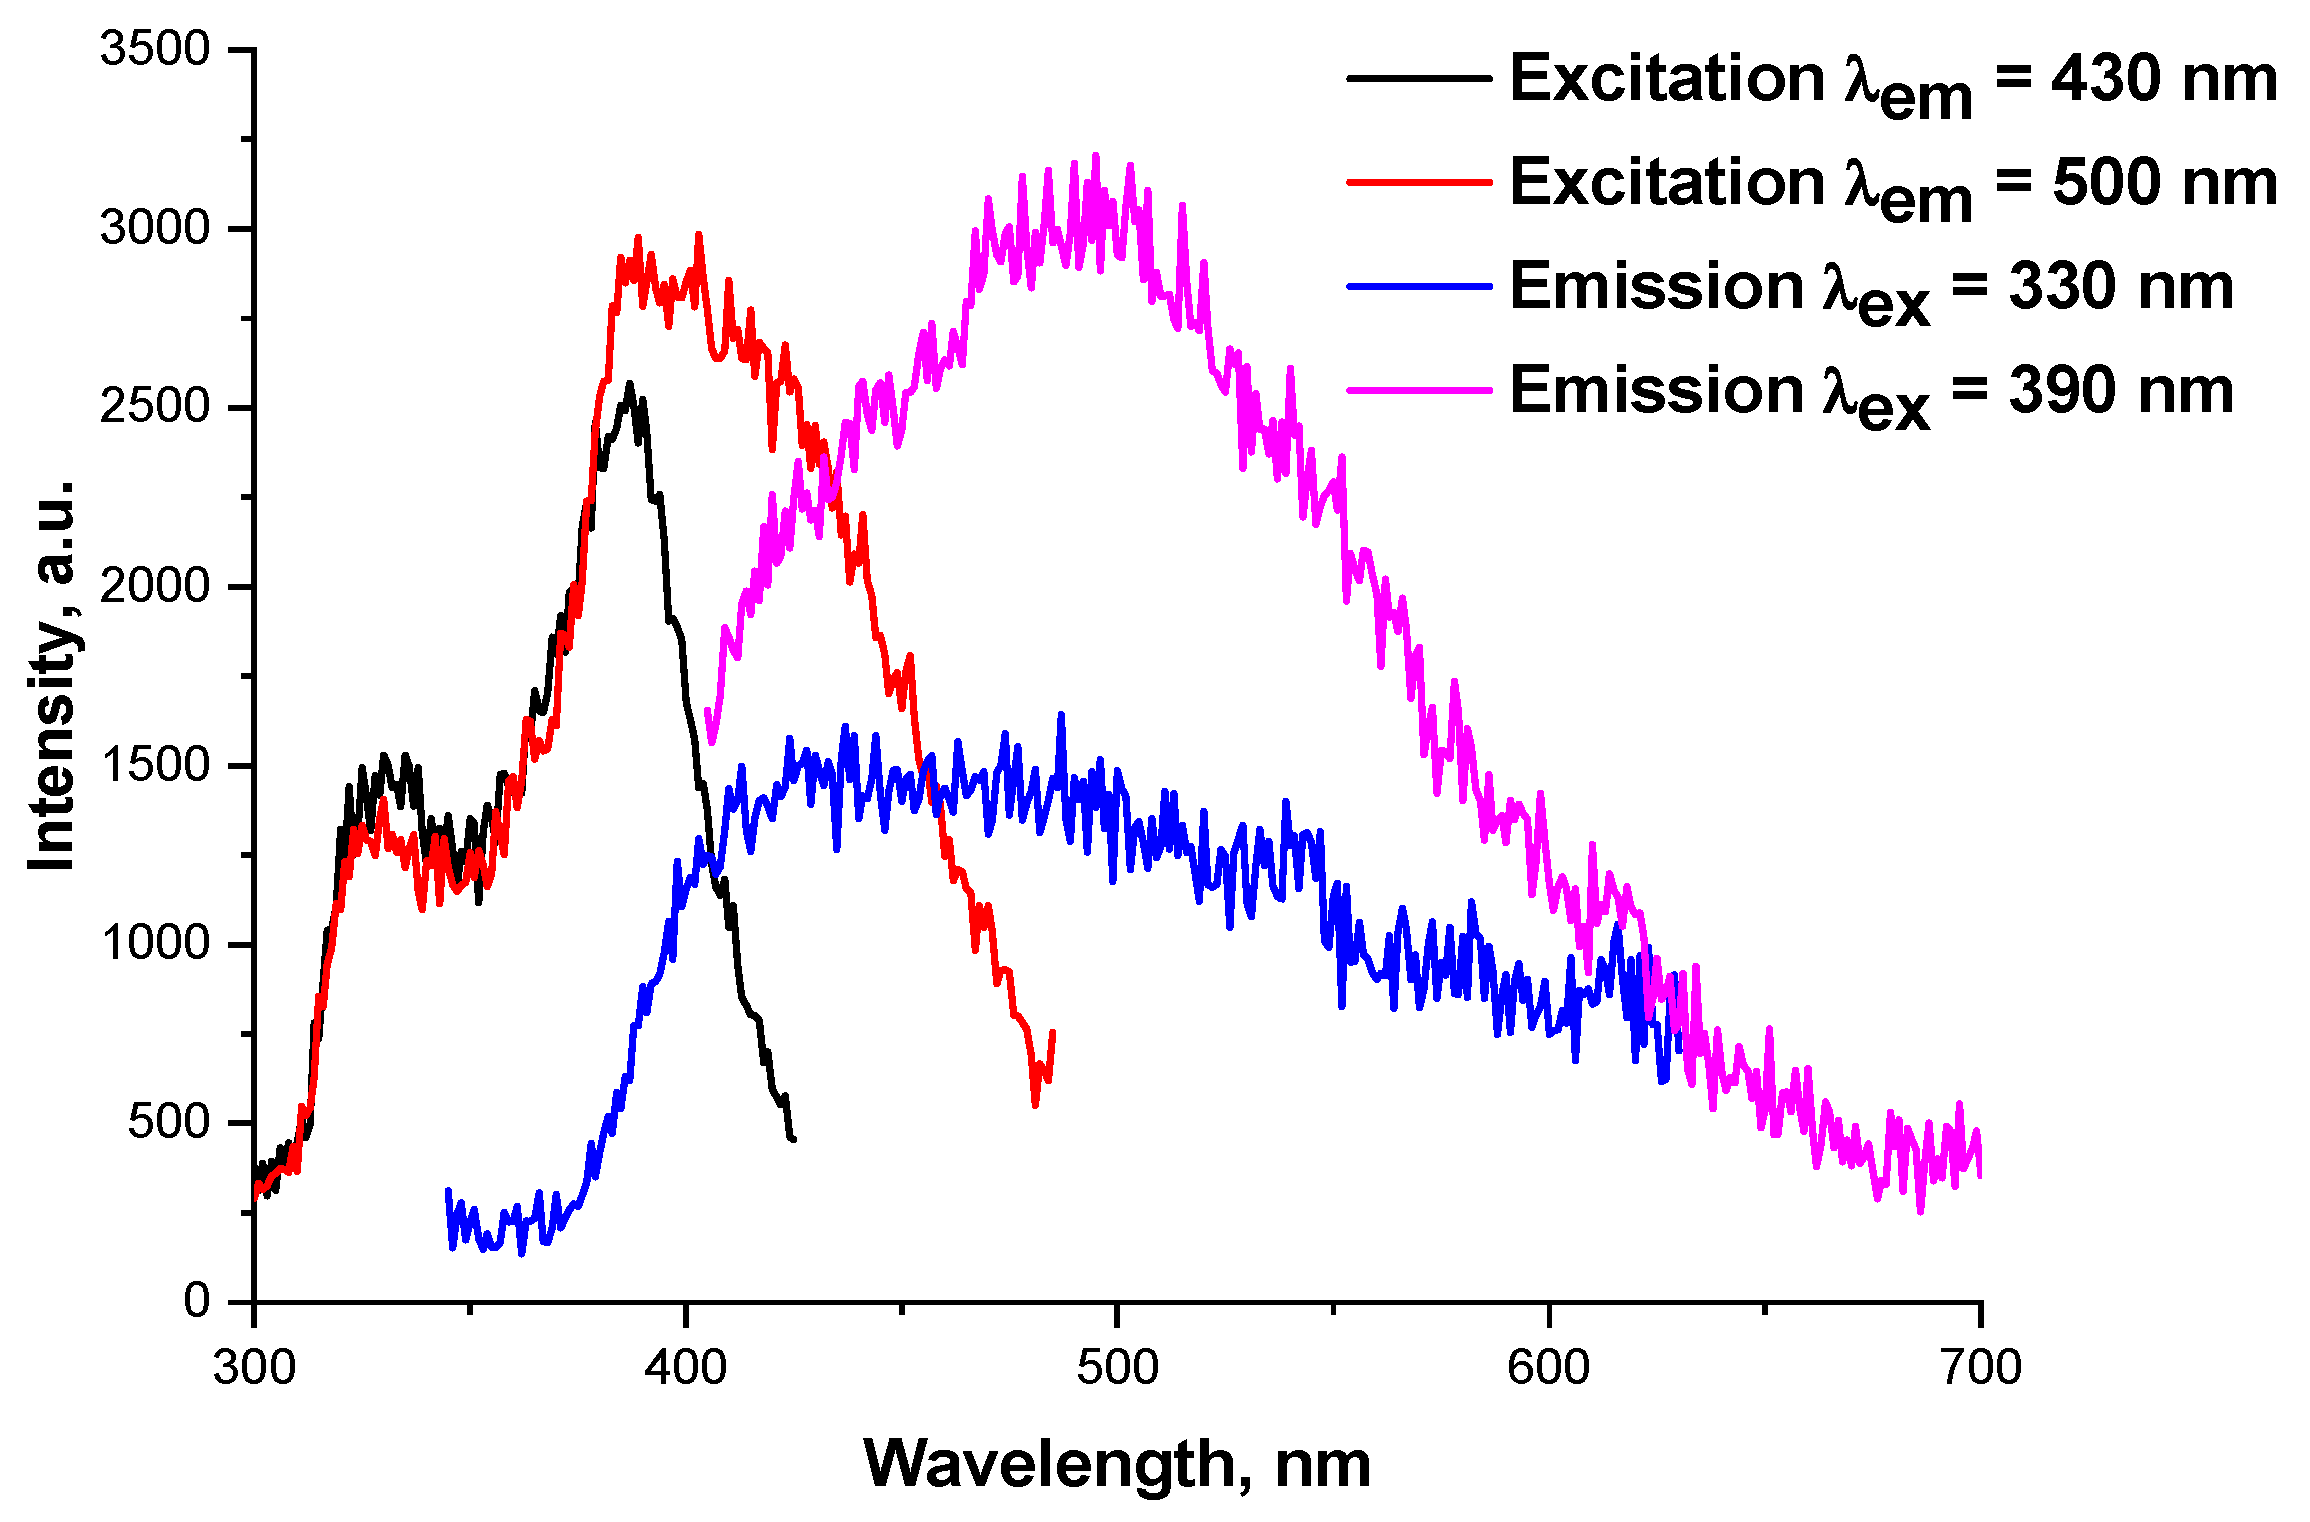
2.2. Photoluminescence Properties

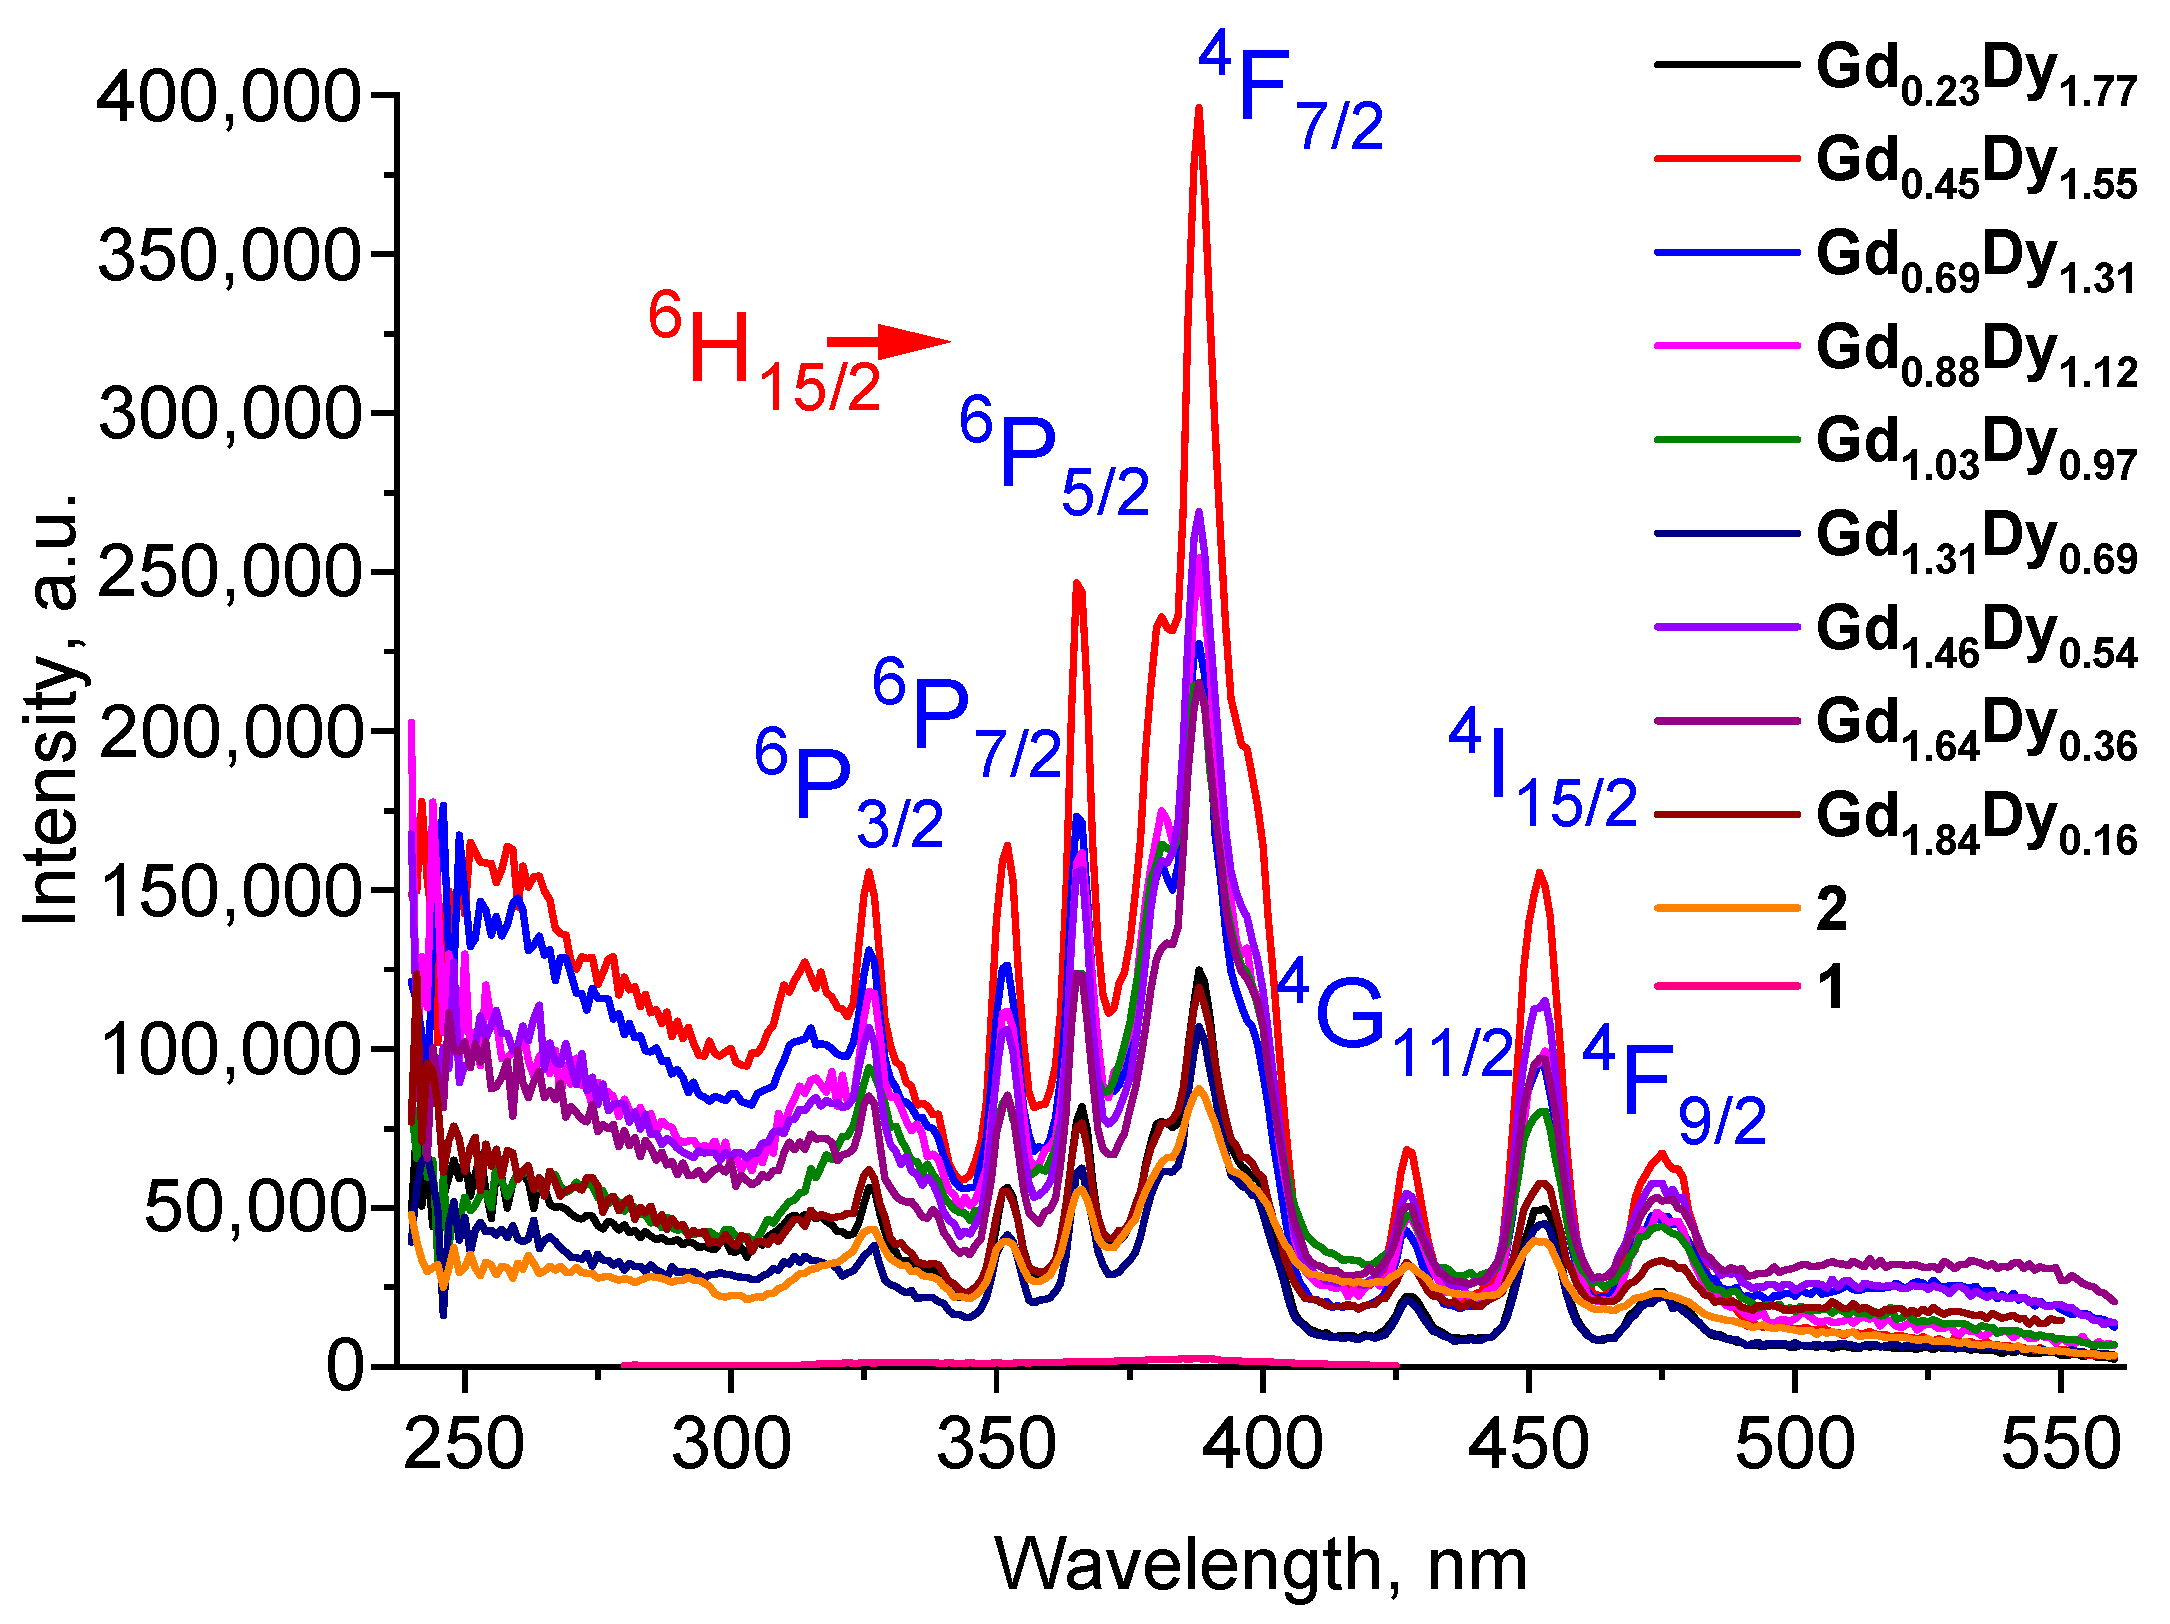
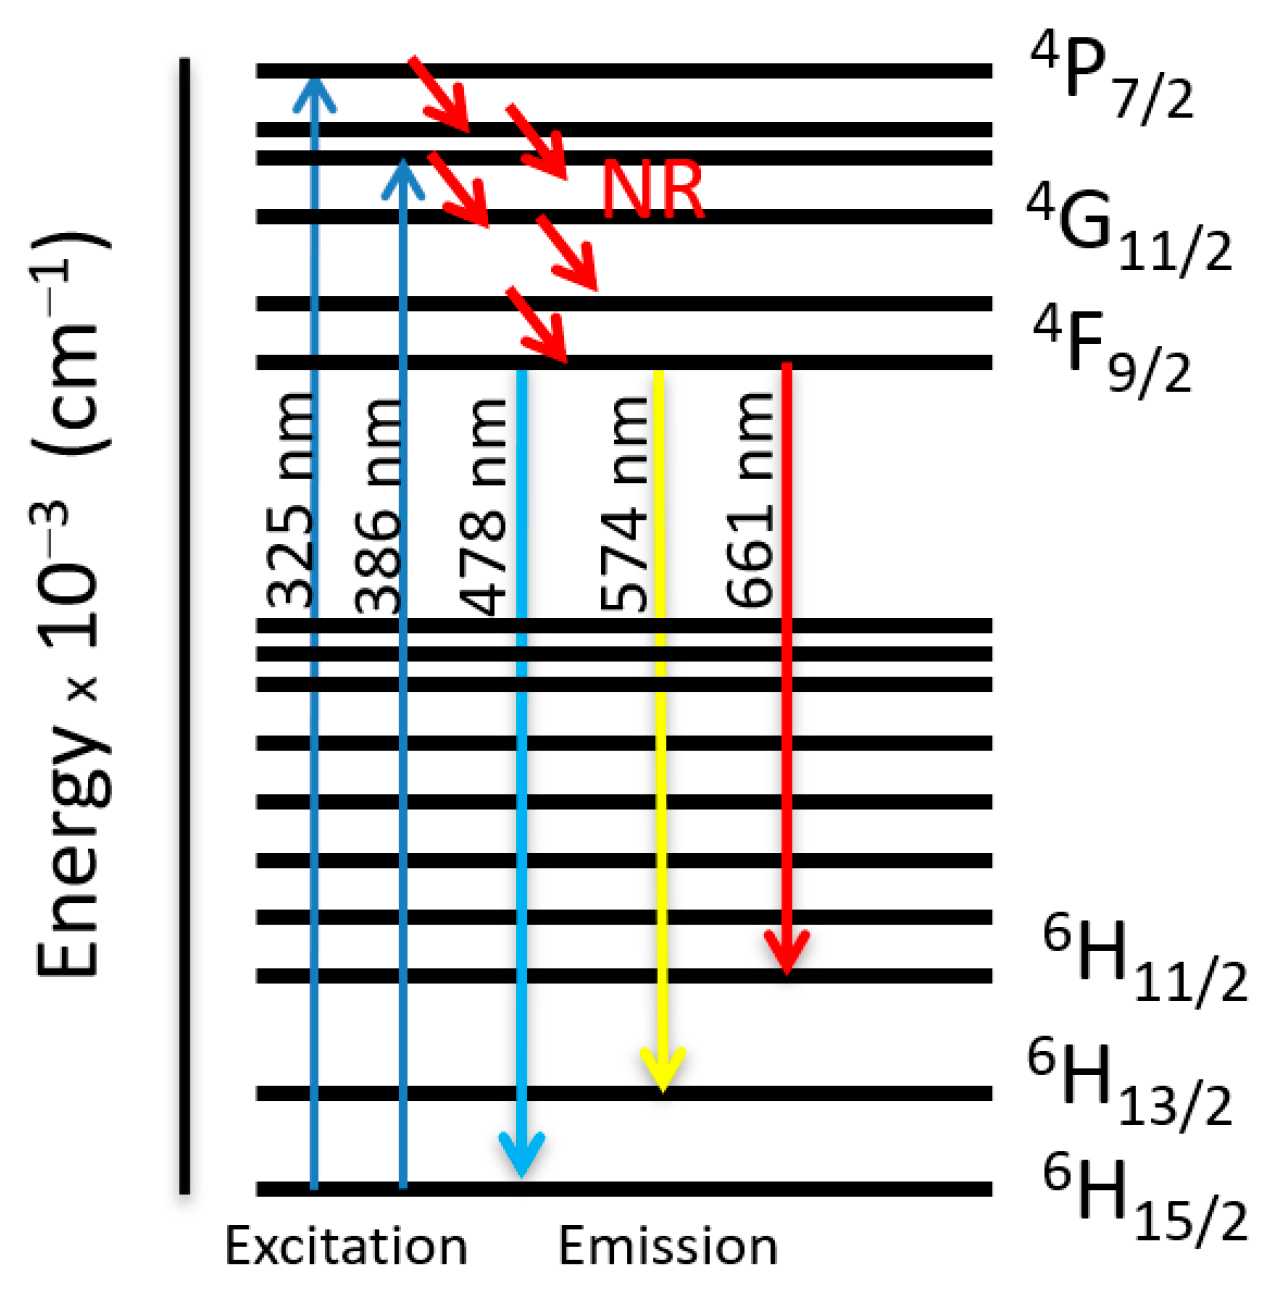
2.2.1. 1, 2 and Series of [GdxDy2−x(5-iip)3DMF2]·0.33DMF

The solid-state luminescence spectra of 1 demonstrate multiple emissions (Figure 5) with the band maxima at ca. 500 nm and the band maxima at ca. 400 nm. The spectra of the complex 1 is practically identical to the spectra of the ligand [52]. In both cases, the excited state lifetime in the nanosecond domain points to intraligand transitions.
The solid-state luminescence properties of complexes GdxDy2−x were investigated at room temperature.
The emission spectra of complexes, as shown in Figure 6a,b, can be ascribed to the change from excited energy level to a lower energy level. The PL spectra excited at 325 nm are very similar to those excited at 386 nm. The emission characteristics of the Dy3+ consisted of multiple sharp peaks with multiple wavelengths due to the unique electronic transition in the system. The compact manifolds of energy levels in the upper parts of the activator cause electrons that are excited to decay only through the 4F9/2 level to the lower 6Hj/2 (j = 15, 13, 11) levels at 478, 575, and 661 nm, respectively. The large energy difference between each lower level causes the emission spectra to be separated at a distance.
Figure 7 depicts the photoluminescence excitation (PLE) spectra of complexes. There is no difference between the excitation complexes, except the excitation intensity (λem = 574 nm). It can be seen that the excitation spectra consist of some narrow peaks. In the longer wavelength region from 310 to 500 nm (Figure 7), some sharp lines due to the f–f transitions of Dy3+ are observed, which are assigned to the electronic transitions 6H15/2-6P3/2 at 325 nm, 6H15/2-6P7/2 at 351 nm, 6H15/2-6P5/2 at 365 nm, 6H15/2/(4I13/2 + 4F7/2) at 386 nm, 6H15/2-4G11/2 at 427 nm, 6H15/2-4I15/2 at 452 nm, and 6H15/2-4F9/2 at 475 nm.
By comparing the emission spectra of the complexes collected under two different excitation wavelengths, we conclude that the emission peaks do not change with λex. Furthermore, the ratio Y/B of emission at 574 nm (yellow) and 478 nm (blue) is almost the same for both cases (~2.8). This indicates that in this synthesized series, the predominant color is yellow. That ratio is known to be highly dependent on the site occupied by Dy3+. The low symmetry of the site occupied by Dy3+ increases the 574 nm emission in comparison to the 478 nm emission. Depending on the symmetry of the local environment and the degree of its distortion, the intensity ratio R = 4F9/2 → 6H13/2/4F9/2 → 6H15/2 is presented in the Table S4. Faint broad bands are also visible in the blue (λex = 325 nm) and green (λex = 386 nm) regions of the spectra.
Figure 8 shows the energy transfer processes of Dy3+ ions. Under the 325 nm and 386 nm excitation, Dy3+ ions absorb the photon energy and transfer it from the ground state 6H15/2 to the metastable excited states. During this process, the excited populations are rapidly released at the 4F9/2 energy level by a non-radiative (NR) process that occurs between the excited states. The transitions 4F9/2-6H15/2, 4F9/2-6H13/2, 4F9/2-6H11/2 are radiative and produce the emission peaks at 478, 574, and 661 nm, respectively. The concentration of Dy3+ ions does not clearly influence the PL intensities of complexes, but the broadband emission in the spectra affected the colorimetric parameters.
In order to determine the color parameters, the CIE coordinates (x,y) and the correlated color temperature parameter (CCT) were obtained using the standard formula. The chromaticity coordinates can be calculated by using OSRAM color calculator software (version 7.77). The CCT was determined by using McCamy empirical formula [53]:
CCT = 437n3 + 3601n2 6861n + 5514.31
where n = (x − xe)/(y − ye) and the value xe = 0.3320, ye = 0.1858.
The calculated chromaticity for different concentration levels are displayed in Figure 9 and their numerical values are shown in Table S4. The shifting in the (x,y) coordinates was observed when the concentration of the Dy3+ changed. It can be seen that all the coordinates are located in the greenish-yellow color region of the CIE diagram, demonstrating that the complexes have potential for white LED applications. CIE values of complex [Gd1.31Dy0.69(5-iip)3DMF2]·0.33DMF show a color close to white at λex = 325 and λex = 386 nm. The results exhibited the characteristics of low color-correlated temperature.
The color purity is also a key factor in producing a better light source for LED applications. To determine this factor, the following formula is used:
C o l o r   p u r i t y = ( x x e e ) 2 + ( y y e e ) 2 ( x d x e e ) 2 + ( y d y e e ) 2 × 100 %
where (x, y), (xe, ye), and (xd, yd) are the chromaticity coordinates of the sample point, the equal energy point (0.33, 0.33), and the dominant wavelength point, respectively. The dominant wavelength point can be calculated based on the intersection point of the connection line between the sample point and the equal energy point. Color purity for the standard white light is 0% [54]. The color purity of complex [Gd1.31Dy0.69(5-iip)3DMF2]·0.33DMF at excitation λex = 325 nm is found to be 11%. The color purity should be very low to achieve white light emission from the emitting sources [55], and the color purity for the standard white light is 0% [56]. The color purity of the [Gd1.31Dy0.69(5-iip)3DMF2]·0.33DMF complex is close enough to zero to be consistently well-suited for the generation of white light, further suggesting its utility and suitability for W-LED applications.

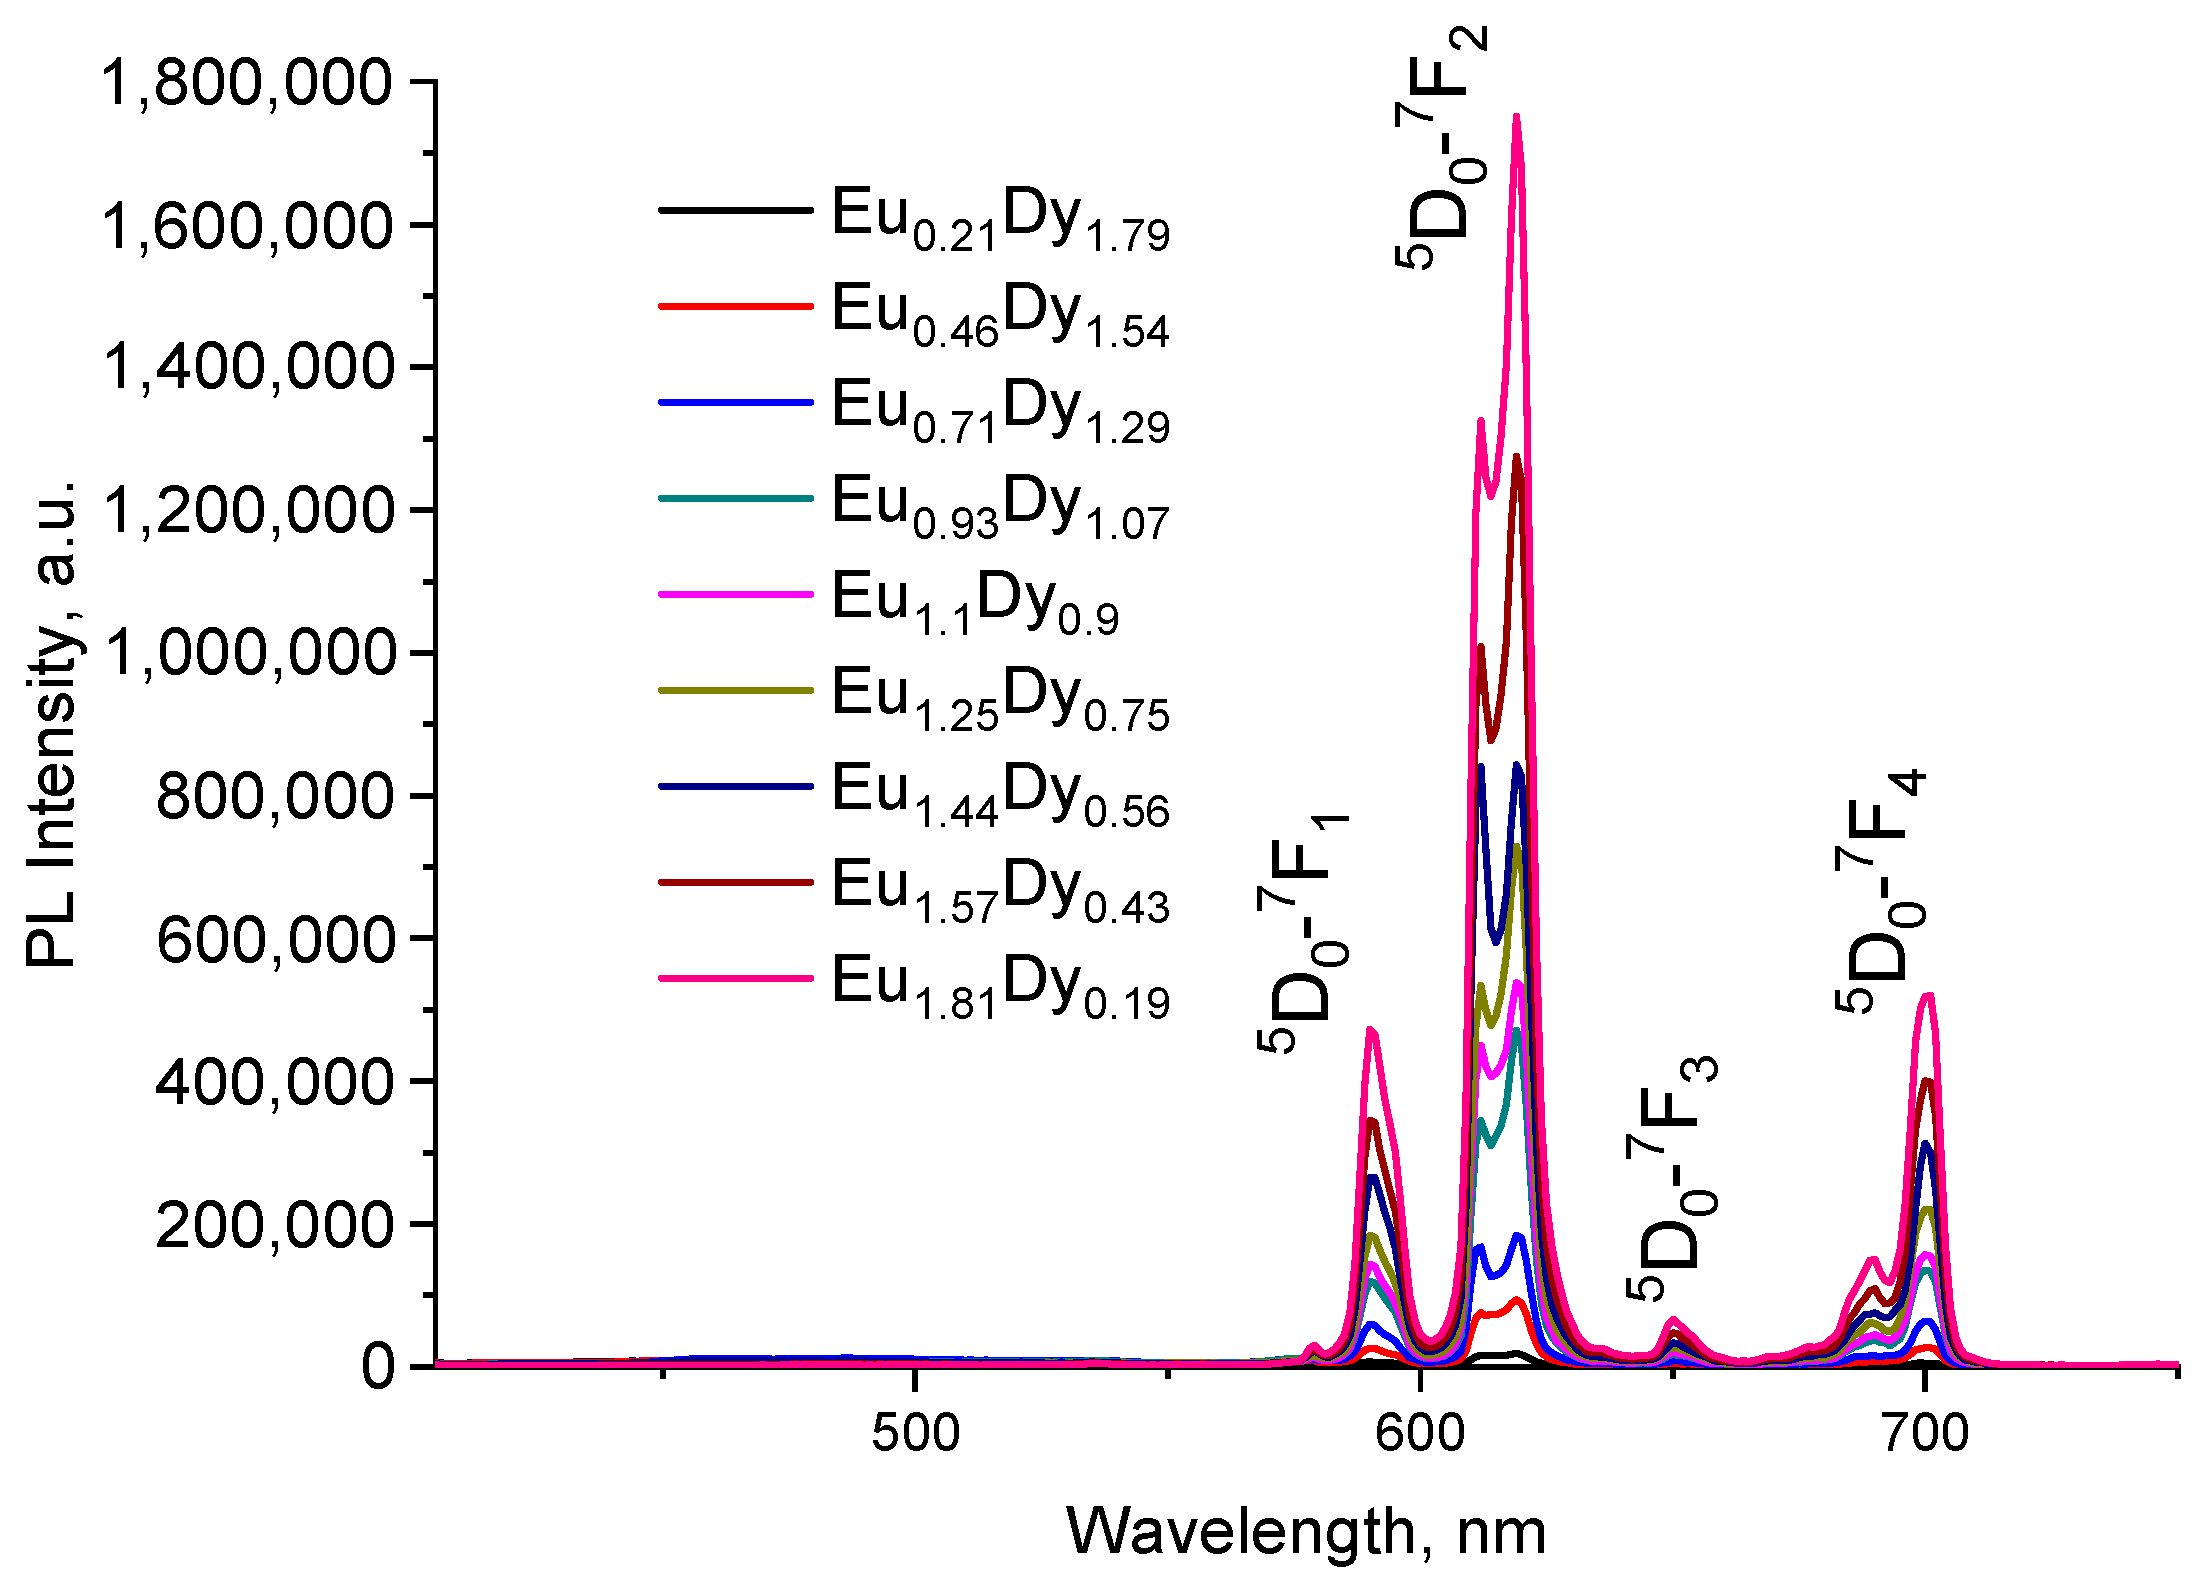
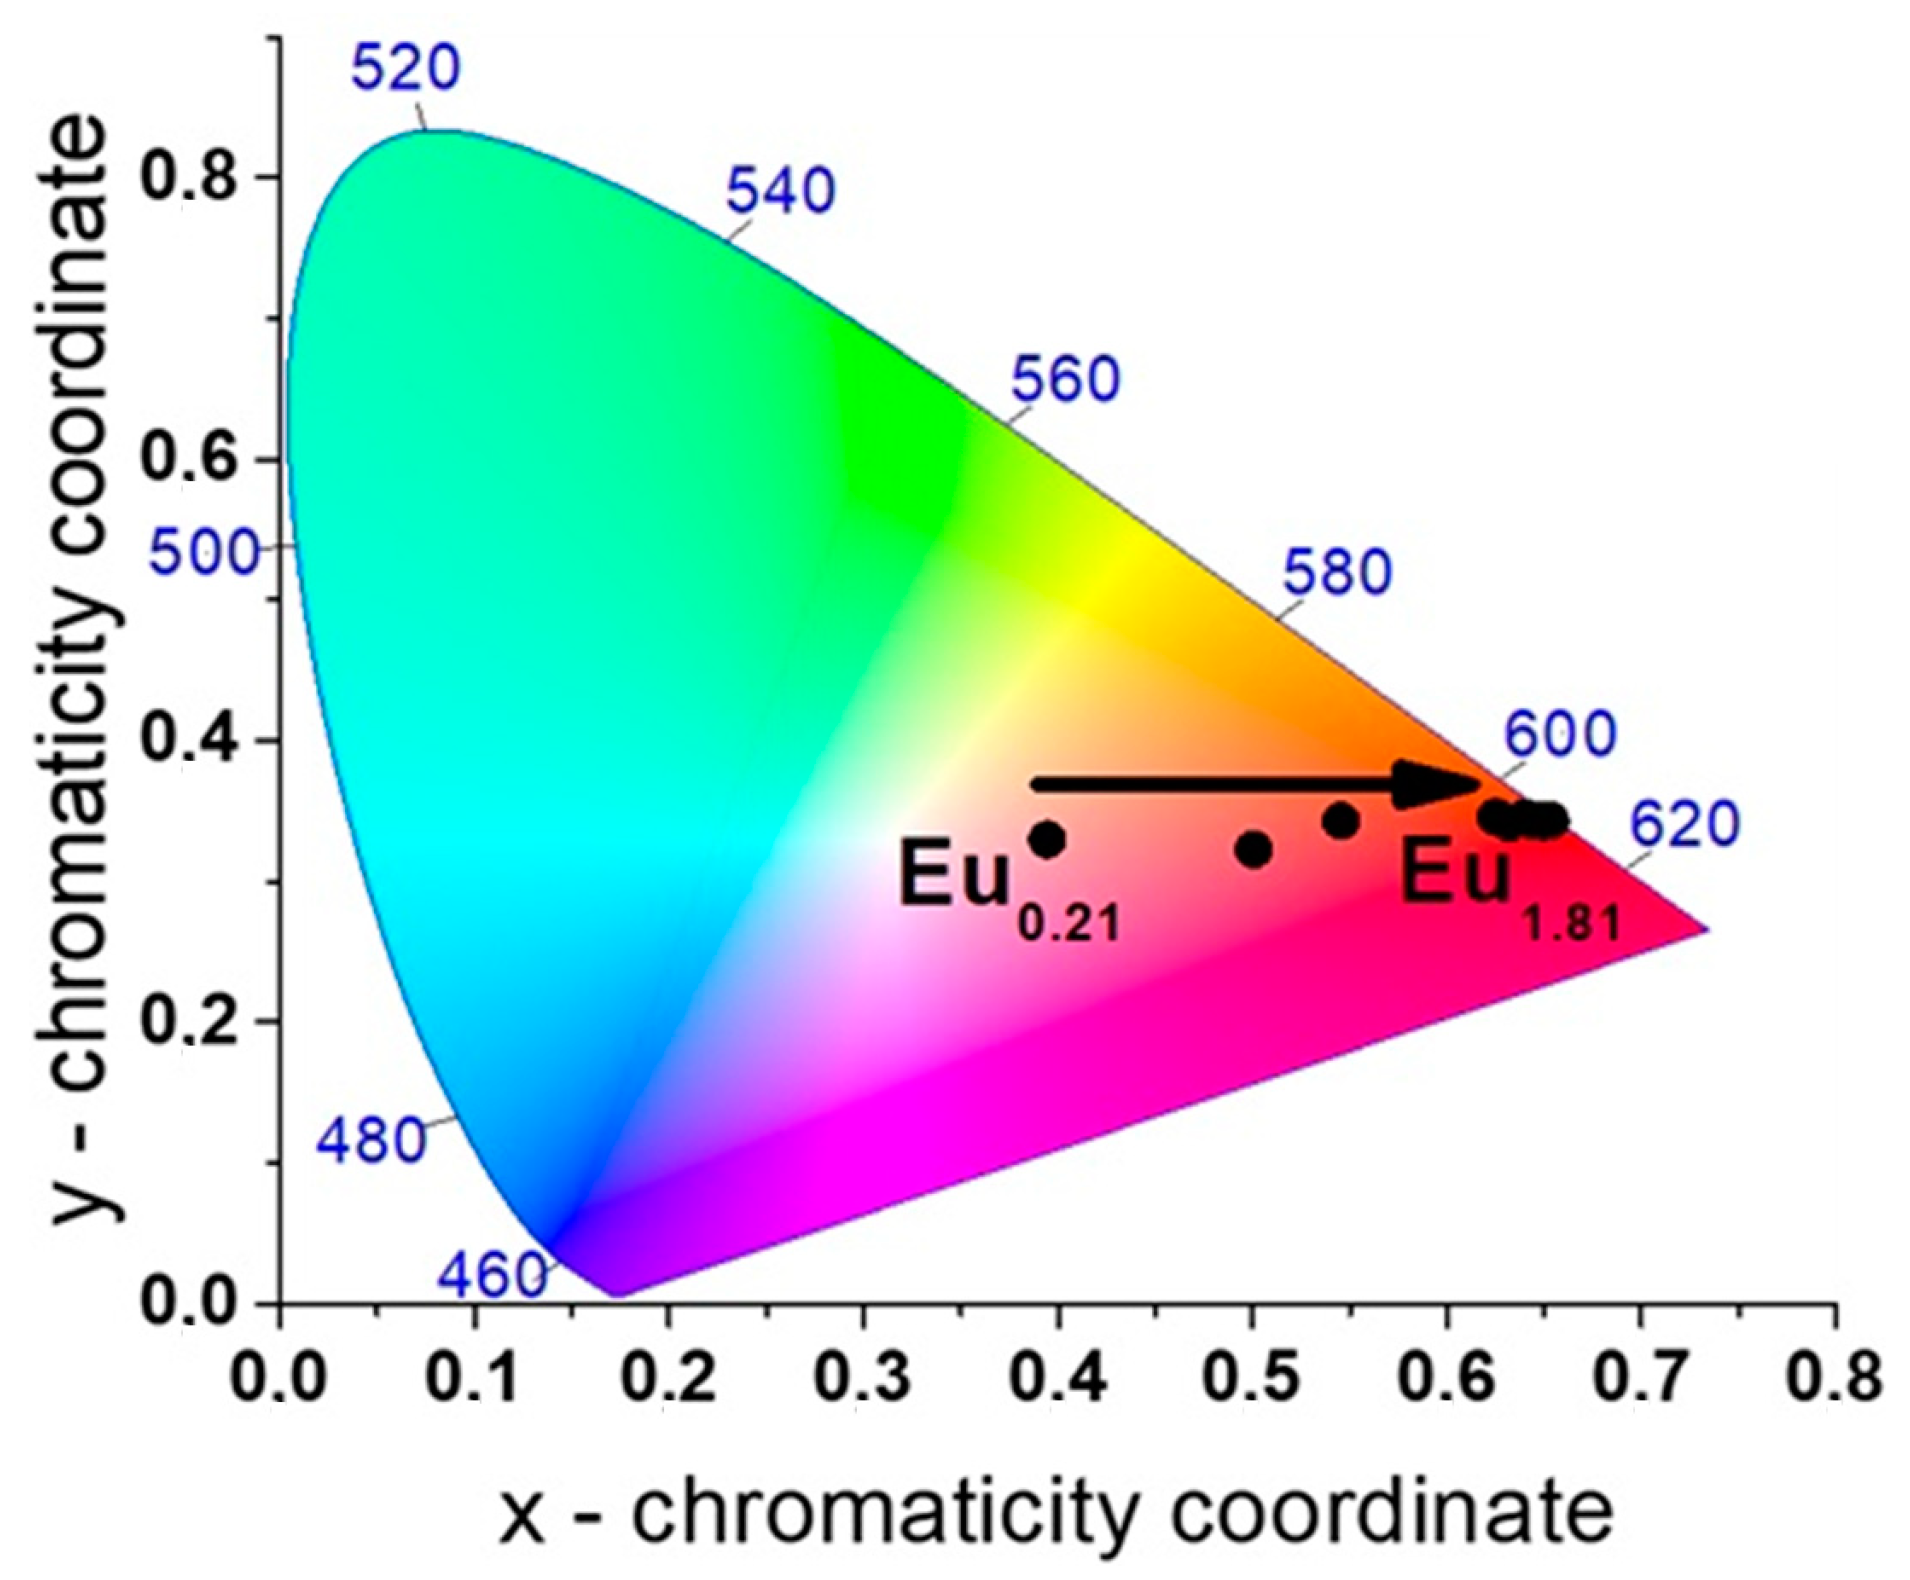
2.2.2. Series of [EuxDy2−x(5-iip)3DMF2]·0.33DMF

The PLE and PL spectra complexes at 300 K were analyzed. The ions Eu3+ form a group of lanthanides whose complexes exhibit ionic luminescence in the visible region. The PLE spectra (Figure 10) show standard transitions for Eu3+ cation. Region from 240 nm to 330 nm corresponds to the area with charge transfer band (CTB) and corresponds to electron transitions from oxygen to 4f levels of cations of rare elements (from O2– to Eu3+). In region from 350 nm to 470 nm, the series of sharp lines is observed. These lines correspond to intraconfigurational 4f6–4f6 transitions of Eu3+ cation: 7F05D4 at 362 nm, 7F05L7 at 383 nm, 7F05L6 at 395 nm, 7F05D3 at 415 nm, 7F05D2 at 465 nm.
The PL spectrum (Figure 11) consists of the standard in electronic rearrangements within the f–f transitions of europium, corresponding to the transitions from 5D07FJ transition’s bands. The transition 5D07F2 (electric-dipole transition) at around 618 nm is the most prominent; rest 7FJ (J = 0, 1, 3, 4) bands are not very intense. It is well known that the symmetry position of the Eu3+ ion in the host can influence the characteristic emission. If the Eu3+ ions are located at the inversion symmetric site in the host, the magnetic dipole transition (5D0 → 7F1) dominates. When Eu3+ ions are located at the antisymmetric site (5D0 → 7F2), it promotes magnetic dipole transition. It can be seen from Figure 11 that the strongest peak located at 618 nm (5D0 → 7F2) peaks corresponds to red emission. So, Eu3+ ions are located at anti-symmetry sites of the host lattice. The intensity of the 5D0 → 7F2 band of the electronic transition increases with decreasing symmetry of the environment of Eu3+ ions. Depending on the symmetry of the local environment and the degree of its distortion, the intensity ratio R = 5D0 → 7F2/5D0 → 7F1 is presented in the Table S5.
The Figure S1 shows the dependence of integral intensity and decay time for Eu3+. According to obtained data, linear behavior is observed with increasing Eu3+ concentration.
From spectra, it can be seen (Figure S2) that the introduction of Dy3+ ions has affected the characteristic emission peaks only in a few complexes.
One can observe changes in the chromaticity coordinates for these complexes from the shift from white area in the CIE diagram. The calculation of the corresponding CIE coordinates and CCT (correlated color temperature) values are indicated (Figure 12, Table S5).
Figure 13 illustrates the partial energy level diagram of Eu3+ in complexes. Under the excitation of 395 nm wavelength, the electron absorbs energy and gets excited to the higher excited states of Eu3+. Finally, the excited electrons fall to the ground state by emitting red emissions through 590 nm (5D0 → 7F1), 618 nm (5D0 → 7F2), 650 nm (5D0 → 7F3), 700 nm (5D0 → 7F4) transitions of Eu3+ ions.

3. Materials and Methods

All reagents were obtained from commercially available sources and used without further processing. 5-Iodoisophthalic acid was prepared according to the procedure in [57] with quantitative yield. 1H and 13C NMR were recorded on a Bruker Avance 500 (AV500; Bruker Elemental GmbH, Berlin, Germany) in DMSO-d6. Elemental analysis was performed on a vario MICRO cube CHNS analyzer (Elementar, Langenselbold, Germany).

3.1. Physical Measurements

X-ray powder diffraction analysis of polycrystals was performed on a Shimadzu XRD-7000 diffractometer (CuKα radiation, Ni filter, range 5–60° 2θ, step 0.03° 2θ, accumulation 1 s.). Indexing of diffraction patterns was performed based on single-crystal data.
Thermogravimetric analysis was performed on a Netzsch TG 209 F1 Iris® thermal analyzer (Netzsch, Hanau, Germany). Samples (10 mg) in open Al2O3 crucibles were heated at a rate of 10 °C/min in a helium atmosphere at a flow rate of 60 mL/min in a temperature range of 30–550 °C.
Gd, Dy, and Eu concentration was determined by inductively coupled plasma optical emission spectrometry. Quantitative measurements were carried out on ICP OES spectrometer Grand-ICP (“VMK-Optoelectronic”, Novosibirsk, Russia), spectral range from 190 to 780 nm. ICP OES analysis was performed with an axial view of the plasma. Solutions were introduced into the plasma via a OneNeb pneumatic nebulizer OneNeb (Agilent Technologies, Santa Clara, CA, USA) and a cyclone-type spray chamber (Precision Glassblowing, Centennial, CO, USA). For registration emission spectra, the following instrumental parameters were used: plasma argon flow 13 L/min, nebulizer flow 0.35 L/min, auxiliary gas flow 0.5 L/min, plasma power 1300 W.
Calibration solutions were prepared by diluting a multi-element standard solution of rare earth elements (Skat, Volgograd, Russia). A quantity of 0.5 mol/L HNO3 was used for dilution. High pure nitric acid was additionally purified using the DuoPur sub boiling distillation system (Milestone, Sorisole, Italy). Ultra-pure water with a resistivity 18.2 MΩ cm was obtained using Direct-Q3 water purification system (Milipore, Billerica, MA, USA). Argon 99.996 purity grade was used during ICP OES measurements.
The solution for analysis was prepared from 5 mg of powdered sample in 1.5 mL of DMF with heating, after which 0.5 mL of HNO3 (conc.) was added with stirring until complete dissolved.
An amount of 1 mL concentrated purified nitric acid was added to 0.3 mL sample solution in DMF and heated for 20 min at 100 °C. After cooling to room temperature, the solutions were diluted with 0.5 mol/L HNO3 and ICP OES analysis was performed.
The samples were recorded using a scanning electron microscope SEM 5000 manufactured by SIQTEC (Hefei, China) with an attachment for energy-dispersive spectroscopy Oxford Xplore 30 Aztec Live Lite manufactured by Oxford Instruments (Oxford, UK). The accelerating voltage was 15 keV.
Photoluminescence and PL excitation spectra as well as the PL kinetics were recorded on a Fluorolog 3 spectrophotometer (Horiba Jobin Yvon, Paris, France) with a 450 W ozone-free xenon lamp as an excitation source. All measurements were made at room temperature. The absolute quantum yield was measured using a G8 (GMP SA, Renens, Switzerland) spectralon-coated integrating sphere, which was connected to a Fluorolog 3 spectrofluorimeter.

3.2. Synthesis and Characterization of MOFs

[Gd2(5-iip)3(DMF)4]·0.4DMF (1). In 1 mL of DMF, 12.7 mg (0.034 mmol) of GdCl3·6H2O and 15 mg (0.051 mmol) of 5-iipH2 were dissolved; the solution was transferred to a Pasteur pipette, sealed, and kept for 2 days at T = 120 °C with slow cooling. As a result, several orange crystals were obtained. Calc., %: C 29.7, H 2.7, N 4.1; found, %: C 29.6, H 2.7, N 4.1.
[Dy2(5-iip)3DMF2]·0.33DMF (2). The synthesis is completely analogous to compound (1), only instead of GdCl3·6H2O, a quantity of 15.0 mg (0.034 mmol) Dy(NO3)3·5H2O was used. Calc., %: C 27.3, H 1.9, N 2.4; found, %: C 27.3, H 1.9, N 2.4.
Series of [GdxDy2−x(5-iip)3DMF2]·0.33DMF. In a glass vial, 80 mg (0.27 mmol) of 5-iipH2 were added, the corresponding amount of GdCl3·6H2O and Dy(NO3)3·5H2O salts (Table 1) were mixed, 0.8 mL of DMF was added, and the mixture was placed in an ultrasonic bath for 5 min until the reagents were completely dissolved. After that, it was transferred to Pasteur pipettes, sealed, and kept for 2 days at T = 120 °C with slow cooling, resulting in a light-yellow powder.
Series of [EuxDy2−x(5-iip)3DMF2]·0.33DMF. Synthesis was carried out similarly to Gd/Dy-MOFs using the corresponding salts (Table 2).
The heterometallic framework series [GdxDy2−x(5-iip)3DMF2]·0.33DMF and [EuxDy2−x(5-iip)3DMF2]·0.33DMF are isostructural to compound 2, which was confirmed by X-ray diffraction (Figures S4 and S5, respectively). Energy dispersive X-ray elemental mapping analysis showed that each compound is an individual MOF rather than a mixture of individual coordination polymers (Figures S5–S8). ICP-OES analysis showed that the amounts of Gd3+, Dy3+ and Eu3+ ions in the frameworks coincide with the ratios of the reagents used.
The results of the thermogravimetric analysis for complexes 1 and 2 as well as their powder diffraction patterns are presented in the Supplementary Materials (Figures S9–S12, respectively).

3.3. Crystallographic Analysis

The diffraction data for crystals of 1 and 2 were collected on a Bruker D8 Venture diffractometer (0.5° ω- and φ-scans, fixed-χ three circle goniometer, CMOS PHOTON III detector, Mo-IμS 3.0 microfocus source, focusing Montel mirrors, λ = 0.71073 Å MoKα radiation, N2-flow thermostat) at 150 K. Absorption correction was applied by SADABS-2016/2 [58] and SAINT, version 2018.7-2; Bruker AXS Inc.: Madison, WI, USA, 2017). Structures were solved by SHELXT [59] and refined by full-matrix least-squares treatment against |F|2 in anisotropic approximation with SHELX 2014/5 [60] in ShelXle program [61] assisted with OLEX2 1.5 GUI [62]. H-atoms were constrained and refined in the geometrically calculated positions. Crystal and structure refinement data are given in SI (Table S1). M-O bond distances for 1 and 2 are given in Table S2. In 1 iodine atoms were refined with full occupancy; however, refinement of 2 resulted in better R factors with occupancies 0.95 for each I atom. The structures of 12 were deposited to the Cambridge Crystallographic Data Centre as a supplementary publication, No 2441447–2441448.

4. Conclusions

As a result of the work, we obtained structural data for 2 new Ln-MOFs, and synthesized 2 series of heterometallic frameworks Gd/Dy and Eu/Dy based on 5-iodisophthalic acid. Despite their fairly similar composition, their crystal structures differ greatly. For compound 1, the formation of a network of non-covalent I···O interactions was shown.
The study of luminescent properties showed that the [GdxDy2−x(5-iip)3DMF2]·0.33DMF series is a promising source of white emission with high light purity (11%), and the introduction of even a small amount of Eu3+ ions, as in the [EuxDy2−x(5-iip)3DMF2]·0.33DMF series, leads to the production of red emission.

Supplementary Materials

The following supporting information can be downloaded at https://www.mdpi.com/article/10.3390/inorganics13050154/s1. Table S1: Crystal data and structure refinement for 1 and 2; Table S2: Selected geometric parameters for 1; Table S3: Selected geometric parameters for 2; Table S4: The summary of photophysical properties of the complexes [GdxDy2−x(5-iip)3DMF2]·0.33DMF in solid state at room temperature; Table S5: The summary of photophysical properties of the complexes [EuxDy2−x(5-iip)3DMF2]·0.33DMF in solid state at room temperature; Figure S1: The dependence integral intensity (a), decay time (b) and R (c) for complexes [EuxDy2−x(5-iip)3DMF2]·0.33DMF, λem = 618 nm, λex = 395 nm, T = 300 K; Figure S2: The emission spectra (λex= 395 nm) for the complex [Eu0.21Dy1.79(5-iip)3DMF2]·0.33DMF, T = 300 K; Figure S3: X-ray powder diffraction for series [GdxDy2−x(5-iip)3DMF2]·0.33DMF; Figure S4: X-ray powder diffraction for series [EuxDy2−x(5-iip)3DMF2]·0.33DMF; Figure S5: Elemental mapping images of Gd0.23Dy1.77 (1), Gd0.45Dy1.55 (2), Gd0.69Dy1.31 (3), Gd0.88Dy1.12 (4) and its EDX–spectra (a, b, c, d respectively); Figure S6: Elemental mapping images of Gd1.03Dy0.97 (5), Gd1.31Dy0.69 (6), Gd1.46Dy0.54 (7), Gd1.64Dy0.36 (8), Gd1.84Dy0.16 (9) and its EDX–spectra (a, b, c, d, e respectively); Figure S7: Elemental mapping images of Eu0.21Dy1.79 (1), Eu0.46Dy1.54 (2), Eu0.71Dy1.29 (3), Eu0.93Dy1.07 (4) and its EDX–spectra (a, b, c, d respectively); Figure S8: Elemental mapping images of Eu1.1Dy0.9 (5), Eu1.25Dy0.75 (6), Eu1.44Dy0.56 (7), Eu1.57Dy0.43 (8), Eu1.81Dy0.19 (9) and its EDX–spectra (a, b, c, d, e respectively); Figure S9: TGA for 1; Figure S10: TGA for 2; Figure S11: X-Ray Powder Diffraction analysis for 1; Figure S12: X-Ray Powder Diffraction analysis for 2.

Author Contributions

Conceptualization, S.A.A., V.P.F. and M.A.B.; methodology, M.A.B.; software, N.A.K.; validation, M.A.B., R.V.R. and E.A.P.; formal analysis, M.I.R., T.Y.G. and E.A.M.; investigation, A.S.Z., T.Y.G., N.A.K., R.V.R. and M.A.B.; resources, S.A.A.; data curation, M.A.B.; writing—original draft preparation, M.A.B.; writing—review and editing, S.A.A.; visualization, N.A.K. and M.A.B.; supervision, S.A.A.; project administration, M.A.B.; funding acquisition, M.A.B. All authors have read and agreed to the published version of the manuscript.

Funding

This research was funded by RUSSIAN SCIENCE FOUNDATION, grant number 24-73-00209.

Institutional Review Board Statement

Not applicable.

Informed Consent Statement

Not applicable.

Data Availability Statement

The original contributions presented in this study are included in the article/Supplementary Materials. Further inquiries can be directed to the corresponding author.

Conflicts of Interest

The authors declare no conflicts of interest.

Abbreviations

The following abbreviations are used in this manuscript:
DMFDimethylformamide
MOFMetal-organic frameworks
5-iip/5-iip2−5-iodoisophthalate
TGAThermogravimetric analysis
ICP OESInductively coupled plasma optical emission spectrometry
EDXEnergy-dispersive X-ray spectroscopy
CCDCCambridge Crystallographic Data Centre
XBHalogen bonding
PLEPhotoluminescence excitation
PLPhotoluminescence
NRNon-radiative
CIEInternational Commission on Illumination
CCTCorrelated color temperature
LEDLight-emitting diode
W-LEDWhite light-emitting diode
CTBCharge transfer band
NMRNuclear magnetic resonance
DMSODimethyl sulfoxide

References

  1. Gorbunova, Y.G.; Fedin, V.P.; Blatov, V.A. Metal-organic frameworks as the basis for new-generation functional materials. Russ. Chem. Rev. 2022, 91, RCR5050. [Google Scholar] [CrossRef]
  2. Afshariazar, F.; Morsali, A. Mixed-valence metal-organic frameworks: Concepts, opportunities, and prospects. Chem. Soc. Rev. 2024, 54, 1318–1383. [Google Scholar] [CrossRef] [PubMed]
  3. Razavi, S.A.A.; Chen, W.; Zhou, H.-C.; Morsali, A. Tuning redox activity in metal–organic frameworks: From structure to application. Coord. Chem. Rev. 2024, 517, 216004. [Google Scholar] [CrossRef]
  4. Liu, K.-G.; Bigdeli, F.; Panjehpour, A.; Larimi, A.; Morsali, A.; Dhakshinamoorthy, A.; Garcia, H. Metal organic framework composites for reduction of CO2. Coord. Chem. Rev. 2023, 493, 215257. [Google Scholar] [CrossRef]
  5. Bigdeli, F.; Fetzer, M.N.A.; Nis, B.; Morsali, A.; Janiak, C. Coordination modulation: A way to improve the properties of metal-organic frameworks. J. Mater. Chem. A 2023, 11, 22105–22131. [Google Scholar] [CrossRef]
  6. Easun, T.L.; Moreau, F.; Yan, Y.; Yang, S.; Schröder, M. Structural and dynamic studies of substrate binding in porous metal-organic frameworks. Chem. Soc. Rev. 2017, 46, 239–274. [Google Scholar] [CrossRef]
  7. Han, X.; Yang, S.; Schröder, M. Porous metal–organic frameworks as emerging sorbents for clean air. Nat. Rev. Chem. 2019, 3, 108–118. [Google Scholar] [CrossRef]
  8. Lysova, A.A.; Samsonenko, D.G.; Kovalenko, K.A.; Nizovtsev, A.S.; Dybtsev, D.N.; Fedin, V.P. A Series of Mesoporous Metal-Organic Frameworks with Tunable Windows Sizes and Exceptionally High Ethane over Ethylene Adsorption Selectivity. Angew. Chem. Int. Ed. 2020, 59, 20561–20567. [Google Scholar] [CrossRef] [PubMed]
  9. Lu, Z.; Godfrey, H.G.W.; Da Silva, I.; Cheng, Y.; Savage, M.; Manuel, P.; Rudić, S.; Ramirez-Cuesta, A.J.; Yang, S.; Schröder, M. Direct observation of supramolecular binding of light hydrocarbons in vanadium(III) and (iv) metal-organic framework materials. Chem. Sci. 2018, 9, 3401–3408. [Google Scholar] [CrossRef]
  10. Gulbalkan, H.C.; Uzun, A.; Keskin, S. Evaluating CH4/N2 Separation Performances of Hundreds of Thousands of Real and Hypothetical MOFs by Harnessing Molecular Modeling and Machine Learning. ACS Appl. Mater. Interfaces 2025, 17, 17691–17702. [Google Scholar] [CrossRef]
  11. Gulbalkan, H.C.; Uzun, A.; Keskin, S. Assessing CO2 separation performances of IL/ZIF-8 composites using molecular features of ILs. Carbon Capture Sci. Technol. 2025, 14, 100373. [Google Scholar] [CrossRef]
  12. Habib, N.; Aydogdu, A.S.; Keskin, S.; Uzun, A. Selective separation of acetylene from ethylene using mixed matrix membranes with MIL-100(Fe) as a filler. J. Memb. Sci. 2025, 720, 123782. [Google Scholar] [CrossRef]
  13. Prasetya, N.; Gülbalkan, H.C.; Keskin, S.; Wöll, C. Boosting CO2 separation in porphyrinic MOF-based mixed matrix membranes via central metal atom integration. Carbon Capture Sci. Technol. 2024, 13, 100252. [Google Scholar] [CrossRef]
  14. Aksu, G.O.; Keskin, S. Advancing CH4/H2 separation with covalent organic frameworks by combining molecular simulations and machine learning. J. Mater. Chem. A 2023, 11, 14788–14799. [Google Scholar] [CrossRef]
  15. Sapianik, A.A.; Dudko, E.R.; Kovalenko, K.A.; Barsukova, M.O.; Samsonenko, D.G.; Dybtsev, D.N.; Fedin, V.P. Metal-Organic Frameworks for Highly Selective Separation of Xylene Isomers and Single-Crystal X-ray Study of Aromatic Guest-Host Inclusion Compounds. ACS Appl. Mater. Interfaces 2021, 13, 14768–14777. [Google Scholar] [CrossRef]
  16. Sapianik, A.A.; Kovalenko, K.A.; Samsonenko, D.G.; Barsukova, M.O.; Dybtsev, D.N.; Fedin, V.P. Exceptionally effective benzene/cyclohexane separation using a nitro-decorated metal-organic framework. Chem. Commun. 2020, 56, 8241–8244. [Google Scholar] [CrossRef]
  17. Sun, N.; Zhou, X.; Liu, J.; Yu, H.; Si, X.; Ding, F.; Sun, Y. Discrimination of p-xylene from xylene isomers by precisely tuning the spacing of an interpenetrated metal-organic framework. J. Mater. Chem. A 2025, 13, 9665–9672. [Google Scholar] [CrossRef]
  18. Tu, T.N.; Kwon, H.T.; Scheer, M.; Kim, J. High toluene uptake at a trace concentration in a novel gallium-based metal-organic framework. J. Mater. Chem. A 2025, 13, 9479–9485. [Google Scholar] [CrossRef]
  19. Zhang, X.; Zhang, Z.; Boissonnault, J.; Cohen, S.M. Design and synthesis of squaramide-based MOFs as efficient MOF-supported hydrogen-bonding organocatalysts. Chem. Commun. 2016, 52, 8585–8588. [Google Scholar] [CrossRef]
  20. Pintado-Sierra, M.; Rasero-Almansa, A.M.; Corma, A.; Iglesias, M.; Sánchez, F. Bifunctional iridium-(2-aminoterephthalate)-Zr-MOF chemoselective catalyst for the synthesis of secondary amines by one-pot three-step cascade reaction. J. Catal. 2013, 299, 137–145. [Google Scholar] [CrossRef]
  21. Yang, Z.; Zhang, W.; Yin, Y.; Fang, W.; Xue, H. Metal-organic framework-based sensors for the detection of toxins and foodborne pathogens. Food Control 2022, 133, 108684. [Google Scholar] [CrossRef]
  22. Sen, C.; Devi, S.; Niharika, N.; Bhagat, N.; Sheikh, H.N. A 3D photoluminescent Eu(iii)-MOF sensor supported by a tetracarboxylate ligand for the sensitive and selective detection of Cd2+ and o-nitrophenol. New J. Chem. 2024, 48, 15136–15148. [Google Scholar] [CrossRef]
  23. Kreno, L.E.; Leong, K.; Farha, O.K.; Allendorf, M.; Van Duyne, R.P.; Hupp, J.T. Metal-organic framework materials as chemical sensors. Chem. Rev. 2012, 112, 1105–1125. [Google Scholar] [CrossRef] [PubMed]
  24. Cavallo, G.; Metrangolo, P.; Milani, R.; Pilati, T.; Priimagi, A.; Resnati, G.; Terraneo, G. The Halogen Bond. Chem. Rev. 2016, 116, 2478–2601. [Google Scholar] [CrossRef]
  25. Eliseeva, A.A.; Ivanov, D.M.; Rozhkov, A.V.; Ananyev, I.V.; Frontera, A.; Kukushkin, V.Y. Bifurcated Halogen Bonding Involving Two Rhodium(I) Centers as an Integrated σ-Hole Acceptor. JACS Au 2021, 1, 354–361. [Google Scholar] [CrossRef]
  26. Soldatova, N.S.; Postnikov, P.S.; Suslonov, V.V.; Kissler, T.Y.; Ivanov, D.M.; Yusubov, M.S.; Galmés, B.; Frontera, A.; Kukushkin, V.Y. Diaryliodonium as a double s-hole donor: The dichotomy of thiocyanate halogen bonding provides divergent solid state arylation by diaryliodonium cations. Org. Chem. Front. 2020, 7, 2230–2242. [Google Scholar] [CrossRef]
  27. Eliseeva, A.A.; Ivanov, D.M.; Novikov, A.S.; Rozhkov, A.V.; Kornyakov, I.V.; Dubovtsev, A.Y.; Kukushkin, V.Y. Hexaiododiplatinate(ii) as a useful supramolecular synthon for halogen bond involving crystal engineering. Dalt. Trans. 2020, 49, 356–367. [Google Scholar] [CrossRef] [PubMed]
  28. Novikov, A.S.; Bolotin, D.S.; Il’in, M.V. Pyrazolyliodonium platinum(II) trichloride features the highest positive electrostatic potential on the iodine atom among uncharged halogen bond donors. Inorganica Chim. Acta 2024, 573, 122335. [Google Scholar] [CrossRef]
  29. Sysoeva, A.A.; Novikov, A.S.; Il’in, M.V.; Bolotin, D.S. Halogen bonded associates of iodonium salts with 18-crown-6: Does structural flexibility or structural rigidity of the σ-hole donor provide efficient substrate ligation? New J. Chem. 2024, 48, 12929–12935. [Google Scholar] [CrossRef]
  30. Kalaj, M.; Momeni, M.R.; Bentz, K.C.; Barcus, K.S.; Palomba, J.M.; Paesani, F.; Cohen, S.M. Halogen bonding in UiO-66 frameworks promotes superior chemical warfare agent simulant degradation. Chem. Commun. 2019, 55, 3481–3484. [Google Scholar] [CrossRef]
  31. Gurbanov, A.V.; Kuznetsov, M.L.; Karmakar, A.; Aliyeva, V.A.; Mahmudov, K.T.; Pombeiro, A.J.L. Halogen bonding in cadmium(II) MOFs: Its influence on the structure and on the nitroaldol reaction in aqueous medium. Dalt. Trans. 2022, 51, 1019–1031. [Google Scholar] [CrossRef]
  32. Yang, L.-M.; Fang, G.-Y.; Ma, J.; Pushpa, R.; Ganz, E. Halogenated MOF-5 variants show new configuration, tunable band gaps and enhanced optical response in the visible and near infrared. Phys. Chem. Chem. Phys. 2016, 18, 32319–32330. [Google Scholar] [CrossRef] [PubMed]
  33. Zhukov, L.A.; Lysova, A.A.; Samsonenko, D.G.; Dybtsev, D.N.; Fedin, V.P. A Series of Coordination Polymers Based on 4,8-Disulfo-2,6-Naphthalenedicarboxylic Acid. J. Struct. Chem. 2024, 65, 2111–2120. [Google Scholar] [CrossRef]
  34. Pavlov, D.I.; Ryadun, A.A.; Fedin, V.P.; Potapov, A.S. Zinc Metal-Organic Coordination Polymer with 4,7-di(1,2,4-triazol-1-yl)-2,1,3-Benzothiadiazole and 1,4-Naphthalene Dicarboxylic Acid: Luminescent Properties and Guest–Host Charge Transfer. J. Struct. Chem. 2024, 65, 2567–2578. [Google Scholar] [CrossRef]
  35. Cheplakova, A.M.; Eliseev, E.A.; Samsonenko, D.G.; Fedin, V.P. Crystal Structures of Metal-Organic Frameworks Based on Magnesium Cations and Isomeric Tetrafluorobenzenedicarboxylate Ligands. J. Struct. Chem. 2024, 65, 1219–1226. [Google Scholar] [CrossRef]
  36. Chistyakov, A.S.; Zorina-Tikhonova, E.N.; Vologzhanina, A.V.; Kiskin, M.A.; Eremenko, I.L. 2D Coordination Polymers of Zn(II) with Diethylmalonic Acid Dianions and 4,4′-bipyridine: Synthesis and Structure. Russ. J. Coord. Chem. 2024, 50, 469–475. [Google Scholar] [CrossRef]
  37. Kiskin, M.A.; Konnik, O.V.; Shul’gin, V.F.; Gusev, A.N. Crystal Structure of Lanthanide Salts with 2,4-Dichlorophenoxyacetic Acid. Russ. J. Coord. Chem. 2024, 50, 476–484. [Google Scholar] [CrossRef]
  38. Krinochkin, A.P.; Vatolina, S.E.; Gaviko, V.S.; Litvinov, I.A.; Valieva, M.I.; Shtaitz, Y.K.; Rybakova, S.S.; Kopchuk, D.S.; Zyryanov, G.V.; Rusinov, V.L. Samarium(III) Complex Based on 5-Phenyl-2,2′-bipyridine with the Diethylenetriaminotetraacetic Acid Residue in the C6 Position: Synthesis, Crystal Structure, and Photophysical Properties. Russ. J. Coord. Chem. 2024, 50, 398–404. [Google Scholar] [CrossRef]
  39. Rubtsova, I.K.; Melnikov, S.N.; Shmelev, M.A.; Nikolaevskii, S.A.; Yakushev, I.A.; Voronina, J.K.; Barabanova, E.D.; Kiskin, M.A.; Sidorov, A.A.; Eremenko, I.L. Facile synthesis and structure elucidation of metal-organic frameworks with {ZnCa} and {Zn2Ca} metal cores. Mendeleev Commun. 2020, 30, 722–724. [Google Scholar] [CrossRef]
  40. Zaguzin, A.S.; Sukhikh, T.S.; Kolesov, B.A.; Sokolov, M.N.; Fedin, V.P.; Adonin, S.A. Iodinated vs. non-iodinated: Comparison of sorption selectivity by [Zn2(bdc)2dabco]n and superstructural 2-iodoterephtalate-based metal–organic framework. Polyhedron 2022, 212, 115587. [Google Scholar] [CrossRef]
  41. Utochnikova, V.V.; Kalyakina, A.S.; Solodukhin, N.N.; Aslandukov, A.N. On the Structural Features of Substituted Lanthanide Benzoates. Eur. J. Inorg. Chem. 2019, 2019, 2320–2332. [Google Scholar] [CrossRef]
  42. Utochnikova, V.V.; Solodukhin, N.N.; Aslandukov, A.N.; Marciniak, L.; Bushmarinov, I.S.; Vashchenko, A.A.; Kuzmina, N.P. Lanthanide tetrafluorobenzoates as emitters for OLEDs: New approach for host selection. Org. Electron. 2017, 44, 85–93. [Google Scholar] [CrossRef]
  43. Utochnikova, V.V.; Kotova, O.V.; Shchukina, E.M.; Eliseeva, S.V.; Kuz’mina, N.P. Gas-phase synthesis of terbium and lutetium carboxylates. Russ. J. Inorg. Chem. 2008, 53, 1878–1884. [Google Scholar] [CrossRef]
  44. Rao, X.; Huang, Q.; Yang, X.; Cui, Y.; Yang, Y.; Wu, C.; Chen, B.; Qian, G. Color tunable and white light emitting Tb3+ and Eu3+ doped lanthanide metal–organic framework materials. J. Mater. Chem. 2012, 22, 3210–3214. [Google Scholar] [CrossRef]
  45. Lutter, J.C.; Eliseeva, S.V.; Collet, G.; Martinić, I.; Kampf, J.W.; Schneider, B.L.; Carichner, A.; Sobilo, J.; Lerondel, S.; Petoud, S.; et al. Iodinated Metallacrowns: Toward Combined Bimodal Near-Infrared and X-Ray Contrast Imaging Agents. Chem. Eur. J. 2020, 26, 1274–1277. [Google Scholar] [CrossRef]
  46. Zang, S.-Q.; Fan, Y.-J.; Li, J.-B.; Hou, H.-W.; Mak, T.C.W. Halogen Bonding in the Assembly of Coordination Polymers Based on 5-Iodo-Isophthalic Acid. Cryst. Growth Des. 2011, 11, 3395–3405. [Google Scholar] [CrossRef]
  47. Zang, S.-Q.; Dong, M.-M.; Fan, Y.-J.; Hou, H.-W.; Mak, T.C.W. Four Cobaltic Coordination Polymers Based on 5-Iodo-Isophthalic Acid: Halogen-Related Interaction and Solvent Effect. Cryst. Growth Des. 2012, 12, 1239–1246. [Google Scholar] [CrossRef]
  48. Cheng, F.; Wang, H.; Hua, Y.; Cao, H.; Zhou, B.; Duan, J.; Jin, W. Halogen bonded supramolecular porous structures with a kgm layer. CrystEngComm 2016, 18, 9227–9230. [Google Scholar] [CrossRef]
  49. Zaguzin, A.S.; Bondarenko, M.A.; Korobeynikov, N.A.; Usoltsev, A.N.; Fedin, V.P.; Adonin, S.A. 3D Metal-Organic Coordination Polymers of Zn(II) Based on 1,2-Bis(4-pyridyl)ethylene and Anions of Iodoterephthalic and Iodoisophthalic Acids. Russ. J. Inorg. Chem. 2024, 69, 1018–1023. [Google Scholar] [CrossRef]
  50. Dong, M.M.; Zhu, D.Y.; Zhao, Y.; Li, X.Y.; Zang, S.Q. A two-fold interpenetrated diamondlike 3D metal-organic Cd(II) complex based on 5-Iodo-isophthalic acid and 1,3-Bi(4-pyridyl)propane. Z. Naturforsch. Sect. B J. Chem. Sci. 2012, 67, 499–503. [Google Scholar] [CrossRef]
  51. Mantina, M.; Chamberlin, A.C.; Valero, R.; Cramer, C.J.; Truhlar, D.G. Consistent van der Waals Radii for the Whole Main Group. J. Phys. Chem. A 2009, 113, 5806–5812. [Google Scholar] [CrossRef] [PubMed]
  52. Zaguzin, A.S.; Spiridonova, D.V.; Novikov, A.S.; Rakhmanova, M.I.; Zherebtsov, D.A.; Fedin, V.P.; Adonin, S.A. Two-dimensional ZnII coordination polymer based on 5-iodoisophthalate: Synthesis, crystal and electronic structure. Russ. Chem. Bull. 2023, 72, 177–183. [Google Scholar] [CrossRef]
  53. Lee, R.L.; Romero, J.; Hernández-Andrés, J. Calculating correlated color temperatures across the entire gamut of daylight and skylight chromaticities. Appl. Opt. 1999, 38, 5703–5709. [Google Scholar]
  54. Schubert, E.F. Light-Emitting Diodes, 2nd ed.; Cambridge University Press: Cambridge, UK, 2006; pp. 1–422. ISBN 9780521865388. [Google Scholar]
  55. Krishnaiah, K.V.; Kumar, K.U.; Jayasankar, C.K. Spectroscopic properties of Dy3+-doped oxyfluoride glasses for white light emitting diodes. Mater. Express 2013, 3, 61–70. [Google Scholar] [CrossRef]
  56. Vijaya, N.; Upendra Kumar, K.; Jayasankar, C.K. Dy3+-doped zinc fluorophosphate glasses for white luminescence applications. Spectrochim. Acta Part A Mol. Biomol. Spectrosc. 2013, 113, 145–153. [Google Scholar] [CrossRef]
  57. Wang, H.; Deng, T.; Cai, C. Fluorous bis(oxazolines) ligand: Synthesis and application in Kabachnik-Fields reaction. J. Fluor. Chem. 2014, 168, 144–150. [Google Scholar] [CrossRef]
  58. Krause, L.; Herbst-Irmer, R.; Sheldrick, G.M.; Stalke, D. Comparison of silver and molybdenum microfocus X-ray sources for single-crystal structure determination. J. Appl. Crystallogr. 2015, 48, 3–10. [Google Scholar] [CrossRef]
  59. Sheldrick, G.M. SHELXT—Integrated space-group and crystal-structure determination. Acta Crystallogr. Sect. A Found. Crystallogr. 2015, 71, 3–8. [Google Scholar] [CrossRef]
  60. Sheldrick, G.M. Crystal structure refinement with SHELXL. Acta Crystallogr. Sect. C Struct. Chem. 2015, 71, 3–8. [Google Scholar] [CrossRef]
  61. Hübschle, C.B.; Sheldrick, G.M.; Dittrich, B. ShelXle: A Qt graphical user interface for SHELXL. J. Appl. Crystallogr. 2011, 44, 1281–1284. [Google Scholar] [CrossRef]
  62. Dolomanov, O.V.; Bourhis, L.J.; Gildea, R.J.; Howard, J.A.K.; Puschmann, H. OLEX2: A complete structure solution, refinement and analysis program. J. Appl. Crystallogr. 2009, 42, 339–341. [Google Scholar] [CrossRef]
Figure 1. Building block of 1. Gd atoms are orange, O red, N—blue. At disordered I atoms (violet), occupancies are given for each position. I···O contacts dashed.
Inorganics 13 00154 g001
Figure 2. Crystal packing of 1 along a axis (left) and b axis (right). On the first part of the figure, only oxygen atoms of DMF molecules are given. Gd atoms are tiffany blue.
Inorganics 13 00154 g002
Figure 3. Two different building blocks in 2. Some 5-iip molecules are not represented. Only oxygen atoms of DMF molecules are shown.
Inorganics 13 00154 g003
Figure 4. Crystal packing of 2. O4 atoms facing into the voids are highlighted. Disordered DMF molecules are reduced to O atoms.
Inorganics 13 00154 g004
Figure 5. The excitation and emission spectra of 1.
Inorganics 13 00154 g005
Figure 6. The emission spectra 1, 2 and series of [GdxDy2−x(5-iip)3DMF2]·0.33DMF under the pumping λex of 325 nm (a) and 386 nm (b).
Inorganics 13 00154 g006
Figure 7. The emission spectra of complexes 1, 2 and [GdxDy2−x(5-iip)3DMF2]·0.33DMF; the excitation spectra of complexes with emission wavelength λem monitored at 574 nm.
Inorganics 13 00154 g007
Figure 8. Schematic energy level diagram showing the excitation and emission mechanism of complexes [GdxDy2−x(5-iip)3DMF2]·0.33DMF (NR = non-radiative transitions).
Inorganics 13 00154 g008
Figure 9. CIE 1931 coordinate for complexes [GdxDy2−x(5-iip)3DMF2]·0.33DMF at 300 K, λex = 325 and 386 nm.
Inorganics 13 00154 g009
Figure 10. The excitation spectra (λem = 618 nm) for the complexes [EuxDy2−x(5-iip)3DMF2]·0.33DMF, T = 300 K.
Inorganics 13 00154 g010
Figure 11. The emission spectra (λex = 395 nm) for the complexes [EuxDy2−x(5-iip)3DMF2]·0.33DMF, T = 300 K.
Inorganics 13 00154 g011
Figure 12. CIE diagram for the complexes [EuxDy2−x(5-iip)3DMF2]·0.33DMF, T = 300 K.
Inorganics 13 00154 g012
Figure 13. The schematic energy level diagram showing the excitation and emission mechanism of complexes [EuxDy2−x(5-iip)3DMF2]·0.33DMF (NR = non-radiative transitions).
Inorganics 13 00154 g013
Table 1. Reagent weights for the [GdxDy2−x(5-iip)3DMF2]·0.33DMF series.
Ratio of
GdCl3·6H2O:Dy(NO3)3·5H2O
Amount of GdCl3·6H2O, mg (mmol)Amount of Dy(NO3)3·5H2O, mg (mmol)
0.2:1.86.8 (0.018)72.1 (0.164)
0.4:1.613.6 (0.037)64.1 (0.146)
0.6:1.420.4 (0.054)56.1 (0.128)
0.8:1.227.2 (0.073)48.1 (0.109)
1.0:1.033.9 (0.091)40.0 (0.091)
1.2:0.840.7 (0.109)32.0 (0.073)
1.4:0.647.5 (0.128)24.0 (0.055)
1.6:0.454.3 (0.146)16.0 (0.036)
1.8:0.261.1 (0.164)8.0 (0.018)
Table 2. Reagent weights for the [EuxDy2−x(5-iip)3DMF2]·0.33DMF series.
Ratio of
EuCl3·6H2O:Dy(NO3)3·5H2O
Amount of EuCl3·6H2O, mg (mmol)Amount of Dy(NO3)3·5H2O, mg (mmol)
0.2:1.86.7 (0.018)72.1 (0.164)
0.4:1.613.4 (0.037)64.1 (0.146)
0.6:1.420.1 (0.055)56.1 (0.128)
0.8:1.226.8 (0.073)48.1 (0.109)
1.0:1.033.5 (0.091)40.0 (0.091)
1.2:0.840.2 (0.110)32.0 (0.073)
1.4:0.646.8 (0.128)24.0 (0.055)
1.6:0.453.5 (0.146)16.0 (0.036)
1.8:0.260.2 (0.164)8.0 (0.018)
Disclaimer/Publisher’s Note: The statements, opinions and data contained in all publications are solely those of the individual author(s) and contributor(s) and not of MDPI and/or the editor(s). MDPI and/or the editor(s) disclaim responsibility for any injury to people or property resulting from any ideas, methods, instructions or products referred to in the content.

