Article

Synthesis of M-Doped MoSe2 (M = Fe, Co, Ni) via Chemical Vapor Deposition for an Electrocatalytic Hydrogen Evolution Reaction

by
Xinya Chen
1,
Xingchen Zhang
1,
Jinying Zhang
2 and
Zhiyong Wang
1,*
1
Key Laboratory of Advanced Light Conversion Materials and Biophotonics, School of Chemistry and Life Resources, Renmin University of China, Beijing 100872, China
2
State Key Laboratory of Electrical Insulation and Power Equipment, Center of Nanomaterials for Renewable Energy (CNRE), School of Electrical Engineering, Xi’an Jiaotong University, Xi’an 710049, China
*
Author to whom correspondence should be addressed.
Inorganics 2025, 13(5), 155; https://doi.org/10.3390/inorganics13050155
Submission received: 1 April 2025 / Revised: 30 April 2025 / Accepted: 6 May 2025 / Published: 8 May 2025

Abstract

:
Given the high cost and limited availability of noble-metal-based catalysts in acidic media water electrolysis, developing cost-effective and high-performance non-noble metal catalysts is crucial for realizing large-scale hydrogen production. In this study, Fe-, Co-, and Ni-doped MoSe2 nanomaterials were synthesized via chemical vapor deposition, and their electrocatalytic performance for the hydrogen evolution reaction (HER) was systematically evaluated. Characterization techniques including X-ray diffraction, X-ray photoelectron spectroscopy, transmission electron microscopy, scanning electron microscopy, and Raman spectroscopy were used to confirm the incorporation of doping elements and investigate their effects on the crystal structure and morphology of MoSe2. Electrochemical tests, including linear sweep voltammetry and cyclic voltammetry, revealed that the doping of Fe, Co, and Ni significantly enhanced the HER catalytic activity of MoSe2, with the Co-doped sample exhibiting the best performance, showing an overpotential of 0.293 V at 100 mA/cm−2 and a Tafel slope of 47 mV/dec. Furthermore, density functional theory calculations were employed to analyze the adsorption energy of hydrogen atoms on the catalysts, providing deeper insights into the role of doping in tuning the catalytic activity of MoSe2. This study offers new theoretical support and experimental evidence for the application of transition metal-doped MoSe2 in electrocatalysis.

Graphical Abstract

1. Introduction

With the rapid advancement of renewable energy technologies, water electrolysis has garnered considerable attention as a clean and sustainable approach to hydrogen production [1,2,3,4]. In particular, acidic water splitting offers simplicity in operations and high efficiency, making it promising for large-scale hydrogen generation. Currently, noble metals (e.g., platinum) exhibit the best catalytic performance in acidic media, but their high cost and limited availability impede widespread application [5,6,7]. Therefore, the development of cost-effective, high-performance non-noble metal electrocatalysts is crucial to advancing hydrogen energy technologies.
In this context, two-dimensional transition metal dichalcogenides (TMDs) have emerged as a major focus of electrocatalytic research, owing to their tunable band gaps, abundant active sites, and distinctive layered structures [8,9,10]. Among them, molybdenum diselenide (MoSe2) has demonstrated promising theoretical catalytic activity due to its layered structure and moderate hydrogen adsorption free energy [11]. However, the low intrinsic electrical conductivity of MoSe2 severely limits its practical applications in electrocatalysis.
Recent advances demonstrate that transition metal doping can effectively tailor TMD’s electronic configuration through synergistic lattice strain and charge redistribution effects [12,13,14,15,16,17,18,19,20,21,22,23]. For instance, theoretical studies by Chen et al. have predicted that Fe doping enhances MoSe2’s metallic character by shifting the d-band center, while cobalt incorporation has been shown to optimize hydrogen adsorption kinetics on selenium vacancies [19]. Liu et al. computationally confirmed that Co doping optimizes the hydrogen adsorption energy (ΔGH* ≈ 0.08 eV) of MoSe2 [20]. Currently, there is a lack of experimental studies systematically comparing catalytic performance among different doped MoSe2 materials.
This study aims to synthesize Fe-, Co-, and Ni-doped MoSe2 using the chemical vapor deposition (CVD) method and systematically compare their electrocatalytic performance in a hydrogen evolution reaction (HER) through a combination of experimental characterization and theoretical calculations. Their structure and electronic properties were studied using techniques such as X-ray diffraction (XRD), X-ray photoelectron spectroscopy (XPS), transmission electron microscopy (TEM), and Raman spectroscopy. In addition, density functional theory calculations are used to gain insight into the effects of doping on the hydrogen adsorption behavior and catalytic reaction pathways. This study not only elucidates the mechanism of transition metal doping to improve the catalytic performance of MoSe2, but also provides important theoretical and experimental guidance for the design and optimization of novel HER electrocatalysts.

2. Results and Discussion

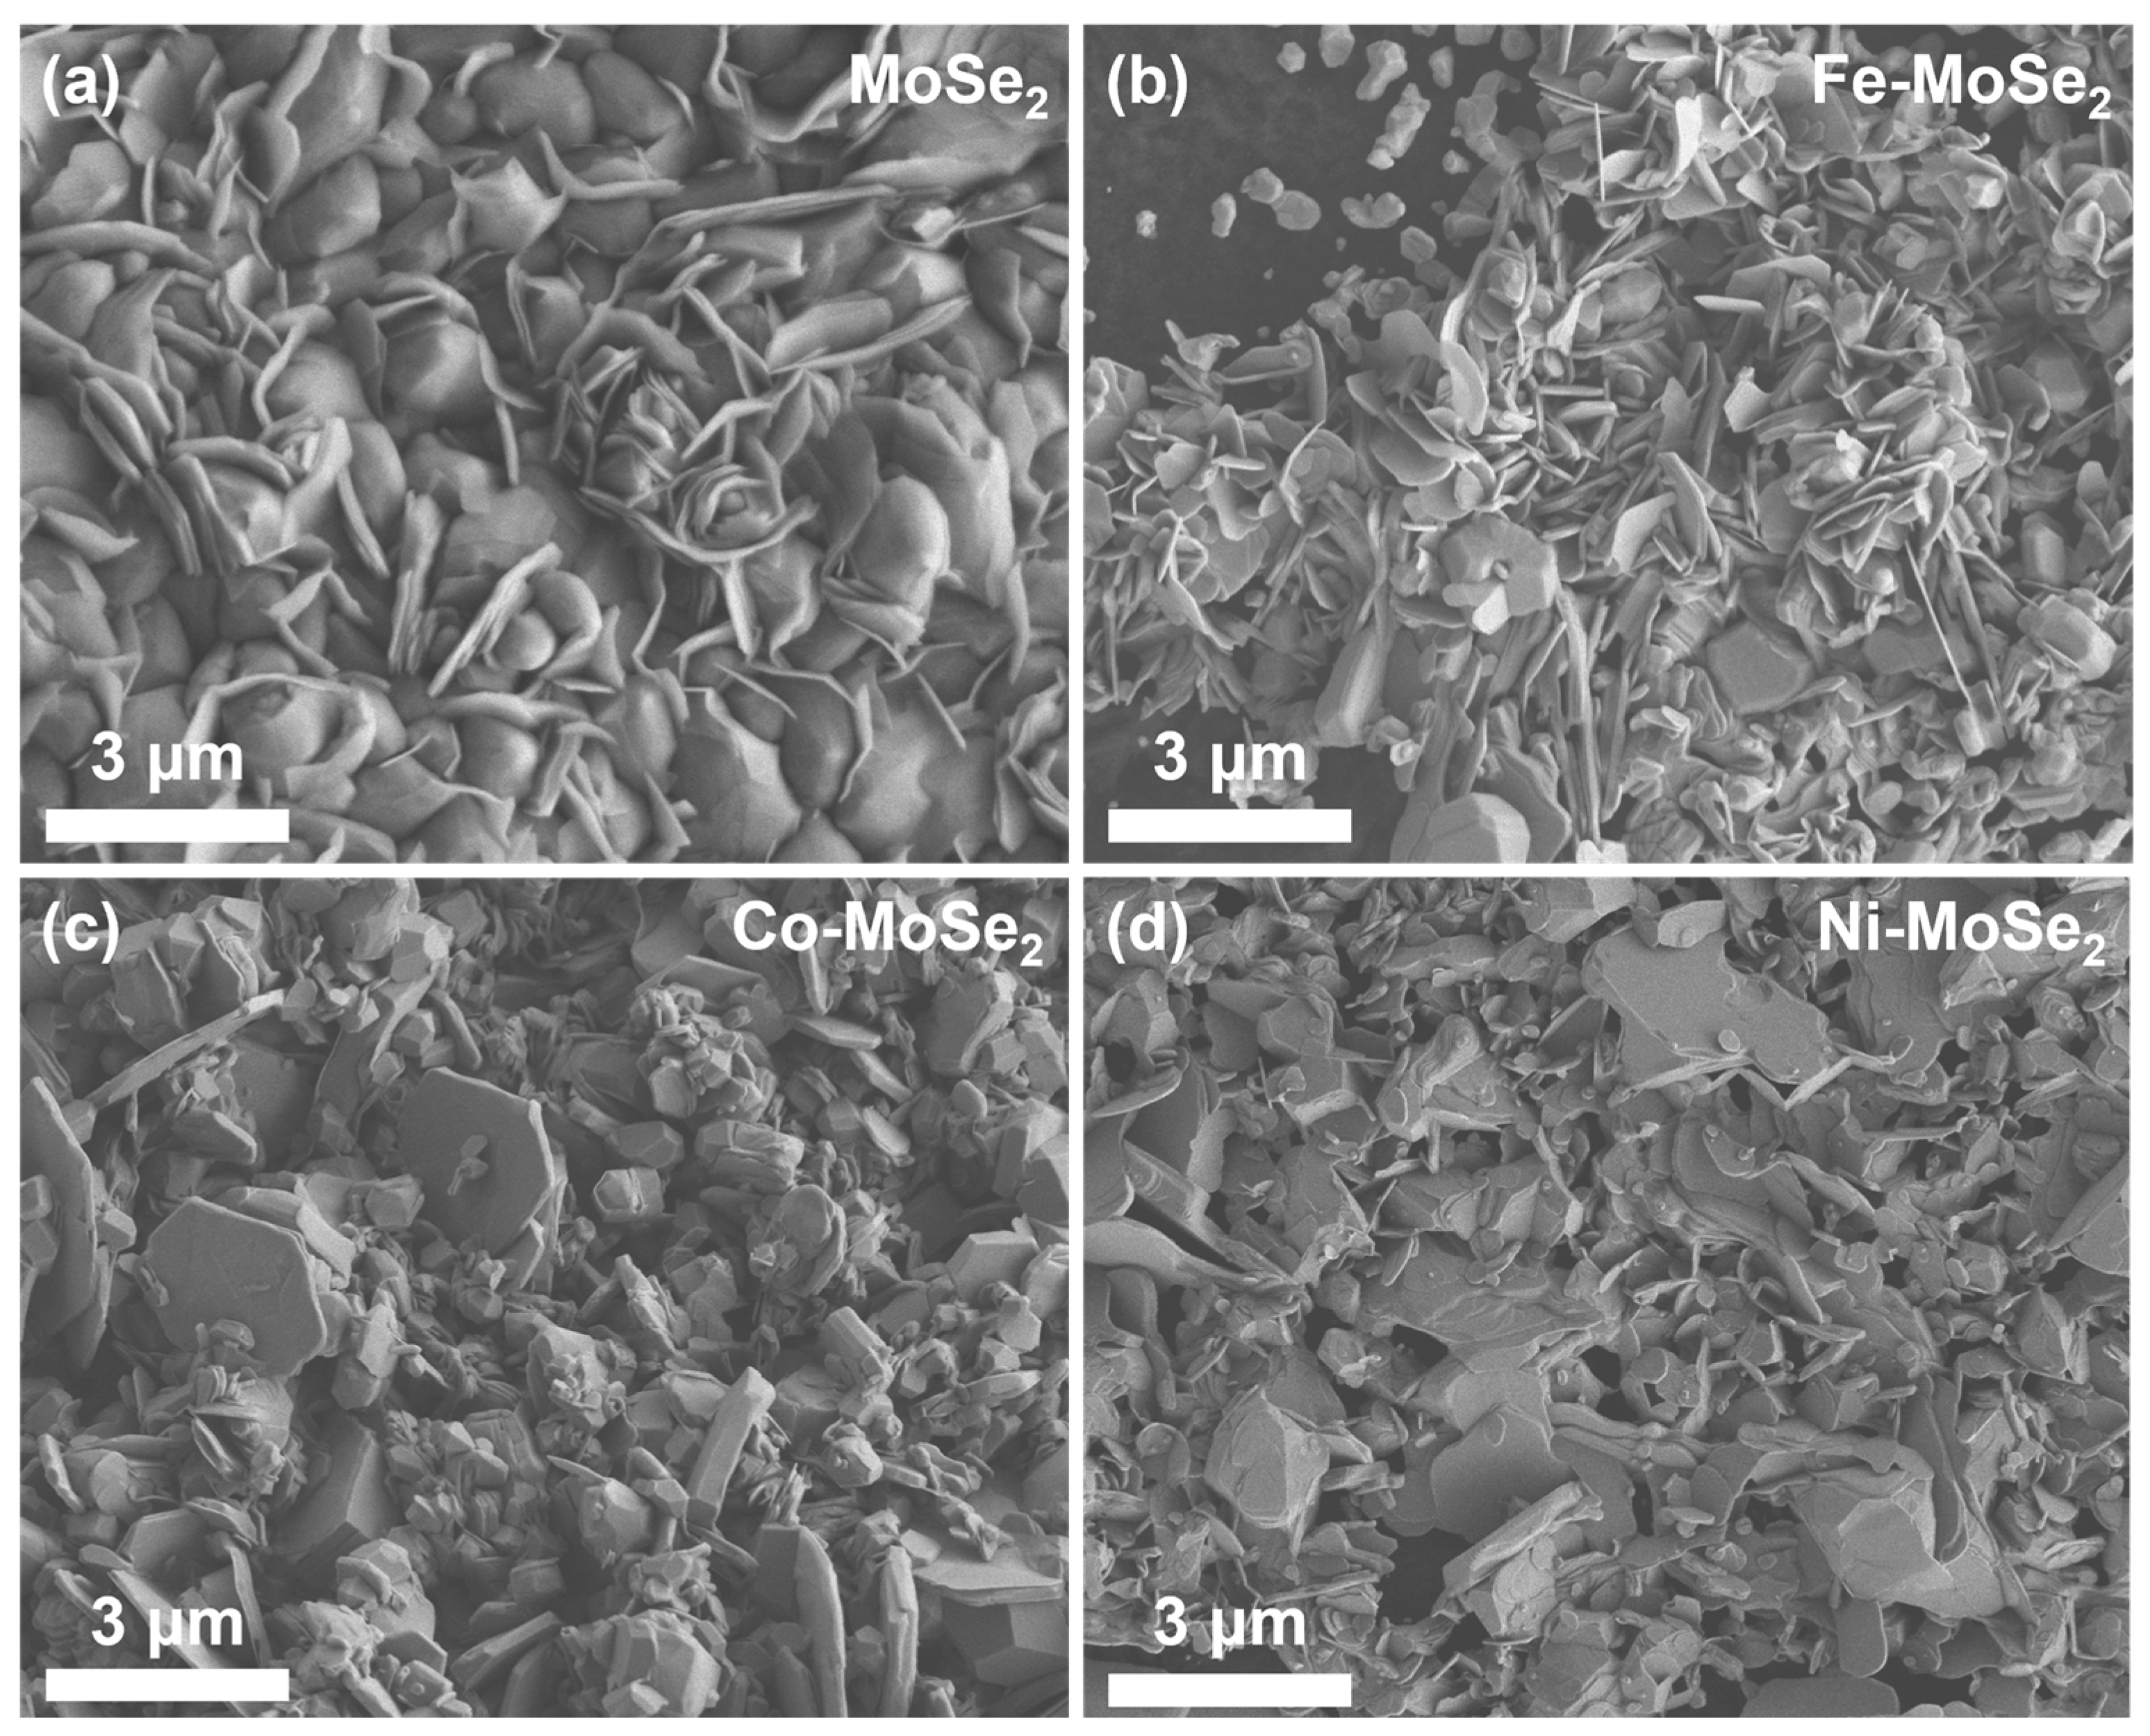
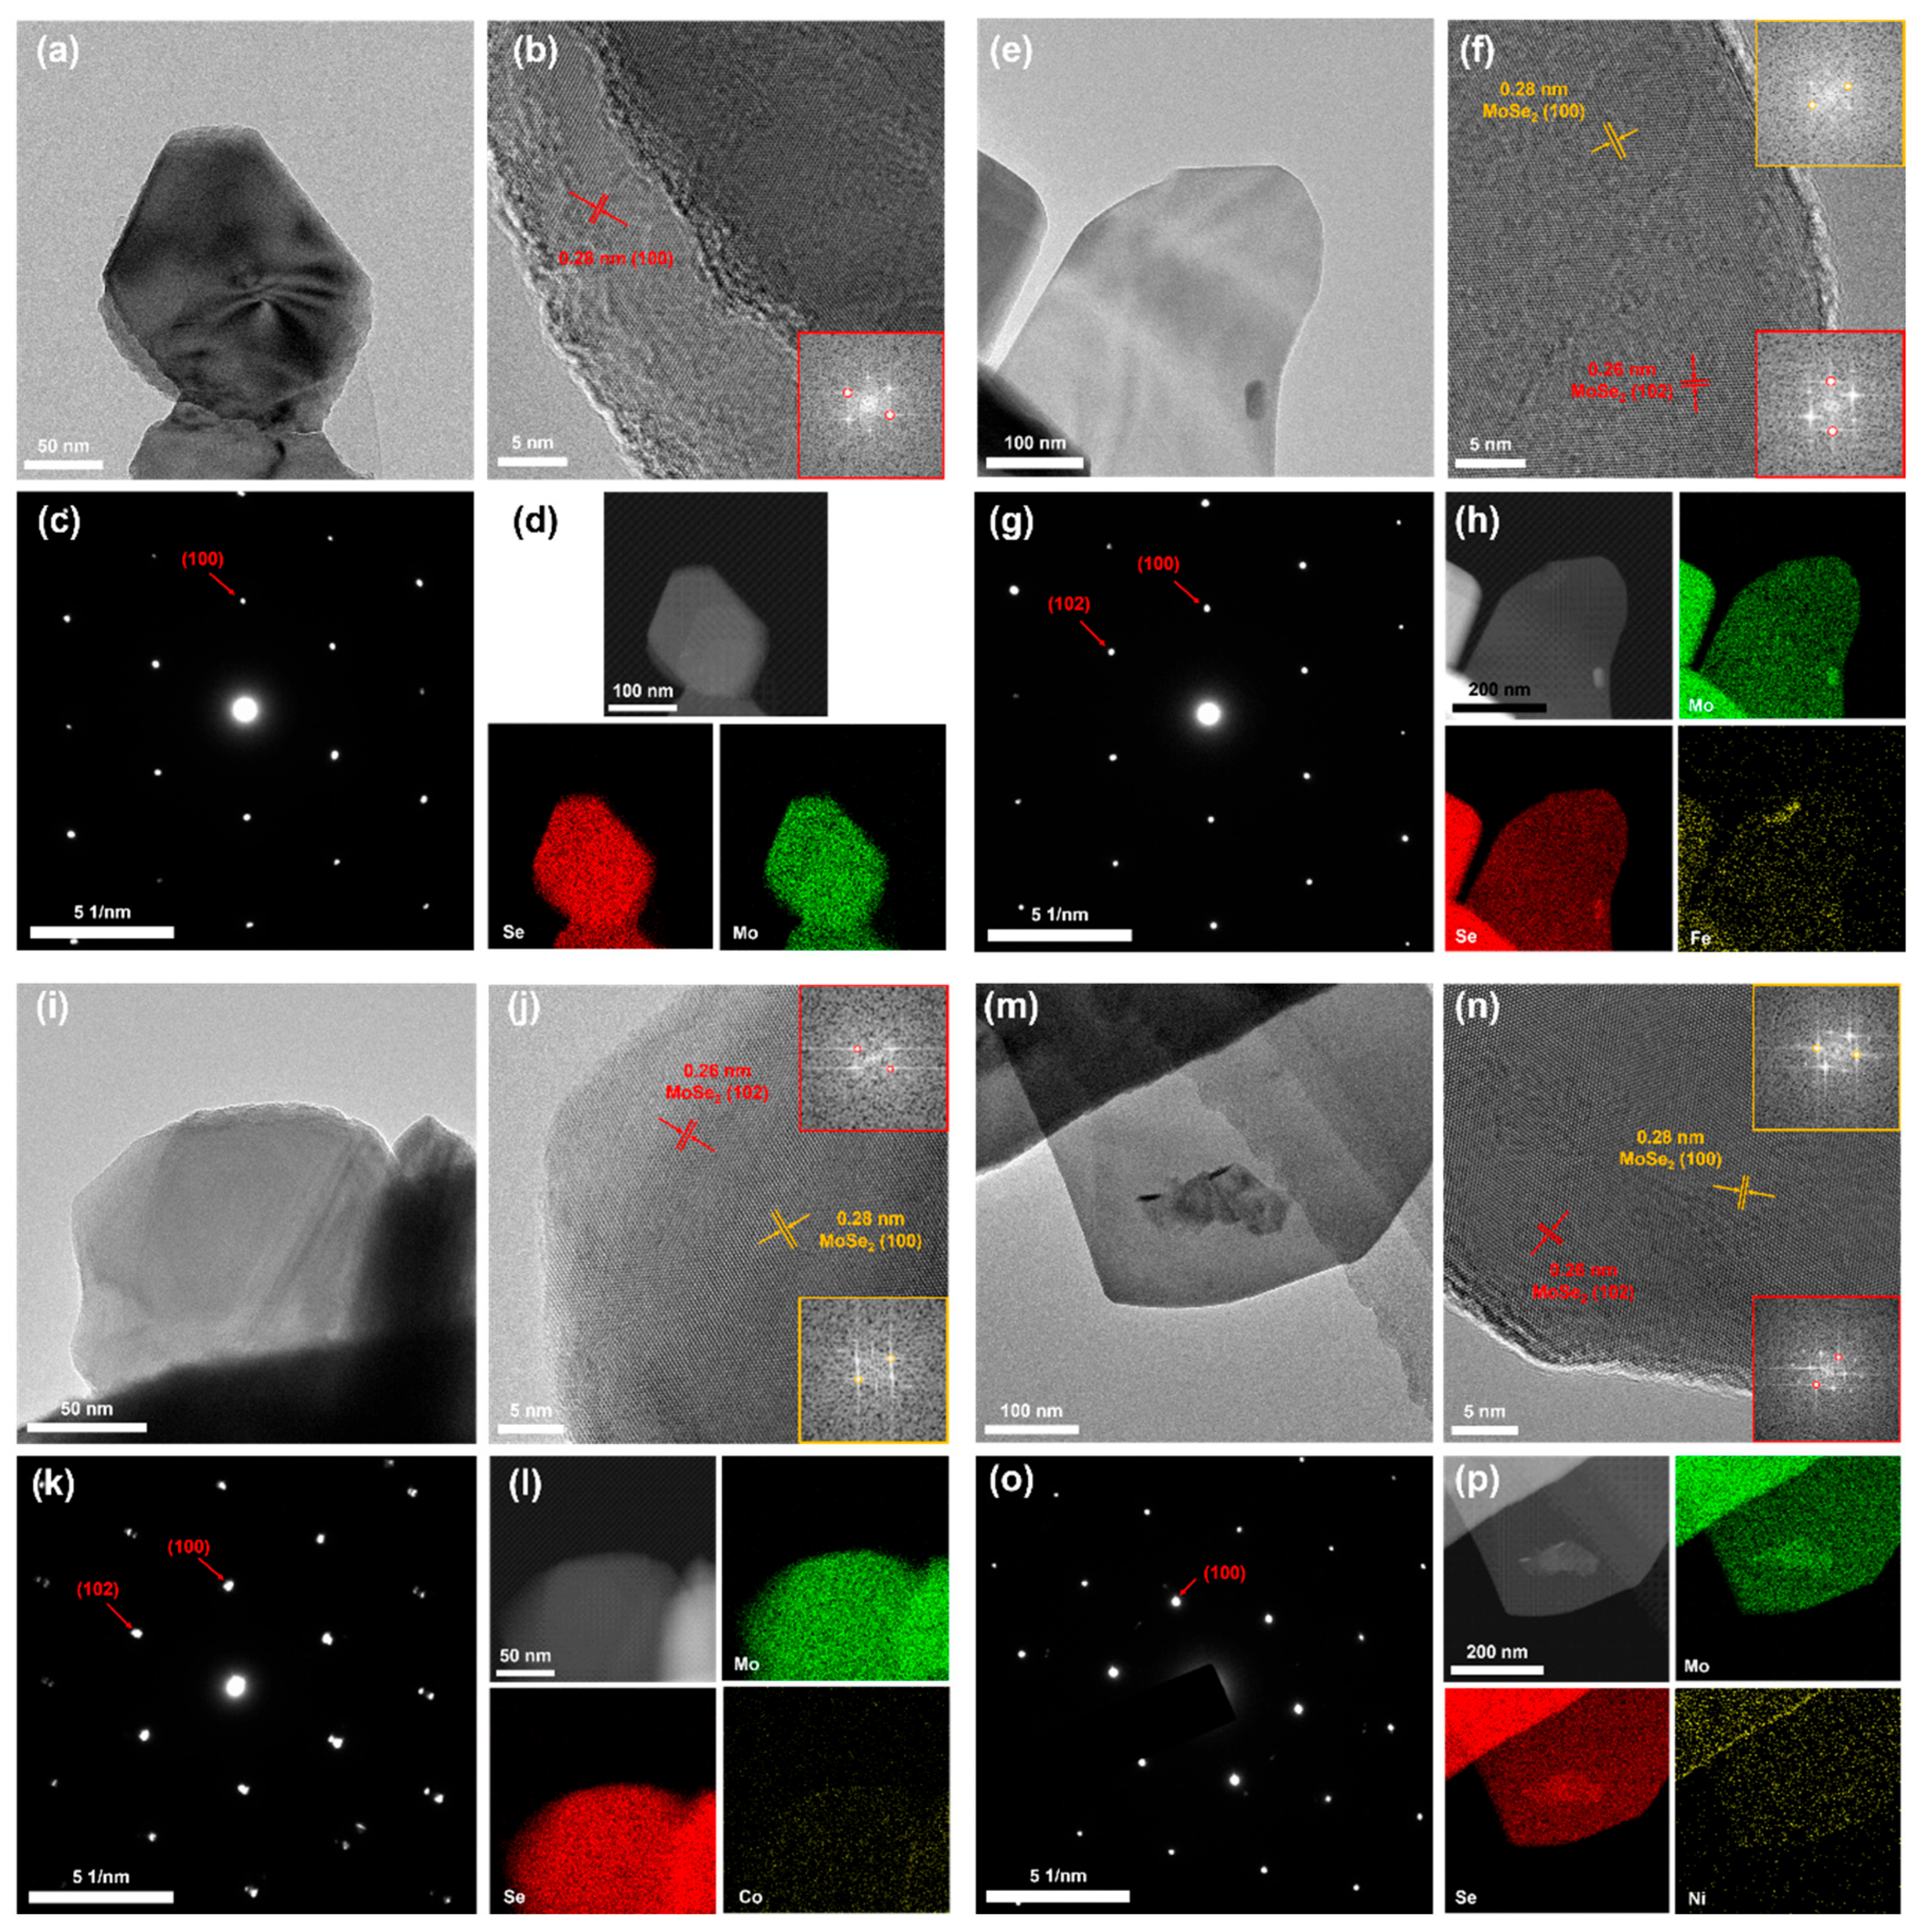
2.1. Morphology and Structure Analysis

Scanning electron microscopy (SEM) was used to systematically characterize the surface morphology of MoSe2 and its Fe-, Co-, and Ni-doped variants. As shown in Figure 1a, undoped MoSe2 exhibits a petal-like lamellar structure with interlaced layers, creating numerous edges and pores. In Figure 1b, Fe-doped MoSe2 reveals a denser lamellar arrangement, accompanied by additional nanometer-scale protrusions and defects. Compared to the Fe-doped sample, Co-doped MoSe2 (Figure 1c) displays larger grain sizes and a granular appearance, whereas Ni-doped MoSe2 (Figure 1d) exhibits a similar granular structure to the Co-doped sample, but with smoother surfaces and a more uniform particle distribution. These findings suggest that introducing Fe, Co, or Ni significantly impacts the original petal-like layers of MoSe2, producing denser and more regular lamellar or granular features. The film thicknesses of the pristine and doped MoSe2 sample are about 1–2 μm.
Figure 2 provides a detailed analysis of the microstructure of MoSe2 and its doped variants using high-resolution TEM (HRTEM), Selected area electron diffraction (SAED), and STEM-HAADF. Figure 2a,b show the HRTEM images of undoped MoSe2, displaying clear lattice fringes with a lattice spacing of approximately 0.28 nm, corresponding to the (100) plane of MoSe2. The Fast Fourier Transform (FFT) images within the red box further confirm the single-crystal nature of MoSe2. Figure 2c presents the SAED pattern of MoSe2, displaying a set of hexagonally arranged diffraction spots, indicating the presence of a well-ordered single-crystal structure. Figure 2d shows the STEM-HAADF image and its elemental distribution map of MoSe2, demonstrating that Mo and Se are evenly distributed throughout the sample, confirming the uniformity of the MoSe2 structure.
Figure 2e,f depict the HRTEM images of Fe-doped MoSe2, with lattice spacings of 0.28 nm (corresponding to the MoSe2 (100) plane) and 0.26 nm (corresponding to the MoSe2 (102) plane). Figure 2g shows the corresponding SAED pattern, with diffraction spots arranged in a hexagonal pattern, confirming that the sample retains its single-crystal characteristics. Figure 2h presents the STEM-HAADF image and elemental distribution map of Fe-doped MoSe2, where Fe is uniformly distributed within MoSe2 without observable aggregation, suggesting that Fe has been successfully incorporated into MoSe2 and may introduce additional defects and active sites, which could enhance its electrocatalytic performance.
Figure 2i,j show the HRTEM images of Co-doped MoSe2, with lattice fringe spacings similar to those of the Fe-doped samples. The FFT images indicate that the single-crystal structure of MoSe2 remains intact after Co incorporation. Figure 2k shows the SAED pattern of Co-doped MoSe2, suggesting that Co doping does not significantly alter the single-crystal structure of MoSe2. Figure 2l shows the STEM-HAADF image and elemental distribution map of Co-doped MoSe2, where Co is evenly distributed, which may further increase the number of catalytic active sites, thereby enhancing the electrocatalytic performance.
Figure 2m,n depict the HRTEM images of Ni-doped MoSe2, exhibiting lattice fringes similar to those of the Fe and Co-doped samples, indicating that the crystal structure of MoSe2 remains largely unchanged after Ni doping. The FFT image is basically unchanged. Figure 2o shows the SAED pattern of Ni-doped MoSe2, with regular diffraction spots, further confirming that the single-crystal structure of MoSe2 is preserved after Ni doping. Figure 2p presents the STEM-HAADF image and elemental distribution map of Ni-doped MoSe2, where Ni is uniformly distributed, providing additional active sites that may enhance its electrocatalytic performance.

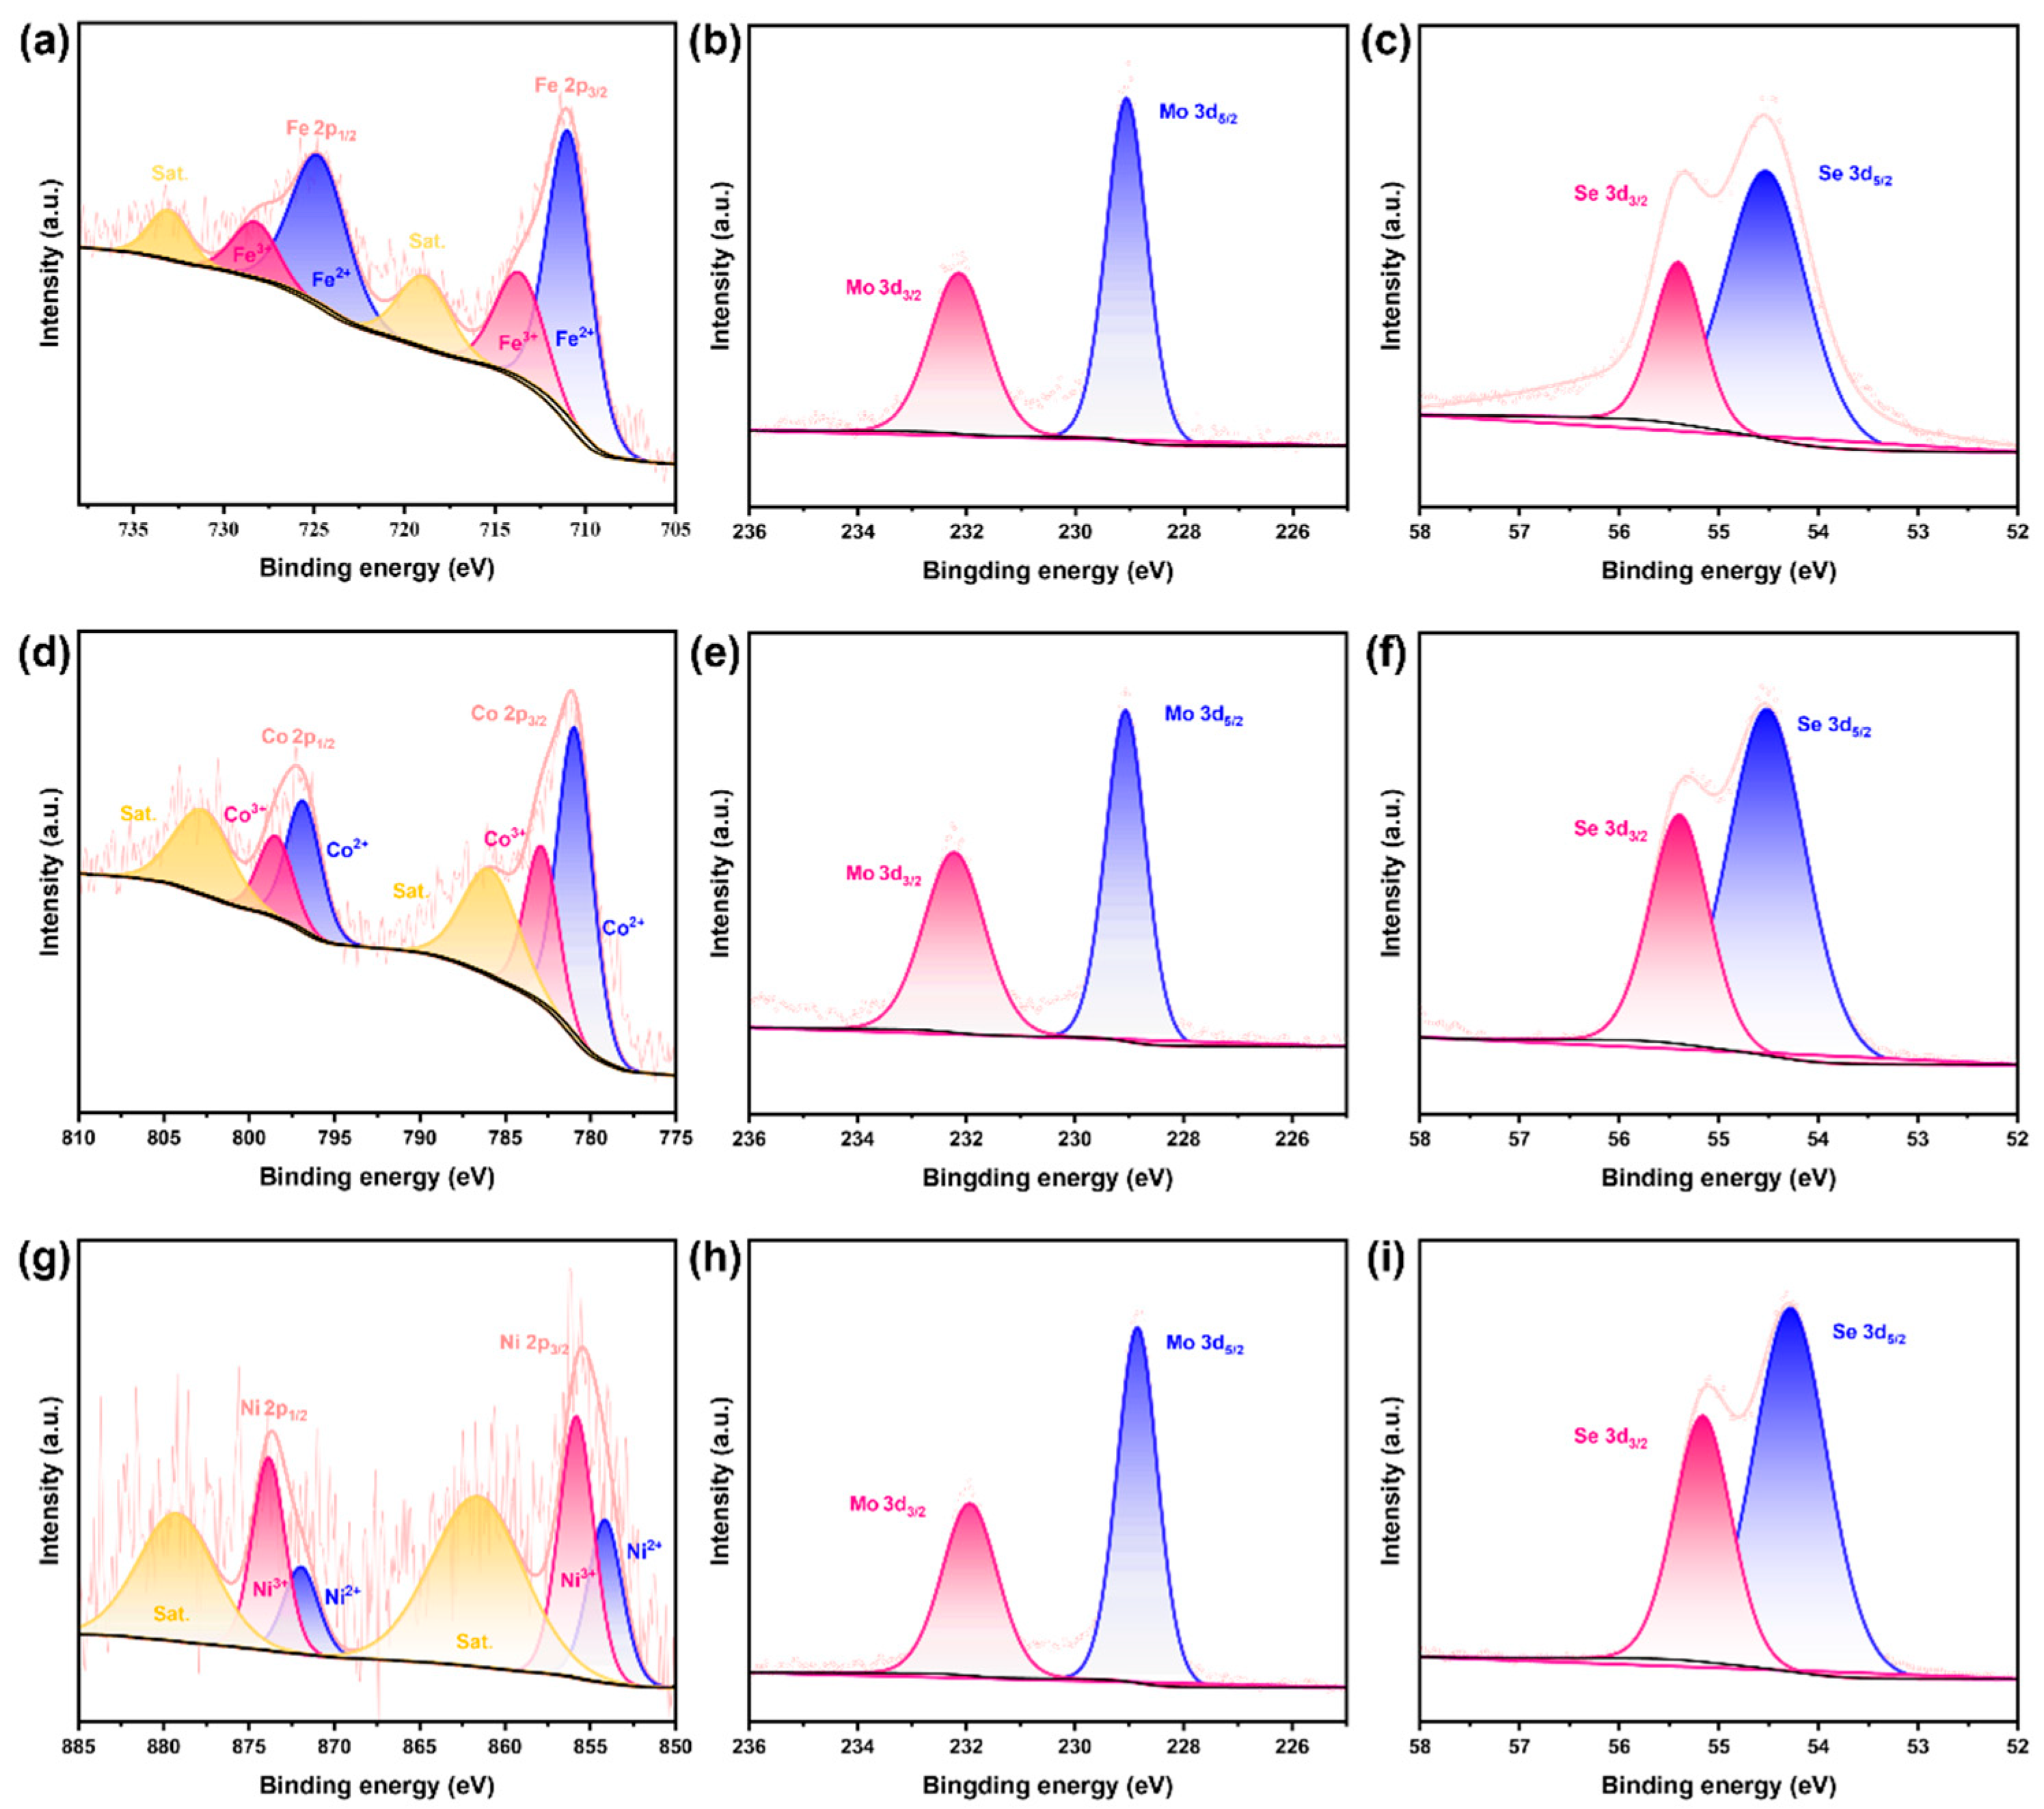
2.2. Component Analysis

XPS analysis was conducted for Fe-doped MoSe2. As shown in Figure 3a, the XPS analysis of Fe reveals that the Fe 2p spectrum exhibits remarkable splitting characteristics. The Fe 2p3/2 peak presents two main peaks at approximately 710.5 eV and 713.2 eV. The peaks are at approximately 723.9 eV and 727.0 eV in the Fe 2p1/2 spectrum. The XPS spectrum of Fe 2p3/2 and Fe 2p1/2 at 710.5 eV and 723.9 eV correspond to the Fe2+ state, and the XPS spectrum of Fe 2p3/2 and Fe 2p1/2 at 713.2 eV and 727.0 eV correspond to the Fe3+ state. Moreover, the shake-up satellite peaks near approximately 718 eV and 733 eV, typical features of Fe3+, further confirm the presence of Fe3+ in the sample. Collectively, Fe in the sample primarily appears in the Fe2+ state, with a lesser fraction of Fe3+, resulting in a mixed valence environment. This valence state distribution is attributed to the partial cleavage of Fe-Se bonds during the preparation process, leading to the oxidation of Fe atoms, which is highly likely to have a significant impact on the electrochemical and catalytic properties of the sample.
As depicted in Figure 3d, analysis of the Co XPS spectrum shows that both the Co 2p3/2 and Co 2p1/2 peaks are split. The Co 2p3/2 peaks at approximately 781.0 eV and 782.7 eV, as well as the Co 2p1/2 peaks at approximately 797.0 eV and 798.5 eV, correspond to Co2+ and Co3+, respectively. Meanwhile, the typical Co2+ shake-up satellite peaks near approximately 786.5 eV and 803.0 eV indicate that Co in the sample mainly exists in a mixed valence state of Co2+ and Co3+, with Co2+ being dominant. This strongly demonstrates that Co has been successfully incorporated into the MoSe2 lattice to form Co-Se bonds, a structure that plays a crucial role in maintaining material stability and regulating its electronic properties.
As shown in Figure 3g, regarding the XPS analysis of Ni, the splitting features of the Ni 2p3/2 and Ni 2p1/2 peaks indicate that the Ni 2p3/2 peaks at approximately 854.0 eV and 855.5 eV, along with the Ni 2p1/2 peaks at approximately 872.0 eV and 874.2 eV, correspond to Ni2+ and Ni3+, respectively. The shake-up satellite peaks at 861.7 eV and 879.5 eV are consistent with the coordination environment of Ni2+. The Ni in the sample mainly exists in a mixed valence state of Ni3+ and Ni2+, and Ni3+ is the main one. This implies that the partial oxidation of Ni occurred during the preparation process, accompanied by changes in the Ni-Se structure, which may significantly influence the electrochemical and catalytic properties of the sample.
Notably, as illustrated in Figure 3b,e,h for Mo 3d and Figure 3c,f,i for Se 3d, the XPS spectra of Mo 3d and Se 3d show that, regardless of Fe, Co, or Ni doping, the Mo 3d5/2 peak remains at 229.5 eV, the Mo 3d3/2 peak at 232.5 eV, and the Se 3d5/2 and Se 3d3/2 peaks at 54.5 eV and 55.5 eV, respectively. This clearly indicates that the doping process has a minimal effect on the chemical states of Mo and Se, and that the Mo-Se skeleton structure of MoSe2 remains highly stable. Additionally, quantitative analysis results show that the contents of Fe, Co, and Ni are 9.01%, 5.44%, and 2.24%, respectively, further confirming the successful implementation of the doping process.

2.3. Optical and Crystal Structure Analysis

Additionally, the Raman scattering spectra and XRD patterns of both doped and undoped MoSe2 provide insights into the effects of doping on the material’s structure and vibrational modes.
Figure 4a shows the Raman spectra of Fe/Co/Ni-MoSe2 and MoSe2. Undoped MoSe2 exhibits two main Raman active peaks at approximately 238 cm−1 (E2g) and 285 cm−1 (A1g), corresponding to the interlayer vibrational mode (E2g) and the in-plane vibrational mode (A1g) of MoSe2. These peaks indicate the well-defined layered structure of MoSe2. For the Fe-, Co-, and Ni-doped MoSe2 samples, the shapes and positions of the E2g and A1g peaks undergo slight shifts towards lower frequencies, suggesting that doping has caused minor changes in the lattice. Particularly, Co-doped MoSe2 shows a slight splitting of the E2g peak, possibly due to lattice stress and distortion after Co incorporation. This splitting may result from local lattice deformation or dislocation introduced by Co, leading to subtle changes in the vibrational modes. Fe- and Ni-doped samples show similar peak shifts, but no obvious splitting like the Co-doped sample, indicating that Fe and Ni doping have a relatively smaller effect on the lattice.
The crystal structures of pristine and M-doped MoSe2 were investigated using XRD, as shown in Figure 4b. All samples exhibit dominant diffraction peaks corresponding to the hexagonal 2H-MoSe2 phase (JCPDS No.29-0914), including the characteristic (002) peak at ~13.7° (interlayer stacking), (100) peak at ~31.4°, and (110) peak at ~55.9°, confirming the retention of the layered structure after doping.
The sharp (002) peak with a full width at half maximum (FWHM) of ~0.3° correlates with the vertically aligned nanosheet morphology observed in SEM (Figure 1a–d). For the Fe-doped sample, the peaks at 32.5° and 43.4° are assigned to Fe7Se8, while for the Co-doped sample, the peaks at 34.4° and 51.9° correspond to CoSe2, and the peak at 45.7° is attributed to elemental Se. These results indicate that partial selenization of the metal dopants occurred during the reaction process. The broad peaks near 25° and 43° originate from the glassy carbon substrate, as verified by control experiments (Figure S1 of the Supplementary Materials).

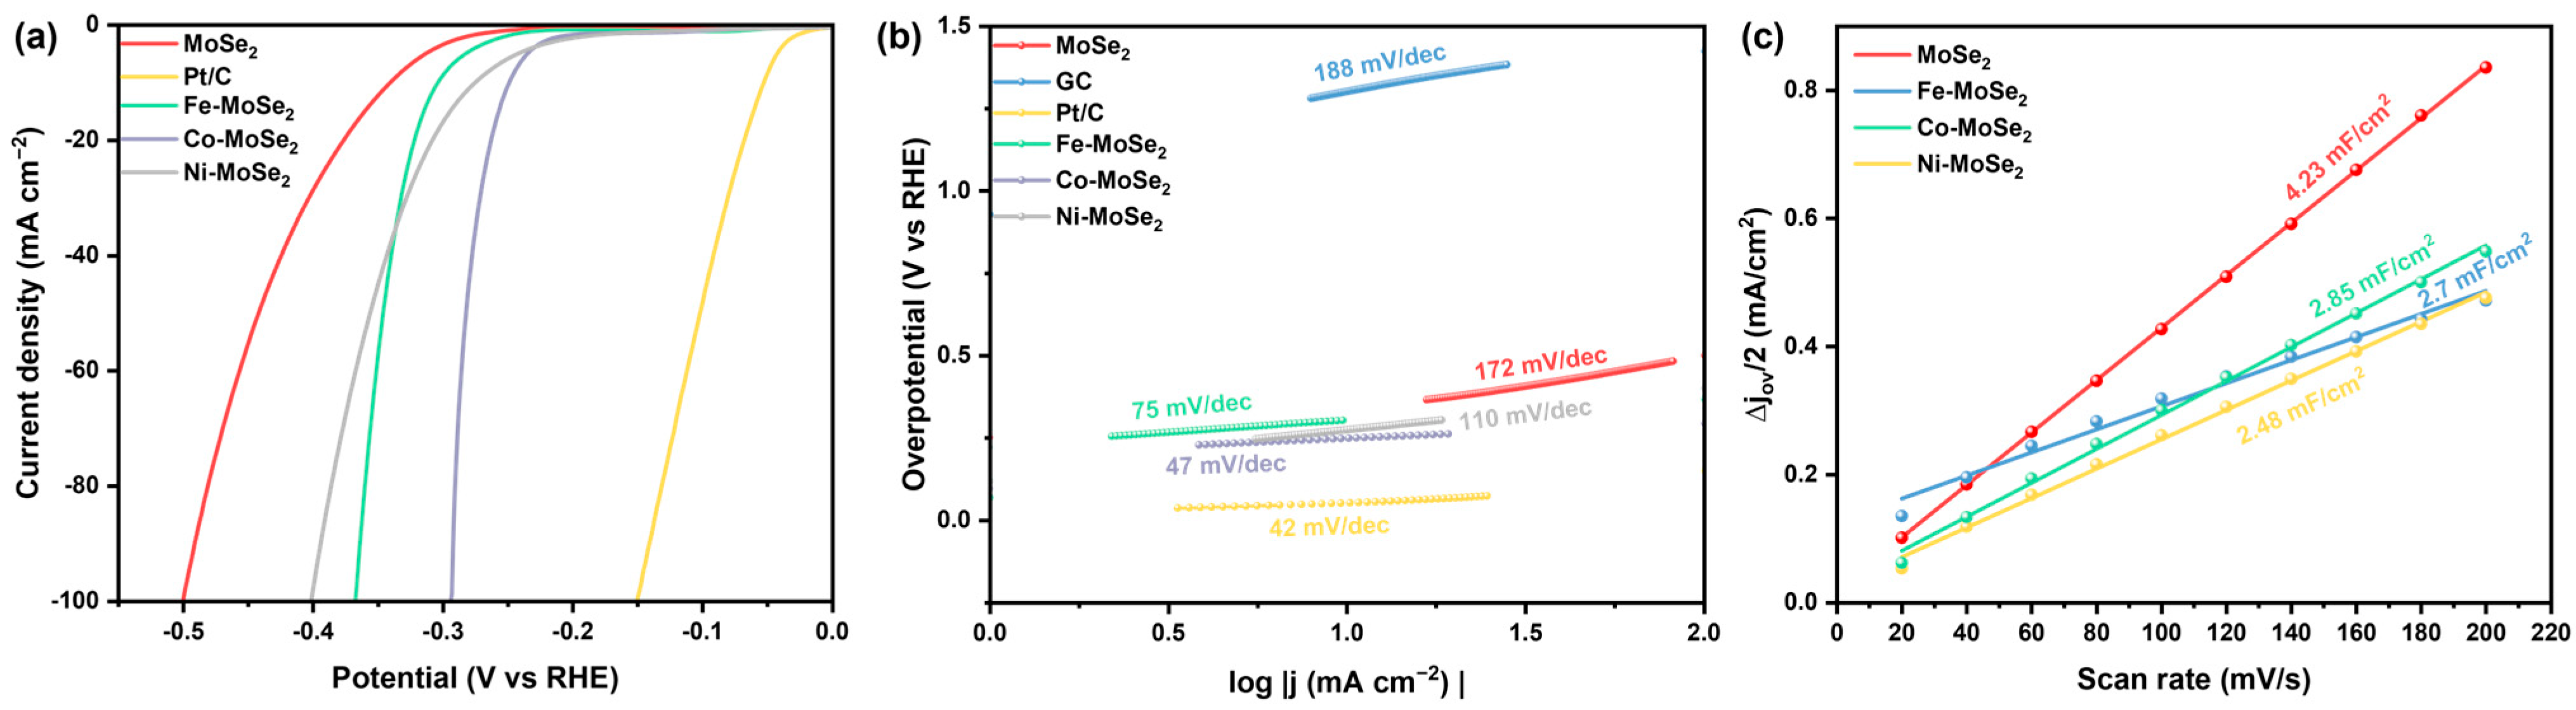
2.4. Electrochemical Characterization

The electrocatalytic performance of MoSe2, glassy carbon (GC), Pt/C, and Fe-/Co-/Ni-doped MoSe2 catalysts was evaluated through polarization curves, Tafel slopes, and double-layer capacitance (Cdl) calculations. As shown in Figure 5a, in 0.5 M H2SO4 solution, the polarization curves clearly show the HER activity of each catalyst: When the current density reaches 100 mA/cm2, Pt/C has the lowest overpotential (only requiring approximately −0.149 V), serving as a benchmark to exhibit excellent HER activity. Pure MoSe2 requires approximately −0.5 V, while Fe-MoSe2 (−0.367 V), Co-MoSe2 (−0.293 V), and Ni-MoSe2 (−0.401 V) show significantly reduced overpotentials compared with pure MoSe2. Among them, Co-MoSe2 has the most obvious reduction, indicating that doping elements effectively improve the electrocatalytic performance of MoSe2. The GC electrode has extremely weak catalytic performance due to its high overpotential of −1.424 V (Figure S2 of the Supplementary Materials). The overpotential of the Co-MoSe2 at 100 mA/cm2 is smaller than that of the previously reported Ni-MoSe2 catalyst [24]. Combined with the Tafel slopes in Figure 5b, Pt/C has the smallest slope (fastest charge transfer). Co-MoSe2 has a Tafel slope of 47 mV/dec (close to Pt/C), Ni-MoSe2 shows 110 mV/dec, and Fe-MoSe2 shows 75 mV/dec—all lower than pure MoSe2 (172 mV/dec), further indicating that doping optimizes the catalytic reaction kinetics. Additionally, to systematically explore the catalytic enhancement effects of Fe, Co, and Ni doping on MoSe2, FeSe2, CoSe2, and NiSe2 were synthesized in this study. Their electrocatalytic performance was evaluated via LSV. The results showed that the performance of these selenides was lower than that of pure MoSe2, thus ruling out the interference of selenides themselves on the catalytic performance. More details can be found in Figure S3 of the Supplementary Materials.
To thoroughly assess the electrochemical catalytic performance of our electrocatalysts and enable meaningful comparison with previous studies, we have compiled the catalytic properties of various MoX2-based catalysts in Table 1. Comparative analysis reveals that the Co-doped MoSe2 catalyst in this work demonstrates superior electrocatalytic performance, as manifested by its reduced overpotential and lower Tafel slope relative to other catalysts. For example, the reported Ni0.15Mo0.85Se2 catalyst requires an overpotential of 0.32 V to reach 90 mA/cm2 [25], whereas our Co-doped MoSe2 catalyst achieves a higher current density of 100 mA/cm2 at a lower overpotential of 0.29 V. The Co-doped MoSe2 catalyst also shows better performance than MoSe2 decorated with Co and Ni nanoparticles [26] and Fe-, Co-, and Ni-doped MoS2 [27]. While the Tafel slopes of Fe-, Co-, or Ni-doped MoS2 typically range from 66 to 94 mV/dec, our Co-doped MoSe2 exhibits a significantly lower Tafel slope of 47 mV/dec, indicating enhanced reaction kinetics. Compared with the graphene/MoSe2 composites reported previously [28], the Co-doped MoSe2 catalyst also exhibits a lower Tafel slope (80 vs. 47 mV/dec).
Table 1. The electrochemical catalytic performance of MoX2-based catalysts.
ElectrocatalystElectrolyteCurrent Density (mA cm−2)Overpotential (mV)Tafel Slope (mV dev−1)
Co-MoSe2 (this work)0.5 M H2SO410029347
Fe-MoSe2 (this work)0.5 M H2SO410036775
Ni-MoSe2 (this work)0.5 M H2SO4100401110
Ni-MoSe2 [24]1.0 M KOH5045596
MoSe2/carbon cloth [29]0.5 M H2SO42125076
60300
Ni0.15Mo0.85Se2 [25]0.5 M H2SO41018067
90~320
MoSe2@Co [26]1 M KOH10391109
MoSe2@Ni [26]1 M KOH10 367227
MoSe2@CoNi [26]1 M KOH10378170
graphene/MoSe2 [28]0.5 M H2SO4100~21080
Ni-MoS2 [27]0.5 M H2SO41030266
35~360
Co-MoS2 [27]0.5 M H2SO41035069
35~550
Fe-MoS2 [27]0.5 M H2SO41049094
35~700
Furthermore, this study analyzed the electrochemical active surface areas (ECSAs) of the catalysts. The ECSA was evaluated by Cdl using cyclic voltammetry (CV) at various scan rates in the potential range from 0 to 0.2 V versus RHE (Figure S4 of the Supplementary Materials). Typically, the ECSA is directly proportional to the Cdl of the electrode, expressed as ECSA = Cdl/Cs, where Cs represents the specific capacitance of the catalysts per unit area under identical electrolyte conditions. The specific capacitance typically falls within a reported range of 0.015–0.110 mF/cm2 in acidic solutions. The general specific capacitance of 0.035 mF/cm2 was used to estimate the ECSA in this work [30]. In Figure 5c, the ECSA values of Fe-/Co-/Ni-doped MoSe2 are 77.14, 70.86, and 81.43 cm2 respectively, slightly lower than that of pure MoSe2 (120.9 cm2). Consequently, while the ECSA is an important parameter for understanding electrocatalytic behavior, it may not be the predominant factor governing the enhanced HER performance of Fe-/Co-/Ni-doped MoSe2.

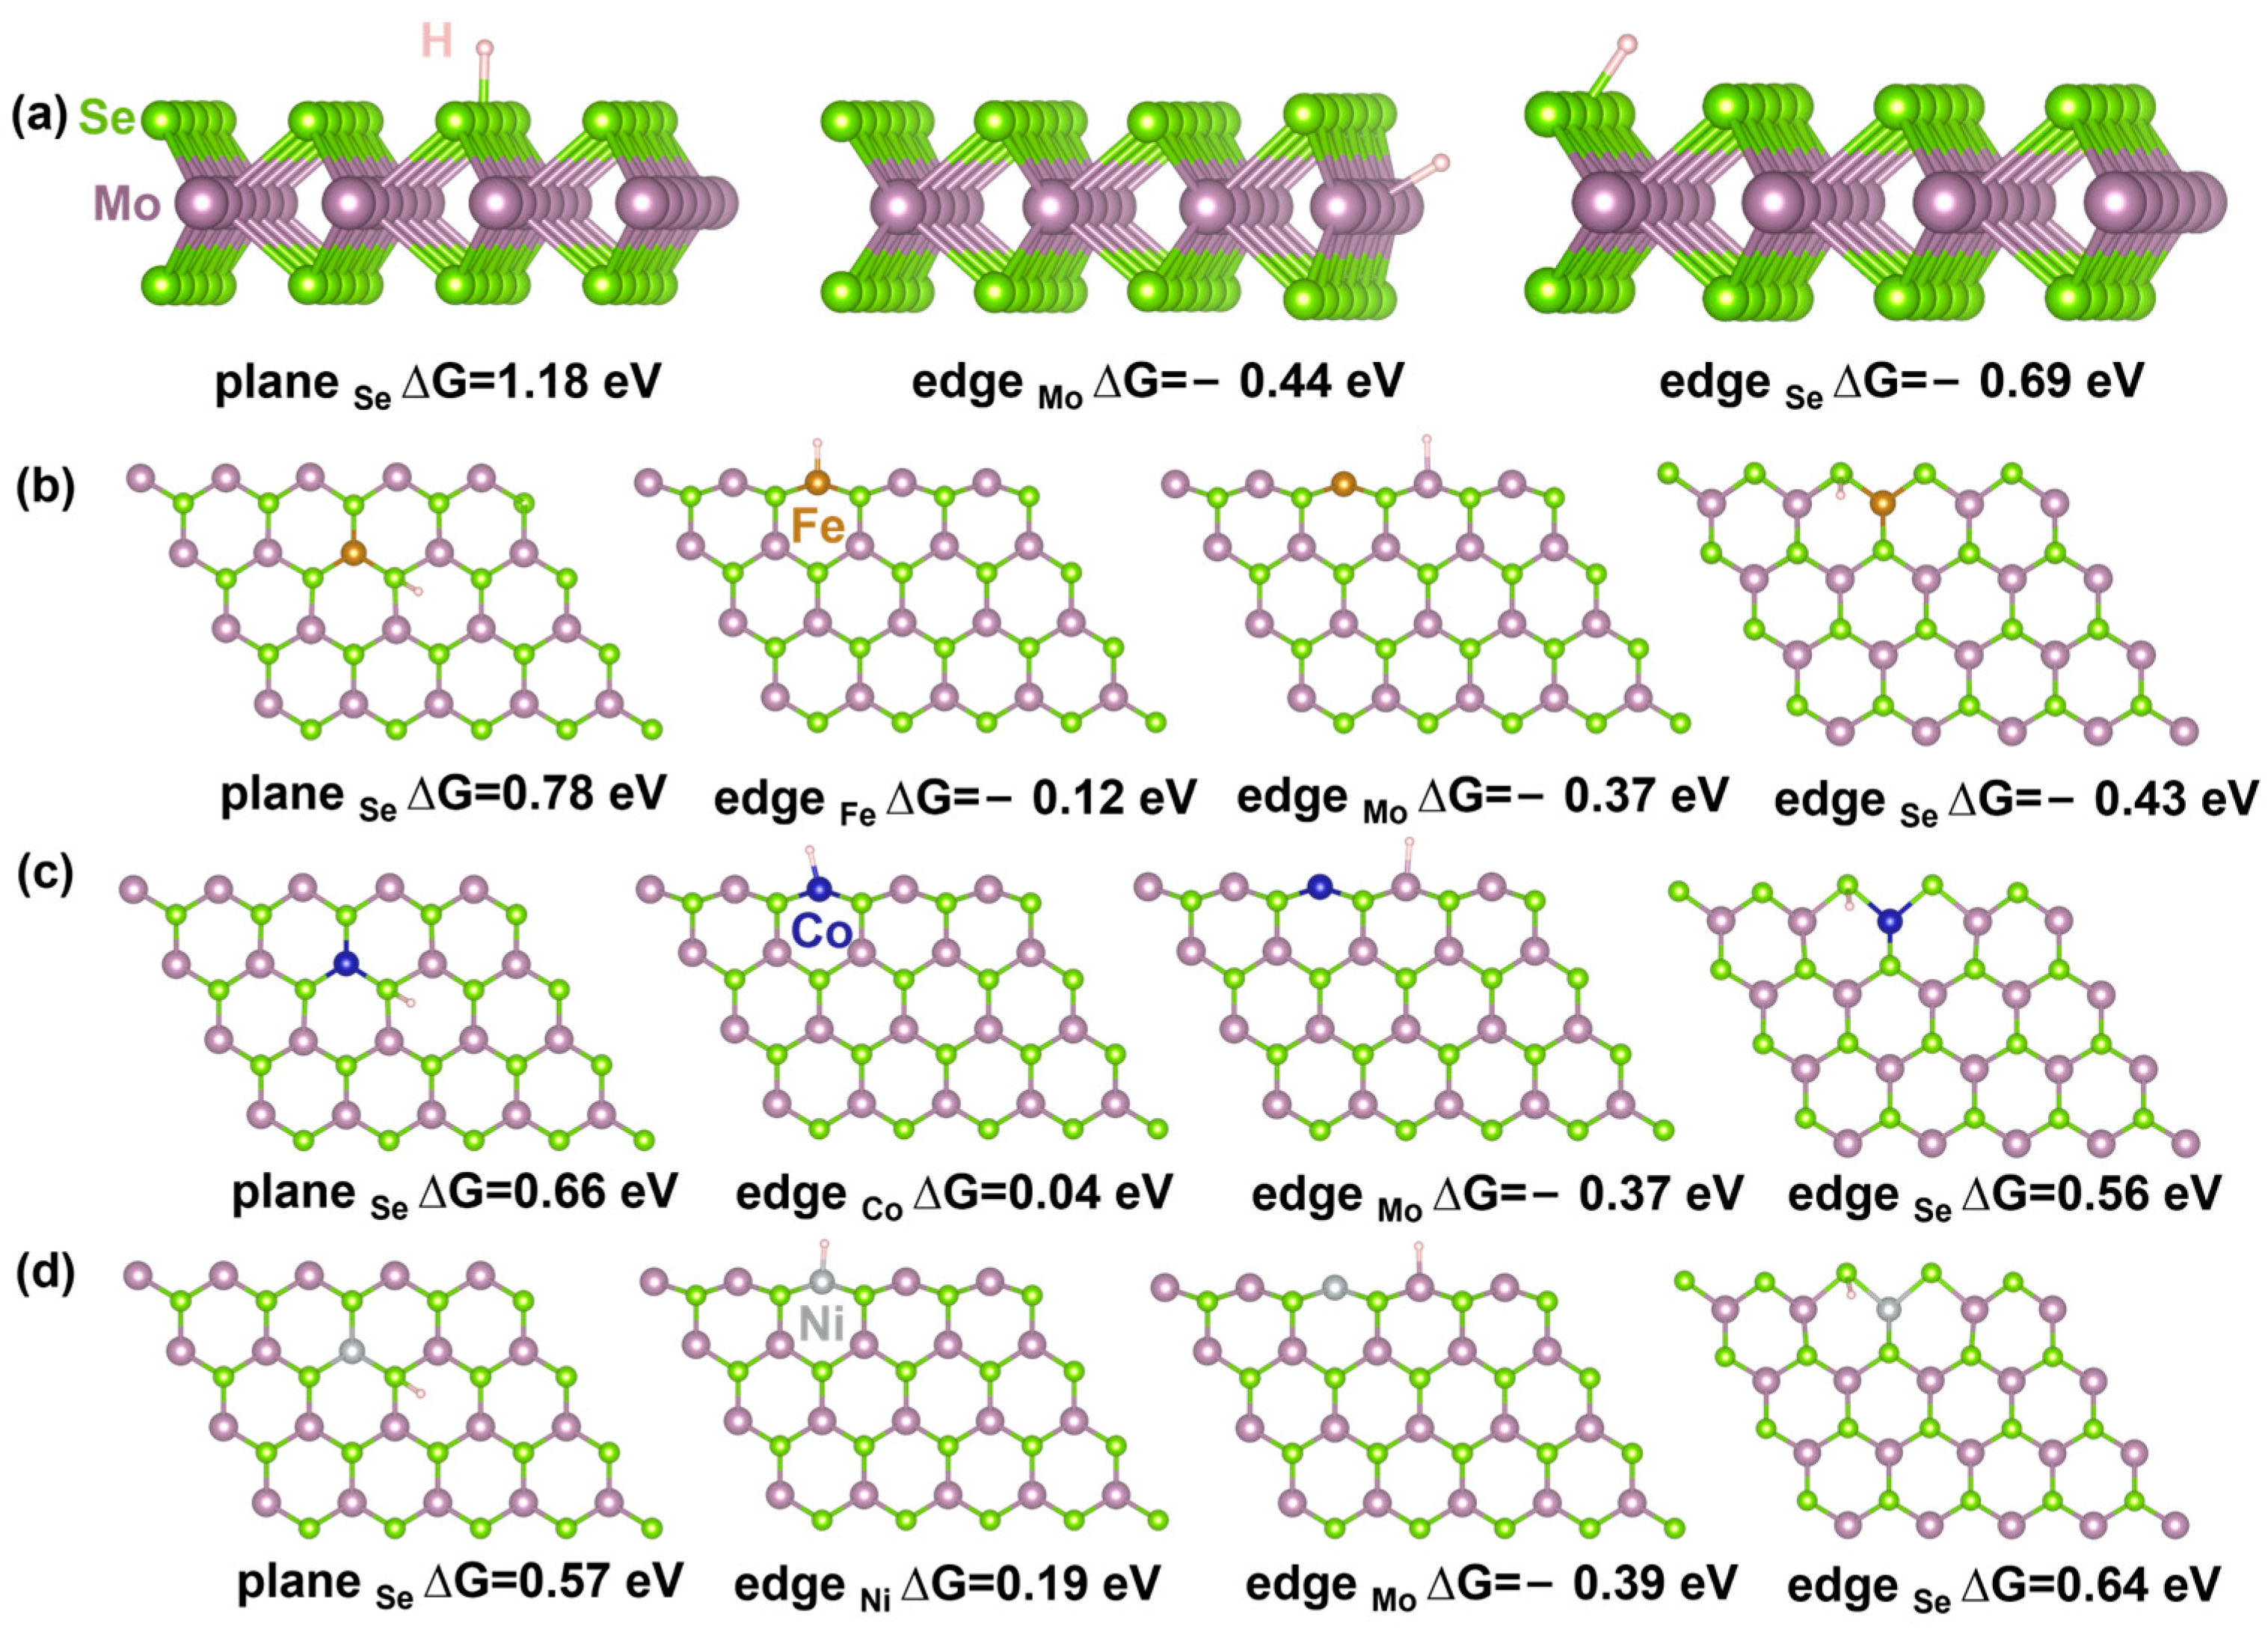
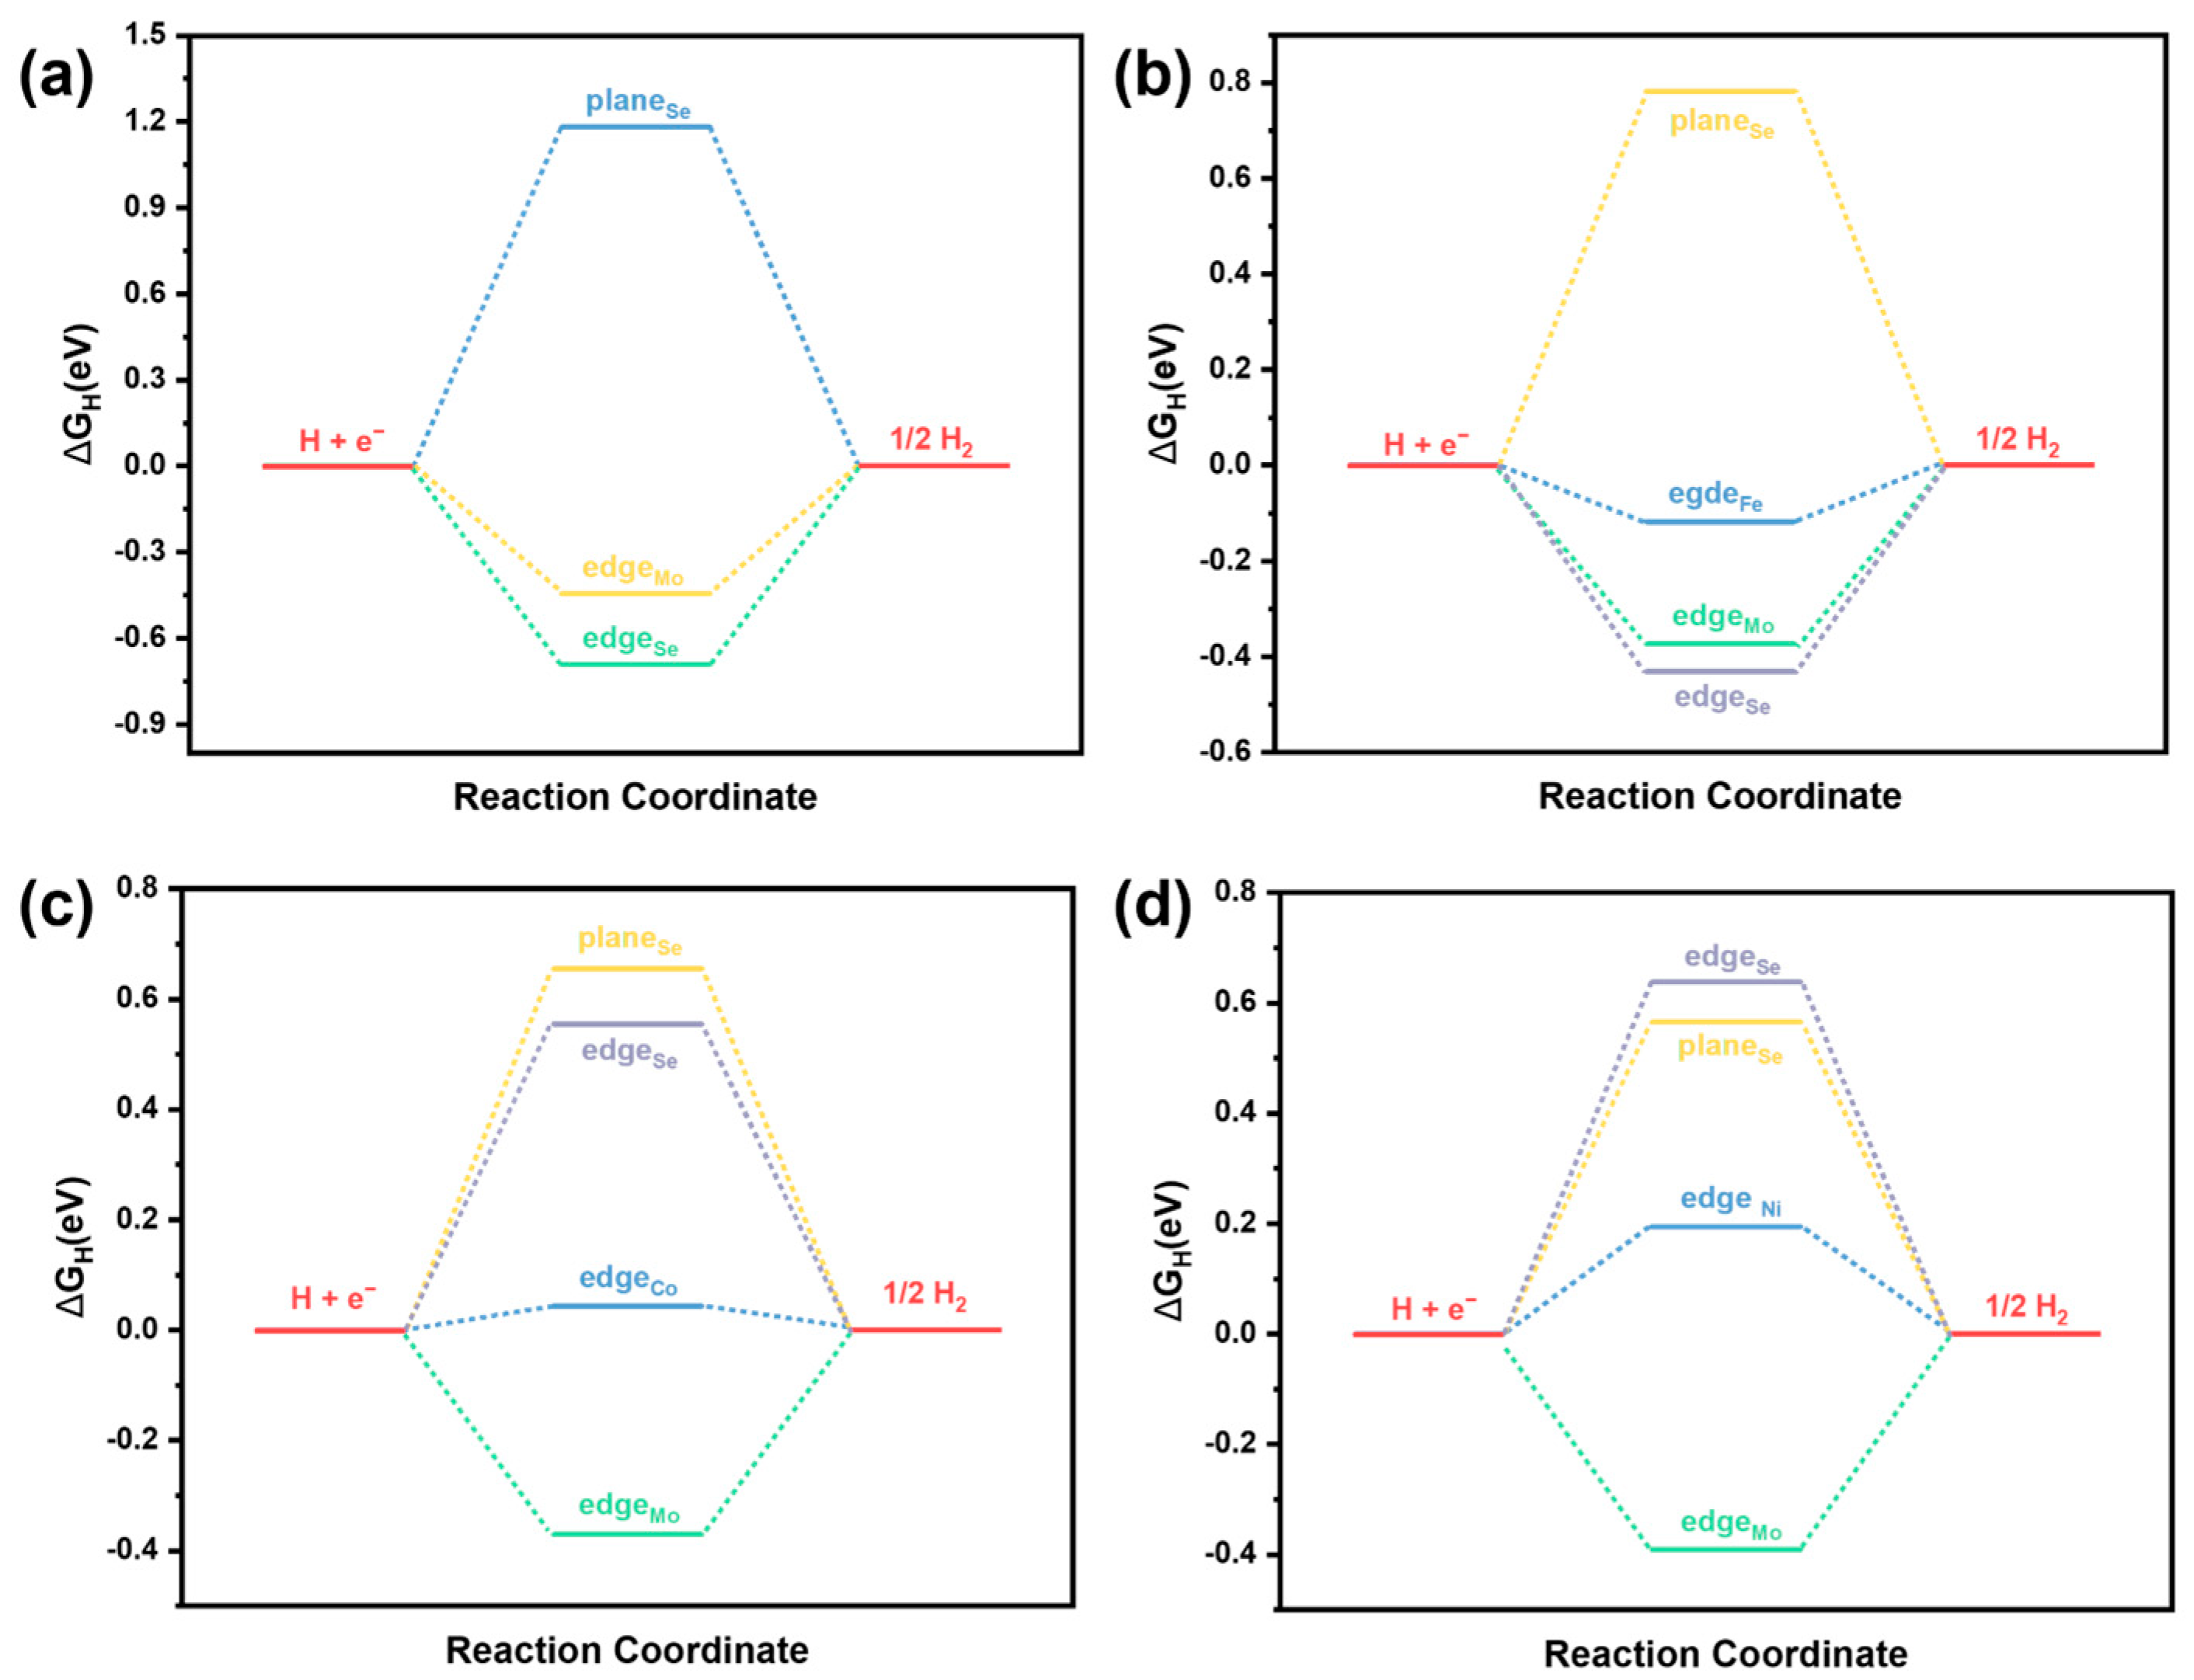
2.5. Theoretical Calculation

To gain deeper insights into the active sites of Fe-, Co-, and Ni-doped MoSe2 (M-MoSe2) in the HER, we performed density functional theory (DFT) calculations on Fe-MoSe2, Co-MoSe2, Ni-MoSe2, and pristine MoSe2. The catalytic activity was evaluated using the ΔGH, which reflects the hydrogen adsorption capability on the material surface. An effective HER catalyst typically exhibits a ΔGH value close to zero, indicating moderate hydrogen adsorption strength that facilitates efficient HER. A ΔGH that is too positive (weak adsorption) or too negative (strong adsorption) would hinder the reaction. Thus, the ideal HER catalyst should have ΔGH ≈ 0 eV.
In this study, we analyzed multiple potential hydrogen adsorption sites on M-MoSe2, including basal plane Se sites (plane Se), metallic edge Mo sites (edge Mo), and non-metallic edge M/Se sites (edge M/edge Se). For comparison, we also calculated hydrogen adsorption on pristine MoSe2 at basal plane Se sites (plane Se), metallic edge Mo sites (edge Mo), and non-metallic edge Se sites (edge Se). The optimized structure is shown in Figure 6, and the calculated ΔG value is shown in Figure 7.
For pristine MoSe2, the ΔG values for hydrogen adsorption at basal plane Se sites, metallic edge Mo sites, and non-metallic edge Se sites are 1.18, −0.44, and −0.69 eV, respectively. Upon Fe doping, the ΔG value at basal plane Se sites decreases to 0.78 eV, while the metallic edge Mo sites show a ΔG of −0.37 eV; notably, the edge Fe site exhibits a significantly lower ΔG of −0.12 eV, and the adjacent edge Se site is −0.43 eV. With Co doping, the ΔG at basal plane Se sites is further reduced to 0.66 eV, the metallic edge Mo site remains at −0.37 eV, and the edge Co site approaches a near-ideal ΔG of 0.04 eV, with adjacent edge Se sites at 0.56 eV. In the Ni-doped sample, the ΔG values are 0.57 eV (basal plane Se), −0.39 eV (metallic edge Mo), and 0.19 eV (edge Ni), while the adjacent edge Se sites near Ni exhibit a ΔG of 0.64 eV. Overall, these findings suggest that doping MoSe2 with transition metals can optimize hydrogen adsorption and thus improve its electrocatalytic performance.

3. Experimental

3.1. Sample Preparation

Fe-, Co-, and Ni-doped MoSe2 were synthesized using the chemical vapor deposition method (Figure 8a). Initially, a 1 cm × 1 cm GC was sonicated in distilled water and ethanol for 10 min each to remove surface impurities. The precursor solution was prepared as follows: (NH4)6Mo7O24·4H2O was dissolved in 1 mL of water to obtain a 0.0121 mol/L solution, which contained approximately 8.16 mg Mo per mL. For doping purposes, FeCl2 (0.146 mol/L, ~8.16 mg Fe/mL), CoCl2·6H2O (0.139 mol/L, ~8.16 mg Co/mL), and NiCl2 (0.139 mol/L, ~8.16 mg Ni/mL) were each dissolved in 1 mL of deionized water. Approximately 4–5 drops (equivalent to ~0.200–0.250 mL) of the precursor solution were uniformly drop-cast onto the surface of a pre-cleaned 1 cm × 1 cm GC, forming a full surface coverage. The sample was then dried at 60 °C for 1 h.
The dried GC substrate was placed on the right side of a tube furnace, with 75 mg of Se powder placed in a porcelain boat on the left side as the Se source (Figure 8b). During the experiment, the temperatures on both sides were raised simultaneously, with the left side reaching 500 °C and the right side reaching 800 °C over a 40 min heating period. Ar gas was introduced at a flow rate of 100 sccm. Once the target temperatures were reached, the samples were kept at these temperatures for 15 min, while the atmosphere was adjusted to a 100 sccm Ar/H2 gas mixture (9:1). Afterward, the heating system was turned off, and the samples were allowed to cool naturally to room temperature, yielding Fe-, Co-, and Ni-doped MoSe2 nanomaterials. To evaluate the impact of doping on the electrocatalytic performance of MoSe2, undoped MoSe2 was synthesized under the same conditions and compared with the doped samples.

3.2. Characterization Methods

Various techniques were employed to systematically analyze the materials. A Hitachi SU-8010 scanning electron microscope (manufactured by Hitachi High-Tech Corporation, Tokyo, Japan) was used to examine the surface morphology, while a JEOL F200 transmission electron microscope (200 kV, equipped with an Oxford X-MaxN 80T IE250 EDS; manufactured by JEOL Ltd., Tokyo, Japan) utilized DigitalMicrograph 3.5 software for image processing and data analysis, providing insights into the microstructure and lattice fringes. The crystal structure was assessed via X-ray diffraction using Cu Kα radiation (λ = 1.5406 Å) with a Shimadzu XRD-7000 X-ray diffractometer (manufactured by Shimadzu Corporation, Kyoto, Japan), and the data was processed with Origin 2022 software. The Raman spectra were acquired on a Horiba Xplora spectrometer (manufactured by Horiba Scientific, Kyoto, Japan) with a 532 nm laser source, and the spectral data was analyzed using LabSpec 6.3 software. Furthermore, X-ray photoelectron spectroscopy was performed on a Thermo Scientific K-Alpha instrument (manufactured by Thermo Fisher Scientific Inc., Waltham, MA, USA), and the elemental composition and chemical states of the samples were determined through Avantage 5.9 software.

3.3. Electrochemical Measurements

Electrochemical tests were performed using a CHI660E electrochemical work station (manufactured by Shanghai Chenhua Instrument Co., Ltd., Shanghai, China). GC electrodes loaded with Fe-, Co-, and Ni-doped MoSe2 catalysts were used as the working electrodes, with Ag/AgCl and Pt electrodes serving as the reference and counter electrodes, respectively. All potentials were referenced to the reversible hydrogen electrode (RHE), calculated using the following formula: ERHE = E(Ag/AgCl) + 0.059 pH + 0.197 V. LSV was carried out in a 0.5 M H2SO4 solution at a scan rate of 50 mV/s, with a 95% ohmic drop (IR) correction applied to all results. The Tafel slope, derived from the LSV curves, was used to evaluate the electrocatalytic reaction kinetics. Additionally, CV was performed in the potential range of 0–0.2 V vs. RHE at various scan rates (20–200 mV/s) to determine the double-layer capacitance.

3.4. Computational Details

First-principle calculations based on DFT were performed using the Vienna Ab initio Simulation Package (VASP) [31,32,33]. The exchange–correlation interactions were described by the Perdew–Burke–Ernzerhof (PBE) [34] functional within the generalized gradient approximation (GGA). For structural optimization, the energy change, maximum force, and maximum displacement convergence criteria were set to 2.0 × 10⁻⁵ Ha, 0.004 Ha Å−1, and 0.005 Å, respectively. A 3 × 3 × 1 k-point grid based on the Monkhorst–Pack scheme was used for Brillouin zone integration. The plane wave cutoff energy in VASP was set to 400 eV, and spin polarization effects were included in all calculations. Structural optimizations continued until the residual forces on each atom were reduced to less than 0.01 eV/Å.
To evaluate the catalytic activity of Fe-/Co-/Ni-doped MoSe2 for the HER, we calculated the hydrogen adsorption energy ( E H ) at different active sites, defined as follows:
E H = E A E P 0.5 E H 2
where E A represents the energy of the catalyst with a single hydrogen atom adsorbed, E P is the energy of the pristine catalyst, and E H 2 is the energy of a hydrogen molecule in the gas phase.
To further assess the hydrogen adsorption thermodynamics, we incorporated zero-point energy ( E Z P E ) and entropy ( S ) corrections to determine the Gibbs free energy of hydrogen adsorption ( G H ), calculated as follows:
G H = E H + E Z P E T S
where T is the temperature (set to 298.15 K). These calculations provide insights into how Fe, Co, and Ni doping influence the hydrogen adsorption properties of MoSe2, potentially enhancing its catalytic performance for HER.

4. Conclusions

We successfully synthesized Fe-, Co-, and Ni-doped MoSe2 via CVD and systematically investigated their morphology, structure, and electrocatalytic performance. The results demonstrate that doping elements not only significantly altered the morphology of MoSe2, but also enhanced its HER performance by introducing defects and optimizing the electronic structure. DFT calculations further confirmed that metal doping effectively reduces ΔG at active sites and enhances catalytic activity. Among the doped samples, Co-doped MoSe2 exhibited the best catalytic activity, with an onset overpotential of 0.293 mV at 100 mA/cm−2 and a Tafel slope of 47 mV/dec. This study provides new insights into the application of transition metal-doped MoSe2 in electrocatalysis.

Supplementary Materials

The following supporting information can be downloaded at: https://www.mdpi.com/article/10.3390/inorganics13050155/s1. Figure S1: XRD patterns of GC, Fe/Co/Ni-MoSe2, and MoSe2. Figure S2: Polarization curves of MoSe2, GC, Pt/C, and Fe/Co/Ni-MoSe2 catalysts. Figure S3: Polarization curves of (a) MoSe2, Fe-MoSe2, and FeSe2 catalysts, (b) MoSe2, Co-MoSe2, and CoSe2 catalysts, (c) MoSe2, Ni-MoSe2, and NiSe2 catalysts. Figure S4: CV curves of MoSe2 (a), Fe-MoSe2 (b), Co-MoSe2 (c), and Ni-MoSe2 (d) at various scan rates (20 mV s−1, 40 mV s−1, 60 mV s−1, 80 mV s−1, 100 mV s−1, 120 mV s−1, 140 mV s−1, 160 mV s−1, 180 mV s−1, 200 mV s−1) in the potential range of 0~0.2 (vs. RHE).

Author Contributions

X.C.: investigation, data curation, formal analysis, writing—original draft preparation. X.Z.: data curation, software, formal analysis. J.Z.: methodology, data curation, resources. Z.W.: conceptualization, methodology, validation, writing—review and editing, visualization, supervision, project administration. All authors have read and agreed to the published version of the manuscript.

Funding

This research received no external funding.

Data Availability Statement

The original contributions presented in this study are included in the article and Supplementary Materials. Further inquiries can be directed to the corresponding author.

Acknowledgments

Resources supporting this work were provided by the Public Computing Cloud Platform of Renmin University of China. The authors thank the Office of Research Infrastructure of Renmin University of China for the laboratory facilities and technical support in sample characterization.

Conflicts of Interest

There are no conflicts of interest to declare.

References

  1. Qiao, D.; Yun, S.; Sun, M.L.; Dang, J.E.; Zhang, Y.W.; Yuan, S.X.; Yang, G.P.; Yang, T.X.; Gao, Z.; Wang, Z.G. 1D/3D Trepang-Like N-Modified Carbon Confined Bimetal Carbides and Metal Cobalt: Boosting Electron Transfer via Dual Mott-Schottky Heterojunctions Triggered Built-In Electric Fields for Efficient Hydrogen Evolution and Tri-Iodide Reduction. Appl. Catal. B Environ. 2023, 334, 122830. [Google Scholar] [CrossRef]
  2. Wang, L.Q.; Hao, Y.X.; Deng, L.M.; Hu, F.; Zhao, S.; Li, L.L.; Peng, S.J. Rapid Complete Reconfiguration Induced Actual Active Species for Industrial Hydrogen Evolution Reaction. Nat. Commun. 2022, 13, 5785. [Google Scholar] [CrossRef]
  3. Sarwar, S.; Ali, A.; Wang, Y.F.; Ahasan, M.R.; Wang, R.G.; Adamczyk, A.J.; Zhang, X.Y. Enhancement of Hydrogen Evolution Reaction Activity Using Metal–Rich Molybdenum Sulfotelluride with Graphene Support: A Combined Experimental and Computational Study. Nano Energy 2021, 90, 106599. [Google Scholar] [CrossRef]
  4. Zhang, Z.Y.; Tian, H.; Bian, L.; Liu, S.Z.; Liu, Y.; Wang, Z.L. Cu-Zn-Based Alloy/Oxide Interfaces for Enhanced Electroreduction of CO2 to C2+ Products. J. Energy Chem. 2023, 83, 90–97. [Google Scholar] [CrossRef]
  5. Wan, C.Z.; Zhang, Z.S.; Dong, J.C.; Xu, M.J.; Pu, H.T.; Baumann, D.; Lin, Z.Y.; Wang, S.B.; Huang, J.; Shah, A.H.; et al. Amorphous Nickel Hydroxide Shell Tailors Local Chemical Environment on Platinum Surface for Alkaline Hydrogen Evolution Reaction. Nat. Mater. 2023, 22, 1022–1029. [Google Scholar] [CrossRef]
  6. Zhang, J.S.; Zhang, X.L.; Shi, C.; Xia, G.Q.; Li, H.; Wang, P.; Di, L.B. Plasma Synthesis of Defect-Rich Flexible Carbon Cloth Decorated with PtRu Alloyed Nanoclusters for Highly Efficient pH-Universal Electrocatalytic Hydrogen Evolution. Nanoscale 2022, 14, 15942–15949. [Google Scholar] [CrossRef]
  7. Wang, Y.H.; Yun, S.N.; Shi, J.; Zhang, Y.W.; Dang, J.E.; Dang, C.W.; Liu, Z.L.; Deng, Y.Y.; Yang, T.X. Defect Engineering Tuning Electron Structure of Biphasic Tungsten-Based Chalcogenide Heterostructure Improves Its Catalytic Activity for Hydrogen Evolution and Triiodide Reduction. J. Colloid Interface Sci. 2022, 625, 800–816. [Google Scholar] [CrossRef]
  8. Da, P.F.; Zheng, Y.; Hu, Y.; Wu, Z.L.; Zhao, H.Y.; Wei, Y.C.; Guo, L.C.; Wang, J.J.; Wei, Y.P.; Xi, S.B.; et al. Synthesis of Bandgap-Tunable Transition Metal Sulfides through Gas-Phase Cation Exchange-Induced Topological Transformation. Angew. Chem. Int. Ed. 2023, 62, e202301802. [Google Scholar] [CrossRef]
  9. Chen, X.Y.; Han, Z.; Zhang, B.; Sun, B.J.; Wang, Y.; Du, Y.C.; Han, X.J.; Xu, P. Construction of Plasmonic 1T-WS2/2H-WS2/CdS Heterostructures for Enhanced Solar-Driven Hydrogen Evolution. J. Mater. Chem. A 2022, 10, 24030–24040. [Google Scholar] [CrossRef]
  10. Chen, S.-F.; Wu, T.-S.; Soo, Y.-L. Highly Defective Graphene Quantum Dots-Doped 1T/2H-MoS2 as an Efficient Composite Catalyst for the Hydrogen Evolution Reaction. Sci. Rep. 2023, 13, 15184. [Google Scholar] [CrossRef]
  11. Eftekhari, A. Electrocatalytic hydrogen evolution reaction: A comprehensive review. Int. J. Hydrogen Energy 2017, 42, 11053–11077. [Google Scholar] [CrossRef]
  12. Dai, X.P.; Du, K.L.; Li, Z.Z.; Liu, M.Z.; Ma, Y.D.; Sun, H.; Zhang, X.; Yang, Y. Co-Doped MoS2 Nanosheets with the Dominant CoMoS Phase Coated on Carbon as an Excellent Electrocatalyst for Hydrogen Evolution. ACS Appl. Mater. Interfaces 2015, 7, 27242–27253. [Google Scholar] [CrossRef] [PubMed]
  13. Lu, Z.; Li, S.; Ning, L.; Tang, K.; Guo, Y.; You, L.; Chen, C.; Wang, G. Nickel–Iron-Layered Double Hydroxide Electrocatalyst with Nanosheets Array for High Performance of Water Splitting. Molecules 2024, 29, 2092. [Google Scholar] [CrossRef]
  14. Feng, Q.L.; Mao, N.N.; Wu, J.X.; Xu, H.; Wang, C.M.; Zhang, J.; Xie, L.M. Growth of MoS2(1-x) Se2x (x = 0.41–1.00) Monolayer Alloys with Controlled Morphology by Physical Vapor Deposition. ACS Nano 2015, 9, 7450–7455. [Google Scholar] [CrossRef]
  15. Chhowalla, M.; Shin, H.S.; Eda, G.; Li, L.J.; Loh, K.P.; Zhang, H. The Chemistry of Two-Dimensional Layered Transition Metal Dichalcogenide Nanosheets. Nat. Chem. 2013, 5, 263–275. [Google Scholar] [CrossRef]
  16. Shen, D.Y.; Zhao, B.; Zhang, Z.C.; Zhang, H.M.; Yang, X.D.; Huang, Z.W.; Li, B.L.; Song, R.; Jin, Y.J.; Wu, R.X.; et al. Synthesis of Group VIII Magnetic Transition Metal-Doped Monolayer MoSe2. ACS Nano 2022, 16, 10623–10631. [Google Scholar] [CrossRef]
  17. Zimron, O.; Zilberman, T.; Kadam, S.R.; Ghosh, S.; Kolatker, S.-L.; Neyman, A.; Bar-Ziv, R.; Bar-Sadan, M. Co-Doped MoSe2 Nanoflowers as Efficient Catalysts for Electrochemical Hydrogen Evolution Reaction (HER) in Acidic and Alkaline Media. Isr. J. Chem. 2020, 60, 624–629. [Google Scholar] [CrossRef]
  18. Yang, Y.Q.; Zhao, X.; Mao, H.; Ning, R.; Zheng, X.H.; Sui, J.H.; Cai, W. Nickel-doped MoSe2 nanosheets with Ni-Se bond for alkaline electrocatalytic hydrogen evolution. J. Mater. Chem. A 2023, 11, 12345–12352. [Google Scholar] [CrossRef]
  19. Chen, Y.P.; Huang, Y.C.; Xiong, K.Y.; Ye, X.Y.; Liu, Q.Q.; Zhuang, J.R.; Zhang, Y.F.; Zhu, J. Cooperative 3d-Metal-Doped MoSe2 Catalysts for Enhanced Electrocatalytic Hydrogen Evolution Reaction. Mol. Catal. 2024, 566, 114401. [Google Scholar] [CrossRef]
  20. Liu, T.; Xu, H.; Zhou, W.; Zhang, K.; Sun, Y. Computational Design of Single-Atom Catalysts: Cobalt-Doped MoSe2 as a High-Performance Electrocatalyst for Hydrogen Evolution. ACS Catal. 2020, 10, 12345–12356. [Google Scholar]
  21. Xu, C.; Peng, S.J.; Tan, C.L.; Ang, H.X.; Tan, H.T.; Zhang, H.; Yan, Q.Y. Ultrathin S-Doped MoSe2 Nanosheets for Efficient Hydrogen Evolution. J. Mater. Chem. A 2014, 2, 5597–5601. [Google Scholar] [CrossRef]
  22. Xiong, Q.Z.; Zhang, X.; Wang, H.J.; Liu, G.Q.; Wang, G.Z.; Zhang, H.M.; Zhao, H.J. One-Step Synthesis of Cobalt-Doped MoS2 Nanosheets as Bifunctional Electrocatalysts for Overall Water Splitting under Both Acidic and Alkaline Conditions. Chem. Commun. 2018, 54, 3859–3862. [Google Scholar] [CrossRef]
  23. Sun, X.; Dai, J.; Guo, Y.Q.; Wu, C.Z.; Hu, F.T.; Zhao, J.Y.; Zeng, X.C.; Xie, Y. Semimetallic Molybdenum Disulfide Ultrathin Nanosheets as an Efficient Electrocatalyst for Hydrogen Evolution. Nanoscale 2014, 6, 8359–8367. [Google Scholar] [CrossRef]
  24. Zong, H.; Yu, K.; Zhu, Z. Heterostructure nanohybrids of Ni-doped MoSe2 coupled with Ti2NTx toward efficient overall water splitting. Electrochim. Acta 2020, 353, 136598. [Google Scholar] [CrossRef]
  25. Zhao, G.Q.; Wang, X.Y.; Wang, S.L.; Rui, K.; Chen, Y.P.; Yu, H.B.; Ma, J.; Dou, S.X.; Sun, W.P. Evolution Kinetics for Alkaline Water Splitting. Chem. Asian J. 2019, 14, 301–306. [Google Scholar] [CrossRef]
  26. Dymerska, A.; Kukułka, W.; Wenelska, K.; Mijowska, E. Two-Dimensional Molybdenum Diselenide Tuned by Bimetal Co/Ni Nanoparticles for Oxygen Evolution Reaction. ACS Omega 2020, 5, 28730–28737. [Google Scholar] [CrossRef]
  27. Venkatesh, P.S.; Kannan, N.; Babu, M.G.; Paulraj, G.; Jeganathan, K. Transition Metal Doped MoS2 Nanosheets for Electrocatalytic Hydrogen Evolution Reaction. Mater. Today Proc. 2022, 47, 37256–37263. [Google Scholar]
  28. Najafi, L.; Bellani, S.; Oropesa-Nuñez, R.; Ansaldo, A.; Prato, M.; Del Rio Castillo, A.E.; Bonaccorso, F. Engineered MoSe2-based heterostructures for efficient electrochemical hydrogen evolution reaction. Adv. Energy Mater. 2018, 8, 1703212. [Google Scholar] [CrossRef]
  29. Liu, Y.D.; Ren, L.; Zhang, Z.; Qi, X.; Li, H.X.; Zhong, J.X. 3D Binder-free MoSe2 Nanosheets/Carbon Cloth Electrodes for Efficient and Stable Hydrogen Evolution Prepared by Simple Electrophoresis Deposition Strategy. Sci. Rep. 2016, 6, 22516. [Google Scholar] [CrossRef]
  30. McCrory, C.C.L.; Jung, S.; Peters, J.C.; Jaramillo, T.F. Benchmarking Heterogeneous Electrocatalysts for the Oxygen Evolution Reaction. J. Am. Chem. Soc. 2013, 135, 16977–16987. [Google Scholar] [CrossRef]
  31. Kresse, G.; Hafner, J. Ab Initio Molecular Dynamics for Liquid Metals. Phys. Rev. B 1993, 47, 558(R). [Google Scholar] [CrossRef] [PubMed]
  32. Kresse, G.; Furthmüller, J.; Hafner, J. Theory of the Crystal Structures of Selenium and Tellurium: The Effect of Generalized-Gradient Corrections to the Local-Density Approximation. Phys. Rev. B 1994, 50, 13181–13190. [Google Scholar] [CrossRef] [PubMed]
  33. Kresse, G.; Furthmüller, J. Efficient Iterative Schemes for Ab Initio Total-Energy Calculations Using a Plane-Wave Basis Set. Phys. Rev. B 1996, 54, 11169–11186. [Google Scholar] [CrossRef] [PubMed]
  34. Perdew, J.P.; Burke, K.; Ernzerhof, M. Generalized Gradient Approximation Made Simple. Phys. Rev. Lett. 1996, 77, 3865–3868. [Google Scholar] [CrossRef]
Figure 1. SEM images of (a) MoSe2, (b) Fe-MoSe2, (c) Co-MoSe2, and (d) Ni-MoSe2.
Inorganics 13 00155 g001
Figure 2. (a,b) HRTEM images of MoSe2, with the corresponding FFT in the red box. (c) SAED pattern of MoSe2. (d) STEM-HAADF image and EDS elemental mapping of Mo and Se. (e,f) HRTEM images of Fe-MoSe2, with the insets showing the corresponding FFT patterns. (g) SAED pattern of Fe-MoSe2. (h) STEM-HAADF image and EDS elemental mapping of Mo, Se, and Fe. (i,j) HRTEM images of Co-MoSe2, with the insets showing the corresponding FFT patterns. (k) SAED pattern of Co-MoSe2. (l) STEM-HAADF image and EDS elemental mapping of Mo, Se, and Co. (m,n) HRTEM images of Ni-MoSe2, with the insets showing the corresponding FFT patterns. (o) SAED pattern of Ni-MoSe2. (p) STEM-HAADF image and EDS elemental mapping of Mo, Se, and Ni.
Inorganics 13 00155 g002
Figure 3. XPS spectra of Fe-MoSe2 showing the signals of (a) Fe 2p, (b) Mo 3d, and (c) Se 3d. XPS spectra of Co-MoSe2 showing the signals of (d) Co 2p, (e) Mo 3d, and (f) Se 3d. XPS spectra of Ni-MoSe2 showing the signals of (g) Ni 2p, (h) Mo 3d, and (i) Se 3d.
Inorganics 13 00155 g003
Figure 4. (a) Raman scattering spectra and (b) XRD patterns of Fe/Co/Ni-MoSe2 and MoSe2.
Inorganics 13 00155 g004
Figure 5. (a) Polarization curves of MoSe2, Pt/C, and Fe/Co/Ni-MoSe2 catalysts. (b) Calculated Tafel slopes. Testing was performed in 0.5 M H2SO4 with a scan rate of 50 mV/s. (c) Cdl of MoSe2 and Fe/Co/Ni-MoSe2.
Inorganics 13 00155 g005
Figure 6. DFT-optimized structures showing H atom adsorption on different positions of (a) MoSe2, (b) Fe-MoSe2, (c) Co-MoSe2, and (d) Ni-MoSe2.
Inorganics 13 00155 g006
Figure 7. The calculated ΔG for H atom adsorption on different positions of (a) MoSe2, (b) Fe-MoSe2, (c) Co-MoSe2, and (d) Ni-MoSe2.
Inorganics 13 00155 g007
Figure 8. (a) Schematic diagram of the preparation process for Fe-doped MoSe2. (b) Schematic diagram of the CVD system used to synthesize transition metal-doped MoSe2 nanosheets.
Inorganics 13 00155 g008
Disclaimer/Publisher’s Note: The statements, opinions and data contained in all publications are solely those of the individual author(s) and contributor(s) and not of MDPI and/or the editor(s). MDPI and/or the editor(s) disclaim responsibility for any injury to people or property resulting from any ideas, methods, instructions or products referred to in the content.

