Abstract
Bi-doped glasses and fibers have been widely applied in solid-state and fiber lasers. However, the mechanism underlying near-infrared (NIR) luminescence remains unclear, and Bi-related luminescence centers (BLCs) are prone to alteration during fiber fabrication, making it challenging to achieve high-performance Bi-doped glass fibers. In this work, Bi-, Bi-Al-, and Bi-Ge-doped silica glasses were investigated to elucidate the origin of NIR luminescence. Two broad NIR fluorescence bands were observed in silica glasses, originating from distinct BLCs. The longer-wavelength fluorescence band at 1423 nm, demonstrating sensitivity to Bi doping concentration and homogeneity, is attributed to Bi clusters (aggregates of Bi+ ions), whereas the shorter-wavelength emission, independent of Bi concentration, originates from isolated Bi+ ions. A vacuum-assisted melting-in-tube method with a single-step heating process was employed to fabricate Bi-doped silica-based glasses and fibers. The fluorescence bands of the fibers remained consistent with those of the precursor glasses, indicating no new BLCs were formed during fiber fabrication. The modulation of fluorescence bands was primarily governed by Bi cluster formation. Suppressing Bi clustering through co-doping with Al/Ge or optimizing fabrication conditions offers an effective route to tailor the fluorescence properties of Bi-doped glasses and fibers.
1. Introduction
Bismuth-doped glasses and fibers have garnered significant attention for their broadband NIR fluorescence, which holds potential for applications in ultra-short-pulse fiber lasers, optical amplifiers, and novel fiber laser systems [1,2,3,4,5]. Numerous Bi-doped glasses with broadband NIR emissions have been developed, including silicate, phosphate, borate, germanate, and silica-based matrices [5,6,7,8,9,10,11,12,13,14]. Among these, Bi-doped silica glasses are particularly noteworthy. This preference stems from the ease of drawing silica glass into fibers and its compatibility with silica fiber gratings, which exhibit low optical loss. While various Bi-doped silica fibers have been successfully fabricated for laser and amplifier applications, achieving high optical gain in such fibers remains challenging [15,16,17,18,19,20,21].
The broadband NIR fluorescence in Bi-doped glasses originates from multiple Bi-related luminescence centers (BLCs), as demonstrated in silicate, borate, phosphate, germanate glasses, and single crystals [22,23,24,25,26,27]. Although multiple BLCs contribute to broad emissions, energy transfer, reabsorption, and cross-relaxation between distinct BLCs degrade the gain performance of Bi-doped fibers. Stabilizing a single BLC during fabrication is critical for optimizing fiber performance. However, the origin of NIR fluorescence in Bi-doped glasses remains unclear. Additionally, BLC states are prone to alteration during high-temperature sintering and fiber drawing processes, as observed in Bi-doped silica, germanate, and silicate systems [6,18,28,29,30]. Conventional fabrication methods, such as modified chemical vapor deposition (MCVD) combined with solution doping or rod-in-tube techniques, involve two high-temperature steps (glass melting and fiber drawing), which induce BLC instability and unpredictable luminescence properties [18,28,29,30]. Thus, fabricating Bi-doped fibers with a single stable BLC remains a significant challenge.
The silica glass matrix, composed of interconnected [SiO4] tetrahedra, is structurally simpler than other oxide glasses. Bi ions occupy interstitial sites within this network. Previous studies suggest that Bi ions in silica glass experience uniform local environments, making this system ideal for investigating NIR fluorescence mechanisms. Introducing network modifiers such as Al2O3 or GeO2 alters the glass structure, promoting a homogeneous Bi distribution. The same phenomenon was observed in rare-earth-doped silica systems [31,32]. These modifiers suppress Bi cluster formation, thereby reducing the number of BLCs. Thus, we proposed that there was one BLC related to the Bi clusters. To test this, Bi single-doped and Bi-Al/Ge co-doped silica glasses were synthesized via oxygen-based raw material sintering. NIR fluorescence and excitation spectra were systematically analyzed to elucidate the luminescence mechanism. A vacuum-assisted melting-in-tube method was employed for fiber fabrication, minimizing BLC state changes by limiting the process to a single high-temperature step.
2. Results and Discussion
The qualitative semi-quantitative results for glass samples were tested by X-ray fluorescence (XRF) analysis and are listed in Table 1. The main components of the sample are SiO2, Al2O3, GeO2, and Bi2O3. When 0.04 mol% Bi(NO3)3 was introduced, the Bi content in Si-0.04Bi glass was 0.0087 mol%, while in Si-Al-0.04Bi and Si-Ge-0.04Bi samples, it reached 0.056 mol% and 0.051 mol%, respectively. With the introduction of 0.1 mol% Bi(NO3)3, the Bi content increased to 0.363 mol% in Si-0.04Bi glass and further rose to 0.0676 mol% in Si-Al-0.04Bi and 0.3028 mol% in Si-Ge-0.04Bi samples. The discrepancy between the sample composition and the designed formula primarily arises from the volatilization of components during sintering and the infiltration of impurities into the glass due to crucible erosion. The presence of alumina detected in all samples confirms that the crucible is susceptible to attack during sintering, leading to alumina contamination.

Table 1.
Composition of the glass samples.
Figure 1 presents the absorption characteristics of Bi-doped, Bi-Al co-doped, and Bi-Ge co-doped silica glasses across the 250–1700 nm wavelength spectrum. In the visible region, six absorption bands were identified at 376 nm, 418 nm, 472 nm, 520 nm, 696 nm, and 830 nm. Notably, a broad absorption band spanning the near-infrared (NIR) region from 930 nm to 1700 nm was observed. This NIR broadband absorption is attributed to the reabsorption phenomenon of BLCs within the glass matrix. Furthermore, the absorption intensity in the NIR region exhibited an enhancement with increasing bismuth doping concentration.
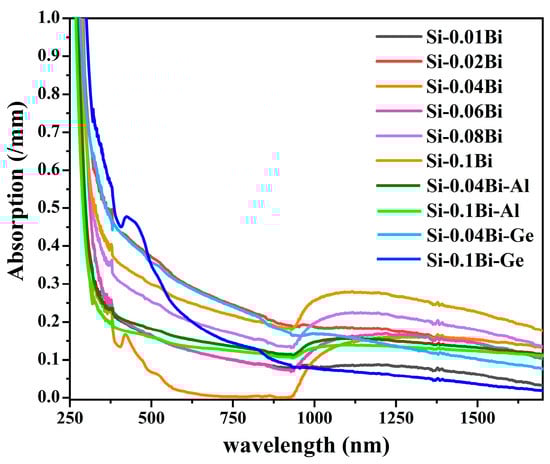
Figure 1.
Absorption spectra of Bi, Bi-Al, and Bi-Ge doped silica glasses.
Figure 2a presents the NIR fluorescence spectra of Si-0.04Bi, Si-0.04Bi-Al, Si-0.04Bi-Ge, Si-0.1Bi, Si-0.1Bi-Al, and Si-0.1Bi-Ge glasses under 500 nm excitation. A broad fluorescence band centered at 1148 nm was observed in the Si-0.04Bi-Al and Si-0.04Bi-Ge samples, whereas the Si-0.04Bi glass exhibited two distinct bands at 1148 and 1423 nm. The NIR fluorescence intensity of Si-0.04Bi was 11-fold higher than those of Si-0.04Bi-Al and Si-0.04Bi-Ge. When the Bi concentration was increased to 0.1 mol%, the fluorescence intensity of Si-0.1Bi-Al and Si-0.1Bi-Ge increased by approximately 13 and 3.5 times, respectively, compared to their 0.04 mol% counterparts. In contrast, the NIR fluorescence intensity of Si-0.1Bi decreased to approximately 1/6 of that observed in Si-0.04Bi, likely due to the concentration quenching of the BLCs. The normalized NIR fluorescence spectra (Figure 2b) revealed no significant shifts or broadening in band positions with increasing Bi concentration, indicating no formation of new BLCs. Compared to Si-Bi and Si-Bi-Ge glasses, the 1148 nm fluorescence band in Si-Bi-Al exhibited a slight blue shift of 14 nm. Figure 2c shows the excitation spectra of all glasses, monitoring the emission wavelength at 1160 nm. Two broad excitation bands at 500 and 720 nm were observed, with their positions remaining unchanged across different glass matrices and Bi concentrations. The excitation bands corresponding to the 1160 nm emission align with the absorption peaks. This confirms that the 1148 nm fluorescence in all samples originates from the same BLC. The NIR fluorescence decay curves and their fittings (Figure 2d) yielded lifetimes of approximately 500 μs, consistent with previous reports for Bi-doped silica systems [1,33]. The lifetimes slightly decreased as the Bi concentration increased from 0.04 to 0.1 mol%, attributed to the cross-relaxation between BLCs. Introducing Al or Ge into the silica matrix enhanced Bi doping homogeneity, thereby reducing cross-relaxation probabilities. Consequently, Si-Bi-Al and Si-Bi-Ge glasses exhibited longer lifetimes compared to Si-Bi glass. It is well established that dopant ions tend to aggregate into clusters in silica glass. The incorporation of Al or Ge modifies the glass network, effectively suppressing cluster formation, a phenomenon previously demonstrated in rare-earth-doped silica systems. Notably, Bi clusters formed more readily as the Bi concentration increased from 0.04 to 0.1 mol%. The 1148 nm fluorescence intensity decreased in Si-Bi glasses but increased in Al- or Ge-co-doped samples, suggesting that this emission band does not originate from Bi clusters.
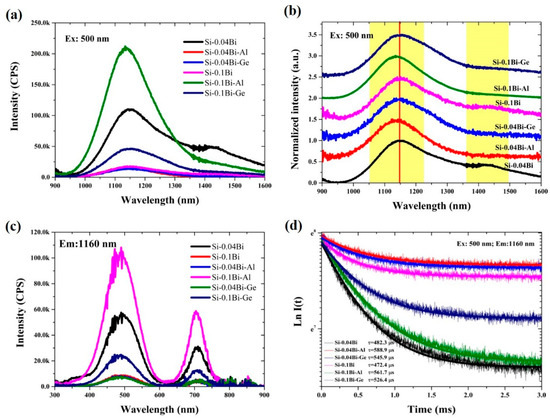
Figure 2.
(a,b) The NIR fluorescence and normalized NIR fluorescence spectra excited at 500 nm of Si-0.04Bi, Si-0.04Bi-Al, Si-0.04Bi-Ge, Si-0.1Bi, Si-0.1Bi-Al, and Si-0.1Bi-Ge glasses, The red vertical line and yellow area in subfigure (b) are the emission peaks of the sample; (c) excitation spectra when monitoring the emission wavelength at 1160 nm of Si-0.04Bi, Si-0.04Bi-Al, Si-0.04Bi-Ge, Si-0.1Bi, Si-0.1Bi-Al, and Si-0.1Bi-Ge glasses; (d) fluorescence decay curves at 1160 nm excited at 500 nm for Si-0.04Bi, Si-0.04Bi-Al, Si-0.04Bi-Ge, Si-0.1Bi, Si-0.1Bi-Al, and Si-0.1Bi-Ge glasses.
Figure 3a displays the NIR fluorescence spectrum of Si-0.04Bi glass and its Gaussian deconvolution analysis according to the method proposed in the previous literature [34,35]. The spectrum was successfully fitted into two distinct emission bands centered at 1148 nm and 1420 nm. In contrast, the fluorescence spectra of Si-0.04Bi-Al and Si-0.04Bi-Ge glasses (Figure 3b) could only be resolved into a single Gaussian band at 1148 nm. Figure 3c compares the excitation spectra of Si-0.04Bi glass monitored at 1160 nm and 1430 nm emission wavelengths. For the 1160 nm emission, two excitation bands were observed at 500 nm and 720 nm, which were identical to those of the Al/Ge co-doped samples. However, the 1430 nm emission exhibited three distinct excitation peaks at 376 nm, 420 nm, and 824 nm, aligning with the absorption peak of the glasses, demonstrating fundamentally different excitation pathways. This conclusively establishes that the fluorescence at 1160 nm and 1430 nm originates from separate BLCs. These results confirm the presence of two distinct BLCs in Bi single-doped silica glass, whereas only one dominant BLC persists in Al/Ge co-doped systems. The fluorescence decay curves for Si-0.04Bi glass (Figure 3d), monitored at 1160 nm and 1430 nm, yielded fitted lifetimes of 482.3 μs and 463.3 μs, respectively. The absence of significant lifetime differences between these emission bands suggests minimal energy transfer between the two BLCs.
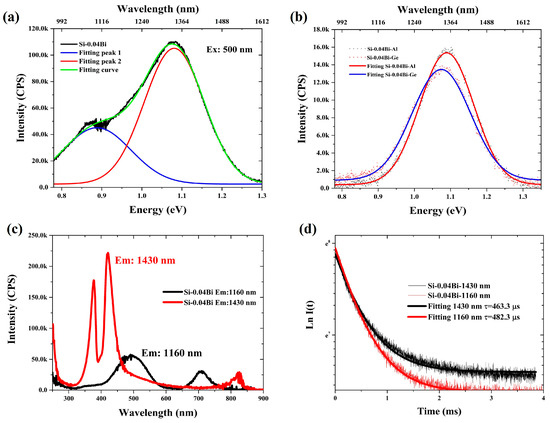
Figure 3.
(a) Fluorescence and Gaussian fitting spectra of Si-0.04Bi glass; (b) fluorescence and Gaussian fitting spectra of Si-0.04Bi-Al and Si-0.04Bi-Ge glasses; (c) excitation spectra of Si-0.04Bi glass when monitoring the fluorescence wavelength at 1160 and 1430 nm; (d) Fluorescence decay curves for 1160 nm emission excited at 500 nm and for 1430 nm emission excited at 418 nm for Si-0.04Bi silica glass.
To elucidate the origin of NIR fluorescence in Bi-doped silica-based glasses, the concentration-dependent fluorescence characteristics were systematically investigated. Figure 4a displays the NIR fluorescence spectra of Bi-doped silica glasses with Bi concentrations ranging from 0.01 to 0.1 mol%. The fluorescence intensity initially increased with Bi concentration, peaking at 0.04 mol%, and subsequently decreased as the concentration rose to 0.1 mol%, indicative of concentration quenching. Figure 4b illustrates the normalized near-infrared (NIR) fluorescence spectra of Bi single-doped silica glasses with Bi concentrations ranging from 0.01 to 0.1 mol%. Below a Bi concentration of 0.04 mol%, only a single fluorescence band centered at 1148 nm is observed. However, when the Bi concentration reaches or exceeds 0.04 mol%, an additional distinct emission band emerges at 1430 nm, indicating the concentration-dependent activation of a second luminescence center. Figure 4c displays the fluorescence decay curves monitored at 1160 nm and 1430 nm as a function of Bi concentration. The fitted fluorescence lifetimes for the 1160 nm emission exhibit irregular variations with increasing Bi concentration. In contrast, the lifetimes for the 1430 nm emission demonstrate a gradual increase from 463.3 μs to 564.2 μs, suggesting a concentration-dependent stabilization mechanism specific to this luminescence center.
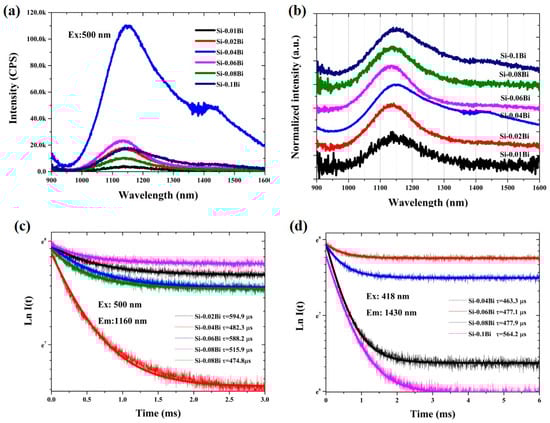
Figure 4.
(a,b) the NIR fluorescence and normalized fluorescence spectra of Bi-doped silica glasses with concentrations from 0.01 to 0.1 mol%; (c,d) the fluorescence decay curves of 1160 nm and 1430 nm along with the Bi concentration.
Based on the preceding analysis, two distinct BLCs coexist in the silica glass matrix. BLC1 is responsible for the 1148 nm fluorescence band, common to all Si-Bi, Si-Bi-Al, and Si-Bi-Ge glasses. This center exhibits identical absorption and excitation spectra (500/720 nm) across compositions, confirming its independence from matrix modifiers (Al/Ge) and Bi concentration. BLC2 generates the 1430 nm emission, showing a strong level of dependence on the Bi concentration. The 1430 nm fluorescence band is exclusively observed in Bi single-doped glasses at concentrations ≥ 0.04 mol% and exhibits distinct excitation spectral features. Based on these observations, we attribute BLC2 to the Bi clusters. The incorporation of Al/Ge co-dopants significantly suppresses Bi clustering through network structural modifications, thereby eliminating BLC2-associated emissions even at elevated Bi concentrations (0.1 mol%). This mechanism fully accounts for the absence of the 1430 nm fluorescence band in Al/Ge-co-doped silica glasses. Alexander Veber et al. systematically investigated the optical properties and bismuth redox in Bi-doped high-silica Al−Si glasses 95.5SiO2-4.5Al2O3-xBi2O3 (x = 0; 0.005; 0.01; 0.05; 0.1; 0.2) and concluded there were different Bi centers responsible for the NIR emission. A comparative analysis of XANES results revealed that the NIR luminescence originates from low-valence bismuth luminescent centers, with long-wavelength emissions attributed to Bi+-Bi+ dimers and short-wavelength emissions arising from Bi+ [27]. In consideration of XANES results and energy level diagrams proposed by Moore for Bi+, we suggest that the shorter wavelength emission can be assigned to the 3P1 → 3P0 transition of Bi+ and while the longer wavelength emission can be ascribed to the Bi+-Bi+ dimers, respectively.
The fluorescence bands observed at longer wavelengths (centered at 1430 nm) originate from Bi+-Bi+ dimers, whose formation is strongly dependent on the Bi doping concentration and glass structural modifications. Controlling Bi+-Bi+ dimers’ formation thus provides an effective strategy for tailoring long-wavelength emissions. In contrast, the shorter-wavelength band at 1148 nm arises from isolated Bi+ ions, whose luminescence stability is highly sensitive to the local chemical environment. Stabilizing these luminescent centers is critical for achieving high optical gain in Bi-doped silica-based fibers. However, during fiber preform fabrication and drawing processes, the structural states of BLCs undergo significant modifications, resulting in alterations to the fluorescence spectral profiles. To stabilize these BLCs, we implemented a vacuum-assisted melt-in-tube method for fabricating Bi-doped silica glasses and optical fibers. Figure 7a schematically illustrates the experimental setup for fiber fabrication. The procedure involved the following steps. The high-purity silica tube containing homogenously mixed raw materials is securely mounted on the fiber drawing tower. The assembly is then positioned within a graphite furnace and melted at 1750 °C for 2 h. Subsequently, the temperature is elevated to 1850 °C to draw the molten glass into Ø3 mm rods and Ø125 μm fibers. Throughout the heating and drawing processes, the system is maintained in a controlled vacuum environment to prevent oxidation and ensure material stability. The polished glass rods are designated as Si-0.1Bi-fiber (Bi single-doped) and Si-0.1Bi-Al-fiber (Bi-Al co-doped), corresponding to their respective core compositions.
Figure 5 shows the absorption of the Si-0.1Bi-fiber and Si-0.1Bi-Al-fiber in the wavelength range from 250 to 1700 nm. For the Si-0.1Bi-fiber, there were five absorption bands observed at 375, 420, 454, and 820 nm, respectively. Meanwhile, three absorption bands at 375, 500, and 696 nm were found in the Si-0.1Bi-fiber. Compared to glasses, the absorption intensity of the Si-0.1Bi-Al-fiber shows a decrease in the visible wavelength range, while it was increased in the Si-0.1Bi-fiber. All the glasses and glass fibers show a broadband absorption in the NIR wavelength range around 930–1700 nm. Compared with the glasses, the NIR absorption intensity of the Bi-Al co-doped silica glass fiber shows a decrease, while it was increased in the Bi single-doped silica glass fiber. The refractive index of the fiber core and cladding for the Si-0.1Bi-fiber and Si-0.1Bi-Al-fiber were measured by a prism coupler at wavelengths of 632.8 nm, 1309 nm, and 1533 nm, respectively. The Cauchy dispersion formula was then used to fit the refractive indices at other wavelengths, and the Cauchy dispersion diagram was drawn as shown in Figure 5b. The NA of the Si-0.1Bi-fiber and Si-0.1Bi-Al-fiber was calculated to be 0.19 and 0.14 at 1309 nm, respectively.
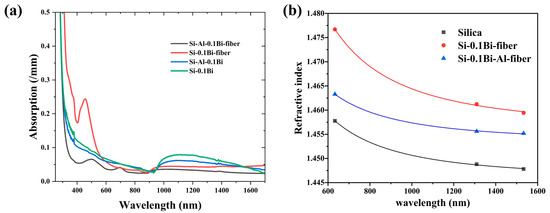
Figure 5.
(a) Absorption spectrum of Si-0.1Bi-fiber and Si-0.1Bi-Al-fiber glasses; (b) Cauchy dispersion diagram of silica, Si-0.1Bi-fiber, and Si-0.1Bi-Al-fiber glasses.
The microstructure and element distribution of the Si-0.1Bi-fiber were studied by EPMA, and Figure 6a–c shows the EPMA surface scan of the fiber core and the surrounding area of the Si-0.1Bi-fiber sample. It can be seen that the bismuth element is mainly distributed in the fiber core area without obvious diffusion. Figure 6d shows the EPMA line scan of the fiber core and the surrounding area of the fiber sample. It can be concluded that the bismuth element is uniformly distributed in the fabricated Si-0.1Bi-fiber glass. The Bi content in the fiber core was about 0.1381 mol%. There were some air holes in the glass fiber owing to unoptimized fiber drawing techniques.
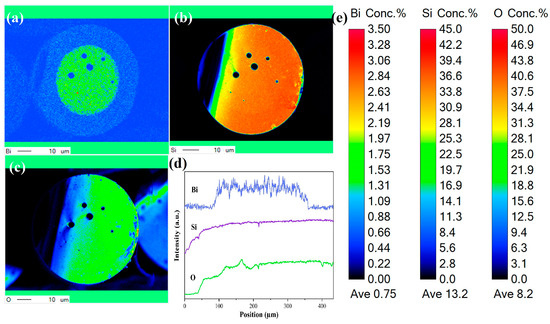
Figure 6.
(a–c) Element mapping and (d) linear analysis on the cross-section of Si-0.1Bi-fiber. (e) The content of various elements in the Element mapping.
Figure 7b shows photographic images of the fiber end face, glass rod, and polished glass samples. The polished glass rod was utilized for optical property measurements. A distinct coloration difference was observed between the glass rod and polished cladding, with the core region exhibiting the characteristic maroon hue attributed to Bi doping. Figure 7c presents the NIR fluorescence spectra of the Si-0.1Bi-fiber and Si-0.1Bi-Al-fiber samples. The Si-0.1Bi-Al-fiber exhibits a single broad emission band centered at 1148 nm, identical to its bulk glass counterpart (Si-0.1Bi-Al). In contrast, the Si-0.1Bi-fiber displays dual emission bands at 1148 nm and 1430 nm, with the 1430 nm band showing a significantly higher intensity than the 1148 nm band, which is a reversal of the intensity ratio observed in the bulk Si-0.1Bi glass (see Figure 7b). Upon excitation at 418 nm, the fluorescence emission exhibited a pronounced spectral shift to 1430 nm, with an intensity four times higher than that observed under 500 nm excitation (Figure 7c). This aligns with our earlier conclusion that the longer-wavelength fluorescence (1430 nm) is conclusively attributed to Bi+-Bi+ dimers. The enhanced cluster formation in the Si-0.1Bi-fiber glass arises from prolonged melting durations during the tube-based fabrication process compared to the bulk Si-0.1Bi glass. This extended thermal treatment facilitated Bi aggregation, leading to the intensity inversion of band dominance at 1430 nm over the 1148 nm emission and the reduction of 1160 nm in fluorescence intensity. During the fiber drawing process, the raw materials in the core remain in a vacuum environment, preventing Bi ions from being oxidized to higher valence states. The consistency between the luminescence spectra of the fiber and those of the glass samples indirectly confirms that the NIR luminescence predominantly originates from low-valent bismuth species. Therefore, it is reasonable to attribute the NIR emission to Bi+ ions and Bi+-Bi+ dimers. Figure 7d displays the excitation spectra of the Si-0.1Bi-fiber and Si-0.1Bi-Al-fiber samples, monitored at fluorescence wavelengths of 1160 nm and 1430 nm, respectively. Notably, the 1430 nm emission exhibited a significantly higher intensity than the 1160 nm band, a phenomenon attributed to Bi+-Bi+ dimers during fiber drawing. The fluorescence decay curves for the Si-0.1Bi-fiber and Si-0.1Bi-Al-fiber are shown in Figure 7e. A fitting analysis revealed lifetimes of 380 μs (1160 nm) and 359 μs (1430 nm) for the Si-0.1Bi-fiber, while the Si-0.1Bi-Al-fiber showed a longer lifetime of 556 μs (1160 nm). These results demonstrate a 32–35% reduction in lifetime for clustered systems (Si-0.1Bi-fiber) compared to bulk glasses (500 μs), caused by enhanced cross-relaxation, energy transfer, and reabsorption between adjacent BLCs in clustered configurations. To probe potential valence state changes, the XPS spectra of the Si-0.1Bi, Si-0.1Bi-Al, Si-0.1Bi-fiber, and Si-0.1Bi-Al-fiber were analyzed (Figure 7f). The Bi 4f core-level spectra showed no detectable shifts (<0.2 eV) between glass and fiber samples, confirming that BLCs retain their electronic states during fiber processing and the vacuum melting environment effectively suppresses the formation of new BLCs.
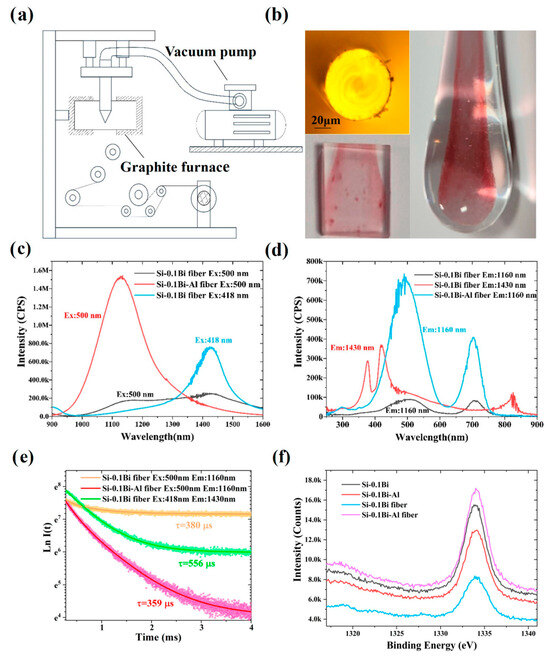
Figure 7.
(a) The diagram of the employed method for obtaining Bi-doped glasses and fibers; (b) the photos of the end face of the Si-0.1Bi-Al glass fiber, the glass rod, and polished glass; (c,d) the NIR fluorescence and excitation spectra of Si-0.1Bi-fiber and Si-0.1Bi-Al-fiber; (e) Fluorescence decay curves of the 1160 nm and 1430nm emission for Si-0.04Bi-fiber and Si-0.04Bi-Al-fiber; (f) XPS spectra of Bi 4f7/2–5/2 of Si-0.1Bi-fiber and Si-0.1Bi-Al-fiber.
Figure 8a,b presents the fluorescence spectra of the Si-0.1Bi-fiber sample under excitation wavelengths spanning 320–840 nm. Two broadband emission bands are observed at 1148 nm and 1430 nm, with their spectral positions remaining invariant across the entire excitation range. This excitation-independent behavior confirms the stability of BLCs under varied optical pumping conditions. The broadband NIR emission arises from the spectral superposition of these two distinct fluorescence bands. The emission peak at 1160 nm can be seen with a slight blue shift at the excitation wavelength of 320 to 680 nm and a significant red shift at the excitation wavelength of 680 to 840 nm. Consistent with our earlier findings, the spectral variations in Bi-doped glass fibers correlate directly with Bi+-Bi+ dimers’ formation during fiber drawing. In addition, due the existence of multiple Bi active centers, the emission of the sample Si-0.1Bi-fiber can be widely tuned to fully cover the NIR region. This mechanistic understanding enables precise fluorescence band modulation in Bi-doped glass and fiber systems through the controlled manipulation of Bi clustering dynamics.
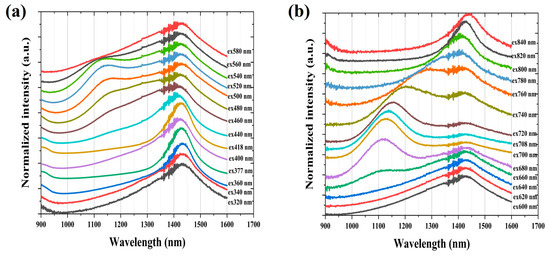
Figure 8.
(a,b) The NIR fluorescence spectra of Si-0.1Bi-fiber under the excitation wavelength from 320 to 840 nm.
3. Materials and Methods
Bi-doped and Bi-Al/Ge co-doped silica glasses were synthesized using a solution doping technique combined with a melt-quenching method. The starting materials included high-purity (Shanghai Aladdin Biochemical Technology Co., Ltd., Shanghai, China, 99.99%) silica gel (particle size: 5 μm), Bi2O3 (Shanghai Macklin Biochemical Co., Ltd., Shanghai, China, 99.9%), Al2O3 (Shanghai Macklin Biochemical Co., Ltd., Shanghai, China, 99.99%), and GeO2 (Shanghai Macklin Biochemical Co., Ltd., Shanghai, China, 99.99%). The synthesis procedure was as follows:
- (1)
- Precursor solution preparation: Bi2O3, Al2O3, and GeO2 were dissolved in 2 mol/L HNO3 (Shanghai Macklin Biochemical Co., Ltd., Shanghai, China) to form transparent, precipitation-free solutions of Bi(NO3)3, Bi(NO3)3-Al(NO3)3, and Bi(NO3)3-Ge(NO3)4.
- (2)
- Doping concentration control: The molar concentrations of the prepared solutions were as follows:Bi single-doped: xBi(NO3)3 (x = 0.01, 0.02, 0.04, 0.06, 0.08, 0.1 mol/L);Bi-Al co-doped: xBi(NO3)3-yAl(NO3)3 (x = 0.04, 0.1; y = 0.1 mol/L);Bi-Ge co-doped: xBi(NO3)3-zGe(NO3)4 (x = 0.04, 0.1; z = 0.1 mol/L).
- (3)
- Sample preparation procedure:
Five grams of silica gel was soaked in 50 mL of the prepared solution at room temperature for one hour. Subsequently, the solution was filtered to obtain the doped silica gel, which was then dried to yield the glass raw materials. These glass raw materials were placed in an electric furnace and melted at 1600 °C for two hours. After that, they were cooled down to room temperature inside the electric furnace, resulting in opaque block materials. The opaque block materials were further transformed into transparent glass by melting them with a hydrogen-oxygen flame and were quenched in air without annealing. The obtained glass samples were cut into segments with a thickness of 1 mm, and their two large faces were polished for optical measurements. According to the Bi doping concentration and glass composition, the prepared glass samples were named Si-0.01Bi, Si-0.02Bi, Si-0.04Bi, Si-0.06Bi, Si-0.08Bi, Si-0.1Bi, Si-0.04Bi-Al, Si-0.1Bi-Al, Si-0.04Bi-Ge, and Si-0.1Bi-Ge, respectively.
To investigate the effects of glass melting and fiber drawing processes on the NIR fluorescence properties of BLCs, Bi-doped glass fibers were fabricated using a vacuum-assisted melt-in-tube technique. First, 50 g of silica gel was soaked in 500 mL of the prepared solution, followed by filtration and drying. The obtained powders were then transferred into a quartz tube. The quartz tube was melted in a graphite furnace at approximately 1760 °C and subsequently drawn into glass rods and fibers. Throughout the melting and drawing processes, the Bi-doped glass powder was maintained in a vacuum environment. The obtained fibers were labeled as Si-0.1Bi-fiber and Si-0.1Bi-Al-fiber, respectively. For optical measurements, the fiber glass rods were cut into slices with a thickness of 1 mm, and their two large faces were polished. For cross-section measurements, the fibers with a diameter of 125 μm were cut into segments with a length of 2 mm.
The element content of the glasses was analyzed based on the X-ray fluorescence (XRF) spectra obtained using the Axios max X-ray fluorescence spectrometer (Malvern Panalytical, Malvern, UK). The NIR fluorescence and excitation spectra were measured using an Edinburgh FLS920 fluorospectrometer (Edinburgh Instruments, Livingston, UK) equipped with a 450 W xenon lamp (excitation source) and a liquid-nitrogen-cooled photomultiplier tube (PMT). The instrumental parameters for luminescence spectroscopy include a slit width of 2 nm, a scan interval of 1 nm, and a detector response time of 300 ms. All measured spectra were corrected using the PMT detector’s response curve. Fluorescence decay curves were recorded with the same spectrometer, employing a 60 W pulsed xenon lamp as the excitation source. Absorption spectra were recorded using an UV/VIS spectrometer (Lambda 950, Perkin Elmer, Waltham, MA, USA). The refractive index of the glass was measured by a Metricon 2010 prism coupler (Malvern Panalytical, Malvern, UK), and 633 nm, 1309 nm, and 1533 nm semiconductor lasers were used as the test light sources, respectively. The refractive index of the samples corresponding to the remaining wavelengths was fitted by the Cauchy formula. X-ray photoelectron spectroscopy (XPS) analysis was conducted on a PHI 5000 VersaProbe spectrometer (ULVAC-PHI, Kanagawa, Japan) using monochromatic Al Kα X-rays (1486.6 eV). The microphotographs of the glass fiber end faces were captured using an NP-800 polarizing microscope (Suzhou Nanguang Electronic Technology Co., Ltd., Suzhou, China). All measurements were performed at room temperature. The instrument used in the EPMA test of the sample in this paper is the Shimadzu EPMA-1600 X-ray spectrometer (Shimadzu Corporation, Kyoto, Japan), which analyzed the specimen by excitation with a high-energy electron beam of 1 μm.
4. Conclusions
In summary, the fluorescence characteristics of Bi single-doped and Bi-Ge/Al co-doped silica glasses were systematically investigated. The broadband NIR emissions at 1148 nm and 1430 nm originate from two distinct BLCs. The longer-wavelength band (1430 nm) exhibits a strong level of dependence on the Bi doping concentration and is exclusively observed in high-concentration Bi single-doped silica glasses (≥0.04 mol%), in which Bi clusters readily form. Notably, the fluorescence spectra of glasses fabricated via the vacuum-assisted melt-in-tube method showed no significant differences compared to conventionally prepared Bi-doped glasses, confirming the absence of new BLC formations during fiber fabrication. The observed spectral variations in Bi-doped silica systems are primarily governed by Bi cluster dynamics, providing a reliable pathway for fluorescence band modulation through controlled cluster engineering.
Author Contributions
Conceptualization, Q.Z. and L.Z.; methodology, Q.Z. and L.Z.; validation, Q.Z., G.Z. and L.Z.; formal analysis, Q.Z.; investigation, Q.Z. and G.Z.; resources, W.Y., X.Y. and L.Z.; data curation, Q.Z. and H.H.; writing—original draft preparation, Q.Z.; writing—review and editing, L.Z. and C.L.; visualization, Q.Z.; supervision, L.Z. and C.L.; project administration, L.Z.; funding acquisition, L.Z. All authors have read and agreed to the published version of the manuscript.
Funding
This work was funded by the Key R&D Program of Jiangxi Province (Grant No. 20223BBE51020), Jiangxi Provincial Natural Science Foundation (Grant No. 20242BAB25220), and the opening fund of Key Laboratory of Rare Earths (Chinese Academy of Sciences).
Data Availability Statement
The original contributions presented in this study are included in the article. Further inquiries can be directed to the corresponding author.
Conflicts of Interest
The authors declare no conflicts of interest.
References
- Wang, Y.; Wang, S.; Halder, A.; Sahu, J. Bi-doped optical fibers and fiber amplifiers. Opt. Mater. X 2023, 17, 100219. [Google Scholar] [CrossRef]
- Thipparapu, N.; Wang, Y.; Wang, S.; Umnikov, A.; Barua, P.; Sahu, J. Bi-doped fiber amplifiers and lasers. Opt. Mater. Express 2019, 9, 2446–2465. [Google Scholar] [CrossRef]
- Alyshev, S.; Khegai, A.; Umnikov, A.; Firstov, S. Bismuth-Doped Fiber Lasers and Amplifiers Operating from O-to U-Band: Current State of the Art and Outlook. Photonics 2024, 11, 663. [Google Scholar] [CrossRef]
- Guo, M.; Tian, J.; Li, X.; Wang, F.; Wang, Y.; Yu, C.; Hu, L. Research progress of Bi-doped silica-based fibers for wide-band amplifier and laser application in SIOM. Proc. Сбoрник трудoв кoнференции Int. Conf. Adv. Laser Technol. (ALT) 2024, 50, 2416006. [Google Scholar]
- Khegai, A.; Alyshev, S.; Vakhrushev, A.; Riumkin, K.; Umnikov, A.; Firstov, S. Recent advances in Bi-doped silica-based optical fibers: A short review. J. Non-Cryst. Solids X 2022, 16, 100126. [Google Scholar] [CrossRef]
- Li, X.; Peng, M.; Cao, J.; Yang, Z.; Xu, S. Distribution and stabilization of bismuth NIR centers in Bi-doped aluminosilicate laser glasses by managing glass network structure. J. Mater. Chem. C. 2018, 6, 7814–7821. [Google Scholar] [CrossRef]
- Suzuki, T.; Ohishi, Y. Ultrabroadband near-infrared emission from Bi-doped Li2O-Al2O3-SiO2 glass. Appl. Phys. Lett. 2006, 88, 191912. [Google Scholar] [CrossRef]
- Qiu, J.; Peng, M.; Ren, J.; Meng, X.; Jiang, X.; Zhu, C. Novel Bi-doped glasses for broadband optical amplification. J. Non-Cryst. Solids 2008, 354, 1235–1239. [Google Scholar] [CrossRef]
- Chen, W.; Guo, W.; Huang, X.; Xiao, X.; Qiu, J.; Yang, Z.; Dong, G. Enhanced highly bismuth-doped multicomponent phosphate glass fibers for broadband amplifiers. J. Am. Ceram. Soc. 2024, 107, 8117–8125. [Google Scholar] [CrossRef]
- Ruan, J.; Wu, E.; Zeng, H.; Zhou, S.; Lakshminarayana, G.; Qiu, J. Enhanced broadband near-infrared luminescence and optical amplification in Yb–Bi codoped phosphate glasses. Appl. Phys. Lett. 2008, 92, 101121. [Google Scholar] [CrossRef]
- Li, X.; Cao, J.; Huang, M.; Peng, M. Modulating broadband near infrared emission from Bi doped borate laser glass by codoping nonactive rare earth ions. J. Non-Cryst. Solids 2021, 553, 120477. [Google Scholar] [CrossRef]
- Peng, M.; Zhang, N.; Wondraczek, L.; Qiu, J.; Yang, Z.; Zhang, Q. Ultrabroad NIR luminescence and energy transfer in Bi and Er/Bi co-doped germanate glasses. Opt. Express 2011, 19, 20799–20807. [Google Scholar] [CrossRef]
- Chen, F.; Chen, Z.; Qiu, J.; Zhang, S.; Ma, Z. Highly efficient, tunable, ultrabroadband NIR photoemission from Bi-doped nitridated germanate glasses toward all-band amplification in optical communication. Chin. Opt. Lett. 2023, 21, 051601. [Google Scholar]
- Tian, J.; Guo, M.; Wang, F.; Yu, C.; Zhang, L.; Wang, M.; Hu, L. High gain E-band amplification based on the low loss Bi/P co-doped silica fiber. Chin. Opt. Lett. 2022, 20, 100602. [Google Scholar] [CrossRef]
- Zheng, Z.; Pan, X.; Ji, W.; Dong, Y.; Wen, J.; Chen, W.; Huang, S.; Peng, G.; Wang, T.-Y. Co-doping effect of bismuth ions on the gain characteristics of Er-doped silica optical fiber. IEEE Photonics J. 2022, 14, 1–8. [Google Scholar] [CrossRef]
- Yang, W.; Dong, Q.; Huang, Y.; Lin, Q.; Zhang, K.; Chen, J.; Li, X.; Zhou, S. Anion Hybridization for Enhanced Broadband Optical Response in Bi-Doped Photonic Glass and Fiber. Adv. Opt. Mater. 2024, 12, 2303024. [Google Scholar] [CrossRef]
- Li, X.; Tian, J.; Shao, C.; Guo, M.; Chen, Y.; Yu, C.; Hu, L. Ultra-Broadband Emission in Bi/Ge Co-Doped Silica Glass and Fiber via Bismuth Coordination Engineering. Adv. Opt. Mater. 2024, 13, 2402261. [Google Scholar] [CrossRef]
- Duan, R.; Chen, J.; Ke, H.; Wei, T.; Zhang, K.; Li, X.; Feng, X.; Zheng, Q.; He, Z.; Qiu, J. Control of temperature dependent viscosity for manufacturing of Bi-doped active fiber. Int. J. Extreme. Manuf. 2024, 6, 035504. [Google Scholar] [CrossRef]
- Wang, W.; Yang, Y.; Wen, J.; Dong, Y.; Huang, C.; Luo, Y.; Shang, Y.; Pang, F.; Wang, T. Formation of E-band luminescence-active centers in bismuth-doped silica fiber via atomic layer deposition. Opt. Express 2024, 32, 8723–8735. [Google Scholar] [CrossRef]
- Yang, J.; Zhang, X.; Tang, J.; Liu, B.; Liu, X.; He, H.; Wang, P. Optical properties of Bi-doped glass and fiber based on modified sol-gel method. In Proceedings of the Nineteenth National Conference on Laser Technology and Optoelectronics, Shanghai, China, 11 October 2024; pp. 324–329. [Google Scholar]
- Vakhrushev, A.; Umnikov, A.; Khegai, A.; Riumkin, K.; Oleinik, D.; Abramov, A.; Kharakhordin, A.; Alyshev, S.; Firstova, E.; Iskhakova, L. Ultra-Wideband Amplification in Telecom Bands with Bi-Doped Multi-Layered Glass Fibers. J. Light. Technol. 2024, 43, 2291. [Google Scholar] [CrossRef]
- Zhang, L.; Dong, G.; Wu, J.; Peng, M.; Qiu, J. Excitation wavelength-dependent near-infrared luminescence from Bi-doped silica glass. J. Alloys Compd. 2012, 531, 10–13. [Google Scholar] [CrossRef]
- Xiong, P.; Li, Y.; Peng, M. Recent advances in super broad infrared luminescence bismuth-doped crystals. Iscience 2020, 23, 101578. [Google Scholar] [CrossRef] [PubMed]
- Cao, J.; Peng, J.; Wang, L.; Luo, H.; Wang, X.; Xiong, P.; Wang, Y.; Peng, M. Broadband NIR emission from multiple Bi centers in nitridated borogermanate glasses via tailoring local glass structure. J. Mater. Chem. C 2019, 7, 2076. [Google Scholar] [CrossRef]
- Chen, W.; Huang, X.; Dong, Q.; Zhou, Z.; Xiong, P.; Le, Y.; Song, E.; Qiu, J.; Yang, Z.; Dong, G. Thermally stable and tunable broadband near-infrared emission from NIR-I to NIR-II in Bi-doped germanate glass for smart light sources. J. Mater. Chem. C 2023, 11, 953. [Google Scholar] [CrossRef]
- Chen, W.; Huang, X.; Dong, Q.; Xiong, P.; Yang, D.; Qiu, J.; Yang, Z.; Dong, G. Tunable ultra-broadband multi-band NIR emission in Bi-doped aluminogermanate glasses and fibers via controllable Al2O3 content for broadband amplifiers. J. Mater. Chem. C 2024, 12, 459. [Google Scholar] [CrossRef]
- Veber, A.; Cicconi, M.R.; Puri, A.; de Ligny, D. Optical properties and bismuth redox in Bi-doped high-silica Al–Si glasses. J. Phys. Chem. C 2018, 122, 19777. [Google Scholar] [CrossRef]
- Firstov, S.V.; Alyshev, S.V.; Khopin, V.F.; Kharakhordin, A.V.; Lobanov, A.S.; Firstova, E.G.; Riumkin, K.E.; Khegai, A.M.; Melkumov, M.A.; Guryanov, A.N. Effect of heat treatment parameters on the optical properties of bismuth-doped GeO2: SiO2 glass fibers. Opt. Mater. Express 2019, 9, 2165. [Google Scholar] [CrossRef]
- Truong, V.G.; Bigot, L.; Lerouge, A.; Douay, M.; Razdobreev, I. Study of thermal stability and luminescence quenching properties of bismuth-doped silicate glasses for fiber laser applications. Appl. Phys. Lett. 2008, 92, 041908. [Google Scholar] [CrossRef]
- Firstov, S.; Levchenko, A.; Kharakhordin, A.; Khegai, A.; Alyshev, S.; Melkumov, M.; Khopin, V.; Lobanov, A.; Guryanov, A. Effect of drawing conditions on optical properties of bismuth-doped high-GeO2–SiO2 fibers. IEEE Photonics Technol. Lett. 2020, 32, 913. [Google Scholar] [CrossRef]
- Yang, Q.; Wang, Y.; Yu, C.; Wang, F.; Guo, M.; Zhang, L.; Shao, C.; Wang, M.; Shen, H.; Qi, Y. High ytterbium concentration Yb/Al/P/Ce co-doped silica fiber for 1-µm ultra-short cavity fiber laser application. Opt. Express 2023, 31, 33741. [Google Scholar] [CrossRef]
- Wang, F.; Hu, L.; Xu, W.; Wang, M.; Feng, S.; Ren, J.; Zhang, L.; Chen, D.; Ollier, N.; Gao, G. Manipulating refractive index, homogeneity and spectroscopy of Yb3+-doped silica-core glass towards high-power large mode area photonic crystal fiber lasers. Opt. Express 2017, 25, 2596. [Google Scholar]
- Fujimoto, Y.F.Y.; Nakatsuka, M.N.M. Infrared luminescence from bismuth-doped silica glass. Jpn. J. Appl. Phys. 2001, 40, L279. [Google Scholar] [CrossRef]
- Mooney, J.; Kambhampati, P. Get the basics right: Jacobian conversion of wavelength and energy scales for quantitative analysis of emission spectra. J. Phys. Chem. Lett. 2013, 4, 3316–3318. [Google Scholar] [CrossRef]
- Wang, Y.; Townsend, P. Common mistakes in luminescence analysis. J. Phys. Conf. Ser. 2012, 398, 012003. [Google Scholar] [CrossRef]
Disclaimer/Publisher’s Note: The statements, opinions and data contained in all publications are solely those of the individual author(s) and contributor(s) and not of MDPI and/or the editor(s). MDPI and/or the editor(s) disclaim responsibility for any injury to people or property resulting from any ideas, methods, instructions or products referred to in the content. |
© 2025 by the authors. Licensee MDPI, Basel, Switzerland. This article is an open access article distributed under the terms and conditions of the Creative Commons Attribution (CC BY) license (https://creativecommons.org/licenses/by/4.0/).