Article

The Effect of the Glycine-to-Oxidant Ratio on the Characteristics and Catalytic Performance of VOx/MgO Catalysts for ODH of n-Octane

1
School of Chemistry and Physics, University of KwaZulu-Natal, Private Bag X54001, Durban 4000, South Africa
2
Department of Chemistry, Durban University of Technology, P.O. Box 1334, Durban 4000, South Africa
3
Center for HRTEM, Physics Department, Nelson Mandela University, Port Elizabeth 6031, South Africa
4
School of Chemistry, University of Southampton, Highfield, Southampton SO17 1BJ, UK
5
Diamond Light Source Ltd., Harwell Science & Innovation Campus, Didcot OX11 0DE, UK
*
Author to whom correspondence should be addressed.
Inorganics 2025, 13(12), 389; https://doi.org/10.3390/inorganics13120389
Submission received: 19 June 2025 / Revised: 27 October 2025 / Accepted: 19 November 2025 / Published: 27 November 2025
(This article belongs to the Special Issue Transition Metal Catalysts: Design, Synthesis and Applications)

Abstract

The synthesis of VOx/MgO catalysts by solution combustion synthesis was investigated using varying molar ratios of glycine to oxidant. The effect of varying the fuel amount on morphology, phase composition, surface area, crystallite size, elemental distribution, and coordination environment around V was investigated. The results showed that the morphology, surface area, and crystallite size are all dependent on the flame temperature during the combustion process, which is dependent on the amount of fuel added. Results also suggested that adding glycine in excess lowers the combustion temperature. The catalysts were tested for the ODH of n-octane. The catalyst with superior catalytic properties was the stoichiometric sample, in which equal molar ratios of the fuel and oxidizer were added. The better catalytic performance was related to the contribution of the VOx species from the magnesium vanadate phase. This is the only sample in which vanadates were detected. Catalysts synthesized under fuel-lean and fuel-rich conditions were characterized by large crystallites and the absence of detectable magnesium vanadates, using XRD.

1. Introduction

Solution combustion synthesis (SCS) parameters such as the ignition temperature, initial concentration of the solution, types of fuel, and oxidant-to-fuel ratios can be used to control the SCS mode of combustion, i.e., smoldering, volume, and self-propagating combustion [1,2,3,4]. The fuel-to-oxidant molar ratios determine the flame temperature and the contribution of the surrounding atmospheric oxygen [5]. This, in turn, influences the structural and surface properties of solution combustion products [6,7]. A stoichiometric composition of the redox mixture is attained when no molecular oxygen is required. Fuel lean conditions are achieved when the fuel-to-oxidant ratio is below one, and thus, molecular oxygen is produced. Under fuel-rich conditions, the fuel-to-oxidant ratio is above 1. In this regime, molecular oxygen is required to drive the redox reaction [6]. The effect of varying the fuel-to-oxidant ratios on the reaction enthalpy is reported elsewhere [8]. Under fuel-lean conditions, the reaction was initially endothermic before it became exothermic. However, under fuel-rich conditions, maximum energy was released [6,9]. Phase differences, abundance, flame temperature, and combustion velocity can be controlled by varying the fuel amount [8]. The surface areas of synthesized materials are also affected by the fuel content. Generally, with fuel-rich conditions, low-surface-area material is obtained. This is attributed to the high flame temperatures, resulting in sintering and grain growth [2,10]. Other properties, such as the bulk crystallite size, morphology, and defects (oxygen vacancies), are also reported to be affected by this parameter [11].
Glycine is one of the most popular fuels used in the preparation of mixed metal oxides. It is generally chosen based on its bi-functionality, as it serves both as a fuel (reducer) and as a complexing agent, which is important to prevent heterogeneous precipitation of individual components before combustion [12]. Its easy availability and low cost have also been listed as one of the reasons. The synthesis of VOx/MgO catalysts, as well as their application in the oxidative dehydrogenation (ODH) of n-octane, has been reported [13,14]. The effect of varying the fuel type on the combustion characteristics and how these affect powder properties was also investigated [15]. In these studies, glycine imparted superior powder properties. This included the formation of bi-phasic vanadates, low crystallite sizes, high surface area, and the presence of defect sites. This was also evident in the activation of n-octane, where better selectivity towards octenes and aromatics was achieved when glycine was used as a fuel compared to the others.
An influence on powder properties is due to the varying combustion temperatures, attained as the fuel-to-oxidant ratio is varied [16]. Combustion velocity is also influenced [17,18]. It is generally understood that under fuel-rich conditions, the reaction becomes more exothermic and the flame temperature increases [19]. However, there have also been reports of low temperatures in the case of glycine-rich conditions. For instance, Chick et al. [17] observed that during the synthesis of oxide ceramic powders, the highest flame temperature was attained at stoichiometric conditions. At ratios beyond that, the flame temperature began to decrease linearly. Both the fuel-rich and lean reactions gave temperatures several hundred degrees lower than the flame temperature at the stoichiometric ratio. This phenomenon was also reported by other authors [12,16,20,21].
One other feature that influences the flame temperature is the amount of gases generated during the combustion process. The general role of the evolved gases is to provide high surface areas and control the temperature rise [2,16]. They may also increase the specific volume of the material. The opposite effect has also been reported, where the increase in flame temperature has caused sintering and crystal growth, resulting in reduced surface areas and high crystallite sizes [22]. Fuel-lean samples showed the lowest crystallite sizes, attributed to low flame temperatures. This was explained by the presence of the oxidant in excess, which produced a sufficient amount of gases to cause heat dissipation. The rate of the reaction has also been monitored, as it would have an influence on crystal growth and sintering. Some authors reported that stoichiometric mixtures burnt instantly, while fuel-rich samples took a few seconds more to combust, with the reaction proceeding quite slowly [12]. To study the effect of varying the glycine fuel-to-oxidant ratios on the phase composition, elemental distribution, morphology, adiabatic flame temperature, crystallite size, surface area, and porosity, the ratios were varied from fuel-lean to fuel-rich during the synthesis of VOx/MgO catalysts in this study. Thus, this study aimed at understanding the nature of the combustion process under the aforementioned parameters and how it correlated with the powder characteristics of the catalysts.
Additionally, the ionic radius of V5+ lies close to the borderline between four-fold and six-fold coordination. As a consequence, vanadium-oxygen compounds exhibit a large variety of coordination polyhedra in which vanadium is surrounded by four, five, or six oxygen atoms. Electron–phonon interactions are usually rather strong in these compounds, giving rise to the formation of small polarons. Electronic properties, therefore, strongly depend on vanadium coordination. Glycine, with its reducing capabilities, is known to affect the oxidation state of the active metals and the environment around it as the fuel amount is varied. Hence, our interest lies in the coordination number and oxidation states of vanadium as the fuel amount was varied in each sample.
The ODH of n-octane was chosen for investigation in this study, as it is a medium-chain-length linear paraffin. These are abundant and of low value, while valorized products of these, such as octenes and C8 aromatics, offer a much higher value [23,24,25,26].

2. Results and Discussion

2.1. Thermodynamic Parameters

The ratios of fuel to NH4VO3 are described by Equations (S1) to (S5) in the Supplementary Information. Using these equations, the adiabatic flame temperatures and moles of gases evolved were established. In the glycine-richest sample, with the highest fuel content, decomposition of the precursors occurred [20]. The reaction was still vigorous, as evidenced by sample sputtering inside the furnace, where some of the sample was ejected out of the combustion vessel. This is characteristic of glycine; its volume combustion is known to be explosive, with no flame; however, it results in the formation of high-surface-area powders, with soft agglomerates [27]. Therefore, the richer the fuel, the slower the reaction rate, and the lower the maximum temperatures reached [3]. To understand the variation in adiabatic flame temperature with the fuel amount, T(ad) was calculated at different glycine-to-magnesium nitrate molar ratios. The calculated adiabatic temperatures are given in Table 1. For these calculations, all the combustion reactions were assumed to be complete, and that the excess fuel would be oxidized by atmospheric oxygen. The calculation report for these is included in the Supplementary Information.
The order of decreasing flame temperature from the fuel-lean to the fuel-rich regime is presented in Figure S1 of the Supplementary Information.
The data show that the calculated adiabatic temperatures increase from the fuel-leanest to the fuel-richest system. It is generally accepted that at fuel-lean conditions, the fuel amount is low; therefore, the heat evolved is not sufficiently high, and thus, the temperatures are lower [22]. This is called the SCS (smoldering combustion synthesis) mode. Fuel-rich conditions showed high adiabatic flame temperatures and high gas volumes. The synergistic effect of the large amount of gases formed and the higher adiabatic flame temperature causes a decrease in the maximum temperature, changing the mode of combustion from volume combustion synthesis (VCS) to smoldering [19]. Also, as more gases are released, agglomerates tend to disintegrate and additional heat is carried from the system, hindering particle growth and therefore resulting in powders with high specific surface areas [28,29]. Dissipation of heat due to the large volumes of gases evolved when using a glycine-nitrate process is reported [30]. With glycine being bi-functional, that is, acting as both the fuel and the complexing agent, a further increase in the moles of the fuel results in an excess of organics. These organics could possibly quench the reaction, leading to lower flame temperatures and less exothermicity than expected. Xiao et al. [31] noted, however, that excess amounts of fuel resulted in lower combustion temperatures and lower crystallinity due to incomplete combustion caused by an insufficient amount of oxygen in the atmosphere. This is also consistent with Kumar et al. [32], who demonstrated that the synthesis of highly crystalline nanomaterials is due to the high-temperature reaction conditions provided by the exothermic reaction between the reactive groups (amino, hydroxyl, and carboxyl) from the fuel added and the oxygen obtained from the nitrate decomposition. Also, in the calculation of the adiabatic flame temperature, it is assumed that the combustion reaction is complete and that atmospheric oxygen burns the excess fuel. However, the diffusion of oxygen into the precursors can be sluggish, resulting in incomplete combustion [30]. There could also be a competition between the effect of the number of moles of the evolved gases and the combustion temperature in influencing the heat of combustion.

2.2. Elemental Composition

XRF was used to confirm the weight% of vanadium as V2O5, loaded on the catalyst. As observed in Table 2, the V2O5 weight% ranges from 13 to 16 wt%. Considering a theoretical loading of 15 wt%, in general, there is a good correlation of the vanadium loadings.
Table 3 gives the surface area of the synthesized materials. The stoichiometric sample (GLY-1) has the smallest crystallite size, based on MgO crystallites, while in comparison, the fuel-lean and fuel-rich samples are characterized by larger crystallites, with sample GLY-0.7 having the largest crystallite size. If we consider the major vanadate phase, as indicated in Table 3, GLY-1 and GLY-0.7 show the smallest crystallite size; however, the phase for GLY-1 is the favored orthovanadate, whilst for the other samples, the metavanadate and pyrovanadte are the major phases.
Figure S2 (Supplementary Information) shows the BET N2 adsorption and desorption isotherms of the catalysts. Based on these type 2 isotherms, with H3 hysteresis loops, and a significant N2 uptake near the saturation point, all the samples are dominantly macroporous. Figure S3 (Supplementary Information) shows the pore size distribution for the samples. As this latter data is based solely on nitrogen adsorption, it is, at best, representative of the mesopores in the material.
Figure 1 shows the SEM images of the catalysts, which show variation in porosity and microstructure. The variation in morphology can be related to the amount of gas evolved during the synthesis. This, in turn, is associated with the amount of fuel used and the subsequent temperatures experienced. The amount of gases released was calculated using Equations (S1)–(S5) (Supplementary Information). It is evident that the different fuel-to-oxidant ratios generate different amounts of gases, which in turn affect the porosity of the material. Based on the SEM images (Figure 1), the increase in porosity appears to correlate with the increase in the amounts of gas evolved.
While total gas volume released during combustion synthesis does not change significantly with the fuel ratio, the rate of gas evolution may. Higher fuel-to-oxidizer ratios lead to more vigorous, self-propagating combustion, followed by faster cooling, changes which significantly affect crystallite size and porosity. Although pore dimensions do not systematically shift with the fuel ratio, variations in reaction kinetics and heating rate modulate pore structure via rate-dependent gas release [33].
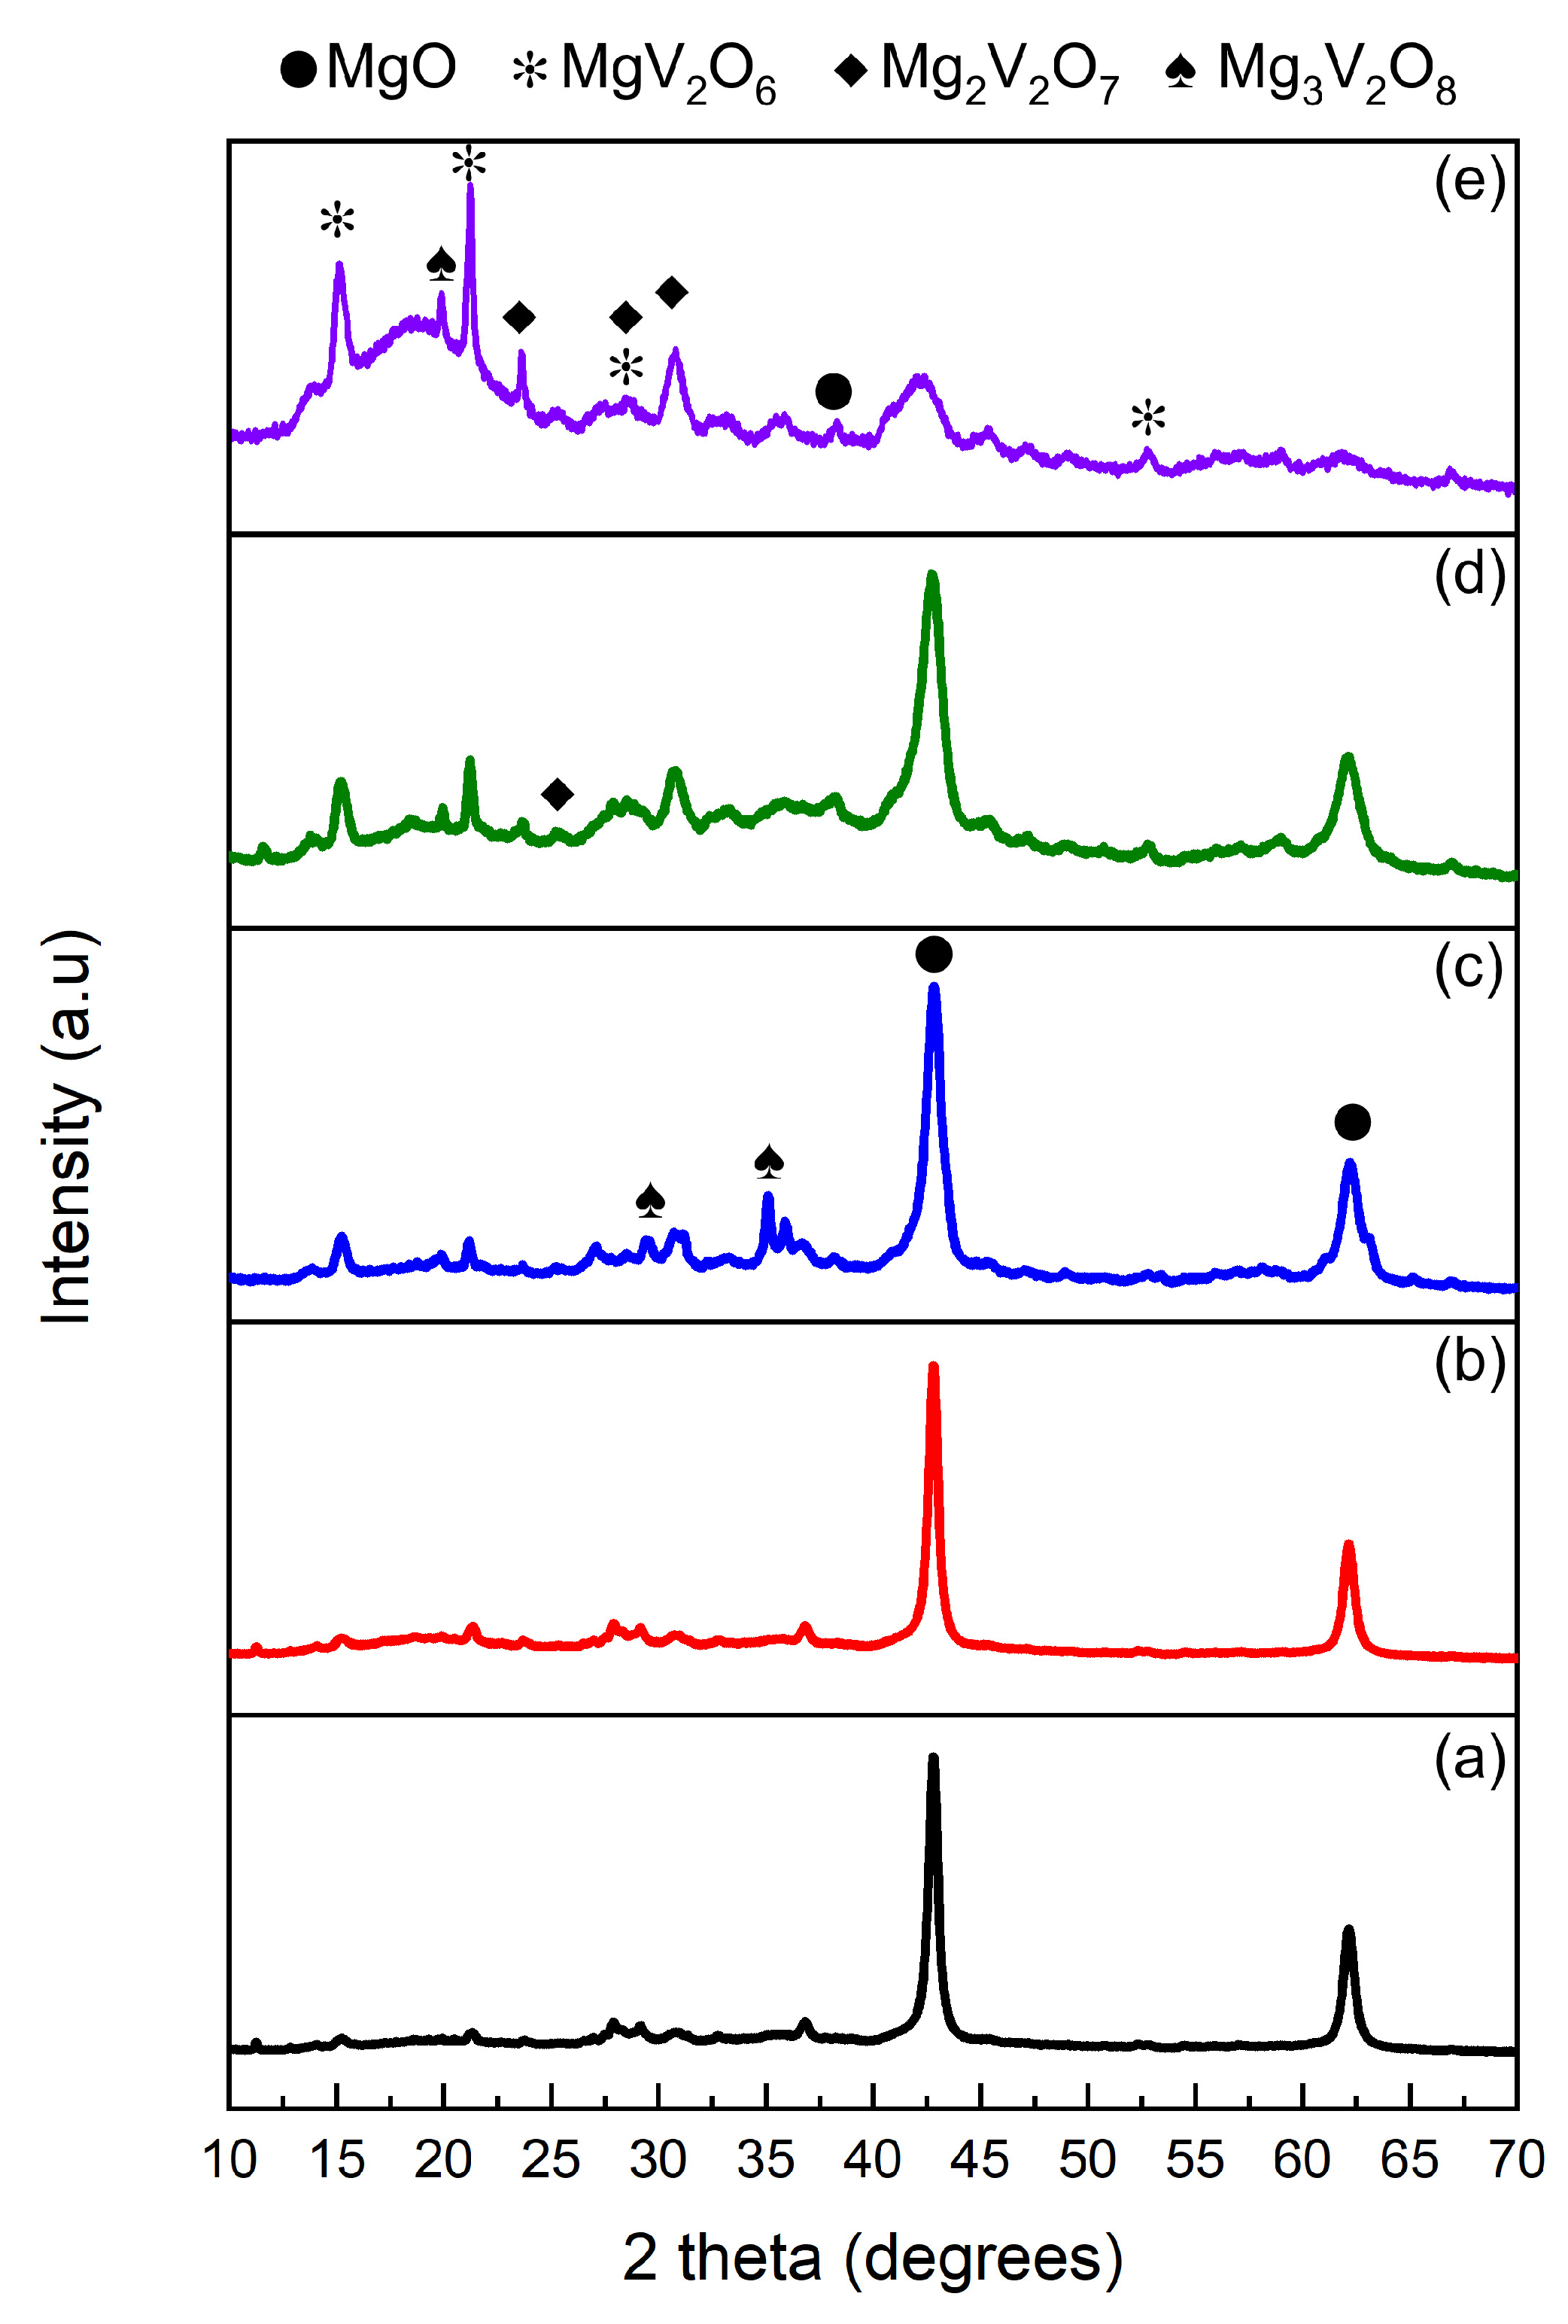
The X-ray diffractograms of the powders are presented in Figure 2. It has previously been reported that phase differences can be controlled by varying the fuel content [8,10]. The diffraction patterns of all the samples, except for the GLY-1.6, show dominant peaks attributed to magnesium oxide found at 2θ values of 44.3° and 62.5°. The GLY-1 sample was previously synthesized in a study where the presence of both magnesium orthovanadate and magnesium pyrovanadate was confirmed [14,15]. However, as indicated in Figure 2, magnesium orthovanadate appears to display as dominant peaks for GLY-1. Diffraction lines, corresponding mainly to magnesium metavanadate and pyrovanadate phases, were observed for the other samples. Although they have low intensities, they are approximated to be the major phases. The low intensities are an indication that the vanadate phases are either highly dispersed, microcrystalline, or below the detection limit. These peaks are expected to appear generally between 20 and 40° 2θ [34,35,36].
The fuel-lean and fuel-leaner synthesized samples showed very sharp peaks, indicative of relatively higher crystallinity and large crystallite sizes; however, these peaks are related to MgO. Another important feature is the increase in the intensities of the vanadate peaks as more fuel is added. Murugan et al. [20] attributed this effect to the fact that increasing the glycine mole ratio results in an excess of organics, which quenches the combustion process, leading to lower flame temperatures. On the other hand, Lima et al. [16] noted that the calculations used to estimate the flame temperatures assumed that atmospheric oxygen is responsible for the combustion of the excess glycine, yet burning excess fuel using atmospheric oxygen is not efficient, owing to its low diffusion and factors involving heterogeneity.

2.3. Scanning Transmission Electron Microscopy–Electron Energy Loss Spectroscopy
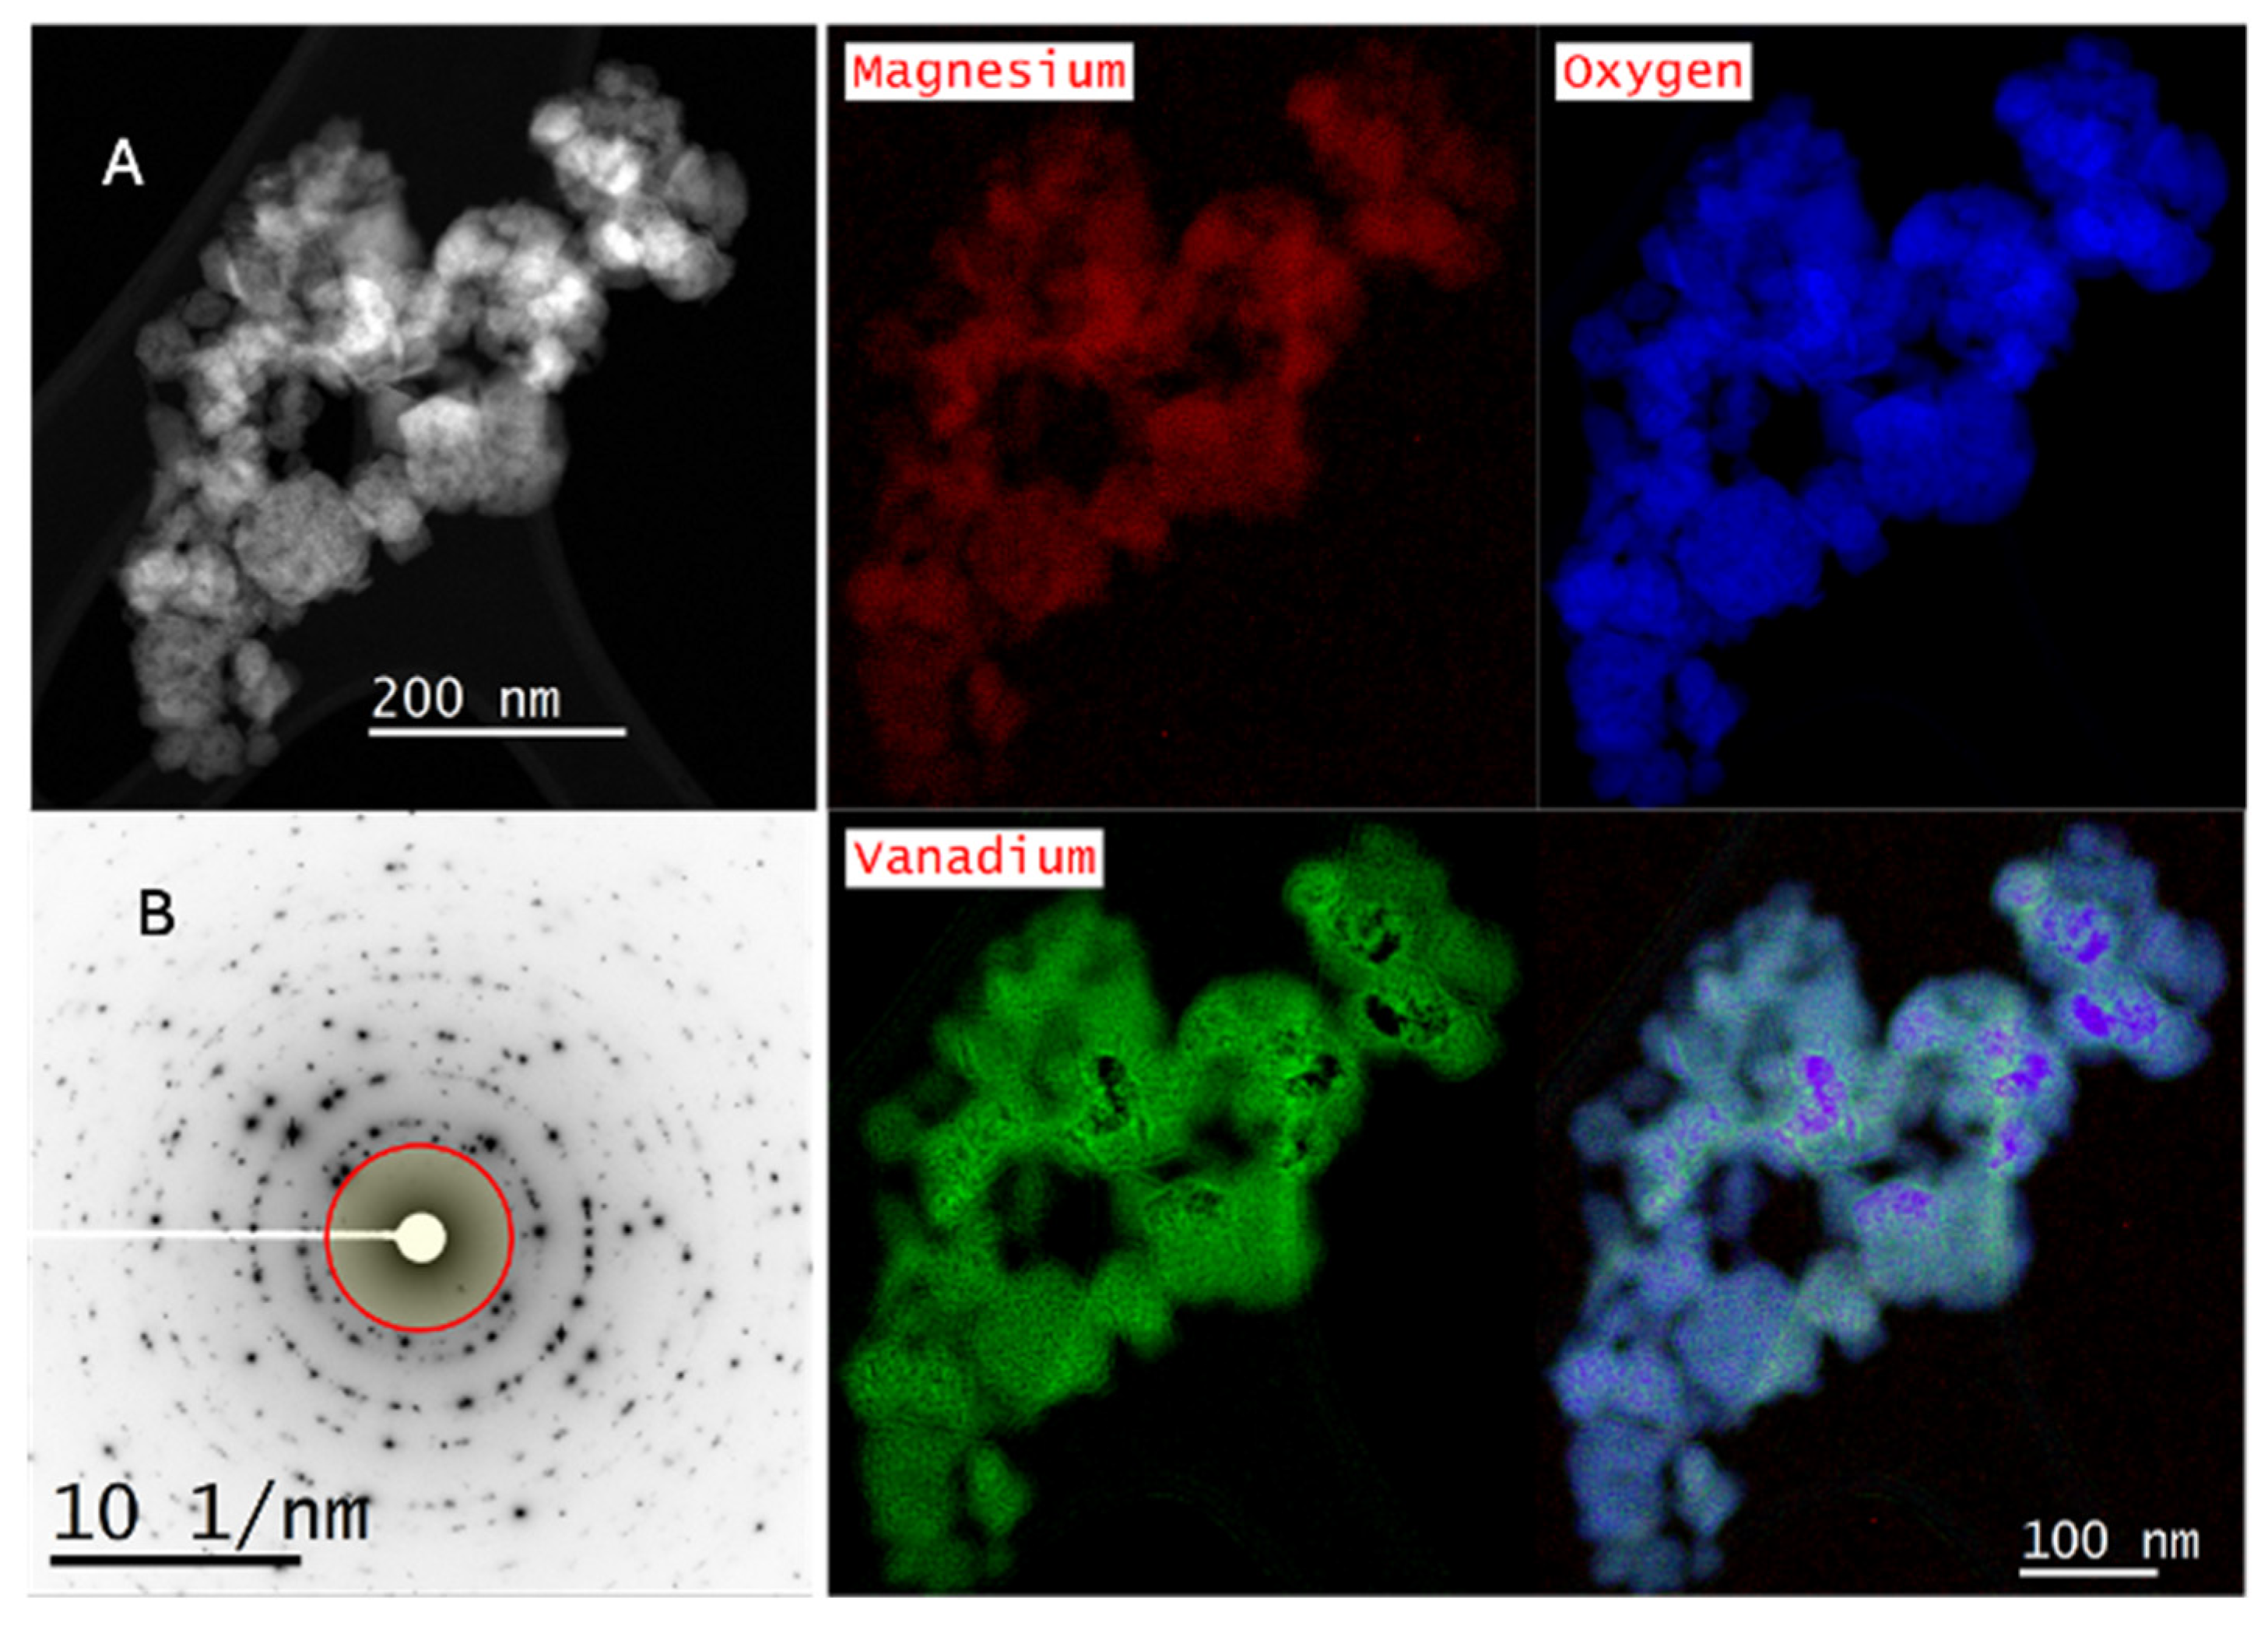
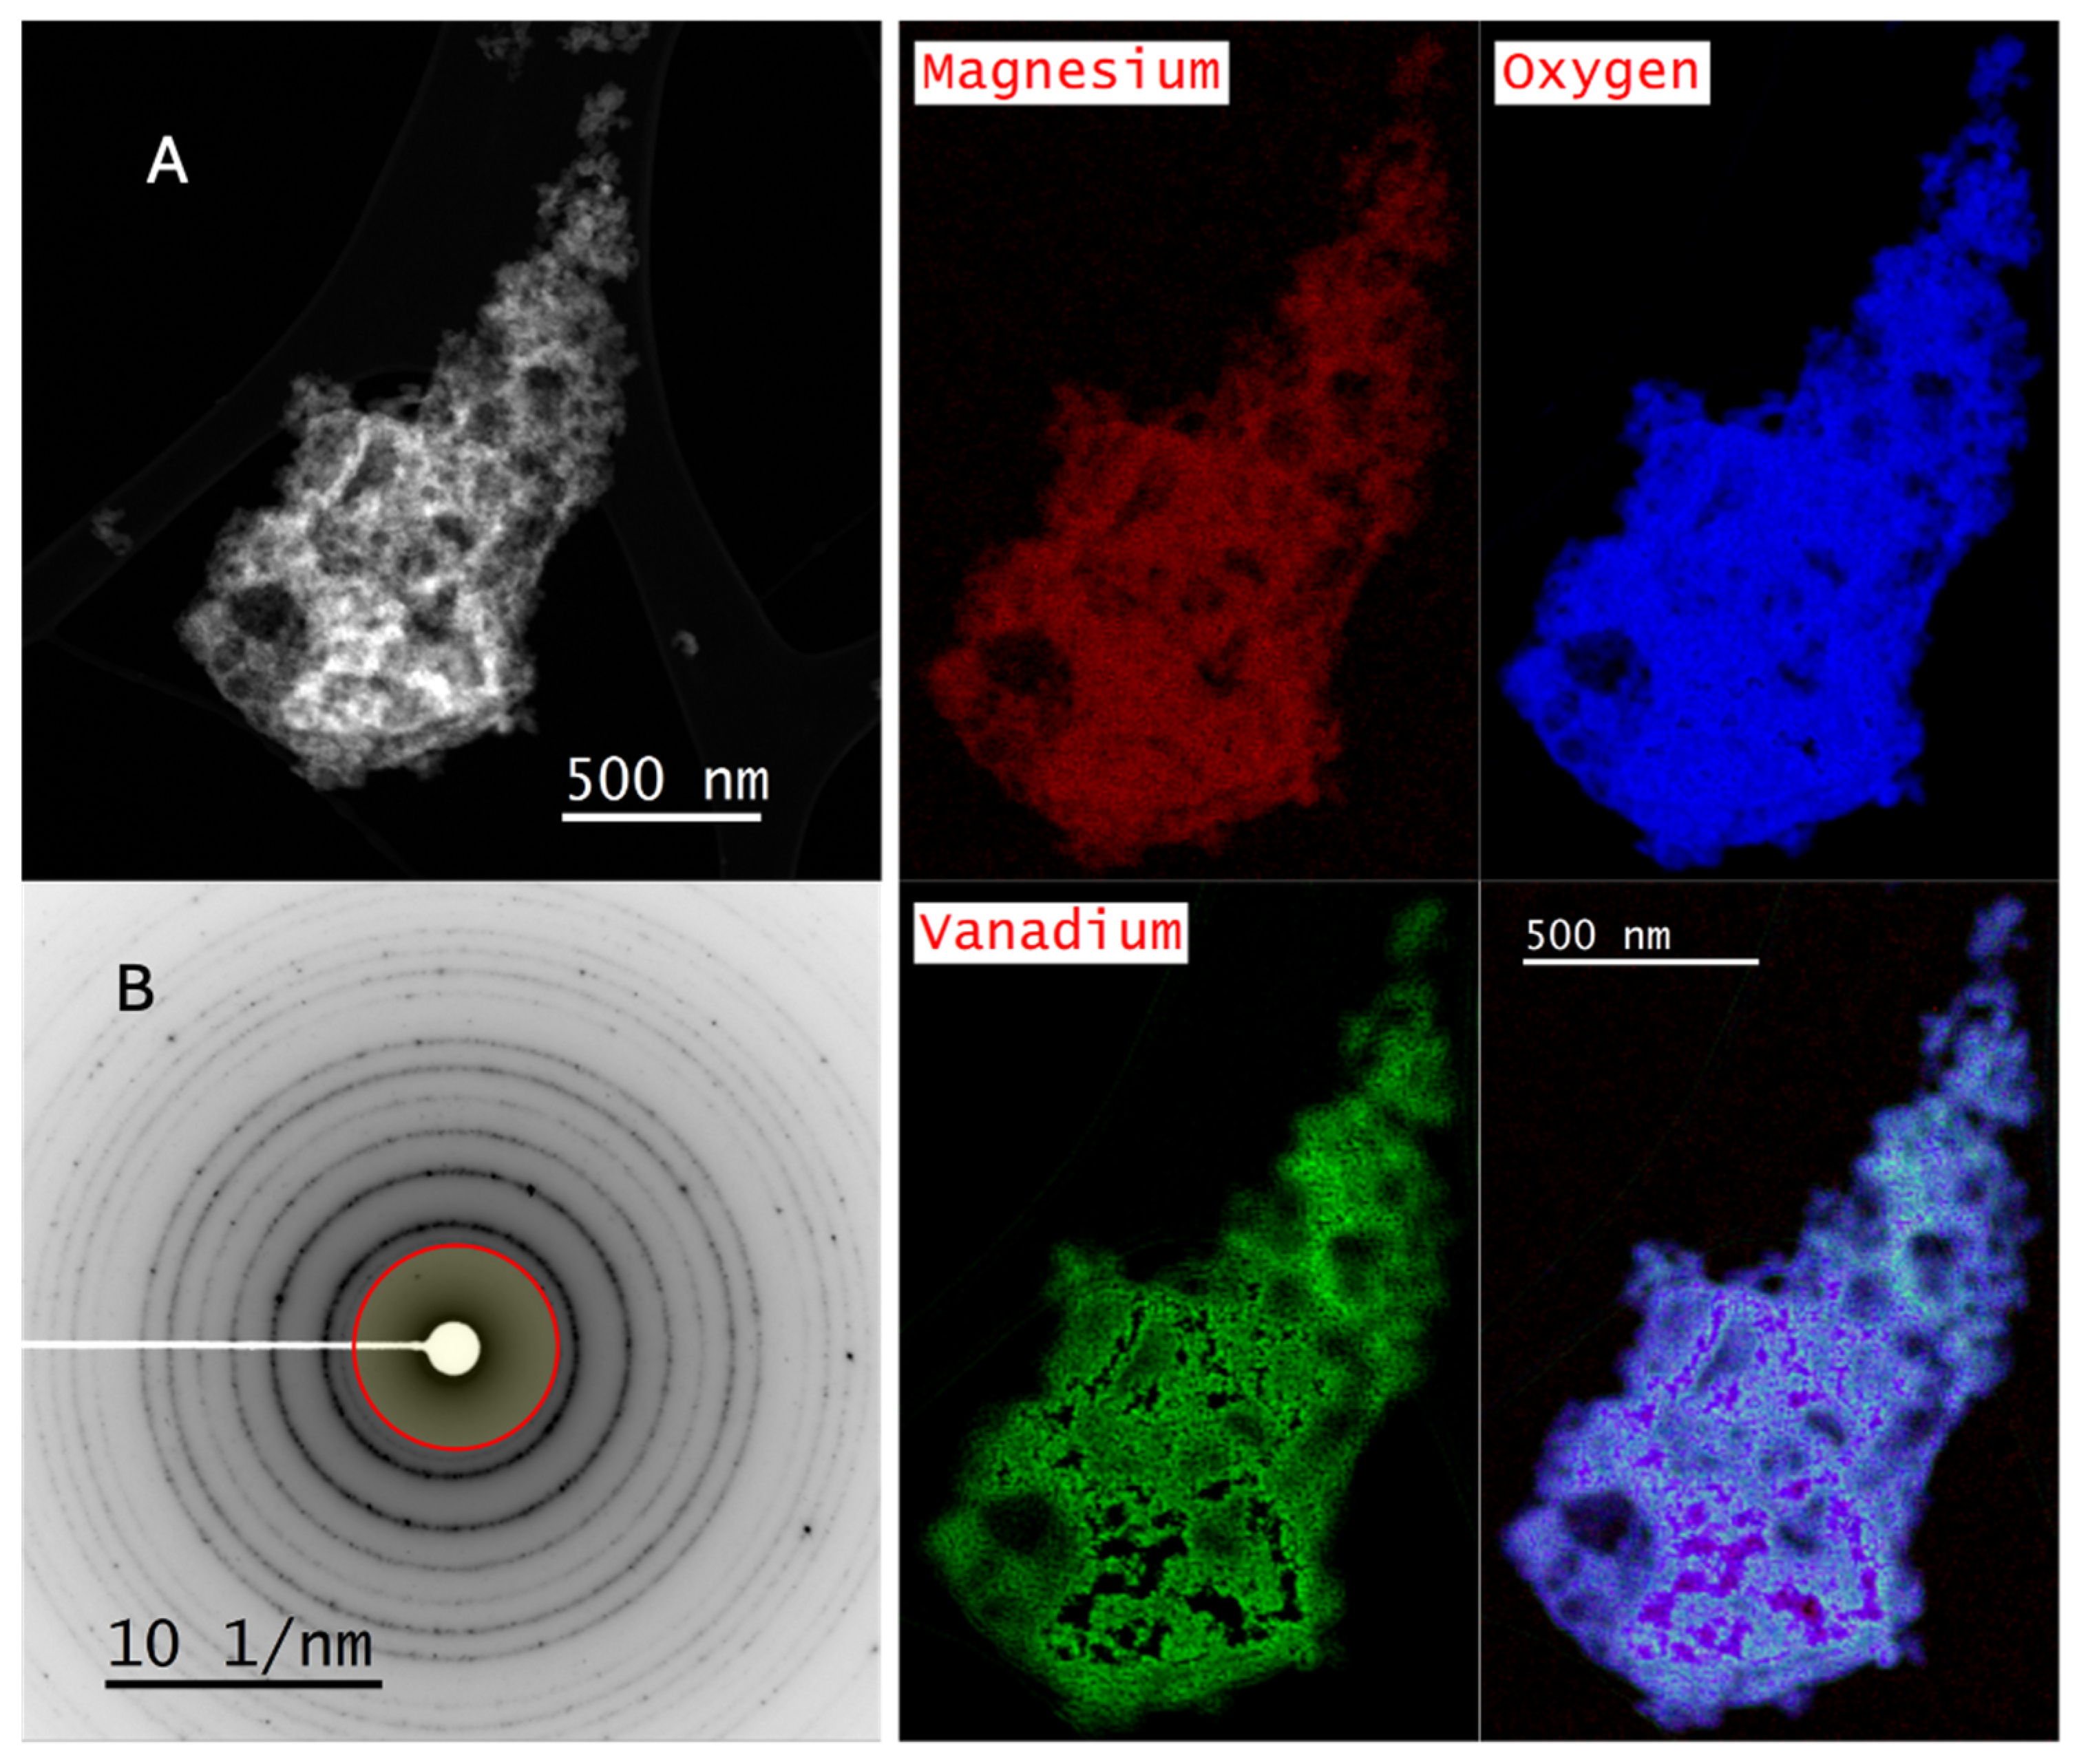
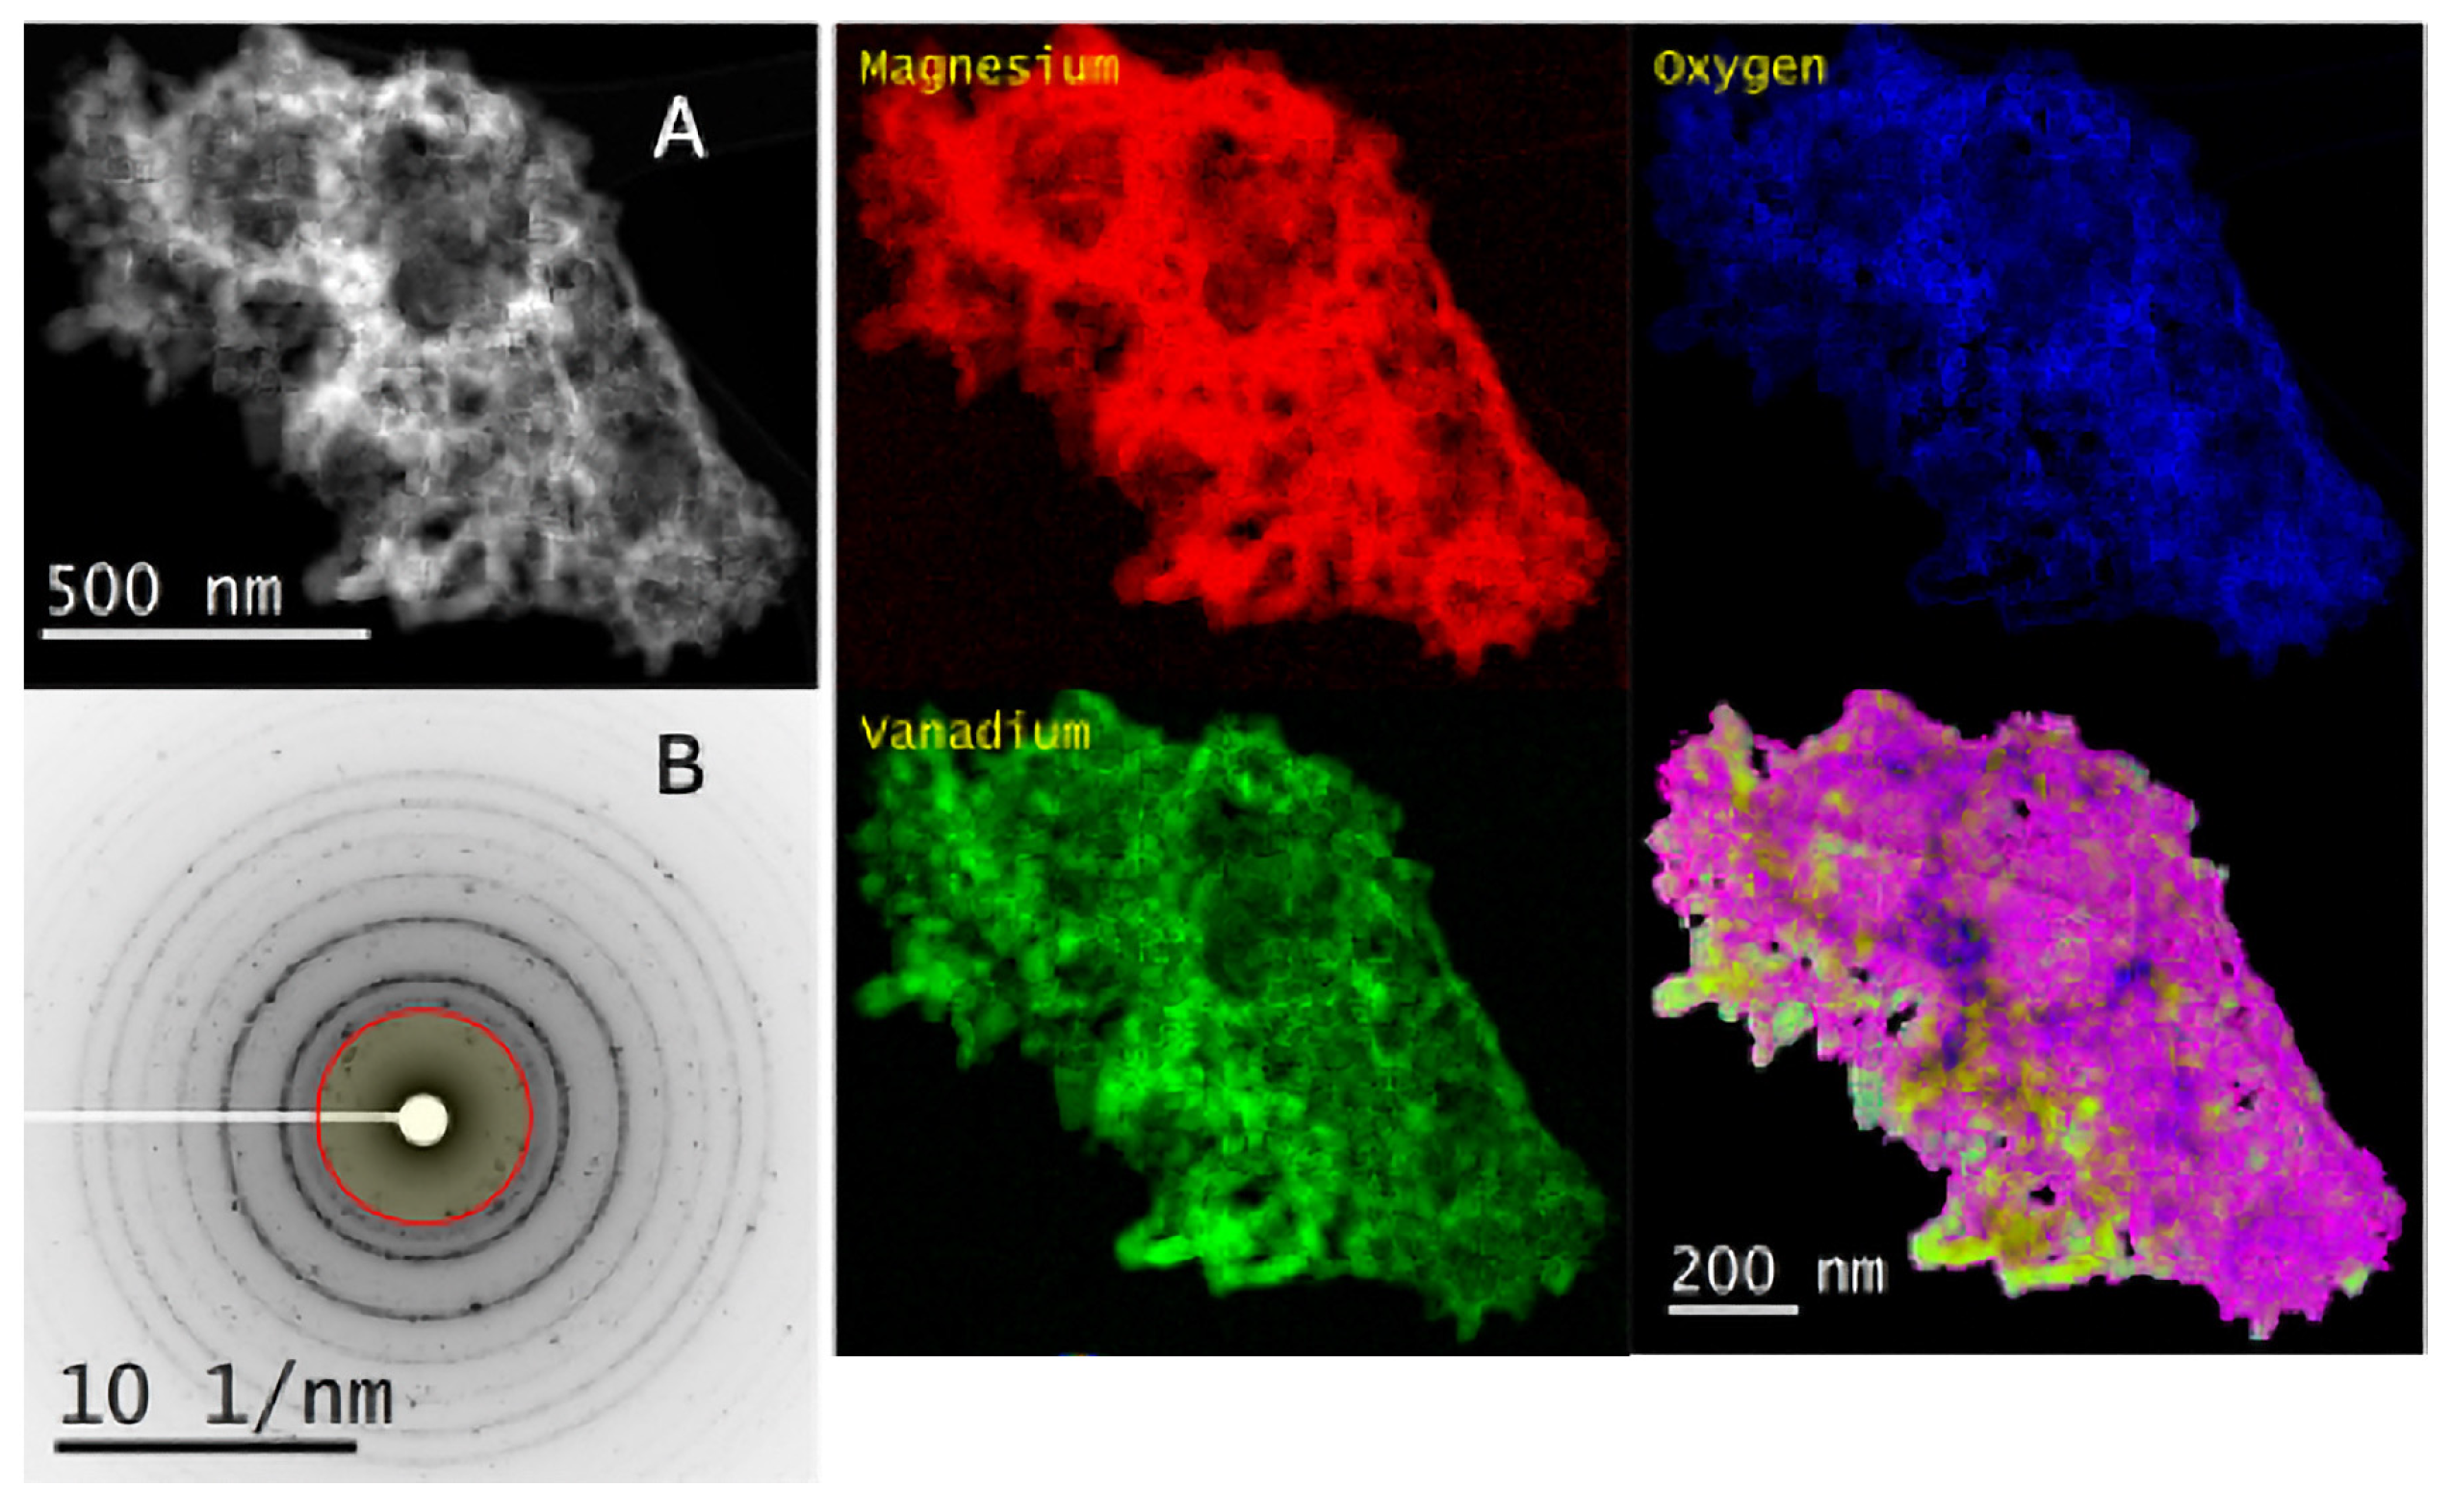
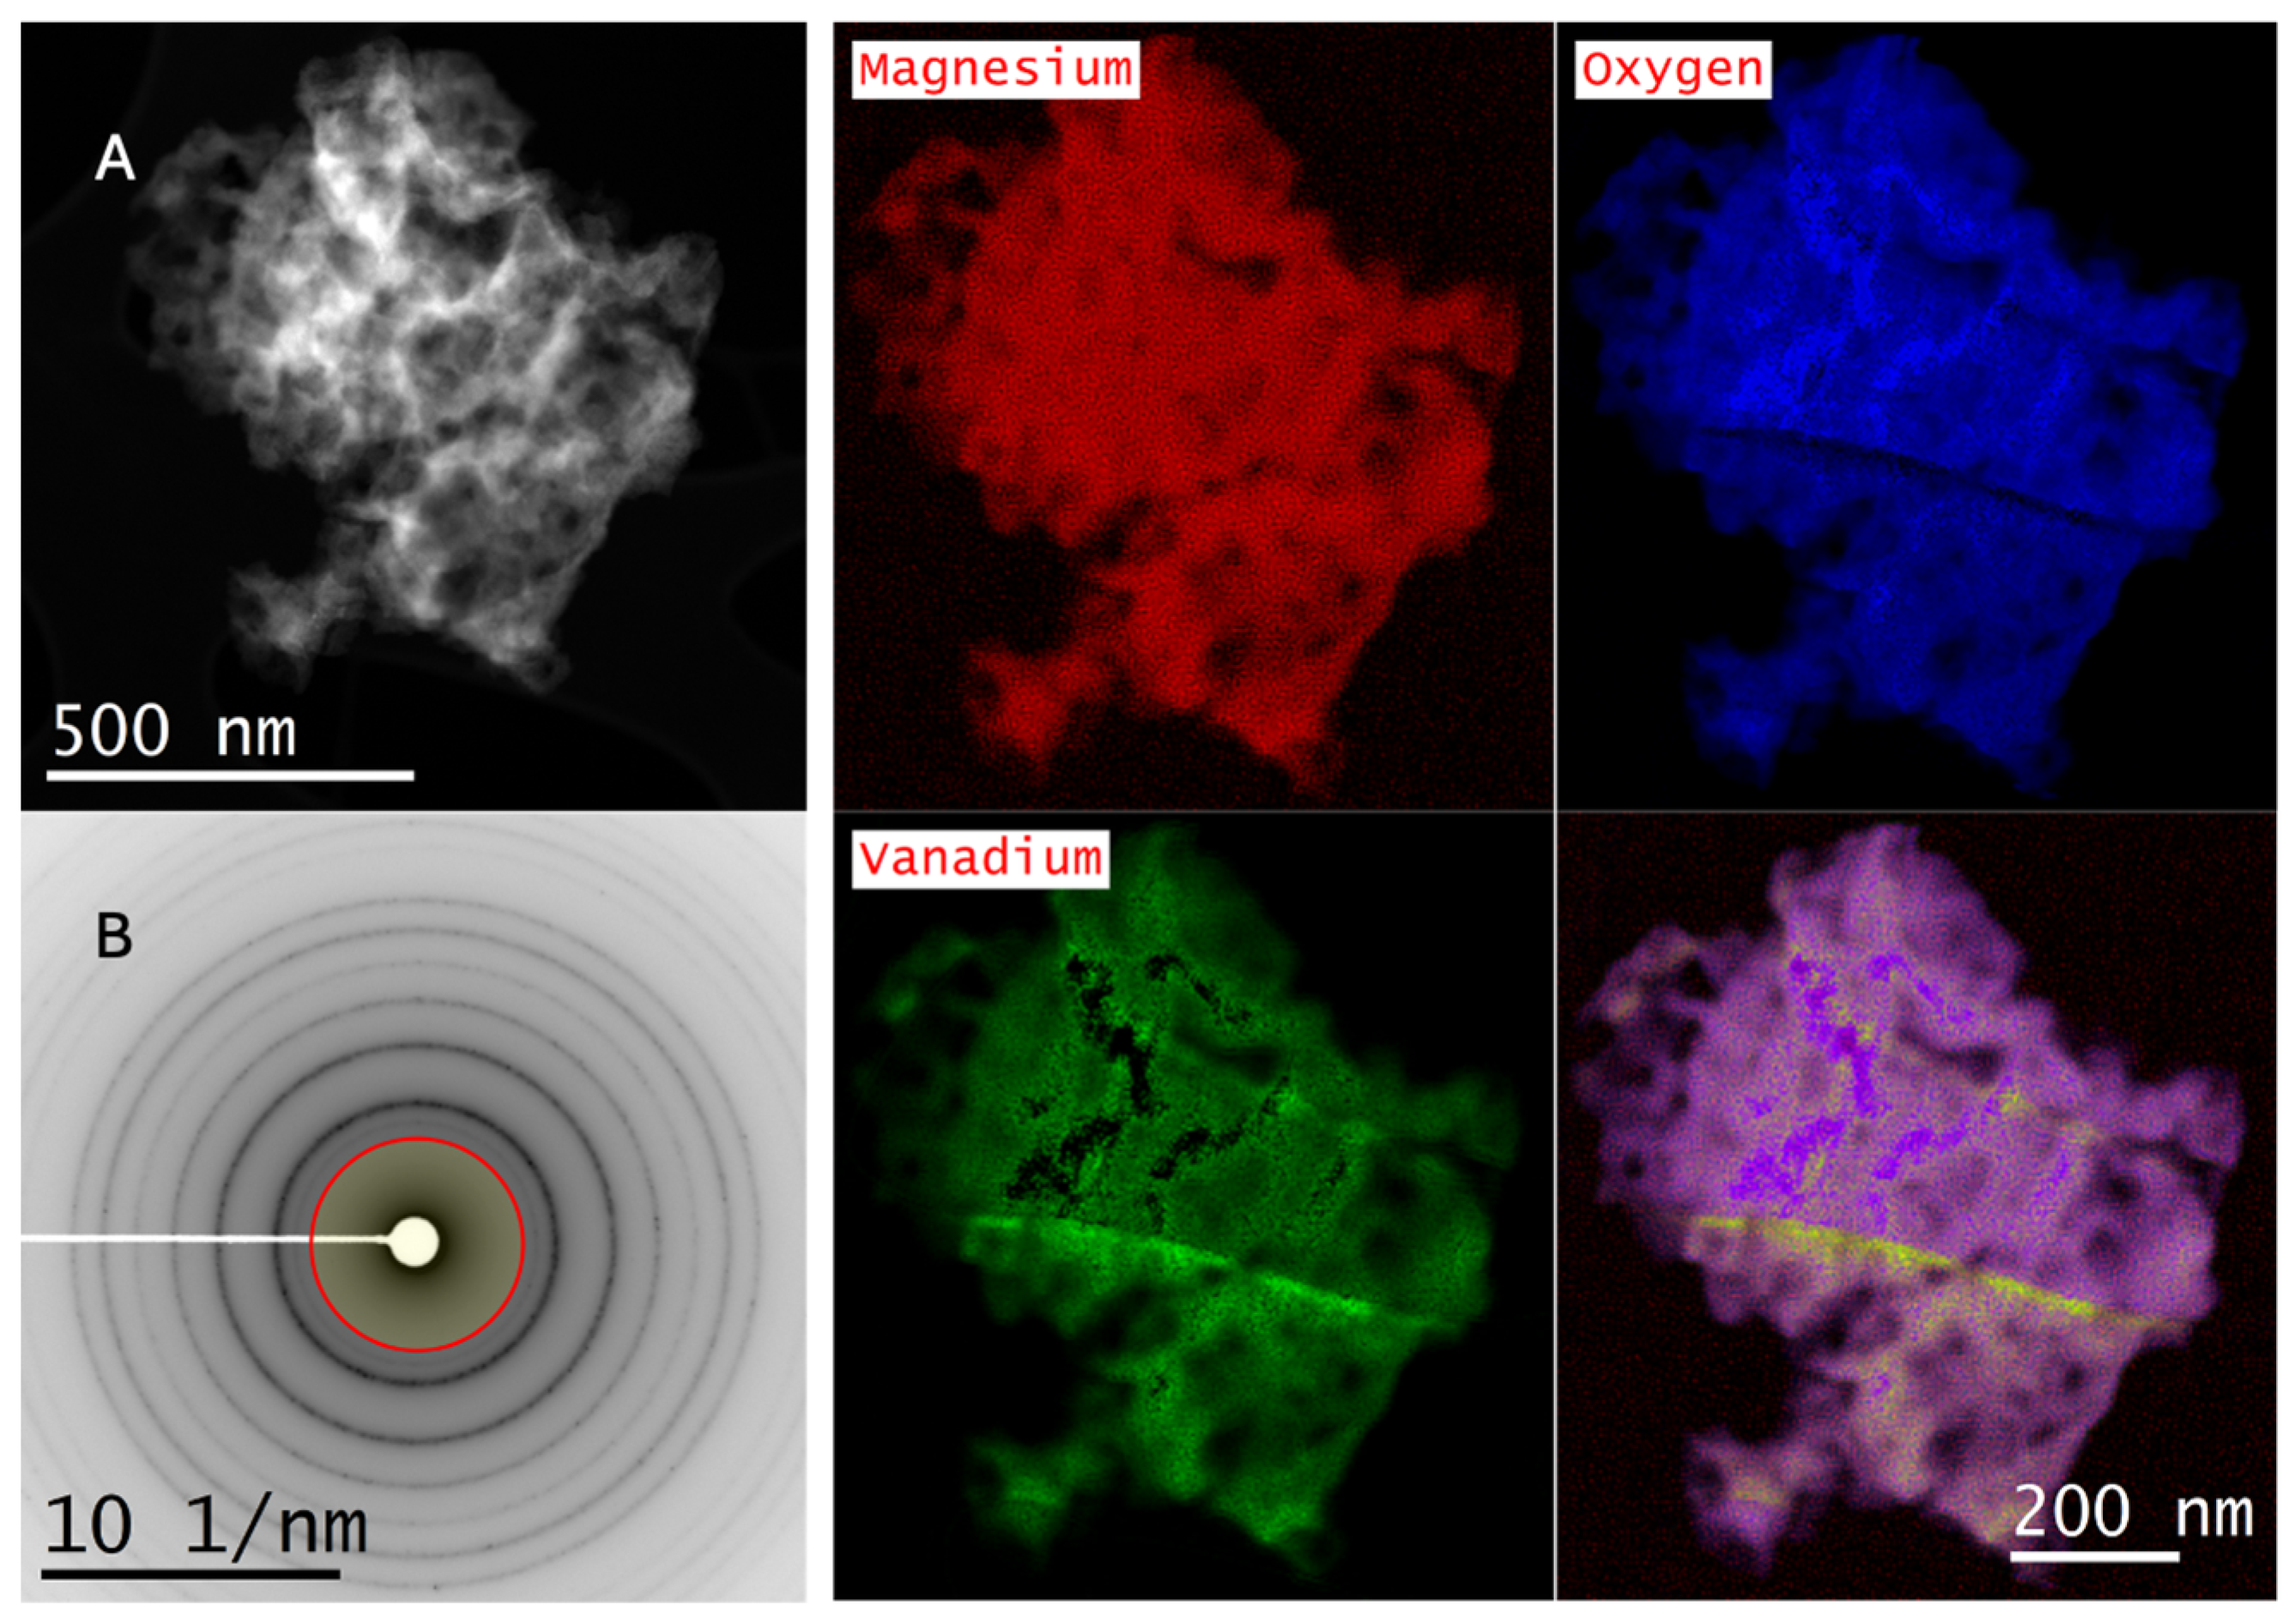
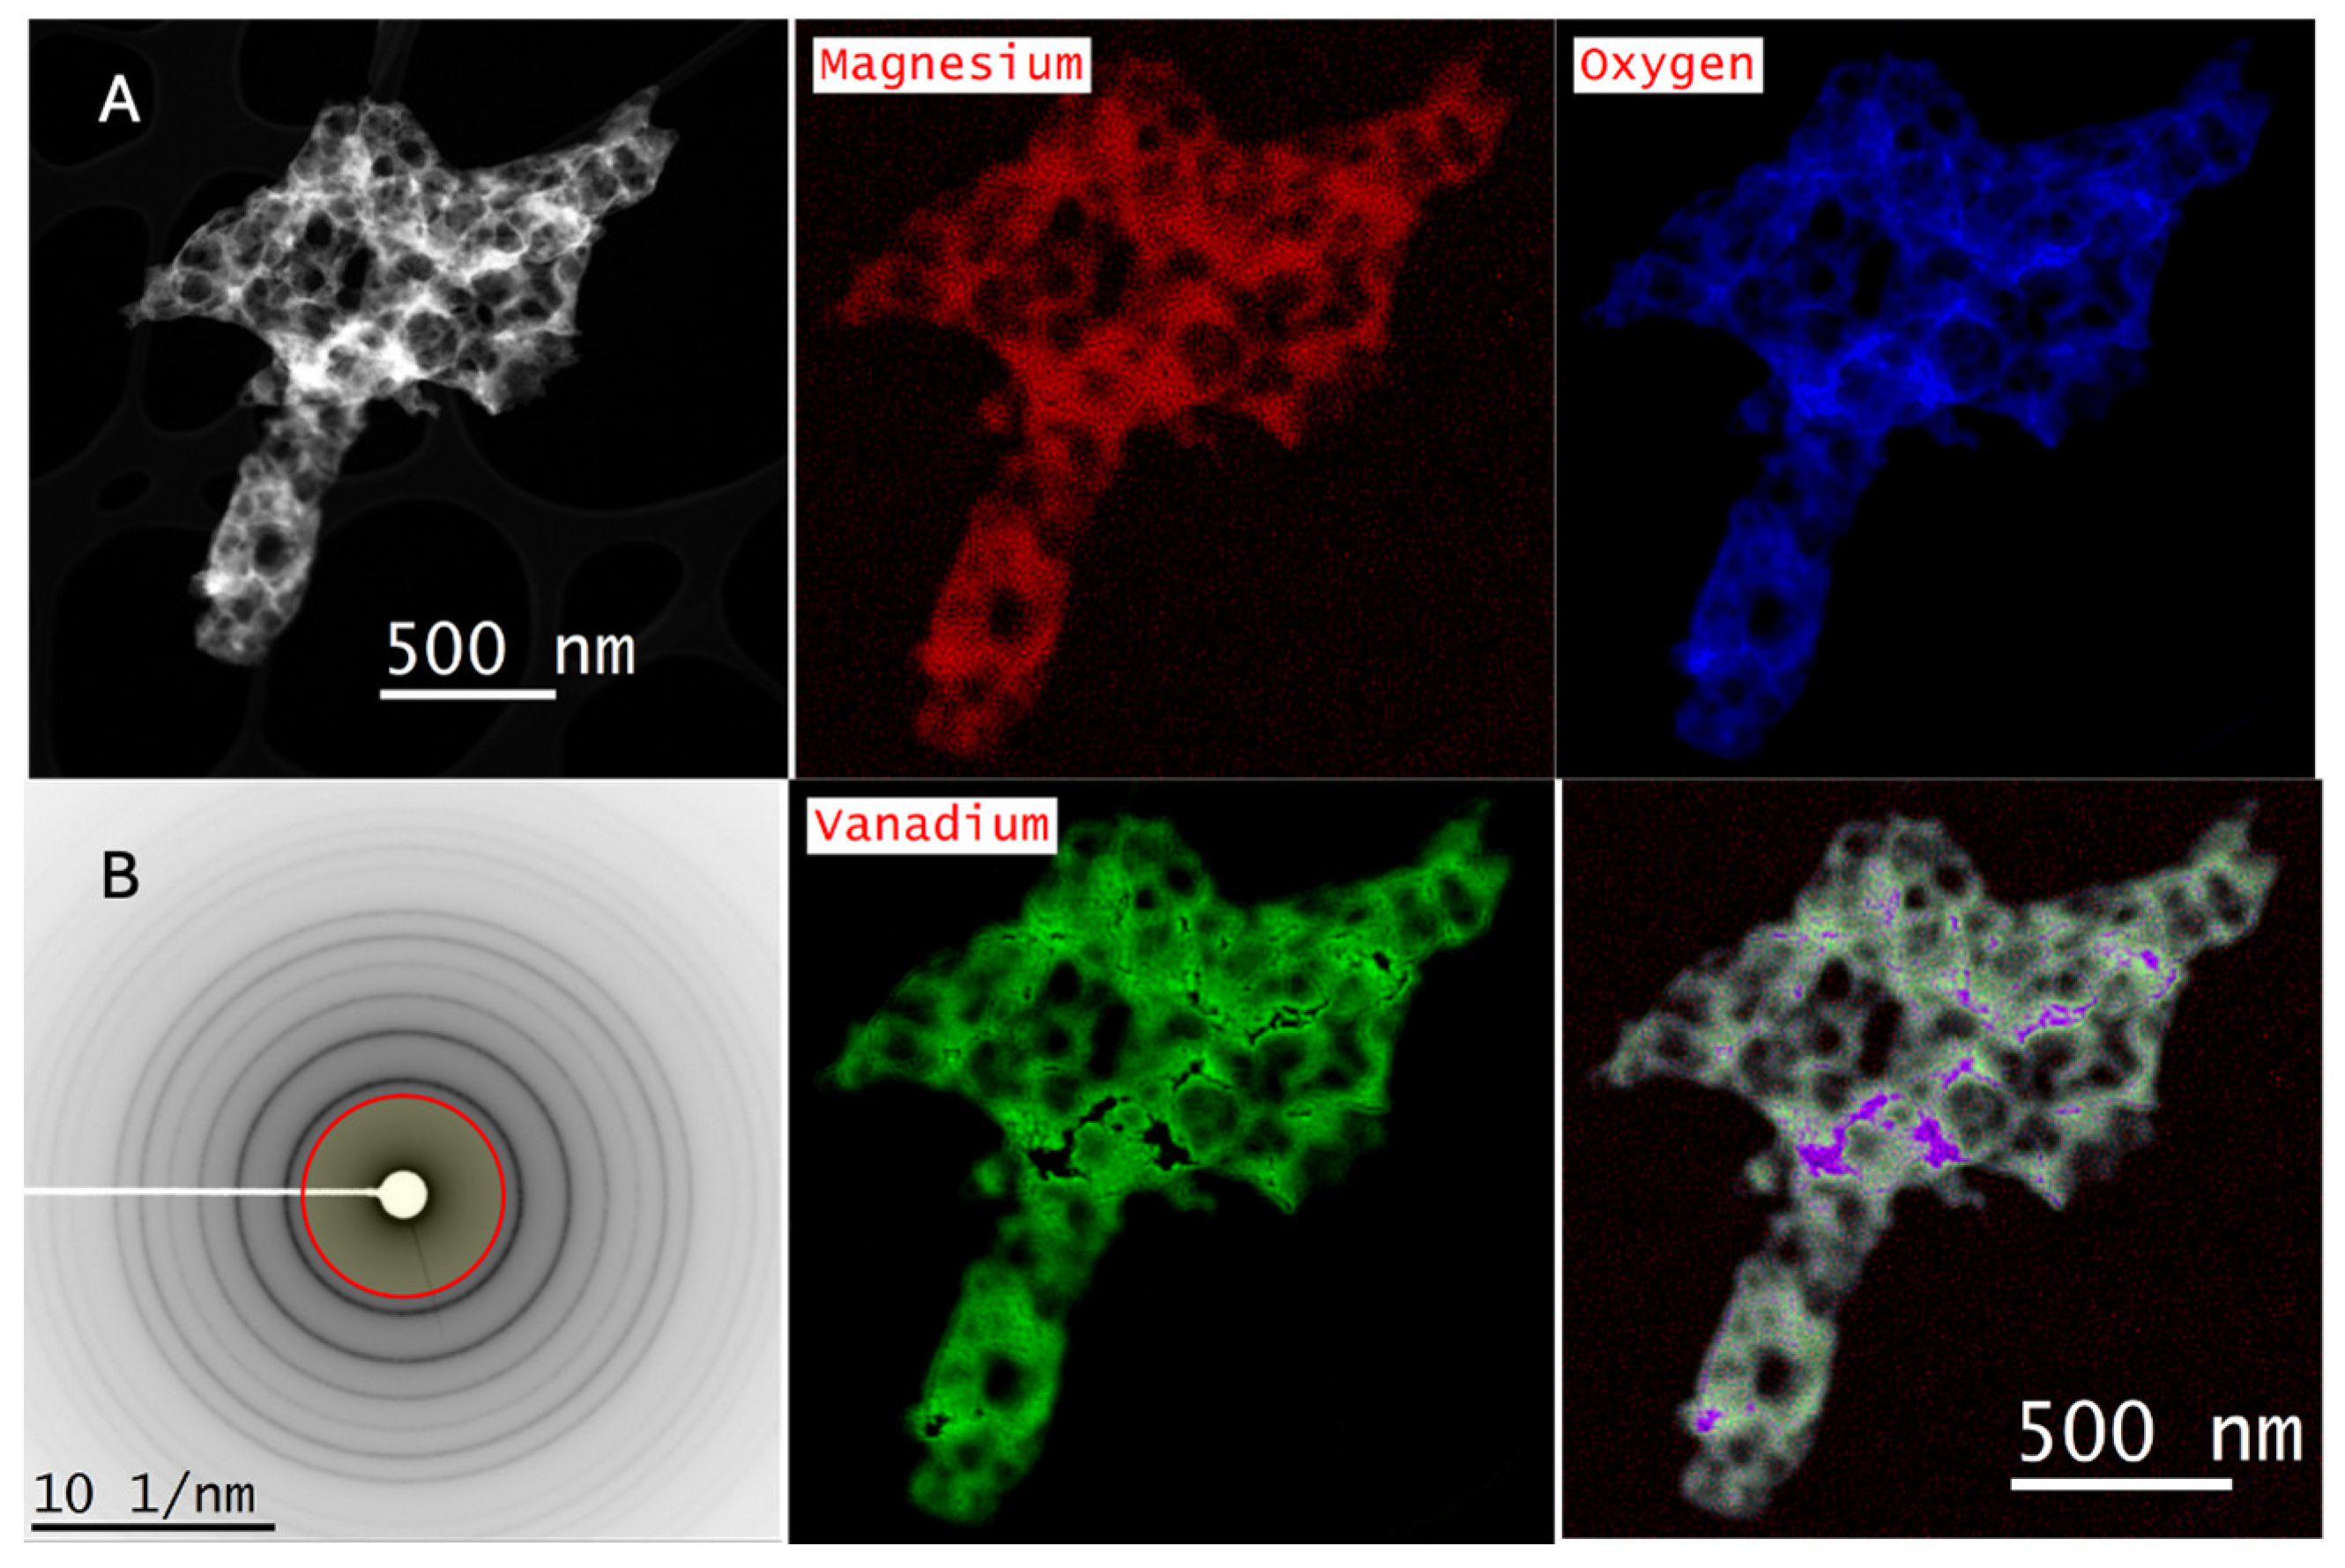
Figure 3 and Figure 4 show scanning transmission electron microscopy–electron energy loss spectroscopy (STEM-EELS) images, along with maps of the distribution of Mg, O, and V, and a false color overlay of Mg, O, and V distribution for the samples GLY-0.7 and 0.9. These samples show a uniform distribution of V within the area of study and display nanocrystallinity. The diffraction spots in the SAED image are consistent with magnesium vanadate formation. This is consistent, especially for the GLY-0.9 sample, with data obtained from Raman analysis.
Figure 3. EELS spectrum image (A), SAED pattern, and elemental distribution maps (B) generated from STEM-EELS analysis for GLY-0.7.
Inorganics 13 00389 g003
Figure 4. EELS spectrum image (A), SAED pattern, and elemental distribution maps (B) generated from STEM-EELS analysis for GLY-0.9.
Inorganics 13 00389 g004
Figure 5 shows the result of a STEM-EELS spectrum imaging study of a representative area in GLY-1, as well as elemental distribution maps for Mg, O, and V, which are shown along with V concentration and a false color overlay of the distribution maps.
Figure 5. EELS spectrum image (A), SAED pattern, and elemental distribution maps (B) generated from STEM-EELS analysis for GLY-1.
Inorganics 13 00389 g005
Figure 6 and Figure 7 show STEM-EELS spectrum images (A), along with maps of the distribution of Mg, O, and V and a false color overlay of Mg, O, and V distribution for the GLY-1.3 and GLY-1.6 catalysts, respectively. The diffraction patterns (concentric rings in the SAED) of these samples indicated amorphous phases, with very little indication of order or crystallinity. The EELS spectrum showed a clear separation of the vanadium and magnesium. The absence of spots made it difficult to index the magnesium vanadate phases.

2.4. X-Ray Absorption Near-Edge Structure (XANES)

The relationship between the coordination structure and the catalytic properties of V/MgO catalysts is crucial for the catalytic applications of these materials. Vanadium speciation (oxidation state and local environment/symmetry) can be better understood using XANES [37]. The literature suggests that the best method to evaluate both the oxidation state of vanadium and symmetry consider the pre-edge peak area or intensity and its centroid energy position [38]. In various studies, the oxidation state of vanadium is determined by using the position of the absorption edge, as with an increase in the valence state, it shifts to higher energies. Also, the intensity of the pre-edge (1s core levels to the empty 3d levels) peak is used to qualitatively obtain information on the symmetry [39,40]. For octahedral symmetry (Oh), the pre-edge peak intensity will be zero around the absorber atom, whereas it will have a higher intensity in the case of tetrahedral symmetry (Td) [38]. In our study, normalized pre-edge peak information is used to evaluate the local symmetry around the V atom.
Figure 8 shows the stacked normalized XANES spectra for the vanadium samples under investigation. The pre-edge peak position depends on the oxidation state [39,41,42].
The absorption edge energy (5469 eV) was similar for samples GLY-0.7, GLY-0.9, GLY-1, and GLY-1.3, with a slight shift to lower energies observed for the GLY-1.6 sample (5468 eV). The differences in vanadium coordination environments at different fuel-to-oxidant ratios in solution combustion synthesis can be attributed to both thermal and kinetic factors. The fuel-to-oxidant ratio fundamentally controls the adiabatic flame temperature during combustion. GLY-1.6 has a higher glycine content, which leads to higher combustion temperatures and more reducing conditions, while GLY-0.7 with a lower glycine content will have lower temperatures and more oxidizing conditions [43]. We also observed this trend in increasing adiabatic temperature with an increase in fuel (Table 1). The combustion process involves rapid heating rates (>1000 °C/min) followed by quick cooling, creating kinetically modified phases rather than thermodynamically equilibrated structures. This is because higher temperatures (fuel-rich) promote rapid nucleation of specific vanadium oxide phases [43,44]. For all samples, the pre-edge peak around 5470 eV corresponds to V5+ in tetrahedral coordination, while the post-edge around 5480–5515 eV represents V4+/V5+ in octahedral environments. It is noteworthy that two peaks were observed in the post-edge region. The first peak at ~5488 eV represents single scattering from the oxygen atoms nearest to vanadium, and the second peak at ~5510 eV represents V-O-V multiple scattering. A tabulated summary can be found in Table S1 in the Supplementary Information.

2.5. Catalytic Testing

2.5.1. Product Selectivity at Iso-Conversion
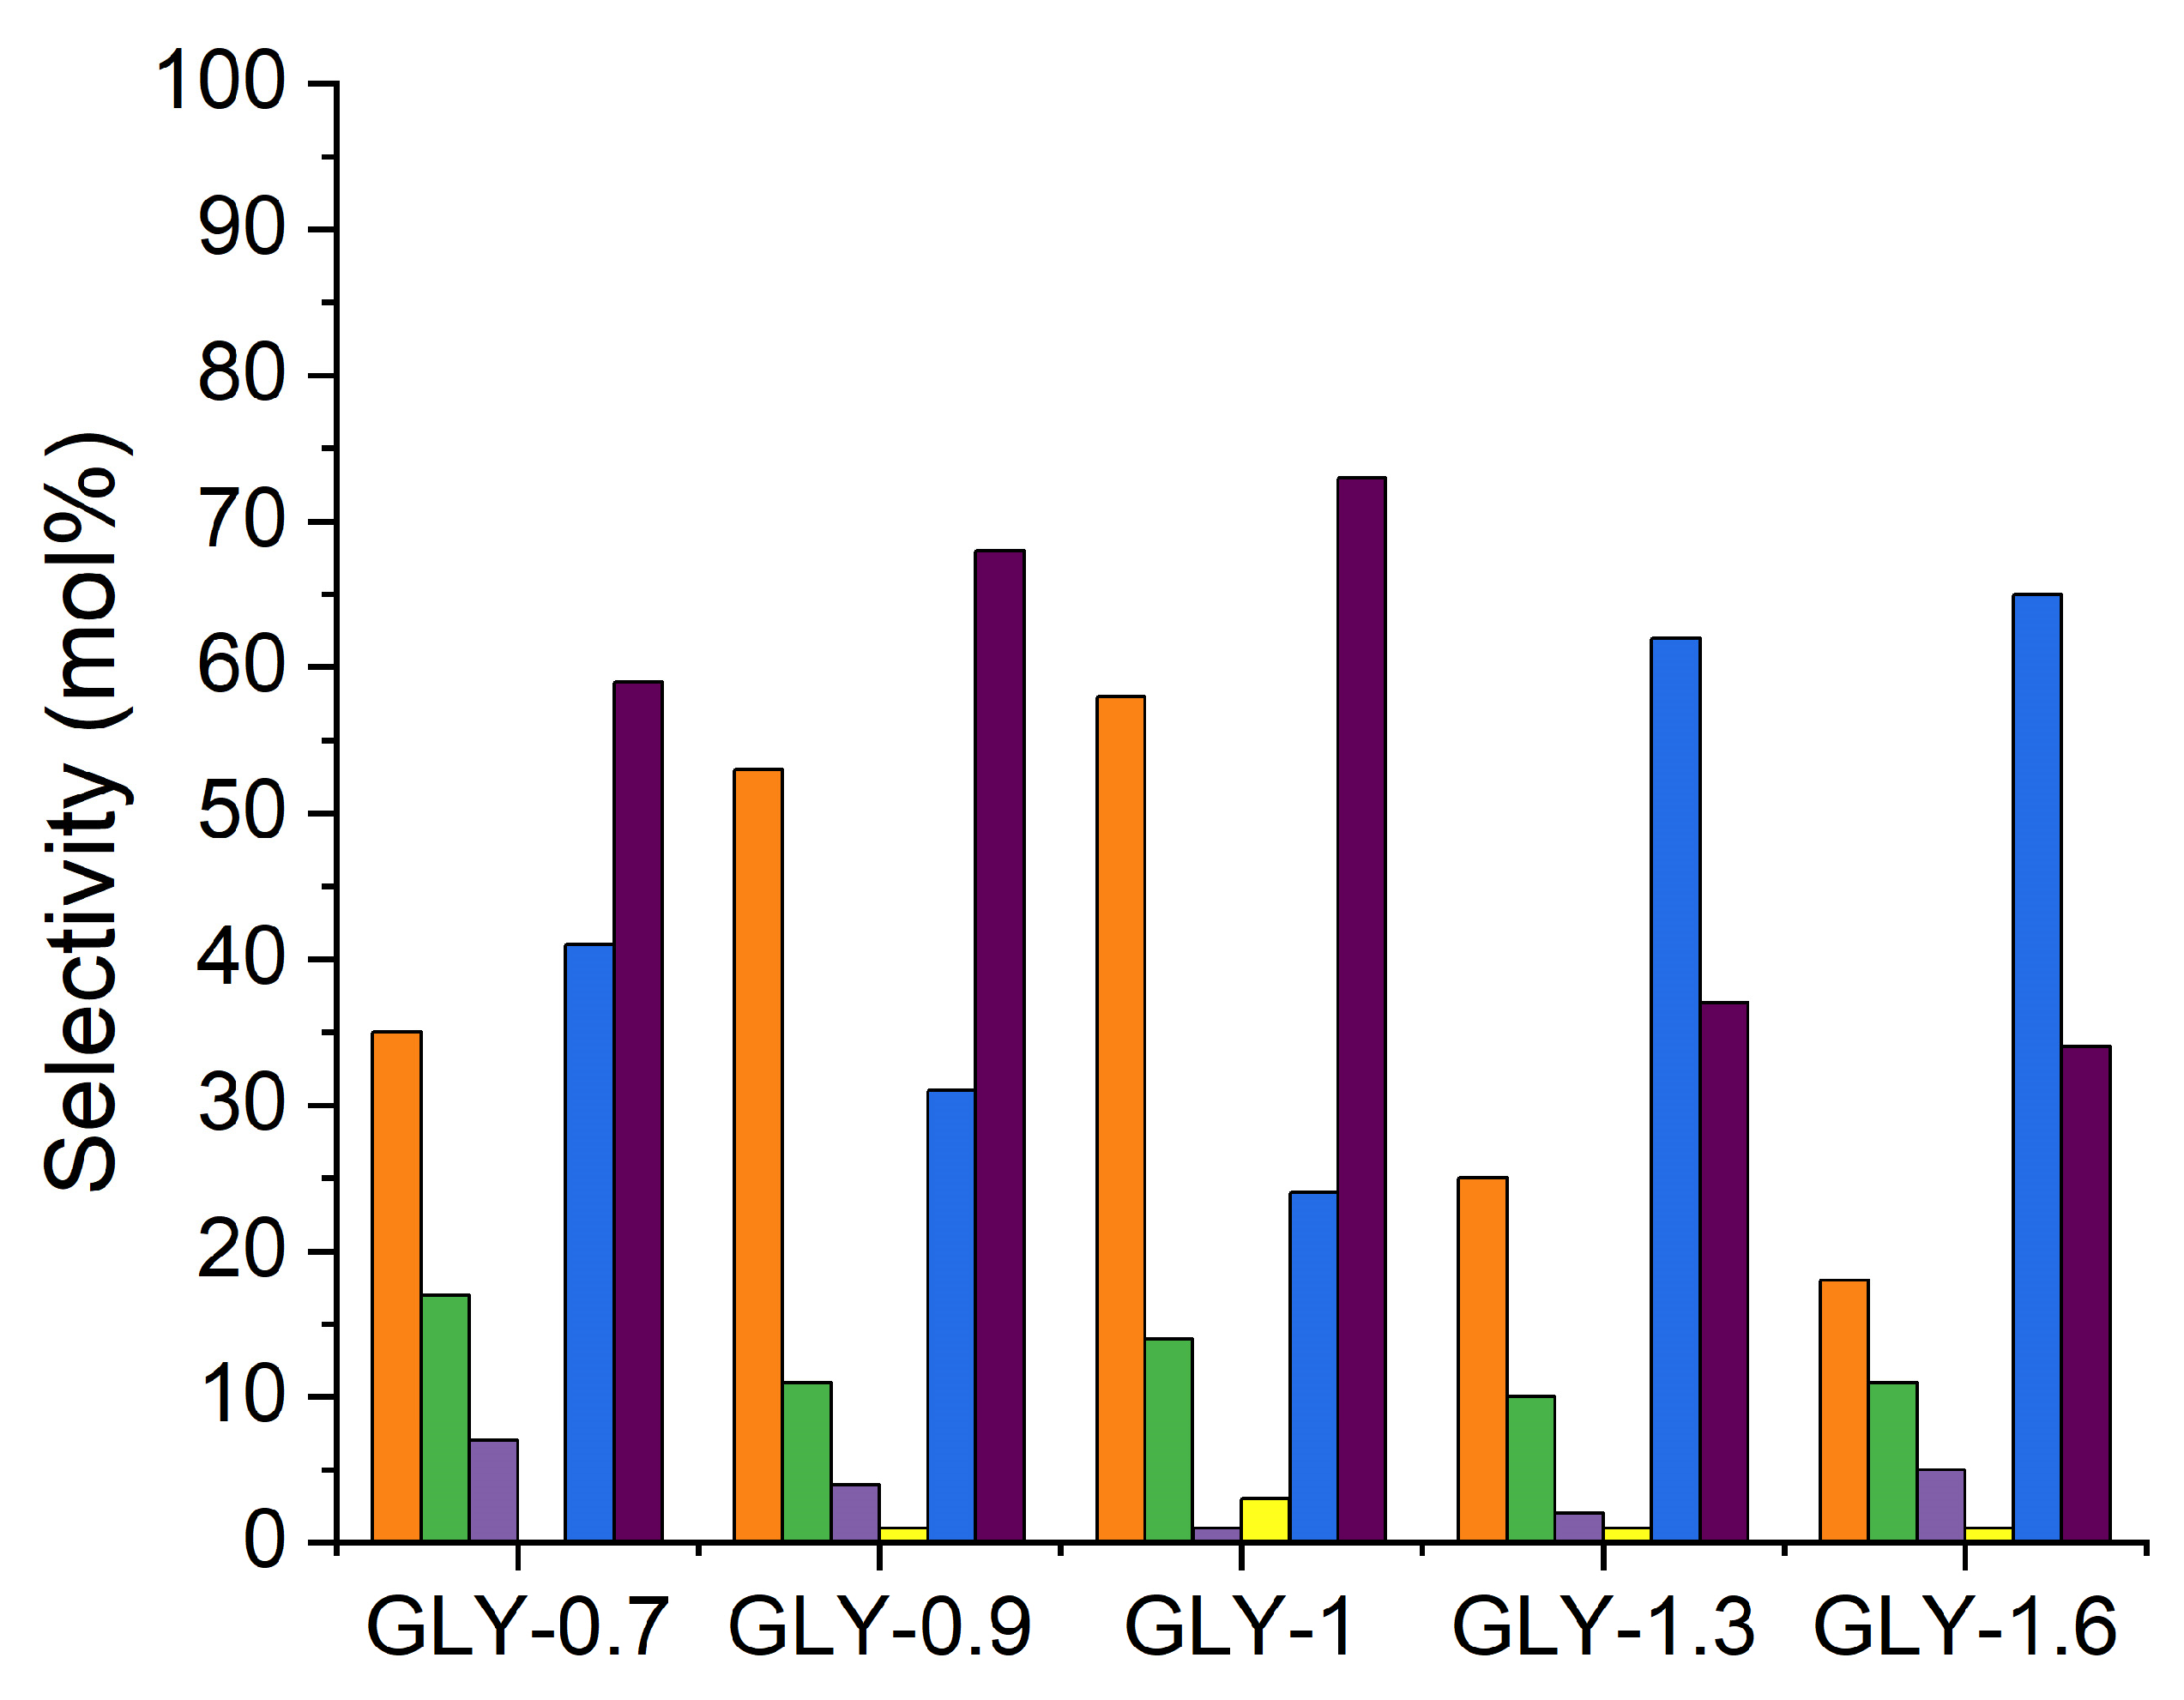
The performance of the catalysts was compared at an iso-conversion of 10 ± 1% under the same reaction conditions. Only GSHV was varied where needed to affect the n-octane conversion. Figure 9 shows the product selectivity obtained over the catalysts at different fuel-to-oxidant ratios at iso-conversion. For the samples GLY-0.7, GLY-0.9, and GLY-1, the selectivity towards octenes is 33, 53, and 55%, respectively. The GLY-1.3 and GLY-1.6 samples gave lower selectivity to octenes, while the selectivity to carbon oxides (COx) increased (61% and 64%, respectively). This trend was ascribed to the small pore size as well as the higher quantity of the pyrovanadate and metavanadate phases being present, as established from XRD analysis. The higher octene selectivity for GLY-1 was ascribed to this catalyst having magnesium orthovanadate in a higher proportion in relation to the other vanadate phases [45,46].
Figure 9. Selectivity at ±10% iso-conversion VOx/MgO catalysts (reaction conditions: temperature = 400 °C, feed = 5% n-octane, C:O = 8:2 and GHSV = 17,500 h−1, 16,600 h−1 and 14,750 h−1 for GLY-0.7, GLY-0.9 and GLY-1, respectively. For GLY-1.3 and 1.7, GHSV = 8602 h−1). Octenes (orange), aromatics (green), dienes (light purple), cracked products (yellow), COx (blue), and C8 products constitute octenes, aromatics, and dienes (dark purple).
Inorganics 13 00389 g009

2.5.2. Effect of Temperature

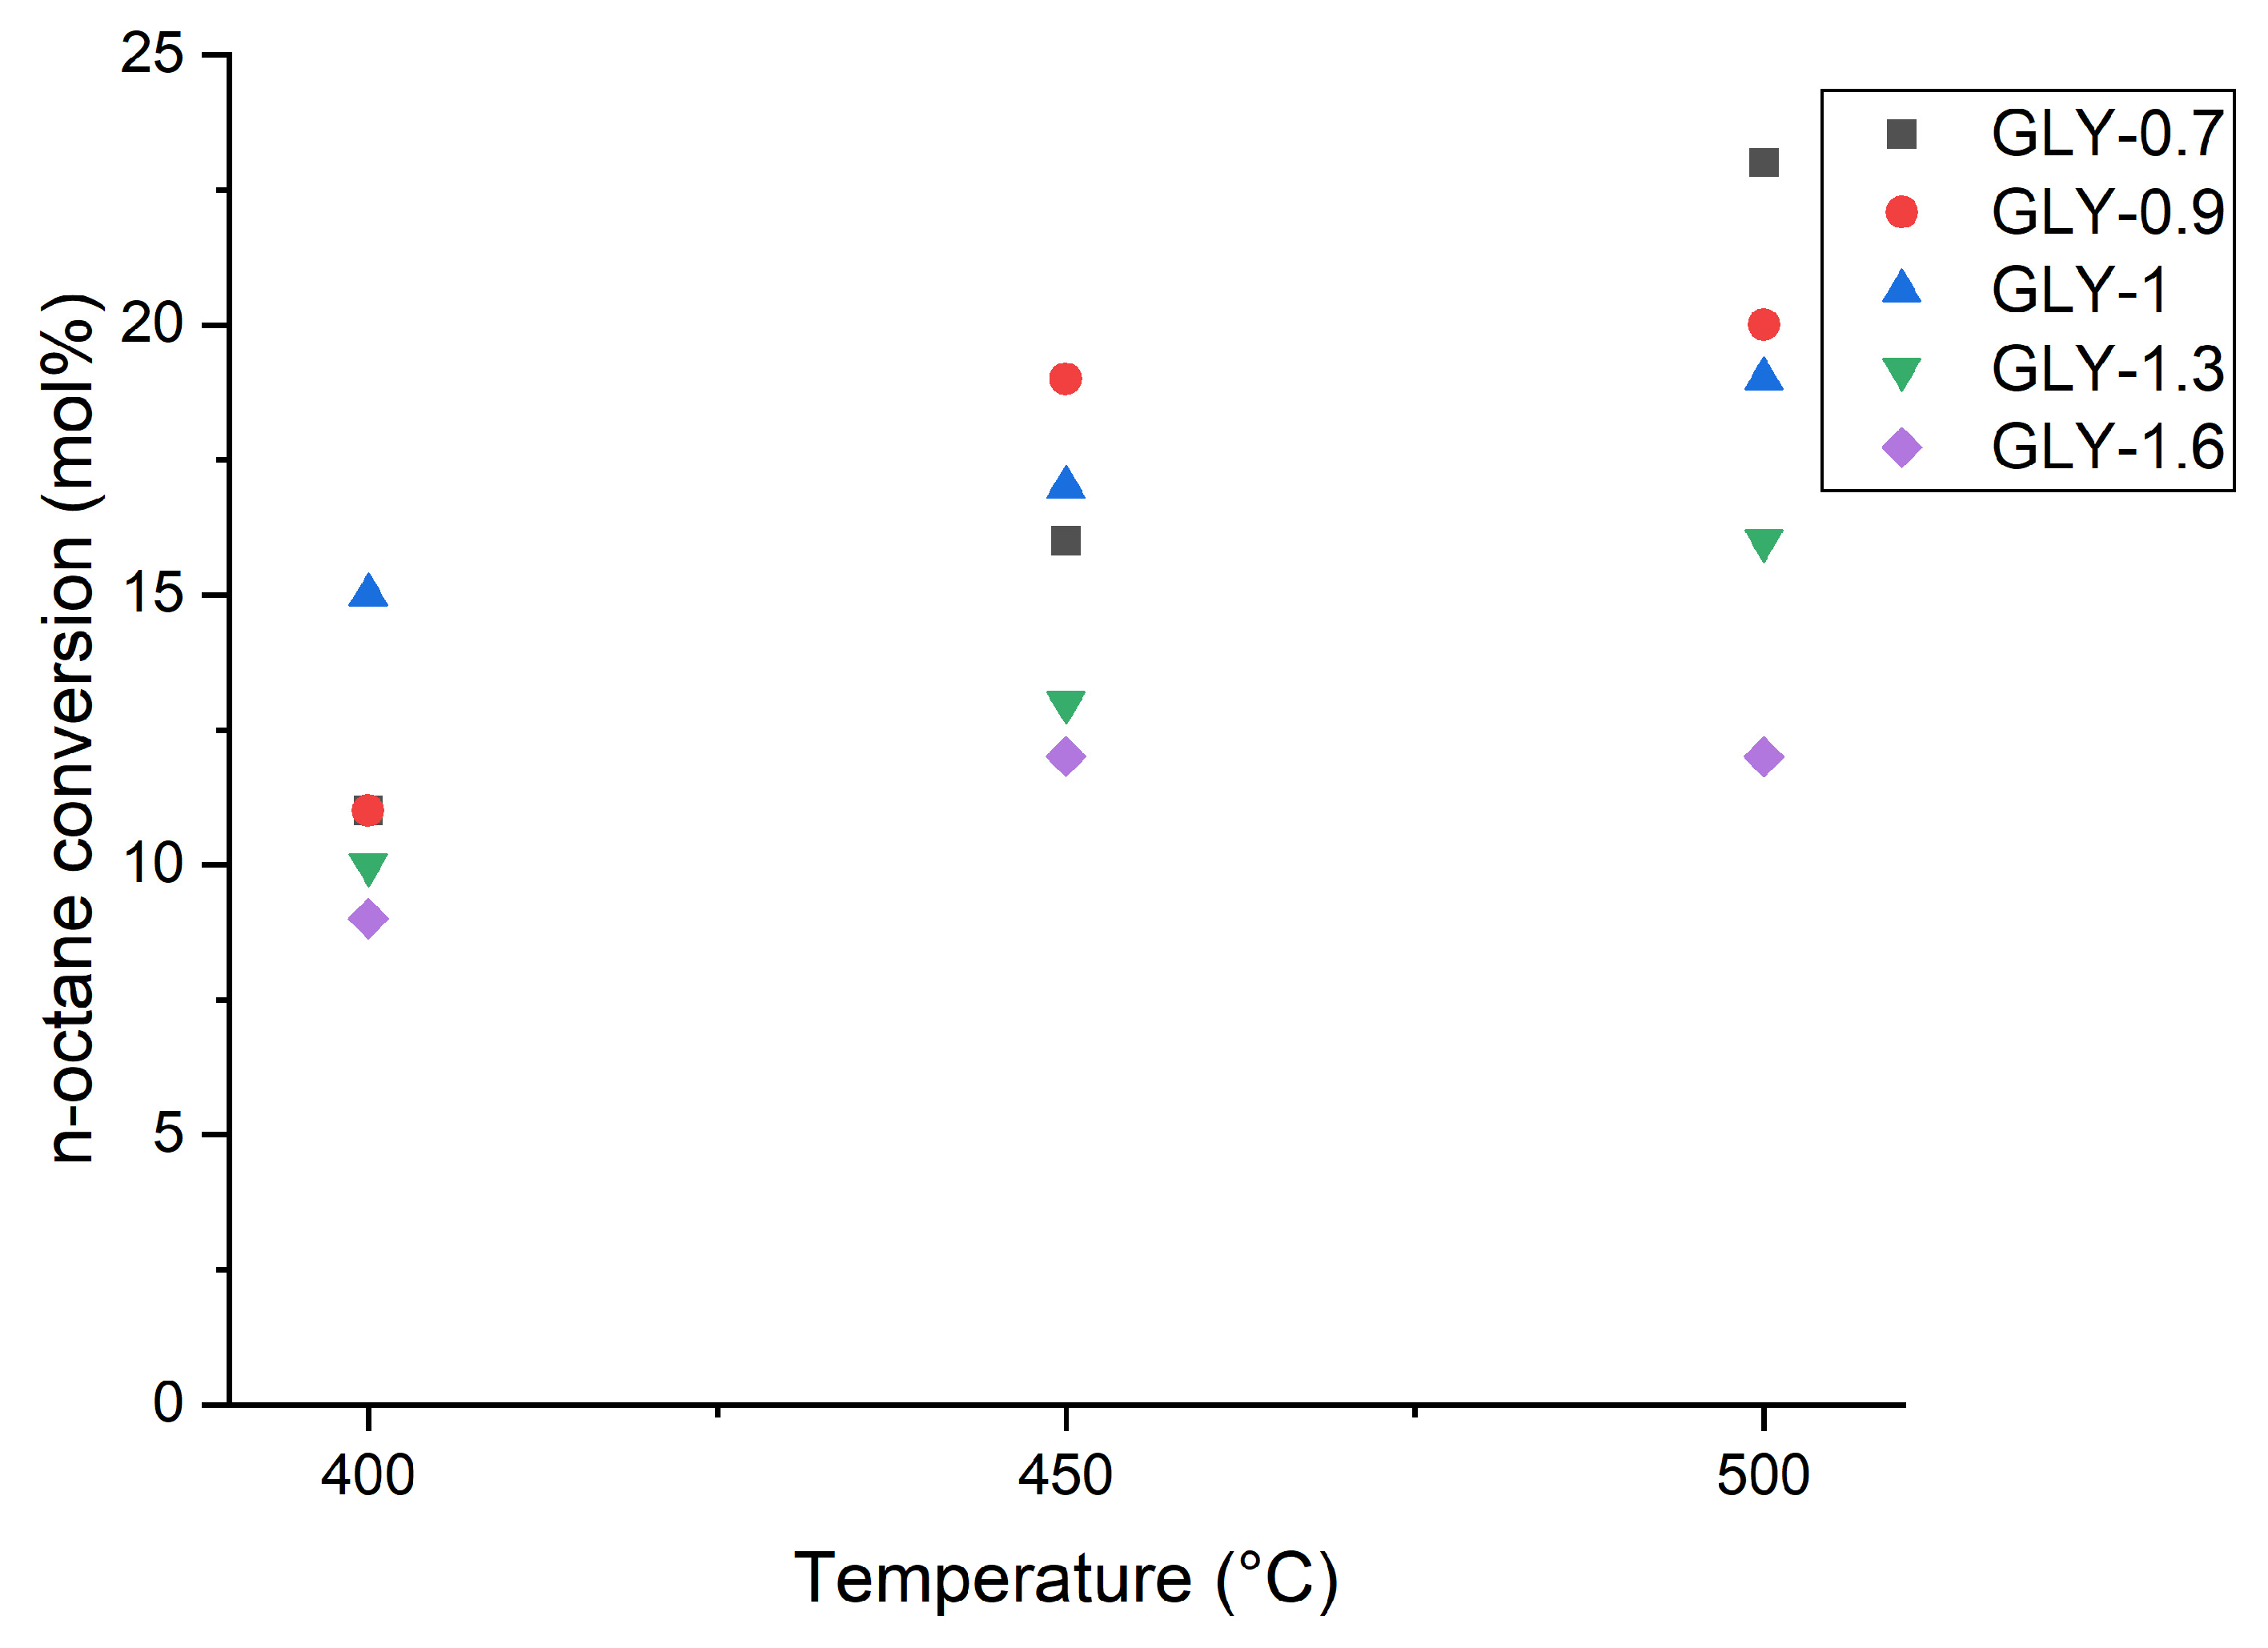
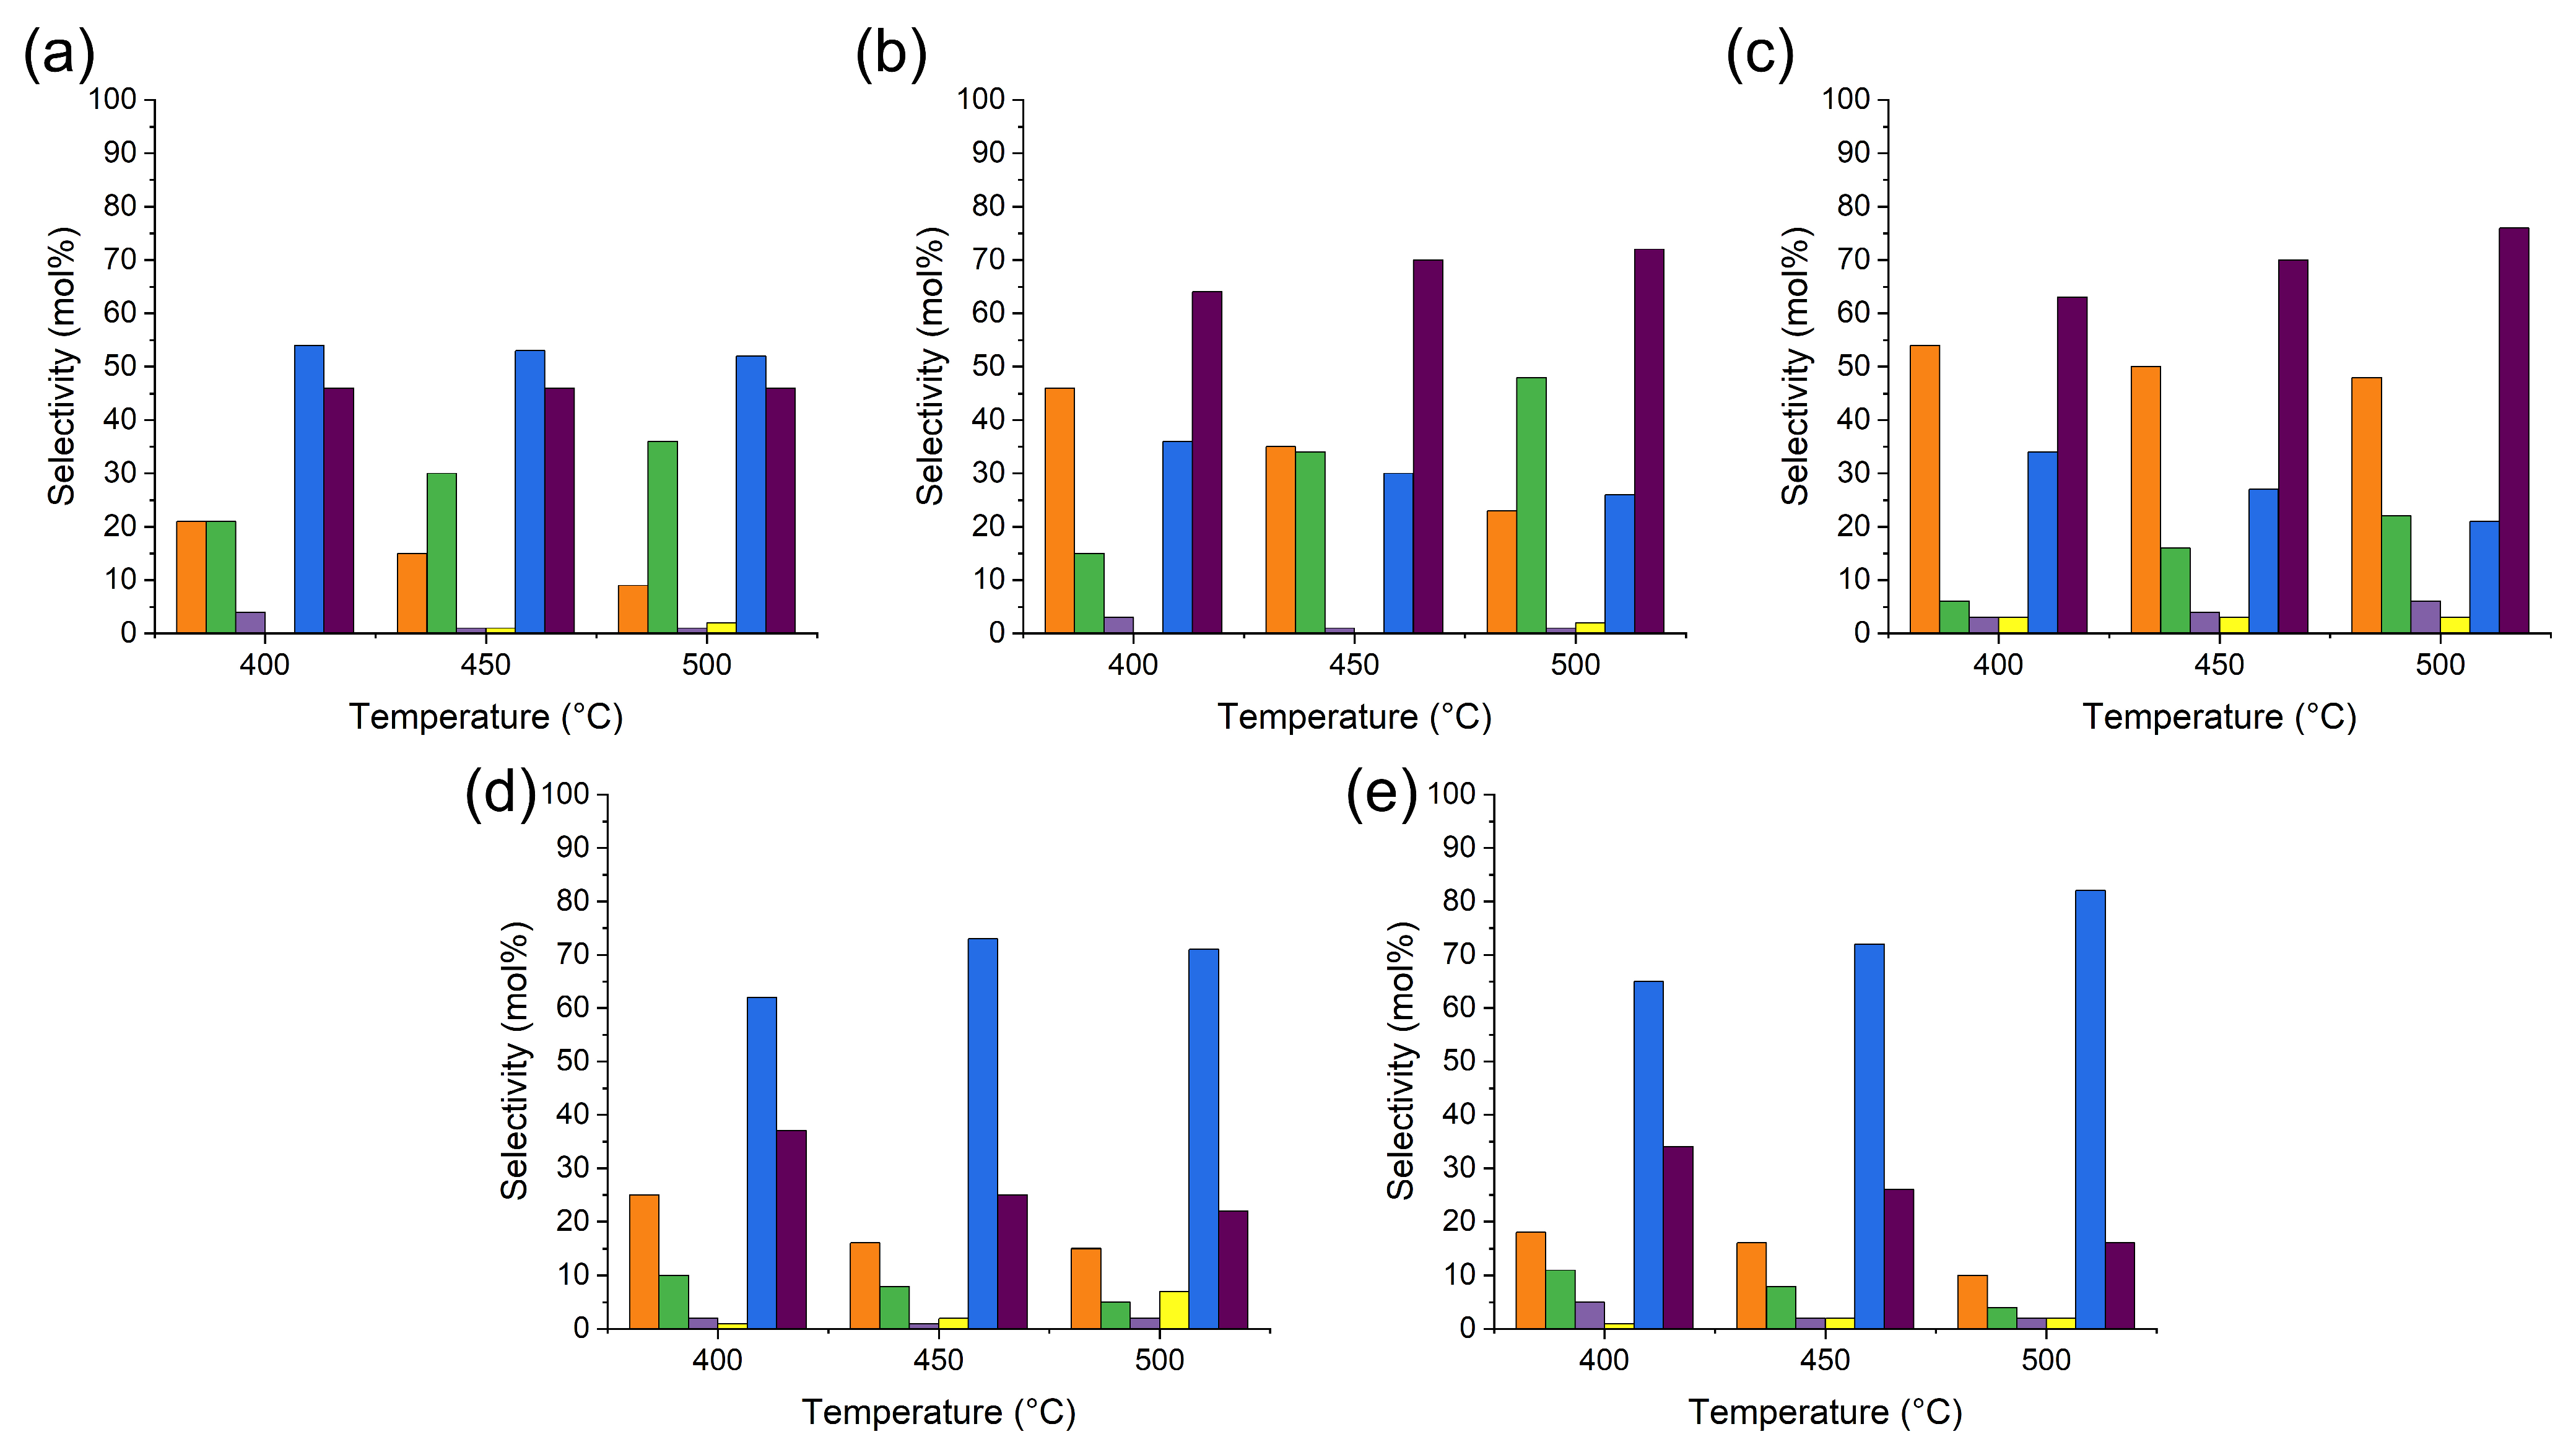
The data in Figure 10 shows the effect of the reaction temperature on octane conversion, and the corresponding selectivity is given in Figure 11. It is observed that the conversion of n-octane increased from 400 °C to 500 °C.
Generally, when operating at high temperatures during ODH, undesirable side reactions become difficult to control. One of these side reactions is cracking [47] and complete combustion to CO2. For catalysts GLY-0.7, GLY-0.9, and GLY-1, the selectivity towards ODH products increased with a corresponding decrease in COx selectivity. The data in Figure 11 suggest that the decrease in COx selectivity is due to the contribution of the increase in the formation of aromatic compounds. Therefore, at temperatures 450 and 500 °C, C8 aromatic formation was more favorable than combustion.
The stable aromatic nucleus in C-8 aromatics is responsible for their formation and the decreased production of carbon oxides [48]. Also, since ODH reactions can proceed either via electrophilic or nucleophilic attack of the alkane, depending on the oxidation state of the cation and its coordination environment, more nucleophilic oxygen species were probably present in the GLY-0.7, GLY-0.9, and GLY-1 catalysts. It has been established, through XRD and high-resolution transmission electron microscopy, that these catalysts contained magnesium vanadate phases, which could have influenced the selectivity towards ODH products. Also, these phases provide monomeric VOx species, which have an excellent redox nature and release nucleophilic oxygen species that are crucial for ODH. The fuel-rich synthesized catalysts, viz. GLY-1.3 and GLY-1.6 show the opposite trend. Octene isomers and aromatics decrease as the temperature is increased, resulting in an increase in COx formation. This is likely because these samples contain higher content of the MgO phase, which has been shown to favor COx formation [49], and/or amorphous V2O5.

2.6. Mechanistic Insights

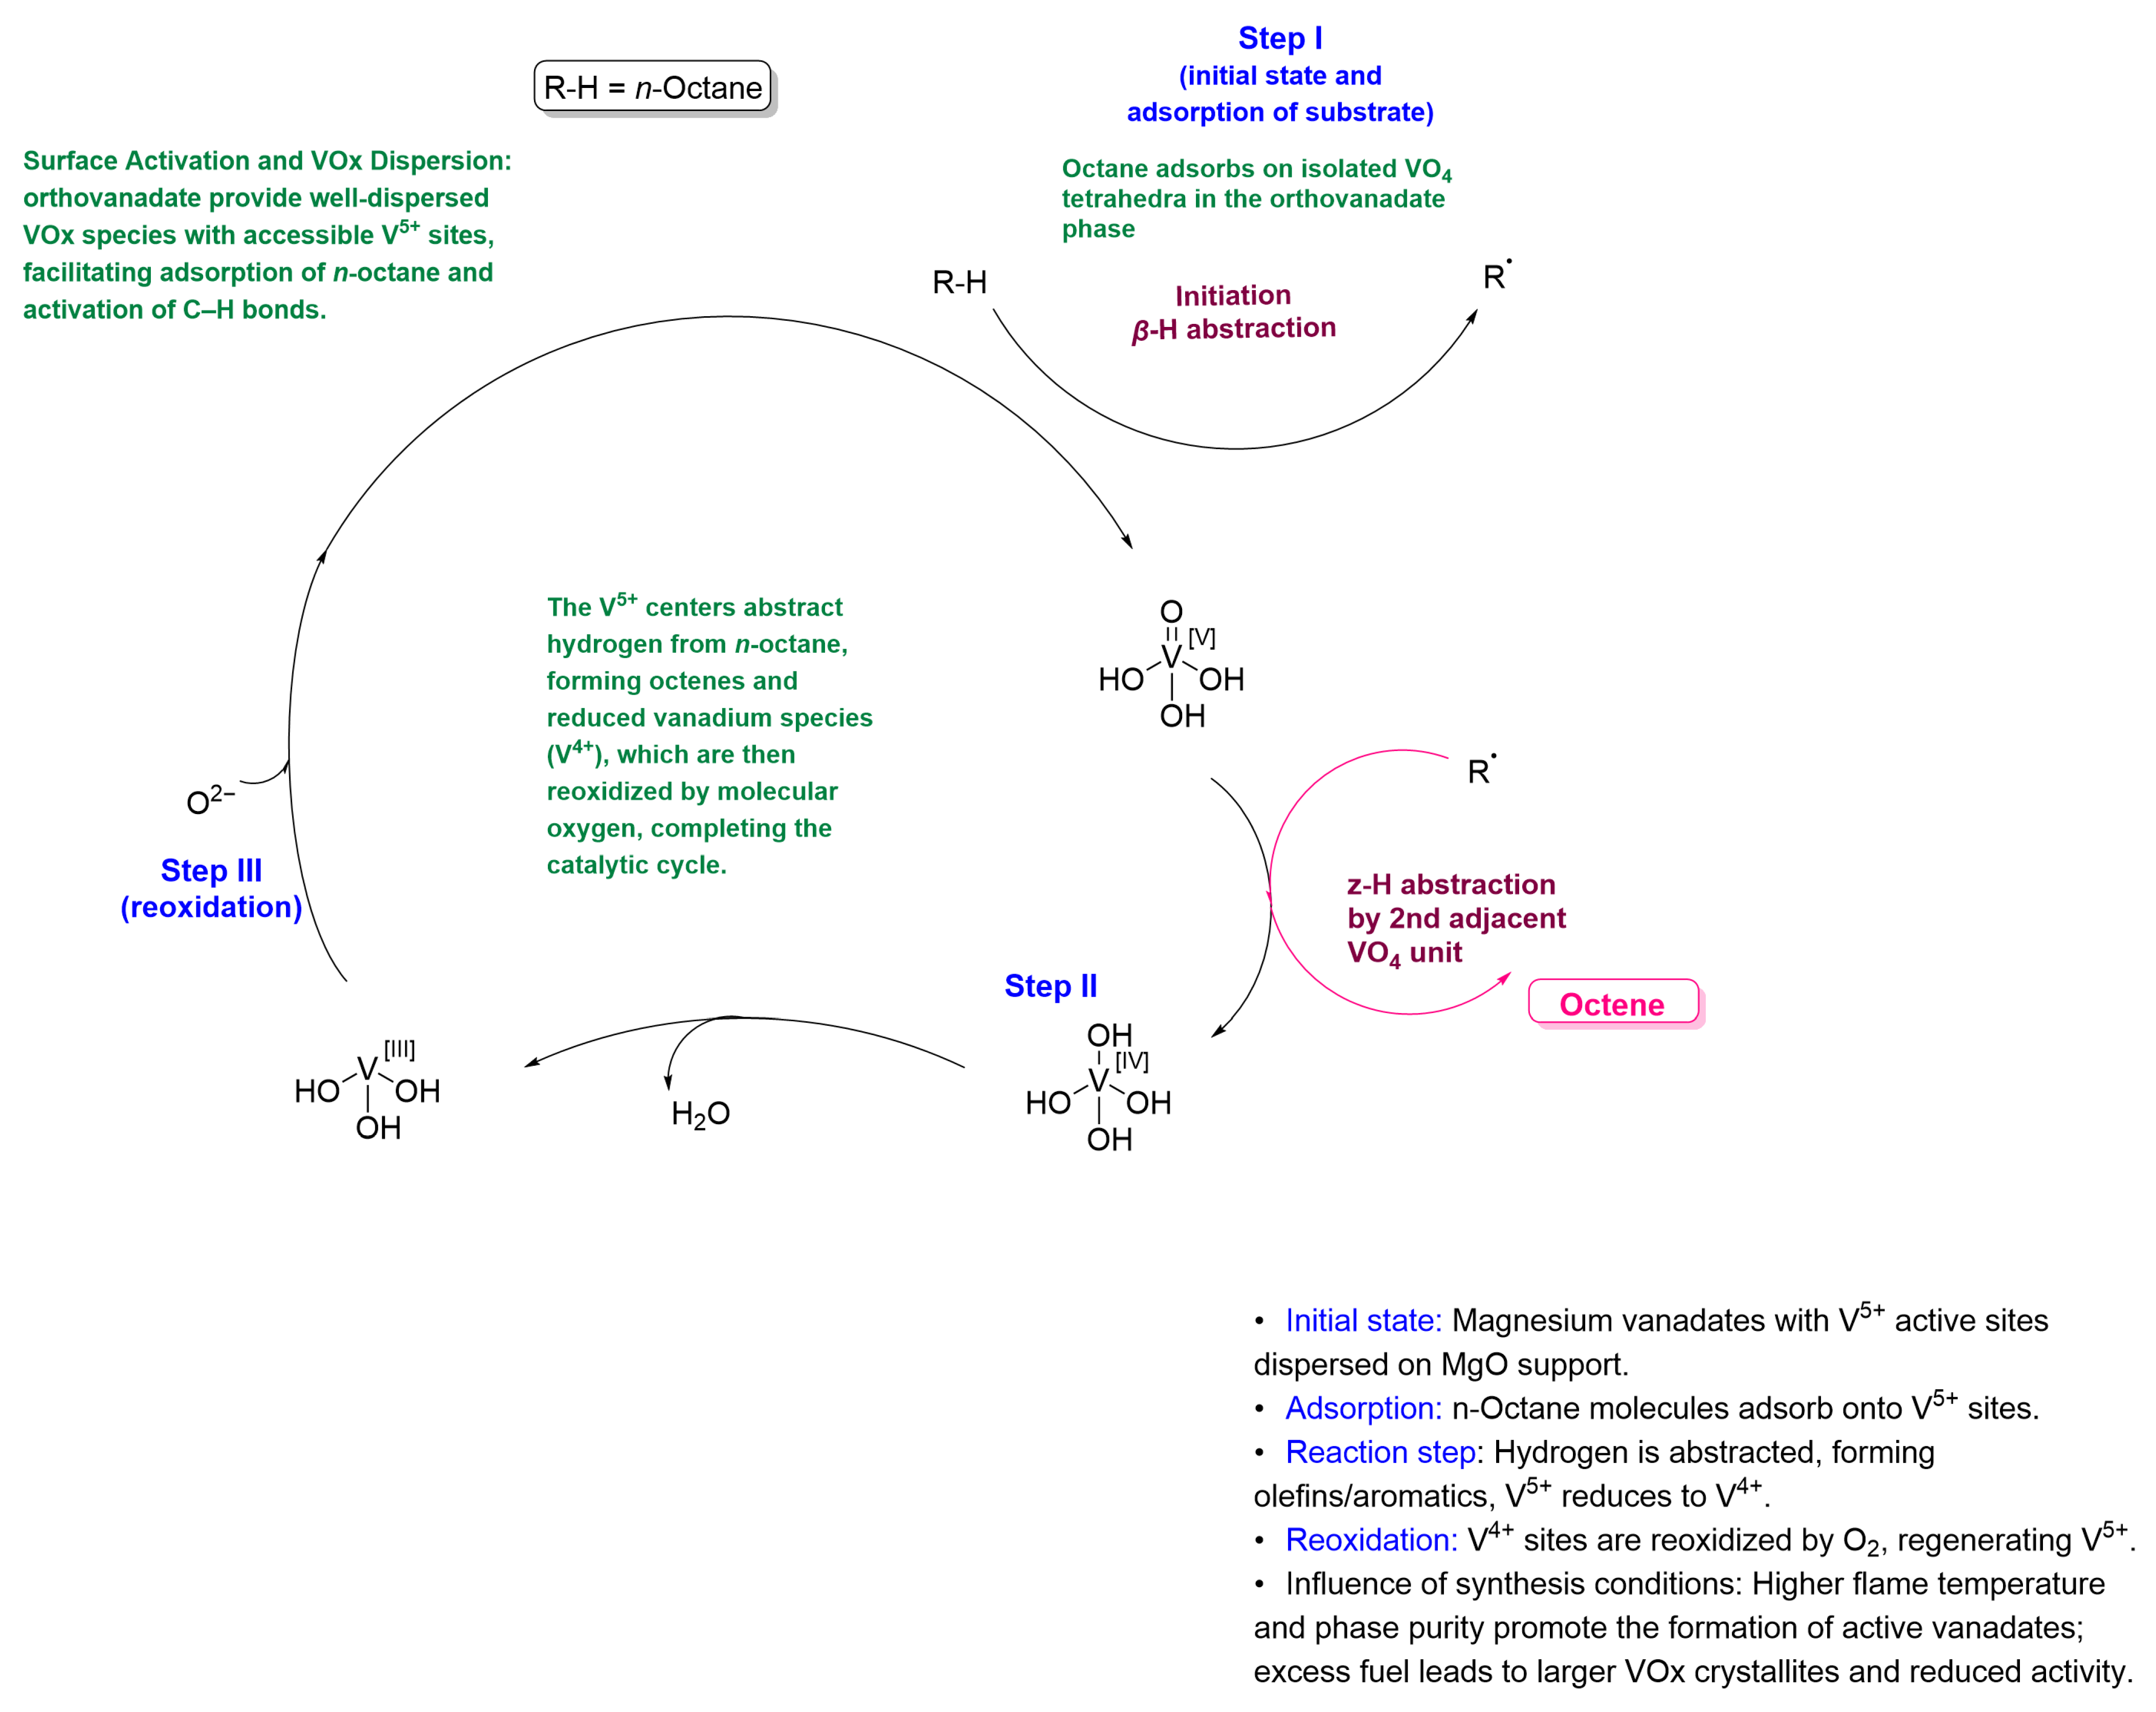
The literature reports provide valuable mechanistic insights into the role of VOx species in the oxidative dehydrogenation (ODH) of short- and medium-chain alkanes [50,51,52]. Building on correlations between physicochemical characterization and catalytic performance data, the present work proposes a mechanistic interpretation for the role of VOx species in the ODH of n-octane, as illustrated in Figure 12. Notably, variation in the glycine-to-oxidant molar ratio was found to markedly influence the combustion temperature (Table 1). Based on XRD evidence, it appears that the stoichiometric sample (GLY-1) generated sufficient thermal energy during synthesis to favor the formation of the orthovanadate phase as the dominant crystalline phase, comprising primarily isolated VOx species. At the same time, XRD results also indicated that the stoichiometric sample yielded smaller crystallites of the MgO phase, which aided in improving the dispersion of these isolated VOx species.
In contrast, excess fuel results in the formation of larger crystallites and also promotes the formation of magnesium pyrovanadate and metavanadate as the dominant vanadate phases. These phases contain VOx tetrahedra arranged as corner- or edge-sharing units, which have been reported to exhibit lower selectivity toward alkenes [51]. Consequently, the presence of the magnesium orthovanadate phase in the stoichiometric sample correlated with enhanced catalytic activity. Experimental evidence further indicates that vanadates formed under optimal combustion conditions stabilize vanadium predominantly in the higher oxidation state (V5+), which is catalytically active for ODH. This finding is corroborated by the XANES results.
Figure 12 illustrates the proposed dominant reaction pathway, in which isolated magnesium orthovanadate species containing V5+ active sites are dispersed on the MgO support. In the initial step, n-octane molecules interact with lattice oxygen to generate surface hydroxyl species and alkyl radicals. Subsequent hydrogen abstraction yields olefins and/or aromatics, accompanied by the reduction of V5+ to lower oxidation states. The reduced vanadium sites are subsequently reoxidized by molecular oxygen, thereby regenerating the V5+ centers and closing the catalytic cycle.
In summary, the experimental findings demonstrate that under optimal combustion conditions, magnesium orthovanadate phases with well-dispersed V5+ centers are formed, which are essential for the effective ODH of n-octane. The phase composition, dispersion, and oxidation state of VOx species are thus key parameters governing catalytic performance.
Figure 12. Proposed reaction scheme for the catalytic ODH reaction of n-octane to octenes.
Inorganics 13 00389 g012

3. Experimental Section

3.1. Catalyst Synthesis

Five VOx/MgO catalysts were prepared using glycine (SaarChem, Deutschland GmbH, Germany) as a fuel and complexing agent. For calculations of amounts of precursors, the same procedure as previously reported was followed [15]. One material (stoichiometric/GLY-1) was previously reported [15] and is compared to materials in this study. The main controllable variable in this procedure is the fuel-to-oxidant molar ratios. Two of the samples were made under fuel-lean conditions (GLY-0.7 and GLY-0.9), while the other two were prepared with an excess of fuel (GLY-1.3 and GLY-1.6) (Table 4). The preparation and characterization of the stoichiometric sample are discussed in detail in [15]. A 15% loading by weight of V2O5 was targeted during the preparation, with an expected yield of 12 g of the catalyst. Depending on the nature of the combustion reaction with regard to sample sputtering, the mass yielded ranged between 11 g and 12 g.

3.2. Catalyst Characterization

3.2.1. X-Ray Studies

For confirmation of the elemental composition of the synthesized catalysts, X-ray fluorescence spectrophotometry (XRF) was conducted using a Rigaku (Tokyo, Japan) NEX CG spectrometer. This instrument allowed for simultaneous multi-element spectral measurement, using the Squatter Quant Fundamental Parameter (SQFP) and reference methods. Standard reference elements with known energies were used for calibration. X-ray powder diffraction (XRD) patterns were collected using a Rigaku (Tokyo, Japan) MiniFlex600 (equipped with a sealed ceramic X-ray tube with a copper anode, Tokyo, Japan). For phase identification, SmartLab Studio II v4.5.421.0 software was used.
This instrument was operated at 40 kV and 40 mA with a Co Kα source of radiation. The 2θ angle ranged between 10° and 70° at a speed of 1°/min with a step size of 0.02°, and all data were captured by a Sietronics 122D automated microprocessor.
Ex situ XAS measurements were undertaken at the Diamond Light Source, UK, at beamline B18 (bending magnet). Measurements of the V K edge spectra were performed in transmission mode at ambient temperature. The energy scans were performed above and below the absorption edges of V (~5465 eV) over the span of 950 eV (step size 0.22 eV). Approximately 5 mg of the active material was scraped off the film and homogenously ground with dried cellulose (approx. 25–30 mg). The samples were then pressed into 8 mm diameter pellets (thickness of ~1 mm) before being transferred into a custom-built (DLS) transfer chamber with X-ray-transparent windows inside an Ar glove box. Helium was used to purge the measurement chamber to minimize background absorption of the incident X-rays. To avoid air exposure, the samples were measured at an overpressure of He. The beam size had dimensions of 200 μm × 250 μm. In order to improve the signal-to-noise ratio, three consecutive spectra were collected from each sample. This was also performed to avoid beam damage or instability in the samples. For transmission-mode measurements, ionization chamber detectors were utilized. During the XAS recordings, simultaneous measurement of a V foil standard was performed for energy calibration. X-ray absorption spectra of all the compounds were recorded under similar conditions. The Athena program in the Demeter package running IFEFFI was used for background correction, energy calibration, data merging, analysis, and peak fitting.

3.2.2. BET Surface Area Analysis

Surface area, pore volume, and N2 adsorption–desorption measurements were obtained by N2 physisorption isotherms at 77 K using a Micromeritics (Norcross, GA, USA) 3Flex.

3.2.3. Scanning Electron Microscopy

Scanning electron microscopy (SEM) images were obtained using a Zeiss (Oberkochen, Germany) LEO1450 Scanning Electron Microscope. The powders were coated with gold using a Polaron SC Sputter Coater before imaging.

3.2.4. Aberration-Corrected Transmission Electron Microscopy

Transmission electron microscopy (TEM) was performed using a double-aberration-corrected JEOL (Tokyo, Japan) JEM-ARM 200F operated at 200 kV and equipped with an Oxford Xmax 100 EDS detector (Abongdon, UK) and Gatan GIF 965ERS (Pleasanton, CA, USA) with dual EELS capability. Imaging and analysis of the samples were performed in TEM using parallel illumination and scanning mode (STEM), using a sub-angstrom-sized probe with a probe current between 68 pA and 281 pA. Probe current conditions were selected to optimize the beam current but, at the same time, minimize the risk of beam damage to the specimen. The EELS spectrum imaging was performed using a 0.5 eV or 1 eV energy channel width for an energy range containing 2048 channels. The FWHM of the zero-loss peak was measured at 1.5 eV. EELS elemental distribution and compositional maps were generated using a model-based (Hartree–Slater) quantification routine (excluding ELNES) [53]. The SAED imaging was performed in TEM mode using parallel illumination. Recording of images was performed using a GATAN Ultrascan SC1000 2K camera (Pleasanton, CA, USA).

3.3. Catalytic Testing

Catalysts were tested using a continuous flow, fixed-bed reactor. The reactor tube was a ½” (outer diameter), grade 316 stainless steel tube supplied by Swagelok, which was then cut to a length of 34 cm. The catalyst bed contained 1 mL (corresponding to 0.45 g) of the solid catalyst with pellet sizes in the range of 300–600 μm. Catalysts were diluted using 1 mL of 24-grit carborundum, and the catalyst bed was placed at the isothermal zone of the reactor tube. All voids in the reactor tube were filled with 24-grit carborundum. A feed containing 5 vol. % n-octane in air (oxygen-rich) was used for the testing at a fixed flow rate. The catalyst volume was adjusted to obtain the GHSV of 8602 h−1. A C:O ratio of 8:2 was used, which corresponds to a ratio of one molecule of n-octane (8 moles of C) to one O2 molecule (2 moles of O). Bronkhorst HIGH-TECH mass flow controllers were used to feed the oxidant (O2) and the diluent (N2) into the system. The feed was introduced using a Series II HPLC Pump. Total flow rates of the gaseous products were measured using a Ritter-type wet gas flow meter (WGFM), which was used to measure the total flow rates of the gaseous products.
Catalyst testing was conducted over several days, with sampling performed randomly as the reactions were under steady state. Catalytic testing was performed between 400 °C and 500 °C. All data points were duplicated, and carbon balances were 100 ± 2%. All the gaseous samples were drawn using a gas-tight syringe for GC analyses through a septum fitted into a T-piece placed on the gas vent. A cylindrical stainless steel vessel was used to collect all the liquid products. This was cooled to 3.0 °C using an FHM Instruments refrigeration chilled unit. The COx (CO and CO2) produced was quantified on a Perkin Elmer Clarus 400 GC fitted with a 30 m × 530 μm Supelco Carboxen 1006 PLOT column and a thermal conductivity detector (TCD). A Shimadzu GC-2025 (Kyoto, Japan), fitted with a 50 m × 200 μm Gas Chromatograph and a flame ionization detector and a 50 m × 200 μm PONA capillary column, was used for hydrocarbon product (gaseous and liquid) analysis.

4. Conclusions

This study showed that it was possible to tune the fuel-to-oxidant ratios to obtain material with different catalytic properties. Flame temperature, surface area, oxidation state, coordination environment around the V atom, and crystallite size can be controlled by adjusting the redox nature of the combustion process. The heat generated in all fuel conditions, except the stoichiometric condition, was not controlled enough to form well-crystallized magnesium vanadate phases. The samples prepared in the fuel-lean regimes displayed the highest adiabatic temperatures. The GLY-1.6 catalyst synthesis showed the lowest adiabatic flame temperature. This was ascribed to the dissipation of heat caused by the large amounts of gaseous products released at these fuel conditions. While there were differences in the calculated adiabatic flame temperatures between the syntheses, the catalytic results showed that the main contributing factors to the selectivity profiles were the presence and amount of magnesium vanadates formed and the crystallite size. The coordination and oxidation state of vanadium also played a role. Results in the ODH of n-octane demonstrated that the catalyst prepared with a stoichiometric fuel-to-oxidant ratio gave the best catalytic performance. Conversions of 11% with selectivity towards octene isomers of just over 50% were obtained, combined with a selectivity of 12% to C-8 aromatics and, correspondingly, the lowest COx selectivity. Thus, the selectivity of ODH products was highest than this catalyst. This corresponded well with the crystallite size, surface area, and the presence of magnesium vanadates.

Supplementary Materials

The following supporting information can be downloaded at: https://www.mdpi.com/article/10.3390/inorganics13120389/s1, Figure S1: Variation of adiabatic flame temperature as a function of glycine-to-nitrate ratio; Figure S2: N2 Adsorption-desorption isotherms for (a) GLY-0.7, (b) GLY-0.9, (c) GLY-1, (d) GLY-1.3 and (e) GLY-1.6; Figure S3: Pore size distribution for (a) GLY-0.7, (b) GLY-0.9, (c) GLY-1, (d) GLY-1.3 and (e) GLY-1.6; Figure S4: Pre-edge plot of the VOx/MgO catalysts; Table S1: Summary of the XANES data for the GLY samples measured at the V K-edge; Table S2: Standard values and thermodynamic parameters used in the calculations of adiabatic combustion temperature (NIST WebBook). Reference [54] is cited in the Supplementary Materials.

Author Contributions

Conceptualization, P.N., S.S., A.S.M. and H.B.F.; Methodology, S.S., A.S.M., E.J.O., A.R., V.C. and H.B.F.; Software, A.R. and V.C.; Validation, P.N., S.S., A.S.M., E.J.O., A.R., V.C. and H.B.F.; Formal analysis, P.N., E.J.O., M.S., A.R. and V.C.; Investigation, P.N., E.J.O., M.S., A.R. and V.C.; Resources, E.J.O., A.R., V.C. and H.B.F.; Data curation, P.N., E.J.O., M.S., A.R. and V.C.; Writing—original draft, P.N. and M.S.; Writing—review & editing, S.S., A.S.M., A.R. and H.B.F.; Visualization, P.N., A.S.M., M.S., V.C. and H.B.F.; Supervision, S.S., A.S.M., E.J.O. and H.B.F.; Project administration, H.B.F.; Funding acquisition, H.B.F. All authors have read and agreed to the published version of the manuscript.

Funding

This work is based on the research supported in part by the National Research Foundation of South Africa (112150). The authors also wish to acknowledge the CHRTEM unit at Nelson Mandela University and ANSDAC (African Neutron and Synchrotron Data Analysis Competency).

Data Availability Statement

The original contributions presented in this study are included in the article/Supplementary Materials. Further inquiries can be directed to the corresponding author.

Acknowledgments

XAS data were collected at Diamond on B18 as part of the UK Catalysis Hub BAG allocation. We further thank C. Moodley for the N2-physisorption data and A.L. Folkard for assistance with the figures.

Conflicts of Interest

Veronica Celorrio was employed by the Diamond Light Source Ltd. The remaining authors declare that the research was conducted in the absence of any commercial or financial relationships that could be construed as a potential conflict of interest.

References

  1. Padayatchee, S.; Ibrahim, H.; Friedrich, H.B.; Olivier, E.J.; Ntola, P. Solution Combustion Synthesis for Various Applications: A Review of the Mixed-Fuel Approach. Fluids 2025, 10, 82. [Google Scholar] [CrossRef]
  2. Jadhav, L.D.; Patil, S.P.; Jamale, A.P.; Chavan, A.U. Solution Combustion Synthesis: Role of Oxidant to Fuel Ratio on Powder Properties. Mater. Sci. Forum 2013, 757, 85–98. [Google Scholar] [CrossRef]
  3. Mukasyan, A.S.; Costello, C.; Sherlock, K.P.; Lafarga, D.; Varma, A. Perovskite membranes by aqueous combustion synthesis: Synthesis and properties. Sep. Purif. Technol. 2001, 25, 117–126. [Google Scholar] [CrossRef]
  4. Bulánek, R.; Kalužová, A.; Setnička, M.; Zukal, A.; Čičmanec, P.; Mayerová, J. Study of vanadium based mesoporous silicas for oxidative dehydrogenation of propane and n-butane. Catal. Today 2012, 179, 149–158. [Google Scholar] [CrossRef]
  5. Zhao, B.; Yu, X.; Cai, R.; Ran, R.; Wang, H.; Shao, Z. Solution combustion synthesis of high-rate performance carbon-coated lithium iron phosphate from inexpensive iron (iii) raw material. J. Mater. Chem. 2012, 22, 2900–2907. [Google Scholar] [CrossRef]
  6. González-Cortés, S.L.; Imbert, F.E. Fundamentals, properties and applications of solid catalysts prepared by solution combustion synthesis (SCS). Appl. Catal. A Gen. 2013, 452, 117–131. [Google Scholar] [CrossRef]
  7. Striker, T.; Ruud, J.A. Effect of Fuel Choice on the Aqueous Combustion Synthesis of Lanthanum Ferrite and Lanthanum Manganite. J. Am. Ceram. Soc. 2010, 93, 2622–2629. [Google Scholar] [CrossRef]
  8. Li, F.-t.; Ran, J.; Jaroniec, M.; Qiao, S.Z. Solution combustion synthesis of metal oxide nanomaterials for energy storage and conversion. Nanoscale 2015, 7, 17590–17610. [Google Scholar] [CrossRef]
  9. Biamino, S.; Badini, C. Combustion synthesis of lanthanum chromite starting from water solutions: Investigation of process mechanism by DTA–TGA–MS. J. Eur. Ceram. Soc. 2004, 24, 3021–3034. [Google Scholar] [CrossRef]
  10. Toniolo, J.C.; Takimi, A.S.; Bergmann, C.P. Nanostructured cobalt oxides (Co3O4 and CoO) and metallic Co powders synthesized by the solution combustion method. Mater. Res. Bull. 2010, 45, 672–676. [Google Scholar] [CrossRef]
  11. Aali, H.; Azizi, N.; Baygi, N.J.; Kermani, F.; Mashreghi, M.; Youssefi, A.; Mollazadeh, S.; Khaki, J.V.; Nasiri, H. High antibacterial and photocatalytic activity of solution combustion synthesized Ni0.5Zn0.5Fe2O4 nanoparticles: Effect of fuel to oxidizer ratio and complex fuels. Ceram. Int. 2019, 45, 19127–19140. [Google Scholar] [CrossRef]
  12. Pederson, L.R.; Maupin, G.D.; Weber, W.J.; McReady, D.J.; Stephens, R.W. Combustion synthesis of YBa2Cu3O7−x: Glycine/metal nitrate method. Mater. Lett. 1991, 10, 437–443. [Google Scholar] [CrossRef]
  13. Elkhalifa, E.A.; Friedrich, H.B. Oxidative dehydrogenation and aromatization of n-octane over VMgO catalysts obtained by using different MgO precursors and different precursor treatments. J. Mol. Catal. A Chem. 2014, 392, 22–30. [Google Scholar] [CrossRef]
  14. Ntola, P.; Friedrich, H.B.; Singh, S.; Olivier, E.J.; Farahani, M.; Mahomed, A.S. Effect of the fuel on the surface VOx concentration, speciation and physico-chemical characteristics of solution combustion synthesised VOx/MgO catalysts for n-octane activation. Catal. Commun. 2023, 174, 106571. [Google Scholar] [CrossRef]
  15. Ntola, P.; Friedrich, H.B.; Mahomed, A.S.; Olivier, E.J.; Govender, A.; Singh, S. Exploring the role of fuel on the microstructure of VOx/MgO powders prepared using solution combustion synthesis. Mater. Chem. Phys. 2022, 278, 125602. [Google Scholar] [CrossRef]
  16. Lima, M.D.; Bonadimann, R.; de Andrade, M.J.; Toniolo, J.C.; Bergmann, C.P. Nanocrystalline Cr2O3 and amorphous CrO3 produced by solution combustion synthesis. J. Eur. Ceram. Soc. 2006, 26, 1213–1220. [Google Scholar] [CrossRef]
  17. Chick, L.A.; Pederson, L.R.; Maupin, G.D.; Bates, J.L.; Thomas, L.E.; Exarhos, G.J. Glycine-nitrate combustion synthesis of oxide ceramic powders. Mater. Lett. 1990, 10, 6–12. [Google Scholar] [CrossRef]
  18. Deganello, F.; Tyagi, A.K. Solution combustion synthesis, energy and environment: Best parameters for better materials. Prog. Cryst. Growth Charact. Mater. 2018, 64, 23–61. [Google Scholar] [CrossRef]
  19. Zhou, Q.; Mou, Y.; Ma, X.; Xue, L.; Yan, Y. Effect of fuel-to-oxidizer ratios on combustion mode and microstructure of Li2TiO3 nanoscale powders. J. Eur. Ceram. Soc. 2014, 34, 801–807. [Google Scholar] [CrossRef]
  20. Murugan, B.; Ramaswamy, A.V.; Srinivas, D.; Gopinath, C.S.; Ramaswamy, V. Effect of fuel and its concentration on the nature of Mn in Mn/CeO2 solid solutions prepared by solution combustion synthesis. Acta Mater. 2008, 56, 1461–1472. [Google Scholar] [CrossRef]
  21. Salunkhe, A.; Khot, V.; Phadatare, M.R.; Pawar, S. Combustion synthesis of cobalt ferrite nanoparticles—Influence of fuel to oxidizer ratio. J. Alloys Compd. 2012, 514, 91–96. [Google Scholar] [CrossRef]
  22. Poth, J.; Haberkorn, R.; Beck, H.P. Combustion-synthesis of SrTiO3 Part I. synthesis and properties of the ignition products. J. Eur. Ceram. Soc. 2000, 20, 707–713. [Google Scholar] [CrossRef]
  23. Masokano, D.S.; Ntola, P.; Mahomed, A.S.; Bala, M.D.; Friedrich, H.B. Influence of support properties on the activity of 2Cr-Fe/MgO-MO2 catalysts (M= Ce, Zr, CeZr and Si) for the dehydrogenation of n-octane with CO2. J. CO2 Util. 2024, 86, 102909. [Google Scholar] [CrossRef]
  24. Pradhan, S.; Bartley, J.K.; Bethell, D.; Carley, A.F.; Conte, M.; Golunski, S.; House, M.P.; Jenkins, R.L.; Lloyd, R.; Hutchings, G.J. Non-lattice surface oxygen species implicated in the catalytic partial oxidation of decane to oxygenated aromatics. Nat. Chem. 2012, 4, 134–139. [Google Scholar] [CrossRef]
  25. Asinger, F. Paraffins: Chemistry and Technology; Elsevier: Amsterdam, The Netherlands, 2016. [Google Scholar]
  26. Ntola, P.; Shozi, M. Gas-Phase Oxidative Dehydrogenation of n-Octane over Metal Oxide Catalysts: A Review. Catalysts 2024, 14, 100. [Google Scholar] [CrossRef]
  27. Kharton, V.V.; Figueiredo, F.M.; Kovalevsky, A.V.; Viskup, A.P.; Naumovich, E.N.; Yaremchenko, A.A.; Bashmakov, I.A.; Marques, F.M.B. Processing, microstructure and properties of LaCoO3−δ ceramics. J. Eur. Ceram. Soc. 2001, 21, 2301–2309. [Google Scholar] [CrossRef]
  28. Hwang, C.-C.; Wu, T.-Y. Combustion synthesis of nanocrystalline ZnO powders using zinc nitrate and glycine as reactants—Influence of reactant composition. J. Mater. Sci. 2004, 39, 6111–6115. [Google Scholar] [CrossRef]
  29. Tripathi, B.M.; Mohanty, T.; Prakash, D.; Tyagi, A.; Sinha, P. Glycine-nitrate solution combustion synthesis of lithium zirconate: Effect of fuel-to oxidant ratio on phase, microstructure and sintering. J. Eur. Ceram. Soc. 2020, 40, 136–144. [Google Scholar] [CrossRef]
  30. Toniolo, J.; Lima, M.; Takimi, A.; Bergmann, C. Synthesis of alumina powders by the glycine–nitrate combustion process. Mater. Res. Bull. 2005, 40, 561–571. [Google Scholar] [CrossRef]
  31. Xiao, X.; Liu, C.; Hu, R.; Zuo, X.; Nan, J.; Li, L.; Wang, L. Oxygen-rich bismuth oxyhalides: Generalized one-pot synthesis, band structures and visible-light photocatalytic properties. J. Mater. Chem. 2012, 22, 22840–22843. [Google Scholar] [CrossRef]
  32. Kumar, S.; Prakash, R.; Kumar, V.; Bhalerao, G.; Choudhary, R.; Phase, D. Surface and spectral studies of Eu3+ doped α-Al2O3 synthesized via solution combustion synthesis. Adv. Powder Technol. 2015, 26, 1263–1268. [Google Scholar] [CrossRef]
  33. Deganello, F.; Liotta, L.F.; Aliotta, C.; Barbucci, A.; Viviani, M.; Clematis, D.; Carpanese, M.P.; Presto, S. Clarifying the Role of the Reducers-to-Oxidizers Ratio in the Solution Combustion Synthesis of Ba0.5Sr0.5Co0.8Fe0.2O3-δ Oxygen Electrocatalysts. Catalysts 2020, 10, 1465. [Google Scholar] [CrossRef]
  34. Li, P.; Zhou, W.; Wang, X.; Zhang, Y.; Umezawa, N.; Abe, H.; Ye, J.; Wang, D. Effects of cation concentration on photocatalytic performance over magnesium vanadates. APL Mater. 2015, 3, 104405. [Google Scholar] [CrossRef]
  35. Song, J.-D.; Song, T.-Y.; Zhang, T.-T.; Wang, Y.; Luo, M.-F.; Lu, J.-Q. High performance V2O5/MgF2 catalysts for gas-phase dehydrofluorination of 1, 1, 1, 3, 3-pentafluoropropane: Support-induced evolution of new active sites. J. Catal. 2018, 364, 271–281. [Google Scholar] [CrossRef]
  36. Rahman, M.A.; Sarker, M.A.R. Synthesis, characterization and physical properties of high quality MgV2O6 crystals by solid-state reaction and ab-initio methods. J. Alloys Compd. 2019, 797, 630–639. [Google Scholar] [CrossRef]
  37. Brown, G.E.; Calas, G.; Waychunas, G.; Petiau, J.; Hawthorne, F. Spectroscopic Methods in Mineralogy and Geology; Mineralogical Society of America: Washington, DC, USA, 1988. [Google Scholar]
  38. Chaurand, P.; Rose, J.; Briois, V.; Salome, M.; Proux, O.; Nassif, V.; Olivi, L.; Susini, J.; Hazemann, J.-L.; Bottero, J.-Y. New methodological approach for the vanadium K-edge X-ray absorption near-edge structure interpretation: Application to the speciation of vanadium in oxide phases from steel slag. J. Phys. Chem. B 2007, 111, 5101–5110. [Google Scholar] [CrossRef] [PubMed]
  39. Liu, Y.; Chen, J.-F.; Zhang, Y. The effect of pore size or iron particle size on the formation of light olefins in Fischer–Tropsch synthesis. RSC Adv. 2015, 5, 29002–29007. [Google Scholar] [CrossRef]
  40. Concepción, P.; Nieto, J.L.; Pérez-Pariente, J. Oxidative dehydrogenation of propane on VAPO-5, V2O5/ALPO4-5 and V2O5/MgO catalysts. Nature of selective sites. J. Mol. Catal. A Chem. 1995, 97, 173–182. [Google Scholar] [CrossRef]
  41. Liu, Y.-M.; Cao, Y.; Zhu, K.-K.; Yan, S.-R.; Dai, W.-L.; He, H.-Y.; Fan, K.-N. Highly efficient VO x/SBA-15 mesoporous catalysts for oxidative dehydrogenation of propane. Chem. Commun. 2002, 2832–2833. [Google Scholar] [CrossRef] [PubMed]
  42. Liu, Y.-M.; Cao, Y.; Yan, S.-R.; Dai, W.-L.; Fan, K.-N. Highly effective oxidative dehydrogenation of propane over vanadia supported on mesoporous SBA-15 silica. Catal. Lett. 2003, 88, 61–67. [Google Scholar] [CrossRef]
  43. Varma, A.; Mukasyan, A.S.; Rogachev, A.S.; Manukyan, K.V. Solution combustion synthesis of nanoscale materials. Chem. Rev. 2016, 116, 14493–14586. [Google Scholar] [CrossRef]
  44. Novitskaya, E.; Kelly, J.P.; Bhaduri, S.; Graeve, O.A. A review of solution combustion synthesis: An analysis of parameters controlling powder characteristics. Int. Mater. Rev. 2021, 66, 188–214. [Google Scholar] [CrossRef]
  45. Blackburn, D.W. Catalysis of Organic Reactions; CRC Press: Boca Raton, FL, USA, 2020. [Google Scholar]
  46. Slyemi, S.; Blanchard, J.; Barama, S.; Barama, A.; Messaoudi, H.; Casale, S.; Calers, C.; Ihdene, Z. Effect of the preparation method and of the vanadium content on the physicochemical and surface properties of vanadium–magnesium-based catalysts for the selective oxidation of n-butane. Comptes Rendus Chim. 2017, 20, 1062–1071. [Google Scholar] [CrossRef]
  47. Shimada, H.; Akazawa, T.; Ikenaga, N.-o.; Suzuki, T. Dehydrogenation of isobutane to isobutene with iron-loaded activated carbon catalyst. Appl. Catal. A Gen. 1998, 168, 243–250. [Google Scholar] [CrossRef]
  48. Elkhalifa, E.A.; Friedrich, H.B. Oxidative dehydrogenation of n-octane using vanadium-magnesium oxide catalysts with different vanadium loadings. Appl. Catal. A Gen. 2010, 373, 122–131. [Google Scholar] [CrossRef]
  49. Elkhalifa, E.A.; Friedrich, H.B. Magnesium oxide as a catalyst for the dehydrogenation of n-octane. Arab. J. Chem. 2018, 11, 1154–1159. [Google Scholar] [CrossRef]
  50. Damoyi, N.E.; Friedrich, H.B.; Kruger, G.H.; Willock, D. A DFT mechanistic study of the ODH of n-hexane over isolated H3VO4. Mol. Catal. 2018, 452, 83–92. [Google Scholar] [CrossRef]
  51. Montalvo-Castro, H.; Loaiza-Orduz, Á.; Meyer, R.J.; Plaisance, C.; Hibbitts, D. Electronic and geometric features controlling the reactivity of Mg-vanadate and V2O5 surfaces toward the initial C–H activation of C1–C3 alkanes–A DFT+ U study. J. Catal. 2025, 442, 115800. [Google Scholar]
  52. Damoyi, N.E.; Friedrich, H.B.; Kruger, G.H.; Willock, D.J. A DFT study of the catalytic ODH of n-hexane over a cluster model of vanadium oxide. Mol. Catal. 2023, 541, 113078. [Google Scholar] [CrossRef]
  53. Egerton, R.F. Electron Energy-Loss Spectroscopy in the Electron Microscope; Springer Science & Business Media: Berlin/Heidelberg, Germany, 2011. [Google Scholar]
  54. Linstrom, P.J.; Mallard, W.G. The NIST Chemistry WebBook: A chemical data resource on the internet. J. Chem. Eng. Data 2001, 46, 1059–1063. [Google Scholar] [CrossRef]
Figure 1. SEM images of VOx/MgO catalysts: GLY-0.7 (a), GLY-0.9 (b), GLY-1 (c), GLY-1.2 (d), and GLY-1.6 (e).
Inorganics 13 00389 g001
Figure 2. XRD diffractograms of the VOx/MgO catalysts: GLY-0.7 (a), GLY-0.9 (b), GLY-1 (c), GLY-1.3 (d), and GLY-1.6 (e).
Inorganics 13 00389 g002
Figure 6. EELS spectrum image (A), SAED pattern, and elemental distribution maps (B) generated from STEM-EELS analysis for GLY-1.3.
Inorganics 13 00389 g006
Figure 7. EELS spectrum image (A), SAED pattern, and elemental distribution maps (B) generated from STEM-EELS analysis for GLY-1.6.
Inorganics 13 00389 g007
Figure 8. XANES spectra of the VOx/MgO catalysts.
Inorganics 13 00389 g008
Figure 10. Temperature as a function of n-octane conversion (reaction conditions: feed = 5% n-octane; C:O = 8:2 and GHSV = 8602 h−1).
Inorganics 13 00389 g010
Figure 11. Selectivity as a function of temperature for the catalysts (a) GLY-0.7, (b) GLY-0.9, (c) GLY-1, (d) GLY-1.3, and (e) GLY-1.6 (reaction conditions: feed = 5% n-octane, C:O = 8:2 and GHSV = 8602 h−1). Octenes (orange), aromatics (green), dienes (light purple), cracked products (yellow), COx (blue), and C8 products constitute octenes, aromatics, and dienes (dark purple).
Inorganics 13 00389 g011
Table 1. Calculated thermodynamic parameters for each reaction.
Catalyst NameAdiabatic Flame TemperatureQsDsDsmodTime Factor
 GLY-1.6 2246472 4.5 2.23.6
GLY-1.320654924.61.94.0
GLY-119625034.71.74.4
GLY-0.916705334.81.35.5
GLY-0.714765564.81.16.7
Qs = total energy absorbed by solid reaction products (kJ). Ds = total energy absorbed by solid reaction products per unit fuel volume (kJ/cm3). Adiabatic flame temperature calculated using modified heat of reaction, taking valency into account.
Table 2. Elemental composition of the catalysts.
Catalyst NameFuel-to-Oxidant Molar RatioV2O5 wt% (XRF)
GLY-1.61.6:113
GLY-1.31.3:116
GLY-11:114
GLY-0.90.9:115.3
GLY-0.70.7:114.1
Table 3. Surface area, crystallite size, and amount of gases formed for the catalysts.
SampleAmount of Gases Formed (mol) aCrystallite Size (nm) bSurface Area (m2/g)
GLY-0.72.6821(40)15
GLY-0.92.8330 (32)19
GLY-13.6123 (18)20
GLY-1.33.429 (25)34
GLY-1.63.7534 (29)26
a: in the combustion process; b: via the Sherrer equation—size of major phase indicated outside parentheses—MgV2O6 and Mg2V2O7 for GLY-0.7, 0.9, 1.3, and 1.6, Mg3V2O8 for GLY-1; size of MgO shown in parentheses.
Table 4. Sample description and notation.
Catalyst NameFuel-to-Oxidant Molar RatioDescription
GLY-1.61.6:1glycine richest
GLY-1.31.3:1glycine rich
GLY-11:1stoichiometric
GLY-0.90.9:1glycine lean
GLY-0.70.7:1glycine leanest
Disclaimer/Publisher’s Note: The statements, opinions and data contained in all publications are solely those of the individual author(s) and contributor(s) and not of MDPI and/or the editor(s). MDPI and/or the editor(s) disclaim responsibility for any injury to people or property resulting from any ideas, methods, instructions or products referred to in the content.