2. Results and Discussion
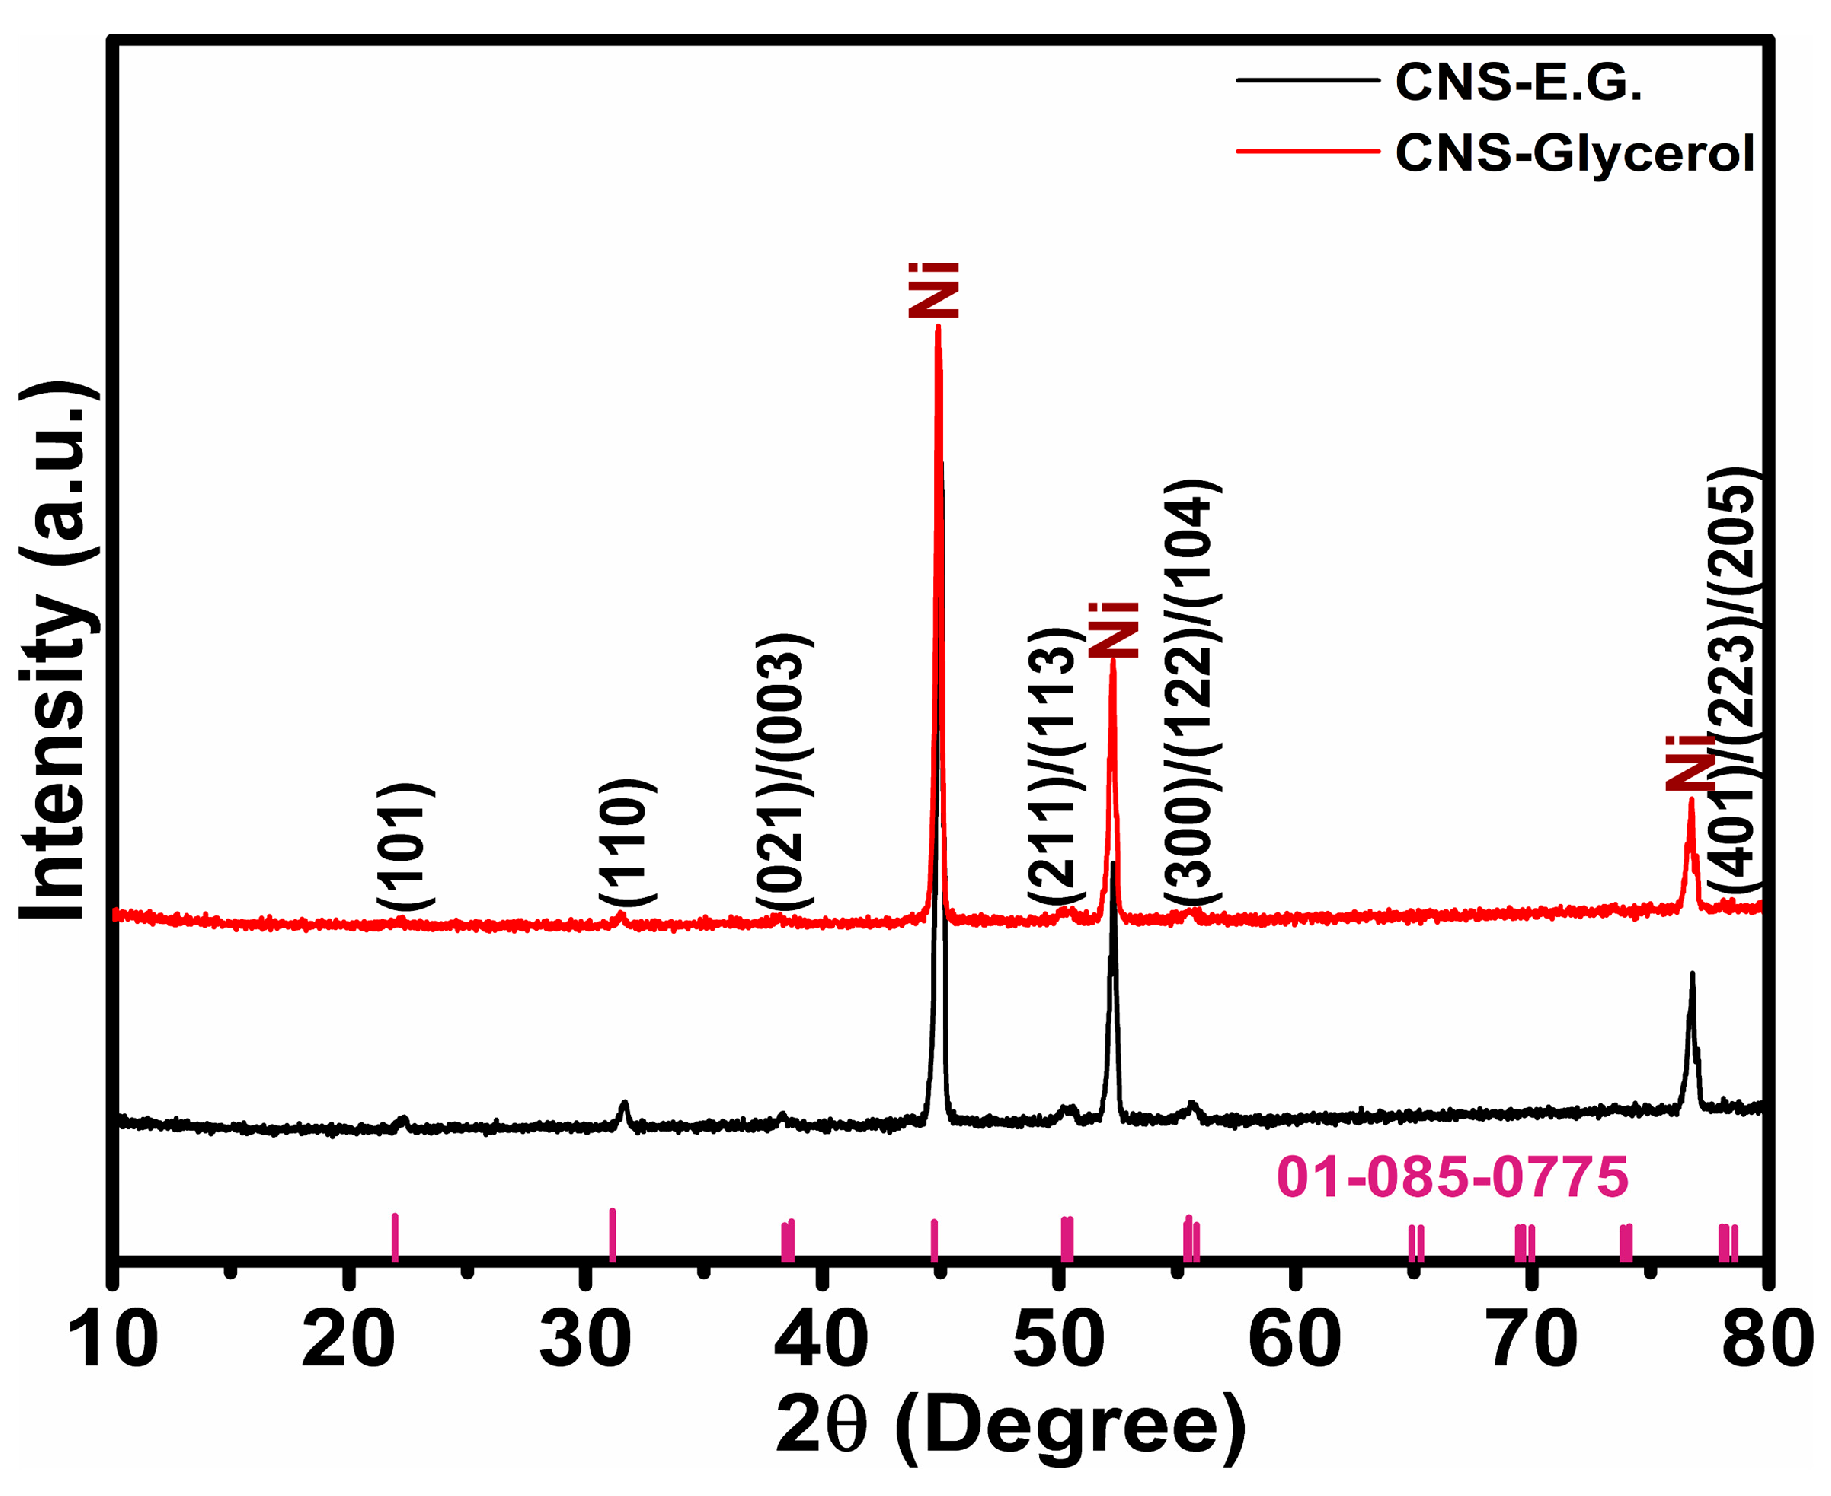
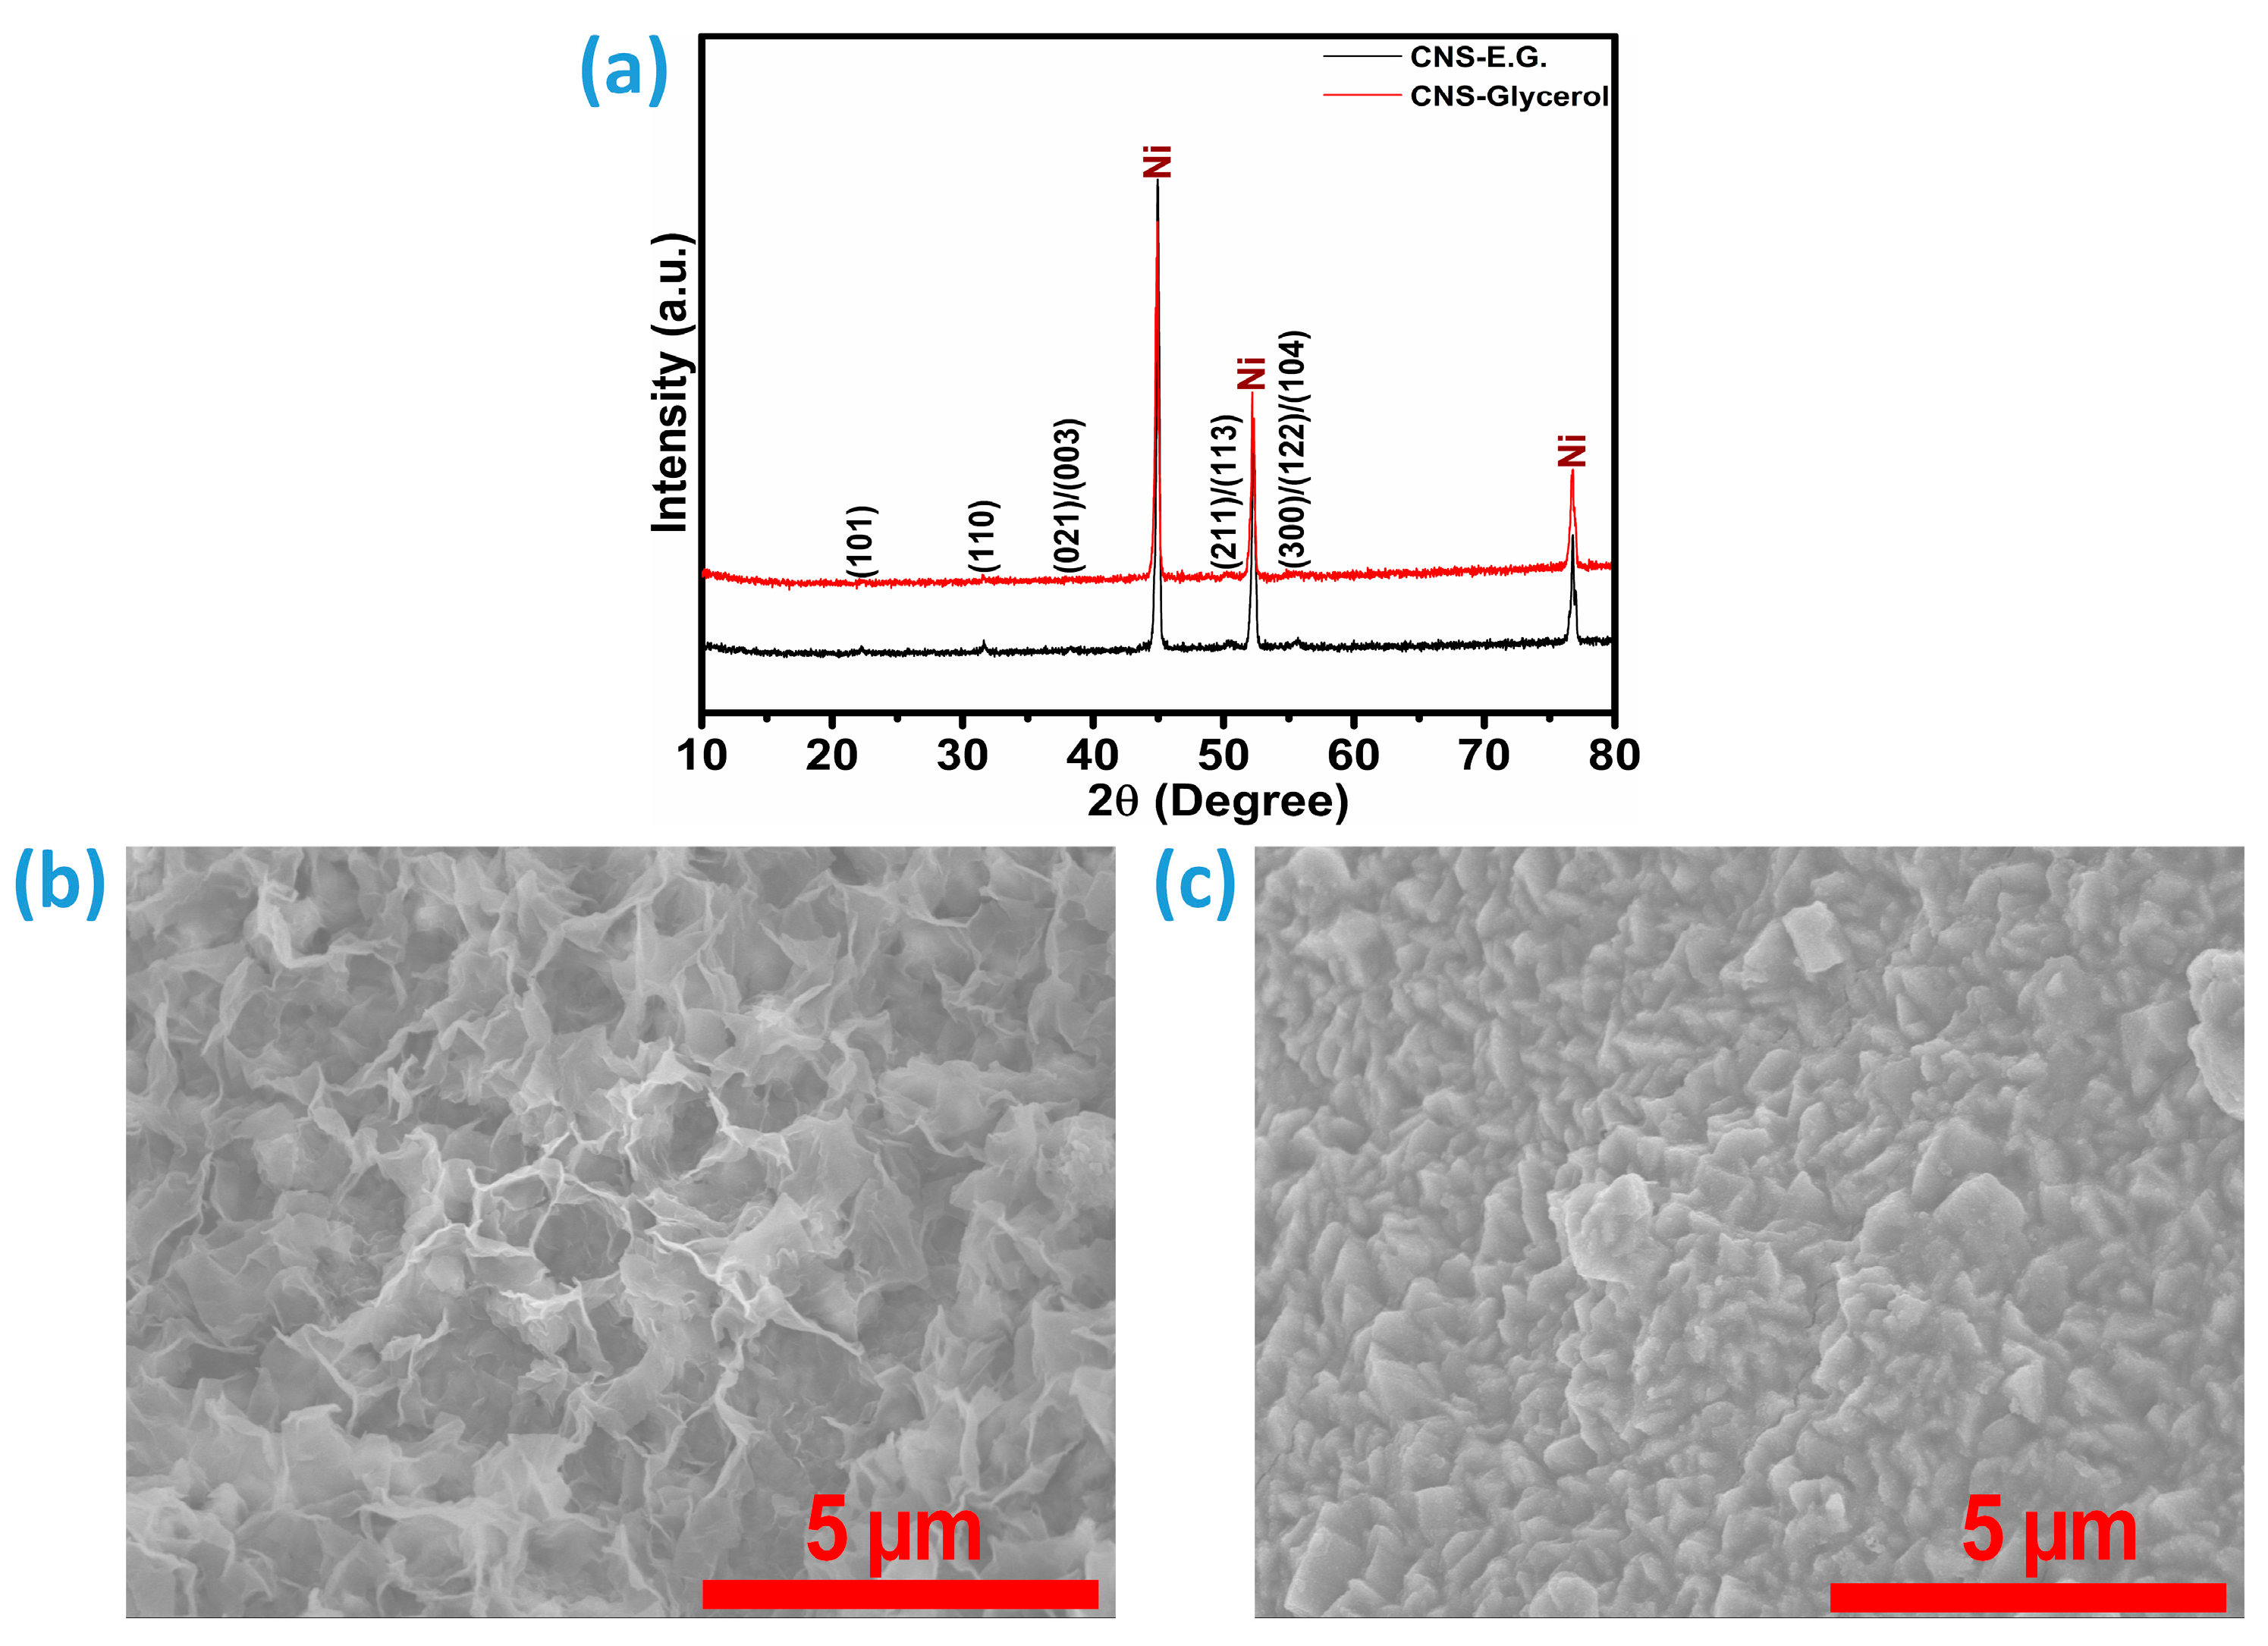
To investigate the crystallinity of the samples, X-ray diffraction (XRD) analysis was conducted on Co-Ni
3S
2 structures grown on Ni foam. The corresponding diffraction patterns are shown in
Figure 1 for Co-doped Ni
3S
2 and
Figure S1 (Supplementary Information) for pure Ni
3S
2. The synthesis involved constructing Co–Ni hydroxide frameworks within two separate solvent media: ethylene glycol and glycerol. Following the sulfurization step, the products were categorized as CNS-E.G. and CNS-Glycerol for the Co-doped Ni
3S
2 catalysts, while the corresponding undoped Ni
3S
2 samples were labeled NS-E.G. and NS-Glycerol, respectively. While the diffraction signals from the Ni foam substrate are predominant, distinct and relatively intense peaks attributed to Ni
3S
2 can still be identified, indicating the presence and crystalline nature of the active material. The sharp and prominent diffraction peaks of Ni-foam are observed at 44.9°, 52.3°, and 76.7°, corresponding to the crystallographic planes indexed according to JCPDS card No. 04-0850 [
3,
7]. The XRD peaks of the material deposited on Ni-foam, identified as Ni
3S
2, were observed at 2θ values of 22.3°, 31.65°, 38.4°, 38.7°, 44.7°, 50.2°, 50.4°, 55.4°, 55.5°, 55.8°, 78.02°, 78.20°, and 78.55°. These diffraction peaks correspond to the (101), (110), (021), (003), (202), (211), (113), (300), (122), (104), (401), (223), and (205) crystal planes of Ni
3S
2, respectively, and are consistent with the standard reference pattern JCPDS card No. 01-085-0775 or 00-044-1418 [
9,
10,
15]. This confirms the formation of Ni
3S
2 with a rhombohedral crystal structure. Successful doping of Co ions was confirmed in CNS-E.G. and CNS-Glycerol samples, as no cobalt sulfide phases were detected in the XRD analysis. However, a closer examination of the diffraction patterns reveals a shift in the Co-Ni
3S
2 reflection, synthesized using ethylene glycol, towards a higher 2θ angle, which was also noted for the pure Ni
3S
2 sample (
Figure S1). This shift indicates lattice expansion, typically associated with the solvent variation and incorporation of dopant ions with larger ionic radii, suggesting a higher degree of Co incorporation in the CNS-E.G. sample [
7,
25]. The increased Co incorporation in the ethylene glycol-synthesized sample, indicated by lattice expansion, is expected to enhance water splitting performance by improving charge transfer and increasing active sites.
Understanding the surface properties of catalysts is vital for improving electrochemical water splitting, since both the hydrogen evolution reaction (HER) and oxygen evolution reaction (OER) are surface-dependent phenomena. To explore these surface-related features, X-ray photoelectron spectroscopy (XPS) was employed to analyze the chemical states and elemental distributions present on the surfaces of the samples. Survey XPS spectra of the CNS-E.G. and CNS-Glycerol samples are illustrated in
Figure 2a, indicating the presence of Ni, Co, and S elements in the samples.
Figure 2b,c present the deconvoluted Ni 2p spectra for the CNS-E.G. and CNS-glycerol samples, respectively. Although the overall spectral profiles remain similar between the two, noticeable distinctions are evident in the binding energy positions and elusive variations within the peak structures. Both spectra prominently feature the Ni 2p
3/2 and Ni 2p
1/2 spin–orbit components, each accompanied by distinct satellite peaks, signifying the presence of nickel species. The spectral fitting indicates contributions from two oxidation states of nickel: Ni
2+ and Ni
3+ [
7,
14]. Detailed analysis reveals that each spin–orbit component (2p
3/2 and 2p
1/2) contains two major contributions with the presence of the Ni-metallic peak (Ni
0) shown in the orange color in
Figure 2b,c, respectively. The peaks rendered in cyan and olive correspond to Ni
2+ species, while those in dark yellow and violet are attributed to Ni
3+, confirming the coexistence of multiple valence states of nickel in both samples. Additionally, satellite features were identified: the satellite peak associated with the 2p
3/2 level is highlighted in magenta, while the satellite peak related to the 2p
1/2 level appears in navy blue. The binding energies corresponding to the nickel oxidation states were analyzed for both CNS-E.G. and CNS-Glycerol samples. Ni
0 peak was noted at 853 eV for CNS-E.G., and it was at 852.6 eV for the CNS-Glycerol sample. For the Ni
2+ oxidation state, the CNS-E.G. sample exhibited characteristic peaks at 854.7 eV and 872.8 eV, which are attributed to the Ni 2p
3/2 and Ni 2p
1/2 core levels, respectively. In the case of the CNS-Glycerol sample, these Ni
2+ peaks were observed at slightly lower energies of 854.5 eV and 872.5 eV for the same core orbitals. Regarding the Ni
3+ state, the CNS-E.G. sample showed peaks at 855.8 eV (2p
3/2) and 874.9 eV (2p
1/2), whereas the CNS-Glycerol counterpart presented these peaks at 855.8 eV and 874.7 eV, indicating a minor shift. Furthermore, satellite peaks corresponding to the Ni 2p
3/2 and 2p
1/2 levels appeared at 860.7 eV and 878.9 eV for the CNS-E.G. sample. In comparison, the CNS-Glycerol sample’s satellites were found at slightly lower energies of 860.4 eV and 878.7 eV, respectively [
26,
27].
As shown in
Figure 2d,e, the Co 2p spectra for the CNS-E.G. and CNS-Glycerol samples display two distinct core-level signals, corresponding to 2p
3/2 and 2p
1/2, respectively. Upon deconvolution, the CNS-E.G. spectrum reveals spin–orbit doublets in both core levels (
Figure 2d), signifying the presence of both Co
3+ and Co
2+ oxidation states along with their associated satellite features. In contrast, the 2p
3/2 core level of the CNS-Glycerol sample exhibits a spin–orbit doublet, as shown in
Figure 2e, whereas no such feature is observed in the 2p
1/2 level. This suggests that the integration of cobalt is incomplete when glycerol is used as the solvent, a conclusion that is consistent with observations from the XRD analysis. In the Co 2p XPS analysis, the Co
3+ species is characterized by distinct peaks appearing in the 2p
3/2 and 2p
1/2 regions, highlighted, respectively, by cyan and gold colors. In contrast, the Co
2+ state is marked by peaks shown in magenta for the 2p
3/2 level and navy blue for the 2p
1/2 level, which are uniquely observed in the CNS-E.G. sample spectrum. Satellite features related to these core levels are also present, with the 2p
3/2 satellite illustrated in pink and the 2p
1/2 satellite in green. For the CNS-E.G. specimen, the Co
3+ peaks were found at binding energies of 780.4 eV (2p
3/2) and 795.5 eV (2p
1/2), while Co
2+ peaks appeared at 782.6 eV and 796.3 eV for the same respective levels. The corresponding satellite peaks were located at 785.7 eV (2p
3/2) and 802.7 eV (2p
1/2). Meanwhile, in the CNS-glycerol sample, Co
3+ was detected with peaks at 780.8 eV for 2p
3/2 and 796.7 eV for 2p
1/2. The Co
2+ peak for the 2p
3/2 level was found at 784.8 eV, coinciding with a satellite peak centered at the same position. An additional satellite peak corresponding to the 2p
1/2 level was observed at 800.1 eV [
3,
17,
19,
22,
28].
The sulfur (S 2p) core-level spectra for CNS-E.G. (
Figure 2f) and CNS-Glycerol (
Figure 2g) display three prominent binding energy peaks, each corresponding to distinct sulfur chemical states. In the CNS-E.G. spectrum, peaks located at 162.0 eV and 163.3 eV, and in the CNS-Glycerol spectrum at 162.3 eV and 164.4 eV, represent the spin–orbit split doublets S 2p
3/2 and S 2p
1/2, respectively. These features are typically linked to sulfur in reduced forms, such as metal sulfides or elemental sulfur [
1,
2,
7]. Additionally, both samples exhibit a peak near 168.0 eV, characteristic of oxidized sulfur species, particularly sulfate ions (SO
42−) [
7,
9]. The occurrence of this higher energy peak implies possible surface oxidation or residual contamination from sulfur-containing precursors. Overall, this spectral interpretation sheds light on the sulfur speciation and surface chemical characteristics of the materials under investigation.
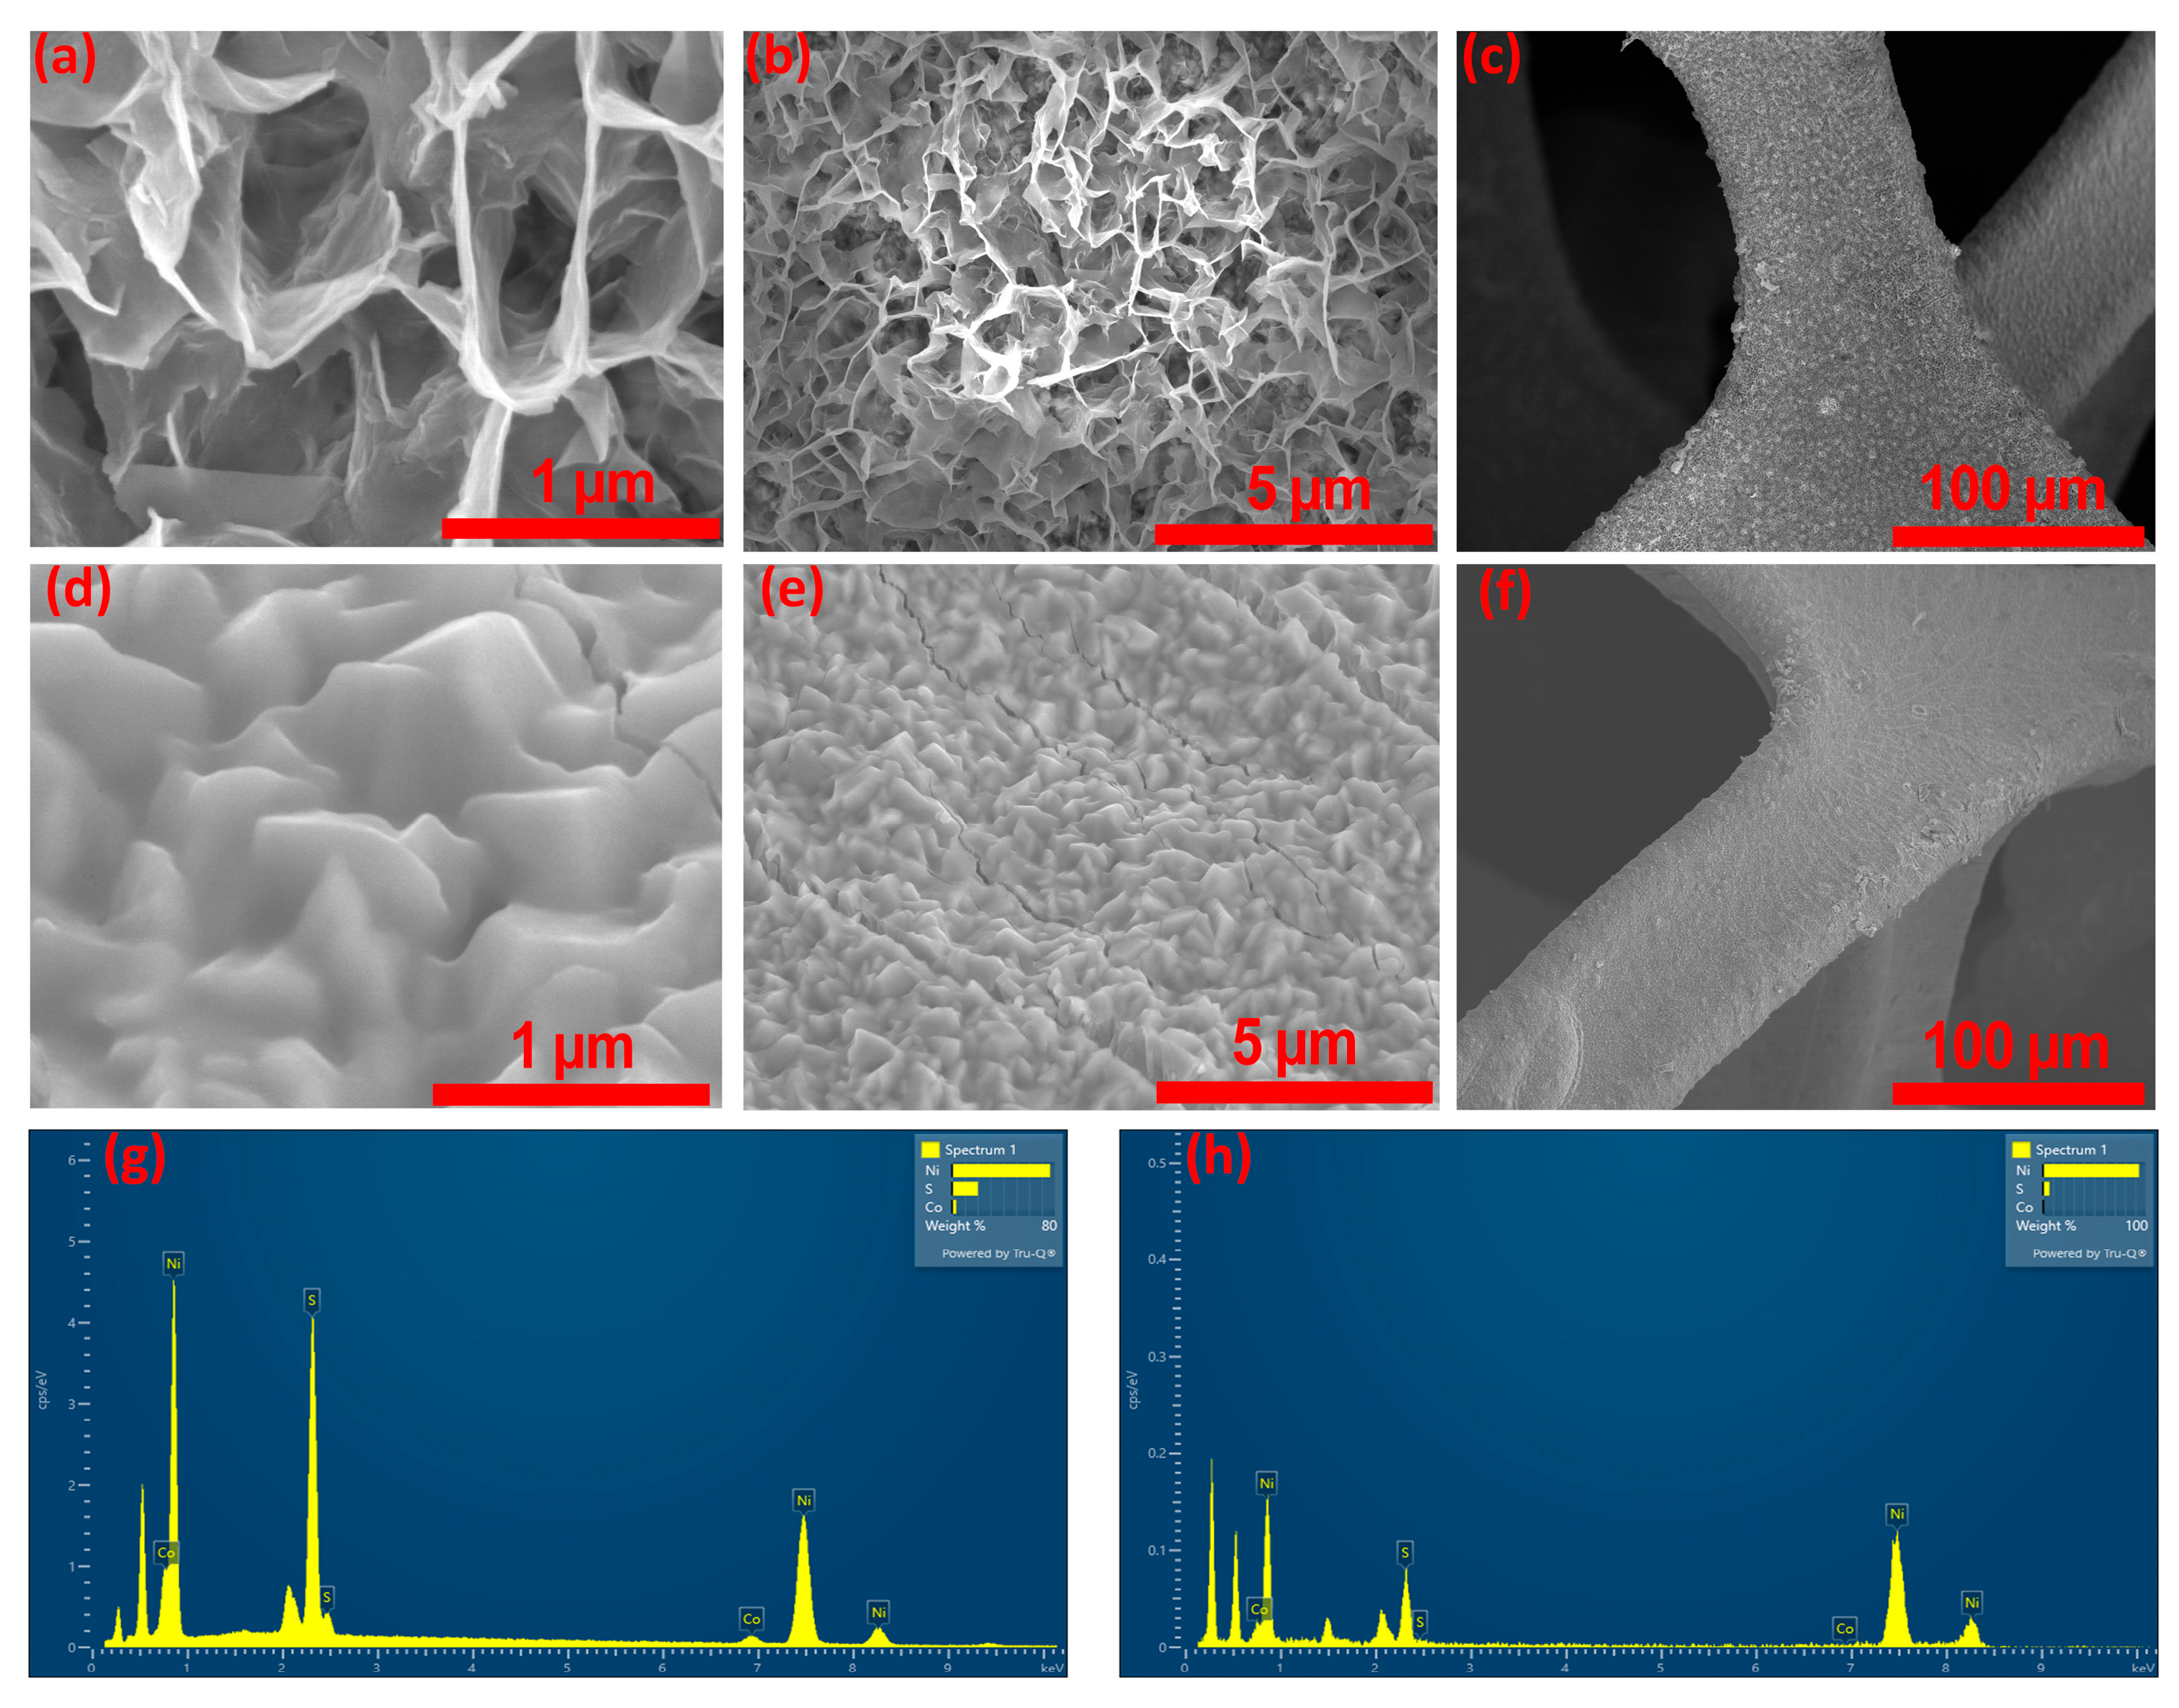
Figure 3a–f presents FE-SEM micrographs of Co-Ni
3S
2 structures synthesized on Ni-foam substrates under two different solvent conditions, examined at varying magnifications. In the case of the sample synthesized using ethylene glycol (CNS-E.G.), shown in
Figure 3a–c, the surface morphology reveals the formation of ultrathin, curled nanosheets, or “nanopetals”. These nanostructures exhibit a high degree of interconnectivity, extending uniformly across the entire Ni-foam surface. The resultant architecture resembles a compact, honeycomb-like network, which is advantageous for maximizing surface area and promoting efficient electron and ion transport pathways. In contrast, the sample prepared using glycerol as the solvent (CNS-Glycerol), depicted in
Figure 3d–f, displays a distinctly different morphological profile. Here, the Ni-foam substrate is covered with a densely packed layer of irregularly shaped particles. These particles lack a defined geometry and vary in size, yet they are evenly distributed across the substrate. Over time, their aggregation leads to the development of a slab-like or sheet-like morphology, indicating a different nucleation and growth mechanism compared to the CNS-E.G. sample. These contrasting surface features highlight the significant influence of solvent type on the microstructural evolution of Co-Ni
3S
2 during synthesis, potentially affecting the material’s electrochemical properties and overall performance in device applications. This structural variation is also noted for the pure Ni
3S
2 samples fabricated with ethylene glycol and glycerol, as noted in
Figure S2a–f, respectively. Comparing the morphology of pure Ni
3S
2 and Co-doped Ni
3S
2, it is evident that Co-doping induces significant structural transformations. In ethylene glycol, pure Ni
3S
2 shows only the initiation of nanosheet growth, whereas Co-doped Ni
3S
2 develops into highly interconnected and uniformly distributed nanosheet networks. In glycerol, pure Ni
3S
2 primarily forms agglomerated nanoparticles, while Co-doping drives the evolution of more organized sheet-like assemblies. The EDS spectra of CNS-E.G. and CNS-Glycerol are presented in
Figure 3g,h, respectively, while the corresponding spectra for NS-E.G. and NS-Glycerol are shown in
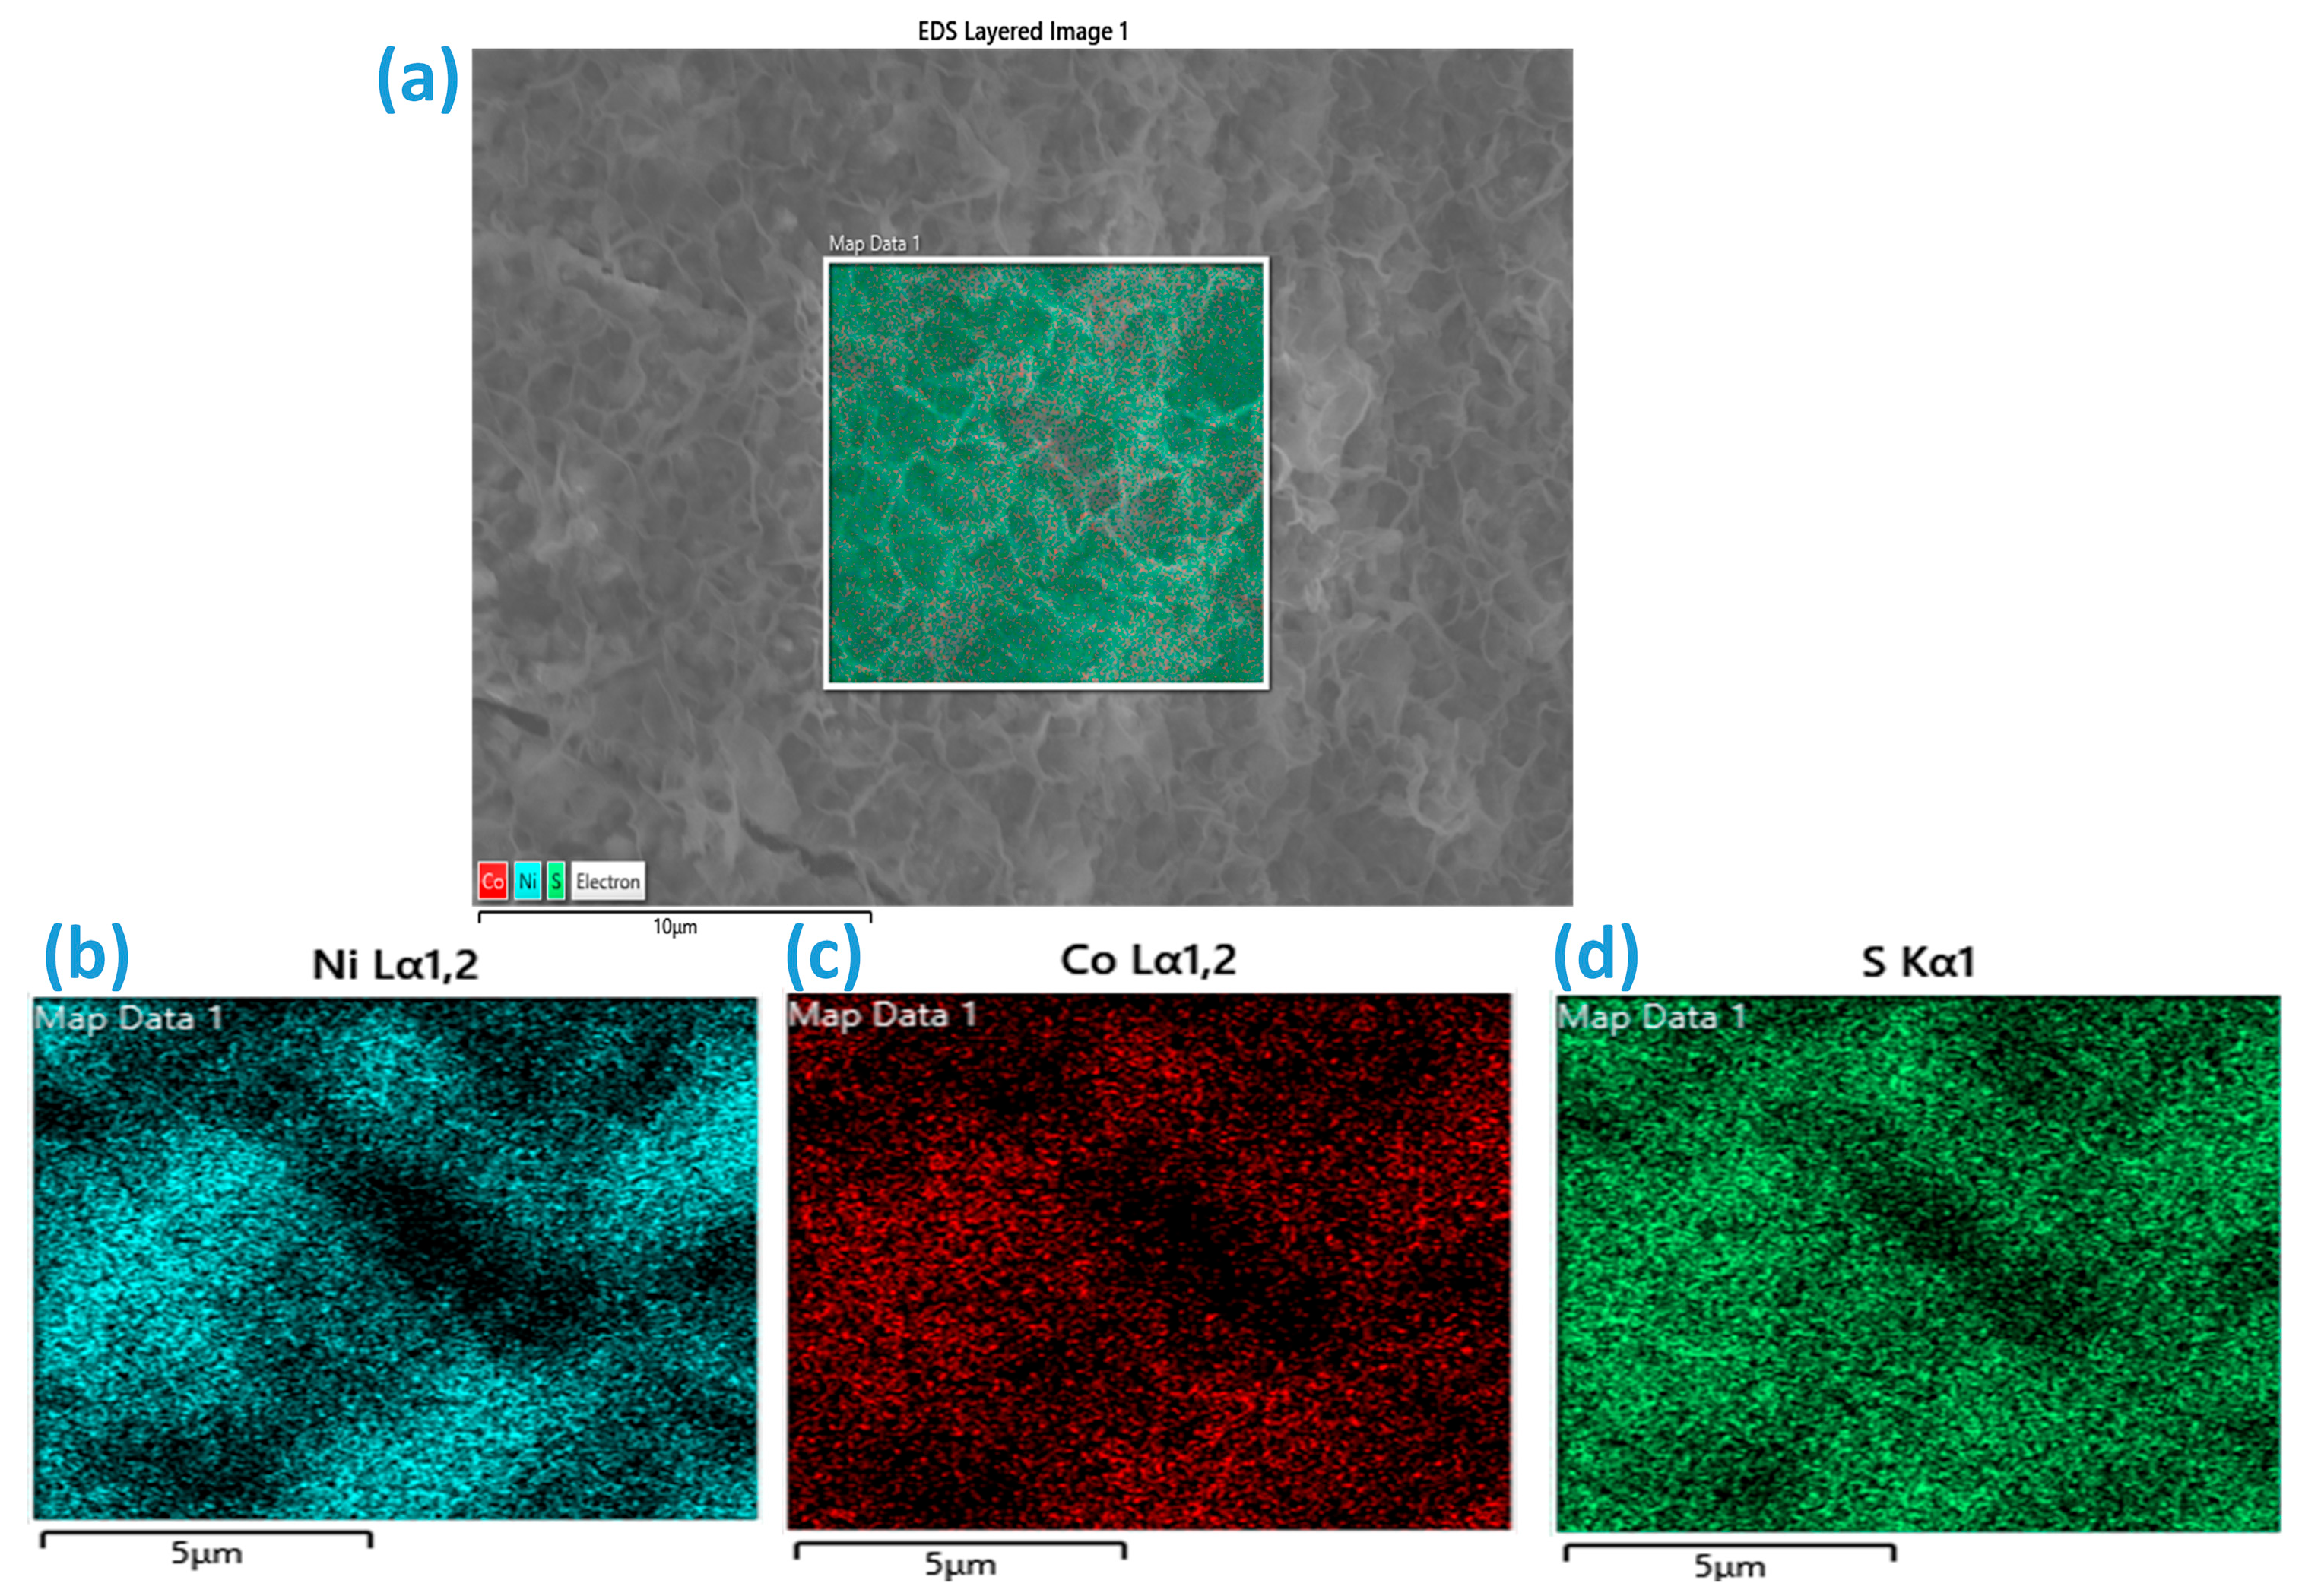
Figure S2g,h. Subsequently, elemental mapping was performed for the CNS-E.G. and CNS-Glycerol samples, as shown in
Figure 4a–d and
Figure 5a–d, respectively. EDS spectra (
Figure S2g,h) of Ni
3S
2 confirm the constitution of Ni and S elements. Furthermore, EDS with elemental mapping of Co-doped Ni
3S
2 samples confirms the presence of Ni, Co, and S elements. This indicates the successful formation of the target materials Ni
3S
2 and Co-doped Ni
3S
2.
Transmission electron microscopy (TEM) was carried out to gain deeper insight into the nanoscale structure of the CNS-E.G. sample, complementing the surface-level observations obtained from FE-SEM. As presented in
Figure 6a–d, the TEM micrographs confirm the formation of extremely thin structures that adopt a curled or petal-like morphology. These petals extend laterally over several hundred nanometers, but due to their ultrathin nature, they appear highly transparent to the electron beam. The curled and wrinkled edges, clearly visible in
Figure 6a,b, demonstrate the intrinsic flexibility of the nanopetals, a feature that is advantageous for creating a large electrochemically accessible surface area. Such wrinkling not only prevents dense stacking but also exposes a greater number of edge sites, which can act as highly active regions for ion adsorption and charge transfer. Closer examination at higher magnifications (
Figure 6c,d) reveals the presence of nanoscale pores distributed across the surface of the petals. The coexistence of ultrathin dimensions with internal porosity provides a hierarchical architecture: the thin sheets shorten electron and ion transport distances, while the pores facilitate electrolyte penetration and enhance accessibility of the internal active regions. This unique combination of curling, porosity, and ultrathin sheet morphology indicates a highly open and accessible network that is expected to significantly improve electrochemical kinetics.
High-resolution TEM (HRTEM) image, as illustrated in
Figure 6e, provides more definitive insights into the crystallinity of the nanosheets. Well-resolved lattice fringes are visible, with an interplanar spacing consistent with the (202) and (110) planes of the Co-doped Ni
3S
2 phase, which are represented in
Figure 6f,h, respectively, whereas the FFT patterns of both planes were illustrated in
Figure 6g,i. This confirms the successful incorporation of Co into the Ni
3S
2 lattice. The presence of coherent lattice fringes throughout large regions suggests high crystallinity, which is favorable for efficient charge transport. The elemental mapping results obtained from TEM, shown in
Figure 6j–m, clearly verify that the nanopetals structures are uniformly composed of nickel (Ni), cobalt (Co), and sulfur (S). This elemental distribution is consistent with the findings from other physicochemical characterization techniques, further confirming the successful formation of the intended Co-doped Ni
3S
2 composition. Selected-area electron diffraction (SAED) pattern represented in
Figure 6n collected from the nanosheets displays a set of well-defined diffraction rings/spots corresponding to the characteristic planes of Co-Ni
3S
2, in good agreement with XRD analysis. The polycrystalline nature, as indicated by the diffraction rings, further supports the nanosheet growth mechanism, in which interconnected crystalline domains are assembled into extended networks.
The hydrogen evolution reaction (HER) activities of the Ni
3S
2 and Co-doped Ni
3S
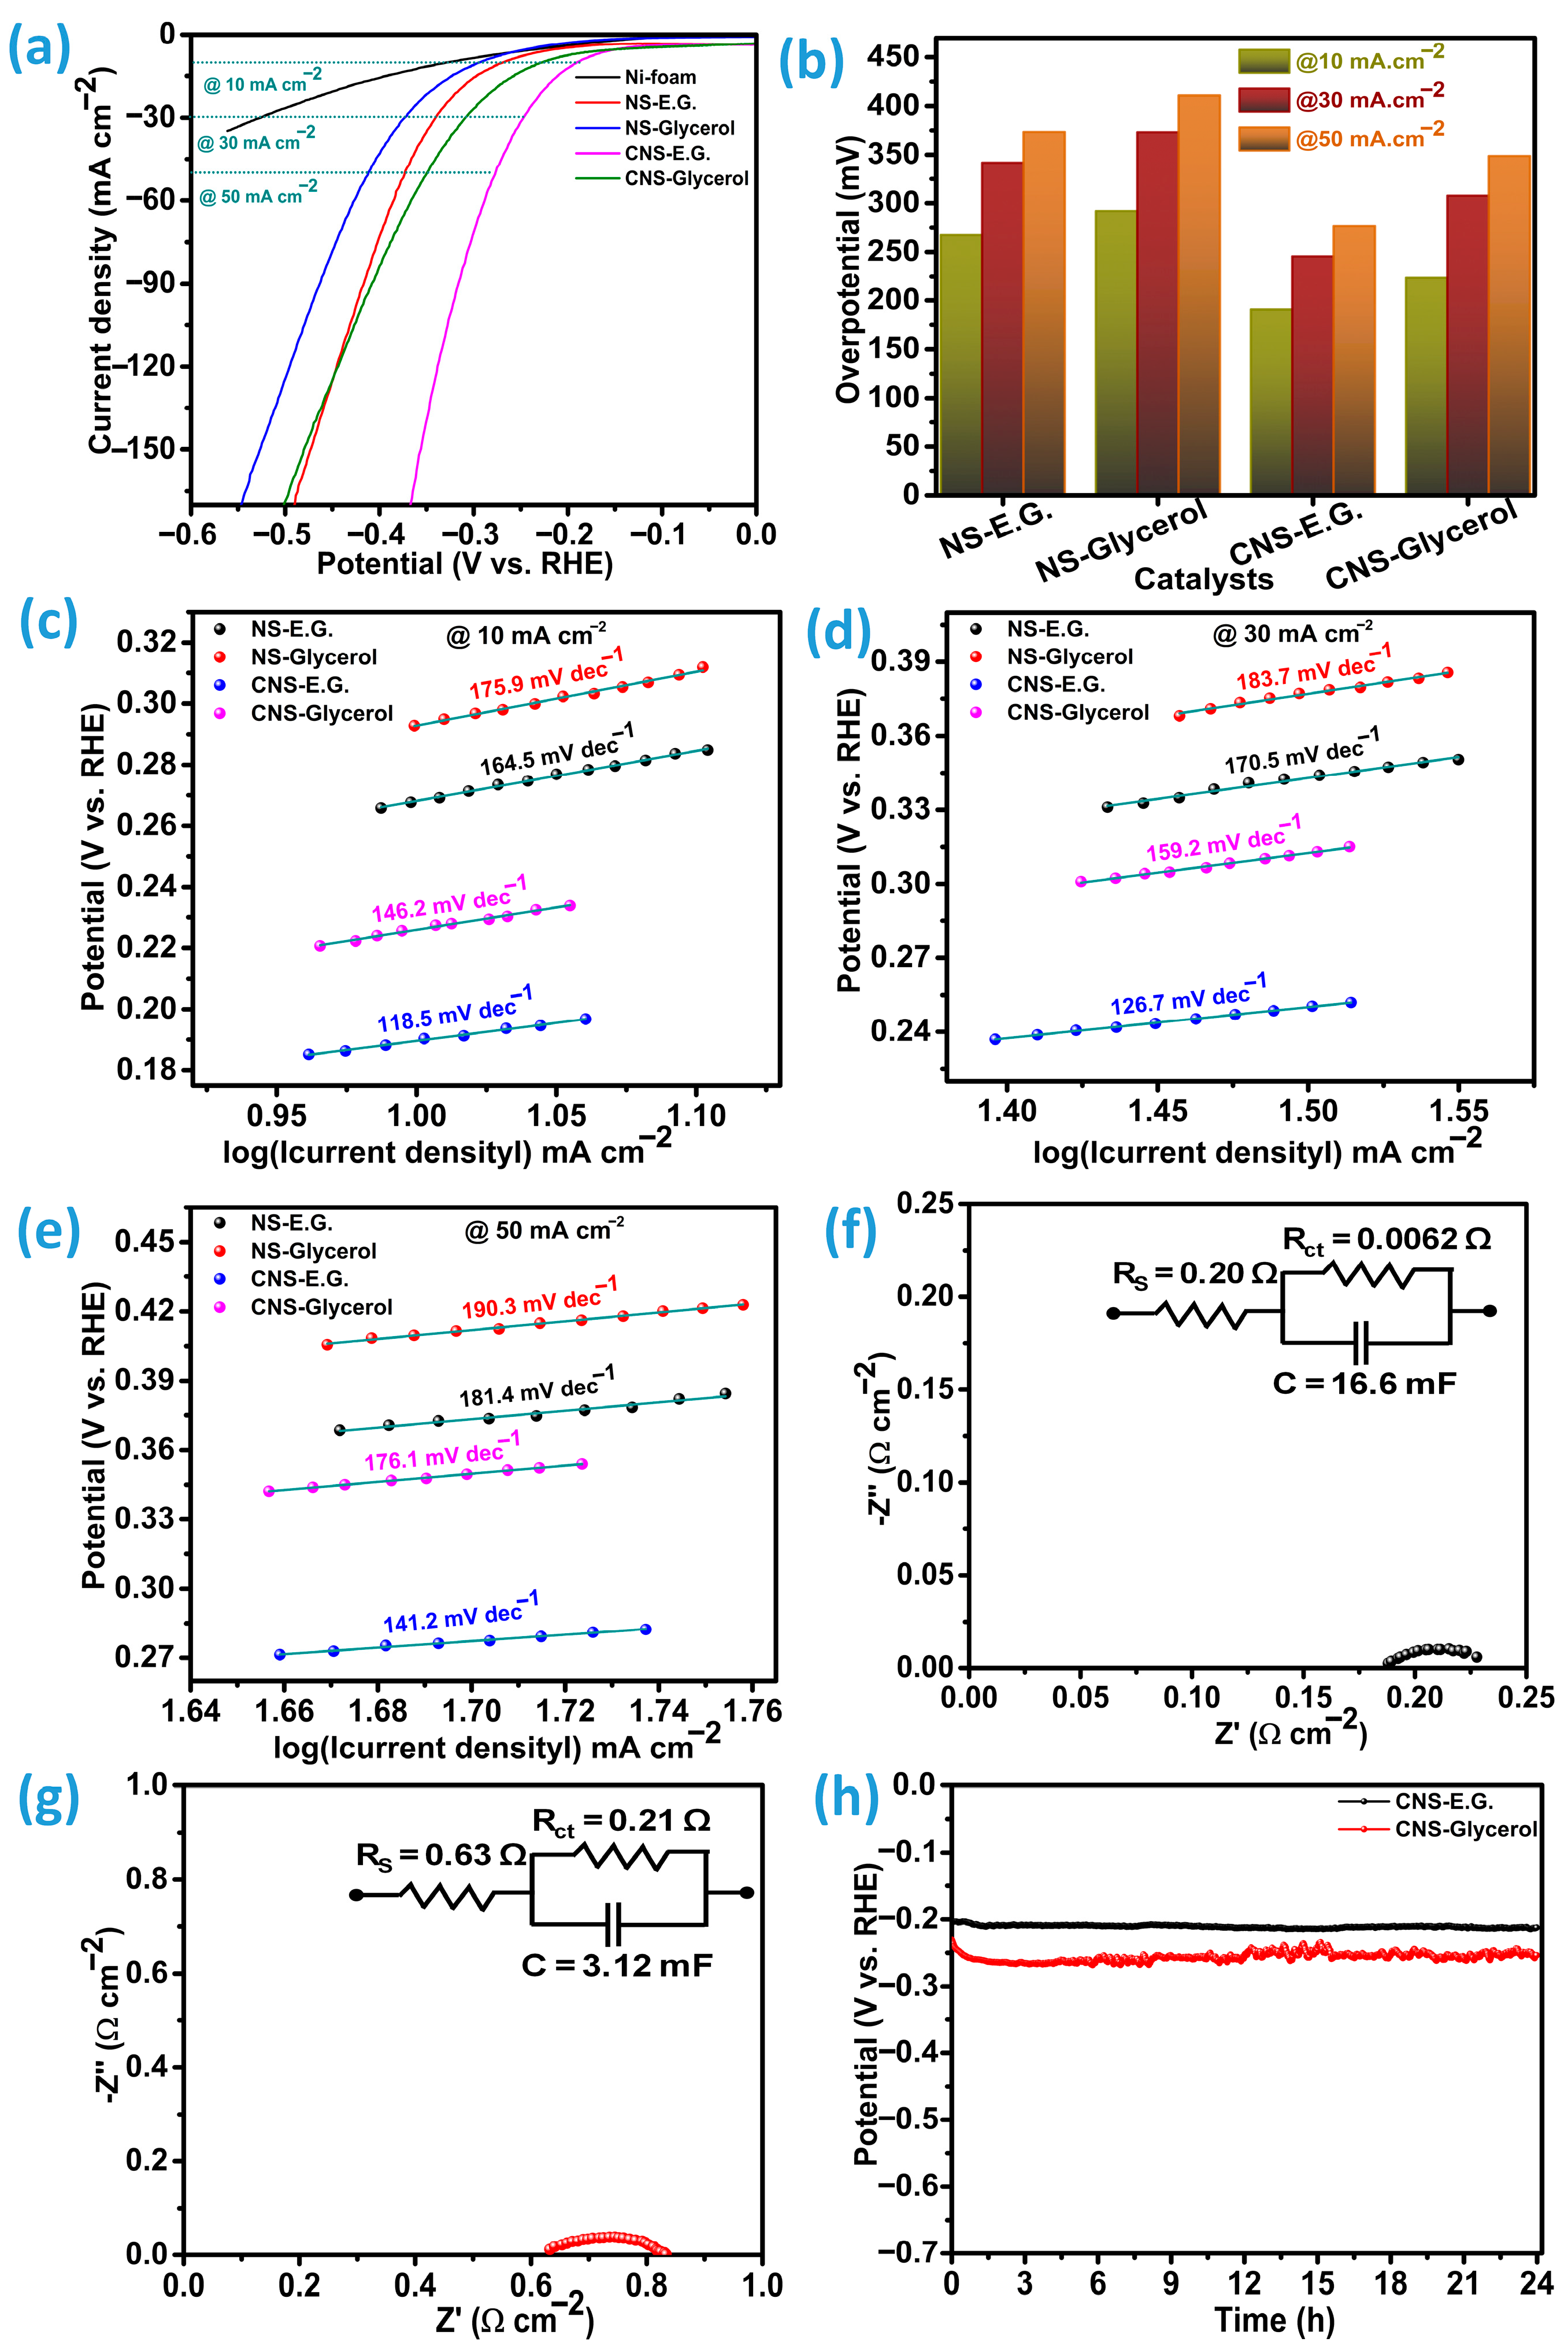
2 catalysts, NS-E.G., NS-Glycerol, CNS-E.G., and CNS-Glycerol, were evaluated through analysis of their polarization curves. To confirm the involvement of the Ni-foam current collector in the overall process, the polarization curve was obtained using the same experimental procedure and compared accordingly. Electrochemical measurements were performed using a conventional three-electrode configuration immersed in a 1.0 M KOH solution. From the linear sweep voltammetry (LSV) results depicted in
Figure 7a, the CNS-E.G. catalyst demonstrated a notably lower onset potential at 149.5 mV, whereas the CNS-Glycerol counterpart showed a higher onset potential of 182.1 mV. For the undoped Ni
3S
2 samples, the onset potential values are comparatively higher than those observed for the Co-incorporated counterparts. Specifically, the sample synthesized in ethylene glycol (NS-E.G.) exhibits an onset potential of 243.7 mV, while the sample prepared in glycerol (NS-Glycerol) shows an onset potential of 269.2 mV. This decrease in onset potential for CNS-E.G. is attributed to the ethylene glycol solvent, which enhances cobalt incorporation and fosters the development of a porous honeycomb-like architecture, thereby boosting catalytic efficiency for HER. The overpotentials corresponding to current densities of 10, 30, and 50 mA cm
−2 were also determined to compare the catalysts’ performance under different operating conditions, as presented in
Figure 7b. At these current densities, CNS-E.G. required overpotentials of 190.7, 245.6, and 276.8 mV, respectively. In contrast, CNS-Glycerol exhibited higher overpotentials of 223.8, 307.8, and 348.9 mV at the same current levels. For the pristine NS-E.G. sample, the recorded overpotentials are 267.7, 341.7, and 373.4 mV at the corresponding current densities. In contrast, the NS-Glycerol variant exhibits the largest overpotentials among all tested samples, reaching 291.9, 373.1, and 401.8 mV under the same conditions. For the pure Ni-foam current collector, the measured overpotentials are 329.2 mV at a current density of 10 mA cm
−2 and 525.7 mV at 30 mA cm
−2. However, when the current density is increased to 50 mA cm
−2, the overpotential exceeds the measurable range, indicating significant polarization and reduced electrochemical performance. These variations in overpotential with increasing current density clearly illustrate the inherent limitations of bare Ni-foam in sustaining high-rate electrochemical reactions, as depicted in
Figure 7a. These findings highlight that increasing the current density during HER leads to a pronounced increase in overpotential for all catalysts, with CNS-E.G. consistently outperforming CNS-Glycerol and two pure samples, NS-E.G. and NS-Glycerol. Specifically, the CNS-Glycerol sample shows an increase in overpotential by approximately 55.9%, whereas the CNS-Ethylene Glycol (CNS-E.G.) sample displays a comparatively lower increase of about 45.2% with an increase in current density from 10 to 50 mA cm
−2. NS-E.G. has the lowest change among all samples, with 39.5% and NS-glycerol exhibits a change of 40.5%. This suggests a stronger dependence of the CNS-Glycerol sample on the applied current density, potentially reflecting differences in intrinsic conductivity, active surface area, or catalytic efficiency between the two samples under high reaction rates.
To thoroughly understand the catalytic reaction kinetics, Tafel slope measurements were conducted at three separate current densities, 10, 30, and 50 mA cm
−2, as depicted in
Figure 7c–e. The Tafel slope serves as a vital indicator of the electrochemical reaction rate at the electrode surface, where lower values correspond to enhanced reaction efficiency and quicker electron transfer. In this investigation, the CNS-E.G. catalyst consistently exhibited reduced Tafel slope values compared to the CNS-Glycerol, NS-E.G., and NS-Glycerol catalysts across all tested current densities, highlighting its improved kinetic behavior. The CNS-E.G. catalyst exhibited Tafel slopes of 118.5, 126.7, and 141.2 mV dec
−1 at current densities of 10, 30, and 50 mA cm
−2, respectively. In contrast, the CNS-Glycerol variant demonstrated comparatively higher values of 146.2, 159.2, and 176.1 mV dec
−1 under the same testing conditions. Under identical operating parameters, the NS-E.G. sample recorded slopes of 164.5, 170.5, and 181.4 mV dec
−1, whereas the NS-Glycerol catalyst yielded the steepest slopes overall, with values of 175.9, 183.7, and 190.3 mV dec
−1. Lower Tafel slopes indicate faster reaction kinetics and more efficient charge-transfer at the electrode. The measured slopes follow the order (best → worst): CNS-E.G. (118.5–141.2 mV dec
−1) < CNS-Glycerol (146.2–176.1 mV dec
−1) < NS-E.G. (164.5–181.4 mV dec
−1) < NS-Glycerol (175.9–190.3 mV dec
−1). These findings suggest that the hydrogen evolution reaction (HER) on CNS-E.G. proceeds more efficiently via the Volmer–Heyrovsky pathway in alkaline medium [
2,
3,
18]. The noticeable difference in Tafel slopes between the two catalysts highlights the enhanced charge transfer efficiency and lower energy barrier for the electrochemical reaction in the CNS-E.G. system [
3]. This suggests that the structural and compositional features imparted by the ethylene glycol treatment contribute positively to its electrocatalytic performance, particularly under increasing current densities.
Electrochemical impedance spectroscopy (EIS) measurements were performed over a frequency spectrum ranging between 100 Hz and 100 kHz. The excitation voltage applied matched the overpotential recorded at a current density of 10 mA cm
−2. The resulting Nyquist plots for the CNS-E.G. and CNS-Glycerol catalysts are presented in
Figure 7f,g and
Figure S3a,b for NS-E.G. and NS-Glycerol, respectively, all catalysts exhibiting characteristic semicircular profiles. For quantitative analysis, the impedance spectra were modeled using an equivalent circuit, which is displayed as an inset within each Nyquist plot. In such representations, the diameter of the semicircle is directly correlated with the charge transfer resistance (Rct), a critical descriptor of how readily electrons are transported across the catalyst/electrolyte interface. A reduction in Rct corresponds to an accelerated interfacial electron exchange, thereby indicating superior catalytic kinetics. Since Rct is a rate-determining factor for electrochemical reactions, a lower value is indicative of faster charge transfer dynamics and more efficient catalytic activity. Among the catalysts investigated, CNS-E.G. exhibits the lowest Rct of 0.006 Ω·cm
2, highlighting its superior interfacial conductivity and catalytic efficiency. In contrast, CNS-Glycerol presents a substantially larger Rct of 0.21 Ω·cm
2, while the non-doped variants NS-E.G. and NS-Glycerol display intermediate values of 0.13 and 0.15 Ω·cm
2, respectively. This marked reduction in Rct for CNS-E.G. highlights the beneficial role of cobalt incorporation and the ethylene glycol–assisted synthesis route in facilitating charge transfer during the hydrogen evolution reaction (HER). In addition to Rct, the series resistance (Rs) was extracted from the high-frequency intercept of the Nyquist plots. This parameter reflects the combined ohmic contributions from the electrolyte, electrode material, and contact resistance. The Rs values determined were 0.68 Ω·cm
2 for NS-E.G., 0.92 Ω·cm
2 for NS-Glycerol, 0.20 Ω·cm
2 for CNS-E.G., and 0.63 Ω·cm
2 for CNS-Glycerol. The markedly reduced Rs of CNS-E.G. further supports the superior ionic and electronic transport pathways within this catalyst system. Taken together, the concurrent minimization of both R
ct and R
s in CNS-E.G., coupled with its reduced Tafel slope, provides compelling evidence for its enhanced catalytic efficiency in the hydrogen evolution reaction.
Furthermore, the long-term durability of the catalysts was a key parameter in evaluating their overall catalytic efficiency. To examine this, both catalysts were subjected to a continuous stability test over 24 h under a fixed current density of 10 mA cm
−2, as depicted in
Figure 7h. Despite showing comparable trends in stability, the CNS-Glycerol catalyst experienced a more pronounced decline, retaining only 90.7% of its initial HER activity. In contrast, the CNS-E.G. catalyst demonstrated better durability, maintaining approximately 95.58% of its original performance over the same period. The structural and morphological features of the CNS-E.G. and CNS-Glycerol catalysts were examined following their assessment for hydrogen evolution reaction (HER) performance. X-ray diffraction (XRD) analysis and field-emission scanning electron microscopy (FE-SEM) were employed for this purpose. As depicted in
Figure 8a, the XRD profiles reveal the diffraction characteristics of both catalyst types. Corresponding surface morphologies captured through FE-SEM are shown in
Figure 8b,c for CNS-E.G. and CNS-Glycerol, respectively. While the fundamental crystalline architecture remained stable, a minor decline in peak intensities was noted. This attenuation is likely due to enhanced exposure of the underlying nickel foam, possibly caused by ongoing electrochemical cycling.
Among the reactions that constitute water splitting, the oxygen evolution reaction (OER) is notably the most demanding. This complexity arises from a multi-step mechanism that includes four coupled proton-electron transfers, alongside the slow kinetics associated with forming the O-O bond. Enhancing the catalytic activity for OER is crucial to reducing the overpotential, thereby boosting the overall efficiency of electrochemical water-splitting devices [
9]. To evaluate the catalysts’ effectiveness in driving OER, polarization measurements were performed using a three-electrode setup at a controlled scan rate of 5 mV per second.
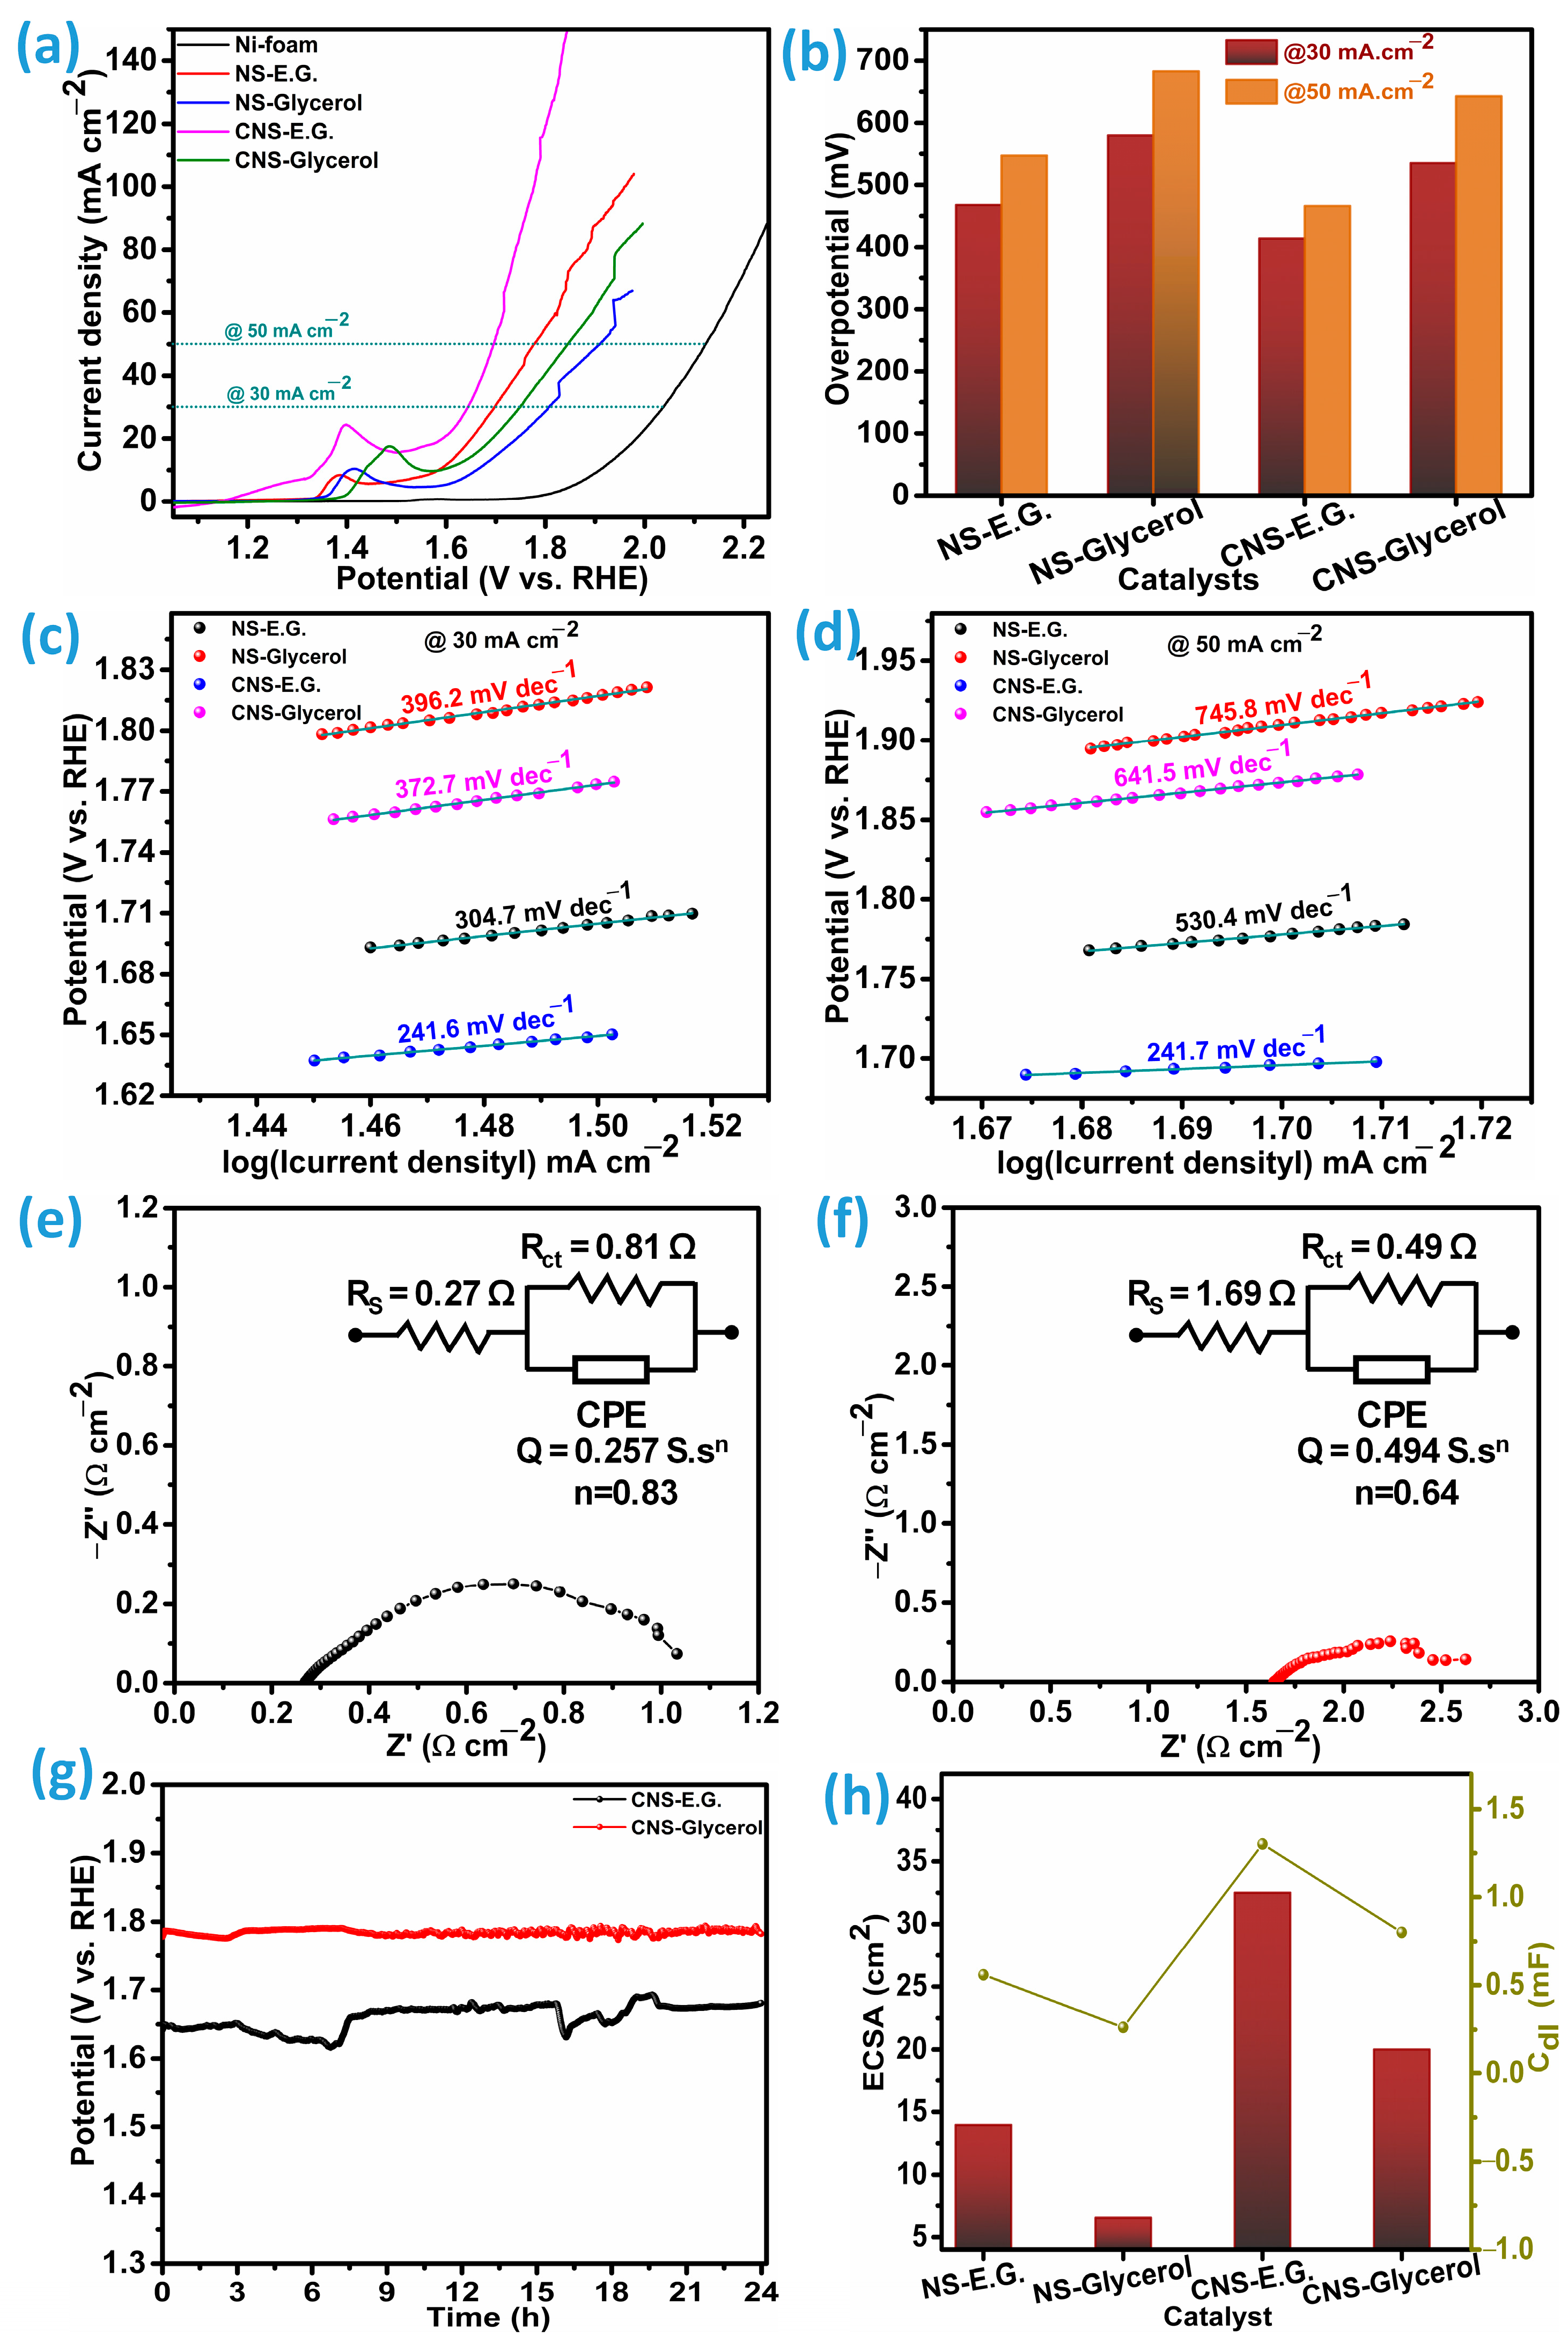
Figure 9a presents the comparative results for the NS-E.G., NS-Glycerol, CNS-E.G., and CNS-Glycerol samples. Consistent with the observations from the hydrogen evolution reaction (HER), CNS-E.G. exhibits superior OER activity, displaying a lower overpotential than the CNS-Glycerol and other pure catalysts, NS-E.G., and NS-glycerol.
Figure 9b summarizes the overpotential values measured at current densities of 30 and 50 mA·cm
−2. The Co-doped Ni
3S
2 synthesized using ethylene glycol as a solvent (CNS-E.G.) demonstrates relatively low overpotentials of 414 mV and 466 mV at 30 and 50 mA·cm
−2, respectively. In comparison, the catalyst prepared from glycerol under similar conditions (CNS-Glycerol) exhibits significantly larger overpotentials of 535 mV and 643 mV at the same current densities. In the absence of Co incorporation, the ethylene glycol-derived Ni
3S
2 (NS-E.G.) records overpotentials of 468 mV and 547 mV at 30 and 50 mA·cm
−2. These values are slightly higher than those obtained for CNS-E.G., confirming the beneficial role of Co-doping, yet remain lower than the glycerol-derived samples. For the oxygen evolution reaction (OER) performance, only the Ni-foam substrate exhibits measurable catalytic activity. At a current density of 30 mA cm
−2, the system demonstrates an overpotential of approximately 810 mV. When the applied current density is increased to 50 mA cm
−2, the required overpotential correspondingly rises to around 890 mV. This progressive increase indicates the intrinsic limitations of the Ni-foam surface in facilitating efficient oxygen evolution at higher reaction rates. The elevated overpotential at larger current densities suggests sluggish charge-transfer kinetics and a higher energy barrier for OER, emphasizing the need for surface modification or catalyst incorporation to enhance the electrochemical activity and lower the energy losses associated with the reaction. Among all catalysts studied, the non-Co-doped glycerol-derived Ni
3S
2 (NS-Glycerol) displays the poorest activity, with overpotentials reaching 580 mV and 683 mV at 30 and 50 mA cm
−2, respectively.
These results clearly indicate that (i) Co incorporation significantly lowers the overpotential, enhancing the catalytic activity, and (ii) the ethylene glycol–derived materials outperform the glycerol-derived ones, regardless of Co-doping, suggesting a favorable structural or electronic contribution from the ethylene glycol–based synthesis route. The enhanced OER activity of the CNS-E.G. catalysts is attributed to the effective incorporation of Co atoms and the strong bonding between these metal cations and the electronegative S atoms, which promotes improved electron delocalization. This modification altered the binding characteristics with the OH
* intermediate, leading to enhanced oxygen evolution reaction (OER) activity [
2]. Moreover, in the case of the CNS-E.G. catalyst, there is no significant increase in overpotential when the current density is raised from 30 mA cm
−2 to 50 mA cm
−2. This behavior suggests that, with appropriate structural and compositional modifications, such catalysts can be optimized for commercial electrocatalytic applications, where minimal overpotential at higher current densities is a key requirement [
6].
The reaction kinetics of the oxygen evolution reaction (OER) can be systematically evaluated through Tafel slope analysis across varying current densities, as depicted in
Figure 9c,d. A comparative evaluation of the catalysts demonstrates that CNS-E.G. consistently achieves smaller Tafel slopes than CNS-Glycerol, NS-E.G., and NS-Glycerol across all investigated current densities, signifying more favorable reaction kinetics. At 30 and 50 mA cm
−2, the Tafel slopes for CNS-E.G. were measured at 241.6 and 241.7 mV dec
−1, respectively. In contrast, CNS-Glycerol showed a pronounced rise in slope values at the same current densities, reaching 372.7 and 641.5 mV dec
−1. The NS-E.G. catalyst also performed better than CNS-Glycerol, recording 304.7 and 530.4 mV dec
−1 under 30 and 50 mA cm
−2, whereas NS-Glycerol exhibited the poorest performance, with the highest slopes of 396.2 and 745.8 mV dec
−1. This significant disparity underscores the enhanced oxygen evolution reaction (OER) kinetics provided by CNS-E.G. Notably, the Tafel slope for CNS-E.G. remains nearly constant between the tested current densities, unlike CNS-Glycerol, NS-E.G., and NS-Glycerol catalysts, which display a sharp increase. The stability of the slope in CNS-E.G. indicates that its electrochemical reaction pathway is relatively unaffected by variations in current density. This implies a stable rate-determining step and unaltered surface reaction conditions, which are critical for robust and efficient catalyst performance under varying operational conditions [
17]. Moreover, the dramatic increase in Tafel slope for CNS-Glycerol, NS-E.G., and NS-Glycerol at higher current densities may indicate a shift in the rate-determining step or degradation of active surface sites, both of which could compromise catalytic efficiency. In contrast, the electrochemical stability of CNS-E.G. underscores its potential as a more reliable and durable catalyst for practical OER applications.
Electrochemical Impedance Spectroscopy (EIS) was employed to analyze the charge transfer resistance (R
ct) associated with the catalysts. The electrochemical impedance spectroscopy (EIS) profiles for the cobalt-doped Ni
3S
2 (CNS) and pristine Ni
3S
2 (NS) electrodes synthesized with ethylene glycol (E.G.) and glycerol as precursors are presented in
Figure 9e,f for CNS, and in
Figure S3c,d for NS. These Nyquist plots provide a direct comparison of their interfacial charge-transport properties. For the CNS-E.G. electrode, the fitted equivalent circuit analysis revealed a charge-transfer resistance (R
ct) of 0.81 Ω·cm
−2 along with a series resistance (R
s) of 0.27 Ω·cm
−2. The relatively small semicircle diameter and low R
s value reflect highly favorable charge-transfer dynamics at the electrode-electrolyte boundary, suggesting efficient electronic conduction and ion diffusion. On the other hand, the CNS-Glycerol electrode displayed a lower R
ct of 0.49 Ω·cm
−2 but a substantially larger R
s of 1.69 Ω·cm
−2. Although the decreased R
ct indicates improved electron-transfer kinetics relative to CNS-E.G., the higher ohmic resistance points to inferior intrinsic conductivity or weaker electrolyte penetration, which counteracts the kinetic benefit. For comparison, the undoped Ni
3S
2 electrodes show poorer transport characteristics overall. The NS-E.G. electrode exhibited R
ct and R
s values of 0.56 and 1.40 Ω cm
−2, respectively, while the NS-Glycerol electrode yielded even higher resistances of 2.20 and 2.10 Ω cm
−2. These results confirm that cobalt incorporation markedly enhances both interfacial kinetics and bulk conductivity compared with the pristine sulfide. The superior performance of CNS-E.G. can be rationalized by considering its physicochemical attributes. The ethylene glycol–assisted synthesis may promote the formation of a more conductive surface network, optimized crystallinity, or favorable electronic states, which collectively reduce interfacial resistance. In contrast, the glycerol-based route seems to introduce structural or morphological features that increase series resistance despite enabling faster charge transfer.
The durability of the Co-incorporated catalysts under oxygen evolution reaction (OER) operation was systematically examined by conducting a continuous electrolysis test for 24 h at a constant current density of 30 mA cm
−2, as presented in
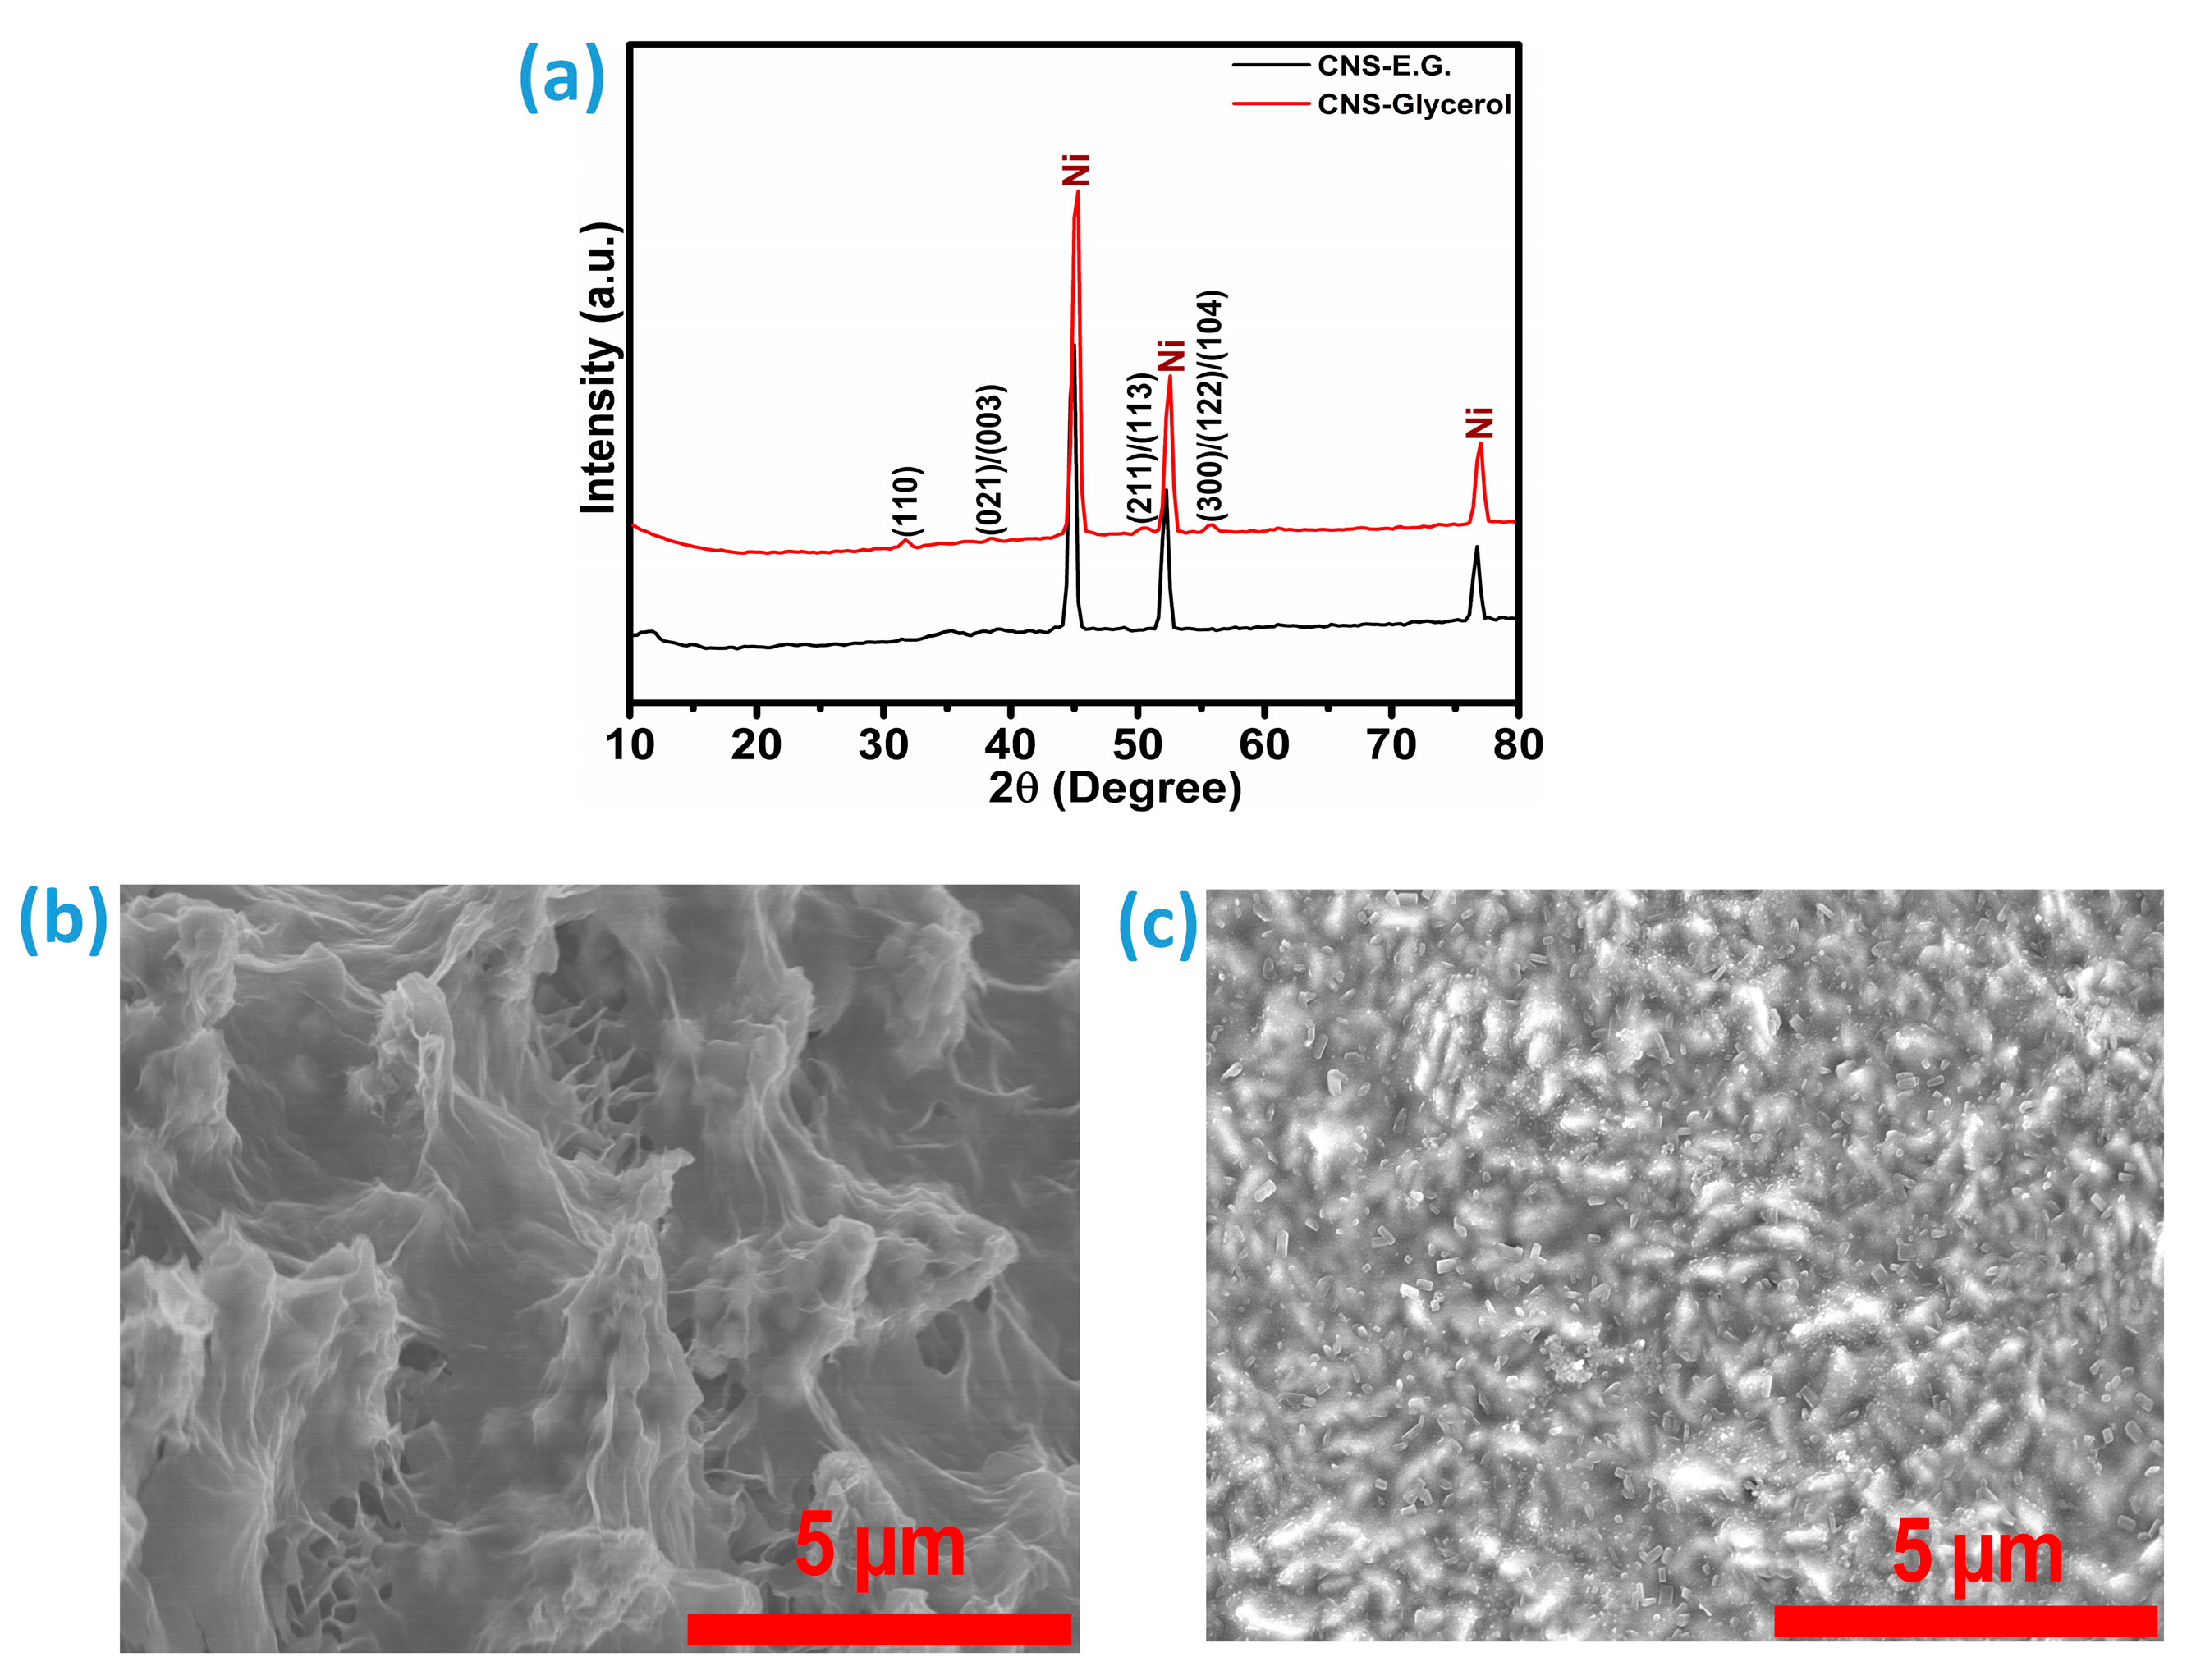
Figure 9g. Both catalytic systems retained their activity with minimal degradation, indicating strong electrochemical stability during prolonged OER operation. Quantitatively, the CNS-E.G. catalyst displayed a slight reduction of 2.31% in its initial catalytic performance after the 24 h test, corresponding to a retained activity of 97.69%. In contrast, the CNS-Glycerol catalyst showed an even lower performance decay of only 0.24%, maintaining 99.76% of its original activity. To further investigate structural resilience after long-term operation, post-stability characterization was performed using X-ray diffraction (XRD) and field-emission scanning electron microscopy (FE-SEM). The diffraction profiles (
Figure 10a) confirmed that the crystalline framework of both catalysts remained largely preserved, with only negligible variations in peak intensity or position, suggesting limited structural reorganization during operation. Complementary FE-SEM micrographs of CNS-E.G. (
Figure 10b) and CNS-Glycerol (
Figure 10c) corroborated this observation, showing that the surface morphology and nanoscale architecture were largely retained, with only minor textural modifications.
The catalytic efficiency of an electrocatalyst is predominantly dictated by the fraction of its surface that actively engages in electrochemical transformations. Importantly, this is not equivalent to the total geometric or physical surface area of the material. Instead, the critical parameter is the electrochemically accessible and catalytically active portion of the surface, which is generally expressed as the Electrochemical Surface Area (ECSA) [
7,
11]. This parameter provides a direct measure of the number of surface-active sites available for charge transfer and reaction kinetics during operation. To evaluate the ECSA of the prepared catalysts, NS-E.G., NS-Glycerol, CNS-E.G., and CNS-Glycerol cyclic voltammetry (CV) experiments were conducted, with the corresponding profiles presented in
Figure S4a–d. From these CV curves, the double-layer capacitance (C
dl) values were determined, as depicted in
Figure S5a–d. Since C
dl arises from the non-faradaic charging of the electrode-electrolyte interface, it scales proportionally with the accessible surface area. Therefore, C
dl values are widely used as a proxy for quantifying the ECSA of nanostructured catalysts. The extracted C
dl and ECSA values are summarized in
Figure 9h. Among all tested samples, the CNS-E.G. catalyst demonstrated the highest double-layer capacitance (1.3 mF) and the largest electrochemical surface area (32.5 cm
2), indicating a superior density of electrochemically active sites. The performance sequence, based on both Cdl and ECSA, follows the order: CNS-E.G. (1.3 mF, 32.5 cm
2) > CNS-Glycerol (0.8 mF, 20.01 cm
2) > NS-E.G. (0.56 mF, 13.96 cm
2) > NS-Glycerol (0.26 mF, 6.54 cm
2). This trend highlights the significant role of Co-doping and the solvent environment (ethylene glycol vs. glycerol) in enhancing the effective surface exposure of active sites, thereby improving the catalytic behavior.
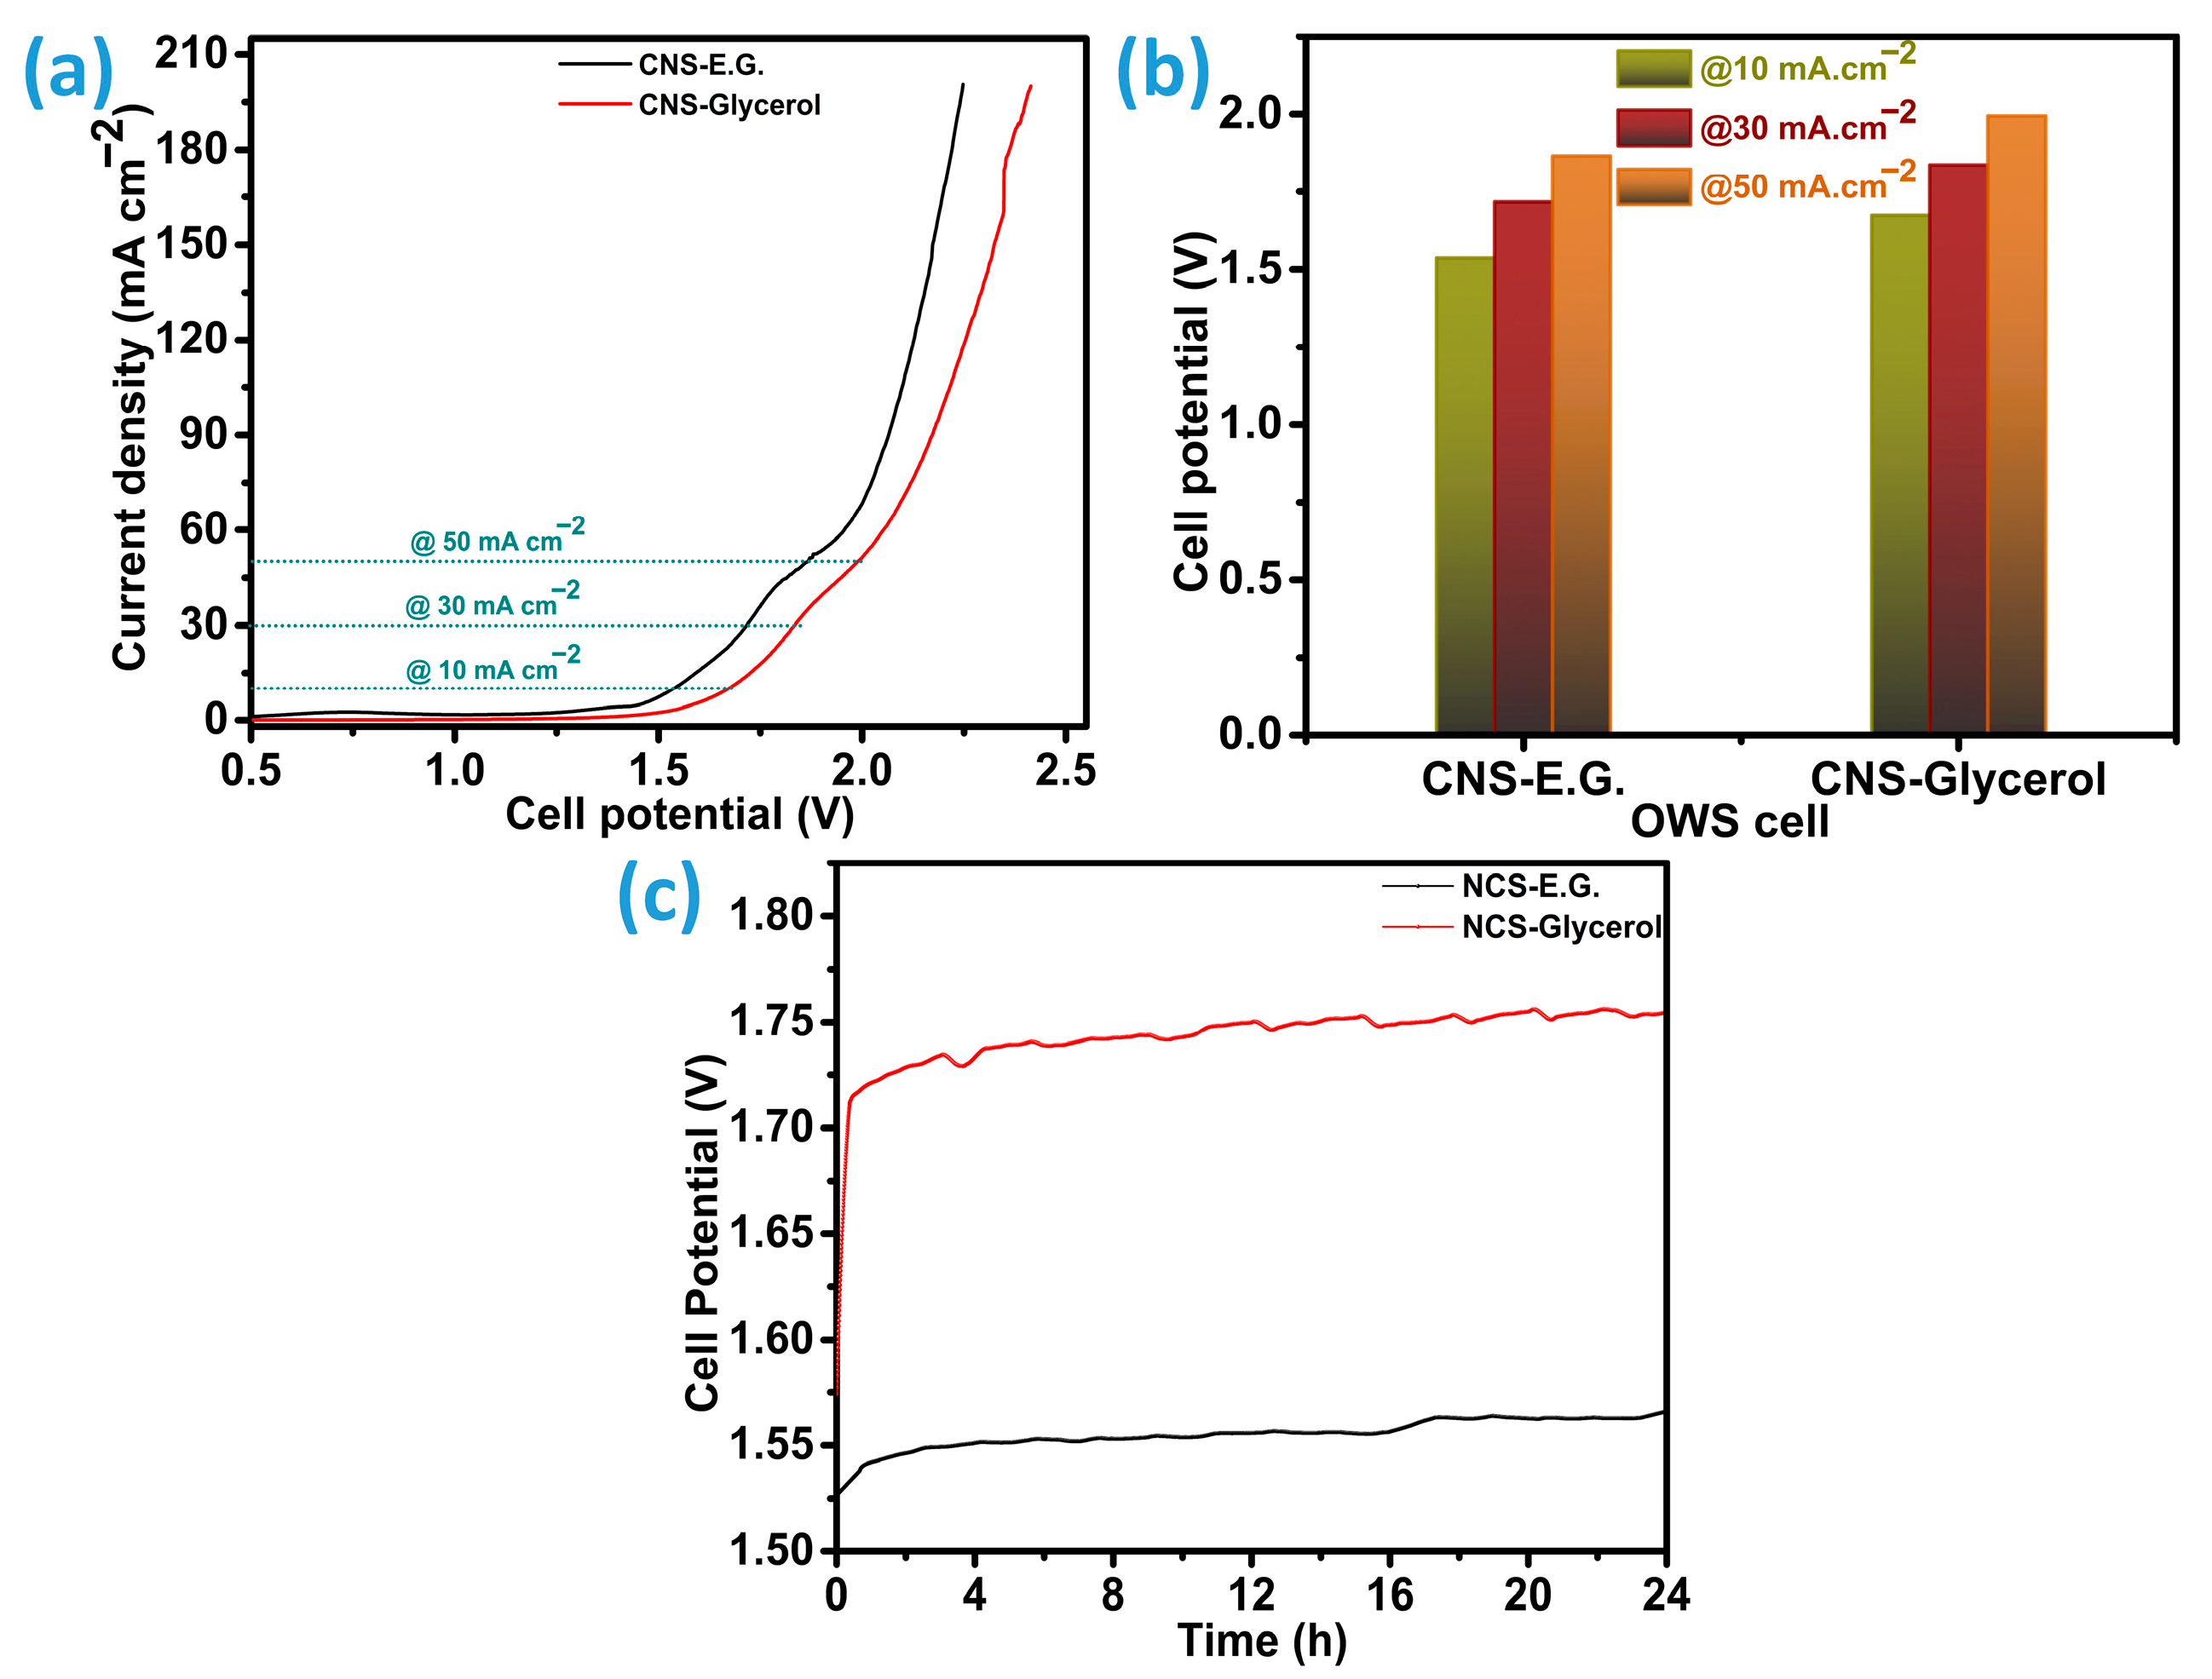
Following individual evaluations of the hydrogen evolution reaction (HER) and oxygen evolution reaction (OER) activities, a dual-electrode configuration was constructed to examine the overall water-splitting capabilities of each catalyst. Linear sweep voltammetry (LSV) was conducted at a scan rate of 5 mV s
−1 for both the CNS-E.G.//CNS-E.G. and CNS-Glycerol//CNS-Glycerol cell systems, with the corresponding performance curves depicted in
Figure 11a. These LSV profiles were utilized to determine the bifunctional catalytic efficiency, primarily through analysis of overpotentials. The electrolyzer incorporating CNS-E.G. electrodes displayed superior performance by requiring a lower voltage to sustain a current density of 10 mA cm
−2, reaching this benchmark at 1.537 V. Conversely, the CNS-Glycerol-based system demanded a higher potential of 1.674 V to achieve the same current density, indicating an approximate 8% increase. As shown in
Figure 11b, both systems exhibit a trend of increasing overpotential with rising current density. For instance, the CNS-E.G.-configured electrolyzer reached 30 mA cm
−2 at 1.717 V and 50 mA cm
−2 at 1.866 V. Under identical conditions, the CNS-Glycerol system required 1.837 V and 1.994 V to reach 30 and 50 mA cm
−2, respectively, underscoring its relatively higher energy demand. Collectively, the Co-doped Ni
3S
2 catalyst demonstrates excellent bifunctional electrocatalytic performance, often surpassing or matching the effectiveness of other Ni
3S
2-based catalysts previously documented. A detailed comparison of performance metrics is summarized in
Table 1. From the comparative evaluation, it becomes evident that the Co-doped Ni
3S
2 (CNS-E.G.) catalyst synthesized using ethylene glycol as solvent in this study demonstrates relatively modest activity toward the oxygen evolution reaction (OER) when benchmarked against pristine Ni
3S
2-based systems and state-of-the-art noble metal catalysts such as Pt/C (20 wt.% %) [
29] and RuO
2 [
30]. Despite this limitation on the anodic side, the catalyst exhibits highly competitive hydrogen evolution reaction (HER) performance. In fact, the HER activity of the CNS material is on par with, or in several cases superior to, previously reported electrocatalysts such as Ni
3S
2-CoMoS
x/NF [
9], Co-Ni
3S
2/NF [
11], Mo-Ni
3S
2 [
13], and Ni
3S
2/NF [
15]. Moreover, when implemented in a two-electrode configuration for overall water splitting, the CNS-E.G. electrolyzer surpasses the efficiency of a number of reported Ni
3S
2-based electrolytic systems. Specifically, its performance exceeds that of N-Ni
3S
2/VS
2//N-Ni
3S
2/VS
2 [
1], Ni
3S
2/NF//Ni
3S
2/NF [
8], Cd-Ni
3S
2/NF//Cd-Ni
3S
2/NF [
12], Mo-Ni
3S
2//Mo-Ni
3S
2 [
13], Fe-Mo-Ni
3S
2//Fe-Mo-Ni
3S
2 [
18], and N-Ni
3S
2/CoS
2/NF//N-Ni
3S
2/CoS
2/NF [
22]. This outcome underscores the favorable synergistic effects introduced by cobalt incorporation and the use of ethylene glycol solvent, which promotes enhanced HER activity and improved bifunctionality, ultimately translating into superior water-splitting efficiency compared to many analogous Ni
3S
2-based architectures. Chronopotentiometric tests of the CNS-E.G.//CNS-E.G. and CNS-Glycerol//CNS-Glycerol electrolyzers were done as illustrated in
Figure 11c. In both electrolyzers, the curve initially reaches the overpotential and then continues to increase steadily over time. The CNS-E.G. electrocatalyzer exhibited a 2.5% performance loss, indicating 97.5% stability. In comparison, the CNS-Glycerol electrocatalyzer showed a higher performance loss of 10.3%, corresponding to 89.7% stability relative to its original performance after 24 h. The catalyst prepared in an ethylene glycol medium (designated as CNS-E.G.) exhibits significantly enhanced electrocatalytic efficiency in various applications, namely, the hydrogen evolution reaction (HER), oxygen evolution reaction (OER), and comprehensive bifunctional catalysis when evaluated against the version synthesized using glycerol (CNS-Glycerol). This enhanced activity is likely attributable to differences in physicochemical properties as noted through various characterizations.
