Article

Unraveling the Fe-Dependent Phase Evolution and Structure of Ni-Fe/γ-Al2O3 Catalysts: A Combined Experimental and Computational Study

by
Semyon A. Gulevich
1,
Mariya P. Shcherbakova-Sandu
1,*,
Eugene P. Meshcheryakov
1,
Yurij A. Abzaev
2,
Sergey A. Guda
3,4,
Ritunesh Kumar
5,
Akshay K. Sonwane
6,
Sonali Samal
6,
Ajay K. Kushwaha
6 and
Irina A. Kurzina
1
1
Department of Chemistry, National Research Tomsk State University, 634050 Tomsk, Russia
2
Material Research Centre for Collective Use, Tomsk State University of Architecture and Building, 634003 Tomsk, Russia
3
Vorovich Institute of Mathematics, Mechanics and Computer Science, Southern Federal University, 344090 Rostov-on-Don, Russia
4
International Research Institute of Intelligent Materials, Southern Federal University, 344090 Rostov-on-Don, Russia
5
Department of Mechanical Engineering, Indian Institute of Technology Indore, Indore 453552, India
6
Department of Metallurgical Engineering and Materials Science, Indian Institute of Technology Indore, Indore 453552, India
*
Author to whom correspondence should be addressed.
Inorganics 2025, 13(11), 349; https://doi.org/10.3390/inorganics13110349
Submission received: 10 September 2025 / Revised: 9 October 2025 / Accepted: 13 October 2025 / Published: 24 October 2025
(This article belongs to the Section Inorganic Materials)

Abstract

Nickel–iron (Ni-Fe) catalysts are widely used in industry due to their cost-effectiveness and versatile catalytic properties. This work investigates the structural and morphological characteristics of Ni-Fe catalysts supported on γ-Al2O3, synthesized with varying Ni/Fe atomic ratios (from 1:1 to 20:1). The catalysts were characterized using a combination of experimental techniques including X-ray fluorescence (XRF), X-ray diffraction (XRD), scanning and transmission electron microscopy (SEM/TEM), and selected-area electron diffraction (SAED). Theoretical modeling using the USPEX evolutionary algorithm complemented the experimental data by predicting stable Ni-Fe crystal structures. The results revealed uniform metal distribution on the support with particle sizes ranging from 4.1 to 4.5 nm. SAED analysis confirmed the formation of an intermetallic FeNi phase, particularly in samples with higher iron content. This study demonstrates Ni-Fe interaction effects and will be of interest to researchers in catalysis and materials science working on the development of bimetallic systems.

Graphical Abstract

1. Introduction

Nickel-based (Ni) catalysts are widely used in various industrial sectors due to their cost-effectiveness compared to noble metals and their diverse catalytic properties. However, Ni-based catalysts are very easily deactivated at high temperatures in the presence of carbon and sulfur-containing compounds. The incorporation of iron (Fe) in Ni-Fe bimetallic catalysts enhances the stability of the active component through a synergistic effect [1]. Ni-Fe catalysts play a key role in the hydrogen production from methane, which is then used to produce synthesis gas (a mixture of CO and H2) and hydrogen for use in fuel cells, the synthesis of ammonia, and other chemical processes [2,3,4,5]. Ni-Fe catalysts are also effective in Fischer–Tropsch synthesis, producing liquid hydrocarbons from syngas derived from coal, natural gas or biomass [6]. Varying the Ni/Fe ratio allows the composition of the resulting products to be controlled [7].
Ni-Fe catalysts are used in the pyrolysis and gasification of biomass to produce bio-oil, biochar and syngas. These catalysts facilitate the cleavage of the complex organic molecules present in biomass [8,9]. Ni-Fe catalysts have also been used in the hydrogenation of unsaturated carbonyls, such as furfural [10], as well as in the hydrogenation of natural oils (e.g., animal fats and vegetable oils) [11], waste oils (e.g., used cooking oil and acid oil) [11], aromatic compounds [12], and nitro compounds [13,14]. Significant progress has been made in the production of green diesel through the deoxygenation of lipids using Ni-Fe catalysts [15].
Ni-Fe catalysts are used for the selective catalytic reduction (SCR) of nitrogen oxides (NOx) in emissions from power plants, diesel engines and industrial facilities [16]. They can also be used for the catalytic oxidation or reduction of organic pollutants in wastewater, breaking them down into less harmful substances [17,18]. Ni-Fe catalysts have the potential to decompose hydrazine, which is used as rocket fuel and for nitrogen production [19].
Ni-Fe catalysts are being developed for the electrochemical reduction of CO2 to CO and methane [20,21]. This area of research is crucial for reducing greenhouse gas emissions and producing valuable chemicals [22]. Due to their high catalytic activity in alkaline electrolytes, oxide Ni-Fe electrocatalysts are of interest for various applications, including electrolysers and solar-powered water splitting devices [23]. Ni-Fe alloys are being investigated as catalysts for certain types of fuel cell, particularly for fuel oxidation at the anode [24,25]. Figure 1 shows the main areas of application of nickel–iron catalysts.
A key challenge in developing Ni-Fe catalysts is controlling their phase composition and morphology and establishing structure-activity relationships [26]. A catalyst’s efficiency is determined by its Ni/Fe ratio, structural type, particle size, the type of support used, the process parameters and the synthesis method [27,28,29].
When selecting Ni-Fe catalysts for specific applications, it is important to consider these factors in order to optimize their characteristics and ensure high process efficiency. Combining theoretical calculations with experimental catalyst characterization methods enables the prediction of possible crystalline structures of Ni-Fe alloys, intermetallic compounds and oxides, including both known and novel structures that have not been studied before. This approach provides a fundamental understanding of how surface structure influences catalytic activity.
This study focuses on investigating the effect of varying Fe additives on the structure of Ni-Fe bimetallic catalysts supported on γ-Al2O3. γ-Al2O3 is one of the most widely used industrial catalyst supports due to its high specific surface area, thermal stability, and well-developed porous structure, which ensures high dispersion of the active component. A comprehensive approach was employed in this study, combining experimental characterization methods with theoretical modeling of crystal structures, to thoroughly investigate Ni-Fe-based catalytic materials. The experimental studies focused on obtaining empirical data on the phase composition, morphology, dispersity and electronic properties of the synthesized catalysts. Specifically, the following techniques were utilized: X-ray diffraction analysis; X-ray fluorescence analysis; scanning and transmission electron microscopy combined with energy-dispersive spectroscopy; selected-area electron diffraction; and low-temperature nitrogen adsorption–desorption.
Theoretical modeling was performed using the USPEX evolutionary algorithm to obtain complementary information about possible crystalline structures of Ni-Fe compounds. This method is based on the principles of evolutionary optimization. Unlike traditional approaches, which require preliminary information about known structures, USPEX can predict both stable and metastable crystalline phases based solely on the chemical composition of the system (Ni and Fe) [30,31,32].

2. Results and Discussion

To investigate the relationship between the composition and structure of the catalysts, samples with target Ni/Fe atomic ratios of 1Ni-1Fe/Al2O3, 5Ni-1Fe/Al2O3, 10Ni-1Fe/Al2O3, and 20Ni-1Fe/Al2O3 were prepared. The actual elemental composition and textural properties of the samples, as determined by XRF and low-temperature nitrogen adsorption–desorption measurements, are presented in Table 1. The experimentally determined atomic ratios and total metal content closely matched the calculated synthesis values, confirming that the impregnation process was successfully completed.
Low-temperature nitrogen adsorption–desorption analysis revealed a slight decrease in specific surface area and pore volume for samples with a higher iron content. While these variations are extremely small and fall within the margin of experimental error, their systematic nature suggests increased nanoparticle dispersion and partial pore blocking by metal particles. A systematic minor reduction in pore volume is also observed from the pore size distribution curves (Figure S1). This leads to reduced pore volume and consequently a lower surface area. The observed increase in average pore diameter for the sample with the highest Fe content may also indicate that smaller support pores are partially blocked by metal nanoparticles. This trend is additionally corroborated by the monometallic Fe/Al2O3 sample, where the reduction in pore volume and specific surface area is more visible. It is important to note that the metal deposition was confirmed to have no significant impact on the fundamental properties or surface morphology of the γ-Al2O3 support.
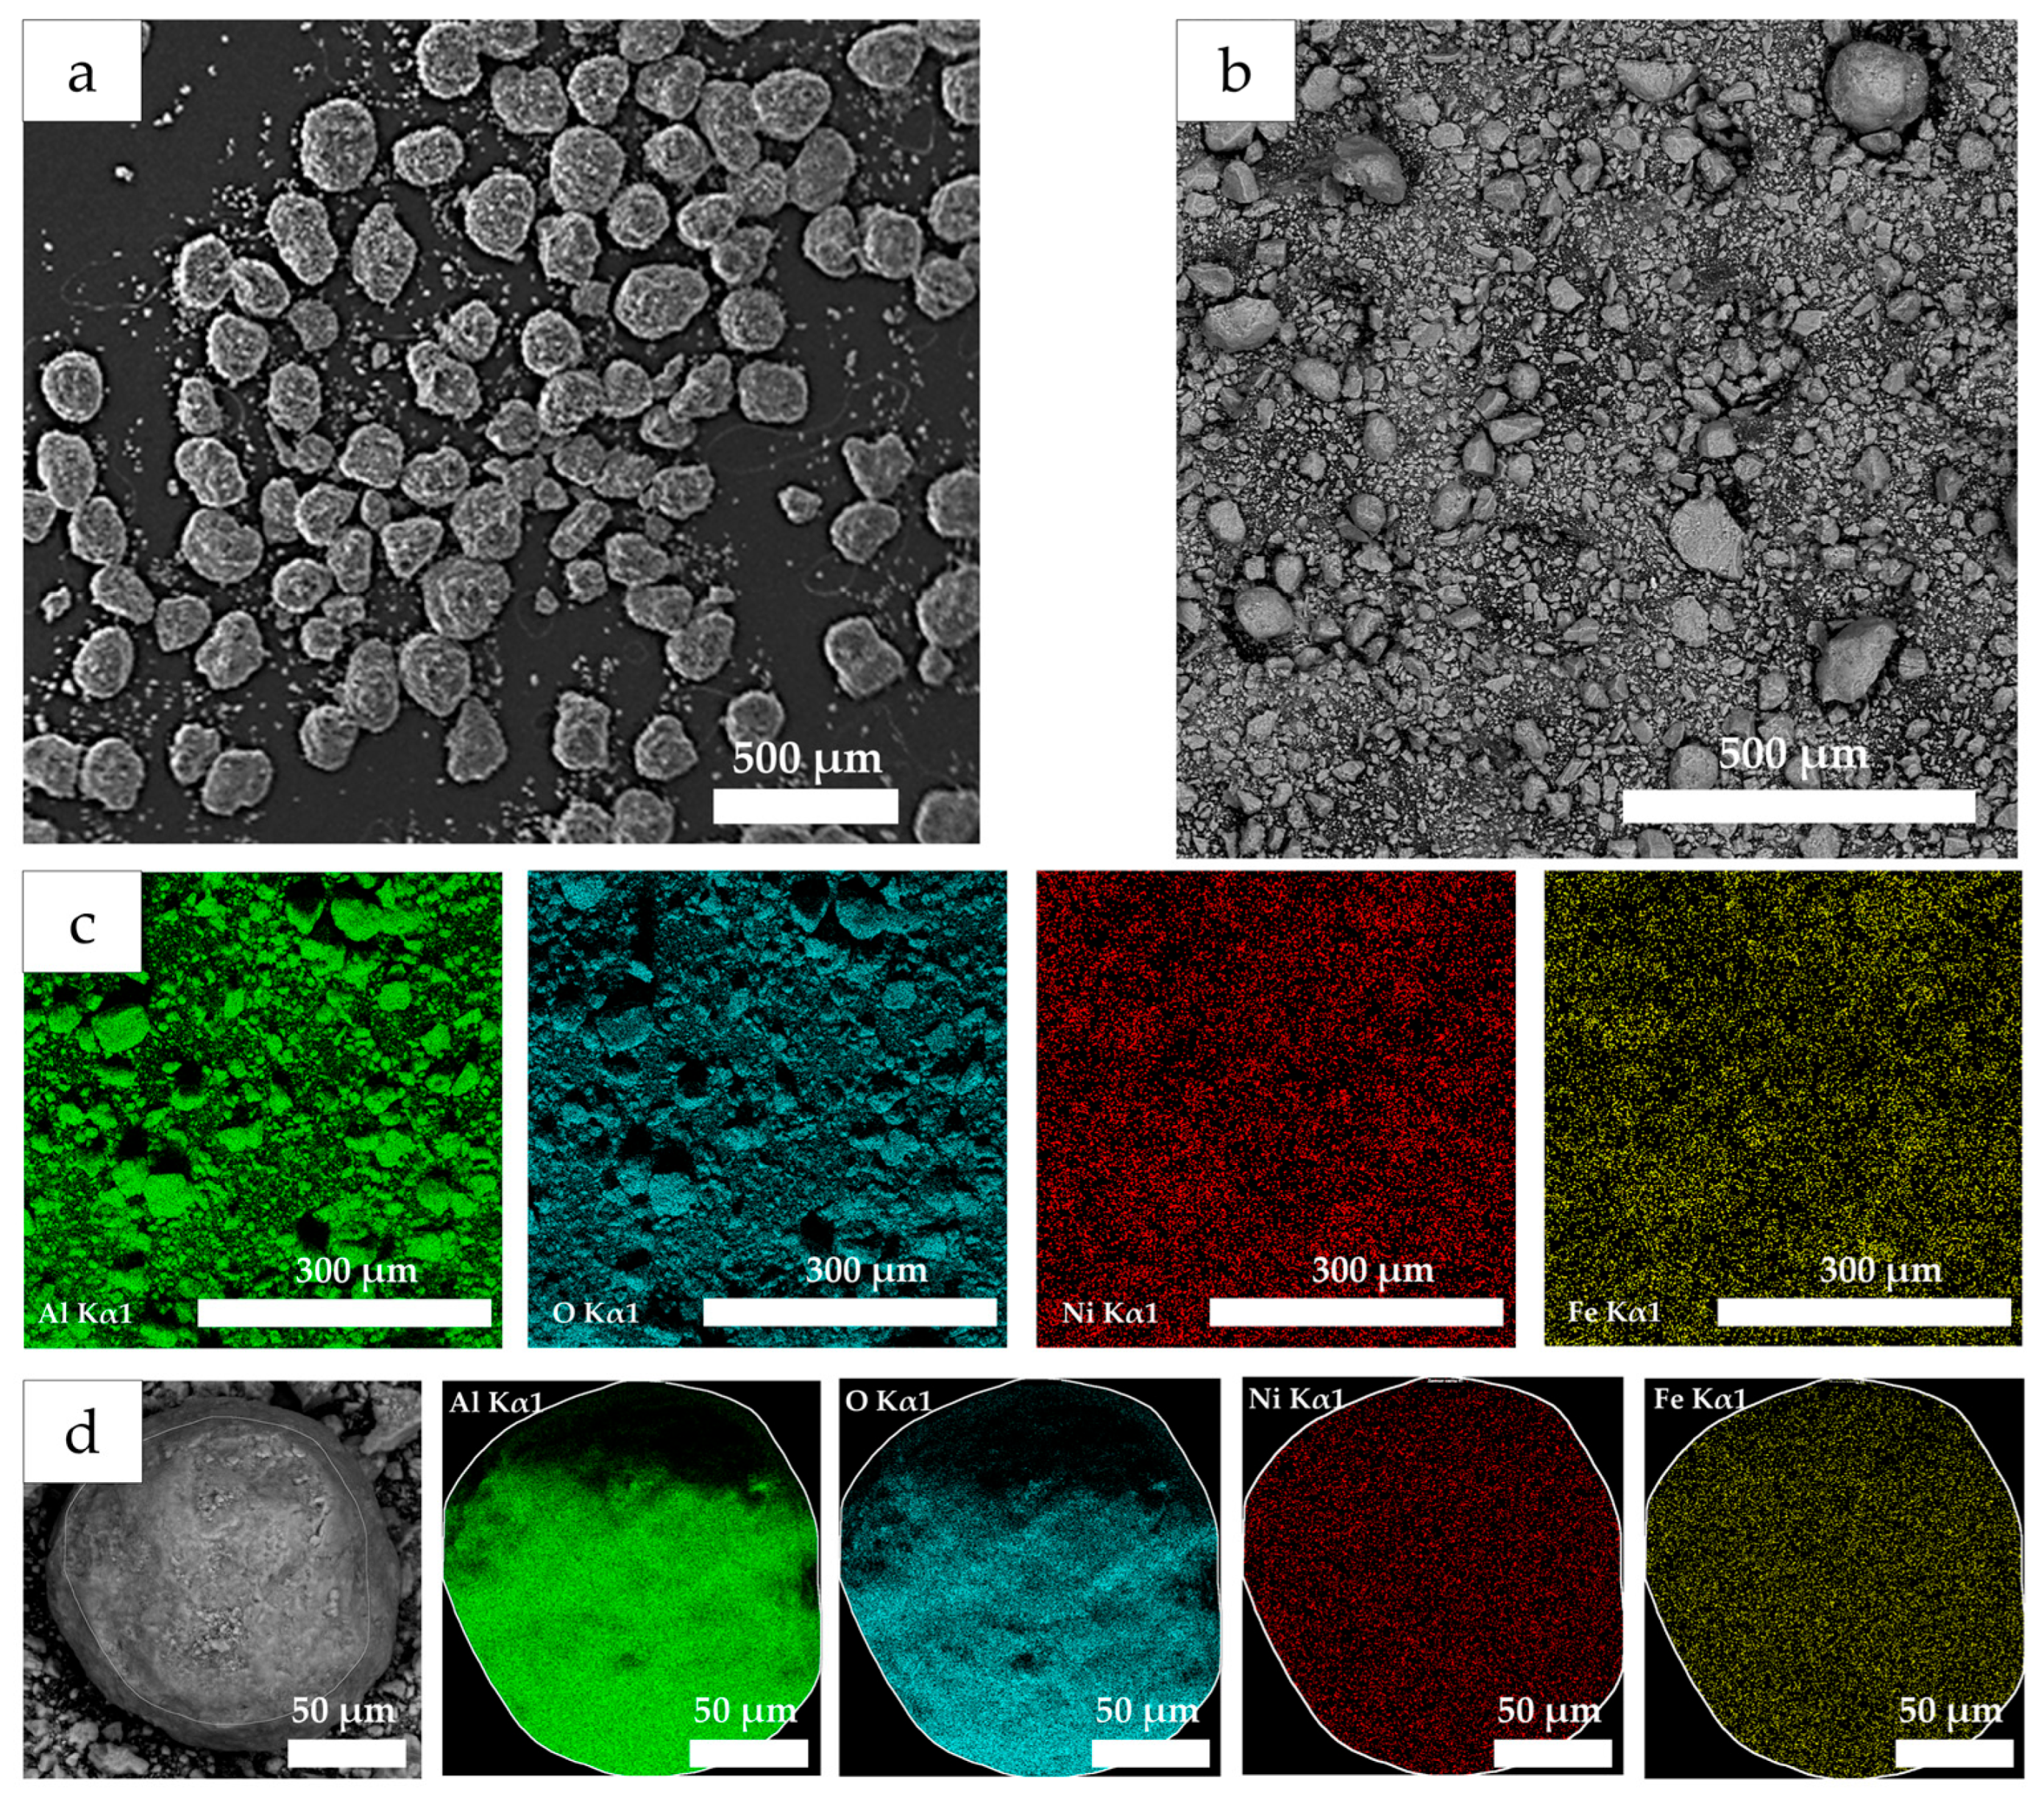
Scanning electron microscopy (SEM) was used as a second approach to evaluate the morphology of the support. SEM micrographs of γ-Al2O3 prior to any treatment (Figure 2a) and the 1Ni-1Fe/Al2O3 sample (Figure 2b) reveal significant structural alteration of the support material. The original spherical support fraction (125–250 µm) fragmented into irregularly shaped debris, with occasional residual granules up to 100 µm in size remaining. This structural degradation occurred during the prolonged catalyst synthesis process, particularly during mixing in glacial acetic acid and subsequent high-temperature treatment. SEM-EDS elemental mapping revealed a homogeneous distribution of Ni and Fe across the support surface for both the powder sample (Figure 2c) and the individual granules (Figure 2d). No visible agglomerates were detected. The results for 1Ni-1Fe/Al2O3 (Figure 2b–d) were representative, showing consistent patterns with those of the other investigated samples (Figures S3–S5). These findings suggest that, although the described synthesis method reliably produces catalysts with a uniform metal distribution across the support granules, regardless of the initial metal ratio in the impregnation solution, it simultaneously causes substantial support degradation. Consequently, this approach may be unsuitable for applications where maintaining support integrity is crucial.
The properties of supported nanoparticles are determined by several critical parameters, including their size, shape, distribution pattern on the support surface and phase composition. These factors directly influence the activity of the particles in target catalytic reactions and therefore attract considerable attention. Forming bimetallic structures (solid solutions, intermetallics, alloys, etc.) is a key goal in synthesizing bimetallic catalysts [33,34]. Bimetallic catalysts exhibit unique characteristics due to the synergistic effects of electronic interactions between adjacent particles of different metals [35]. This effect is significantly enhanced when the metals form a single bimetallic nanoparticle [36].
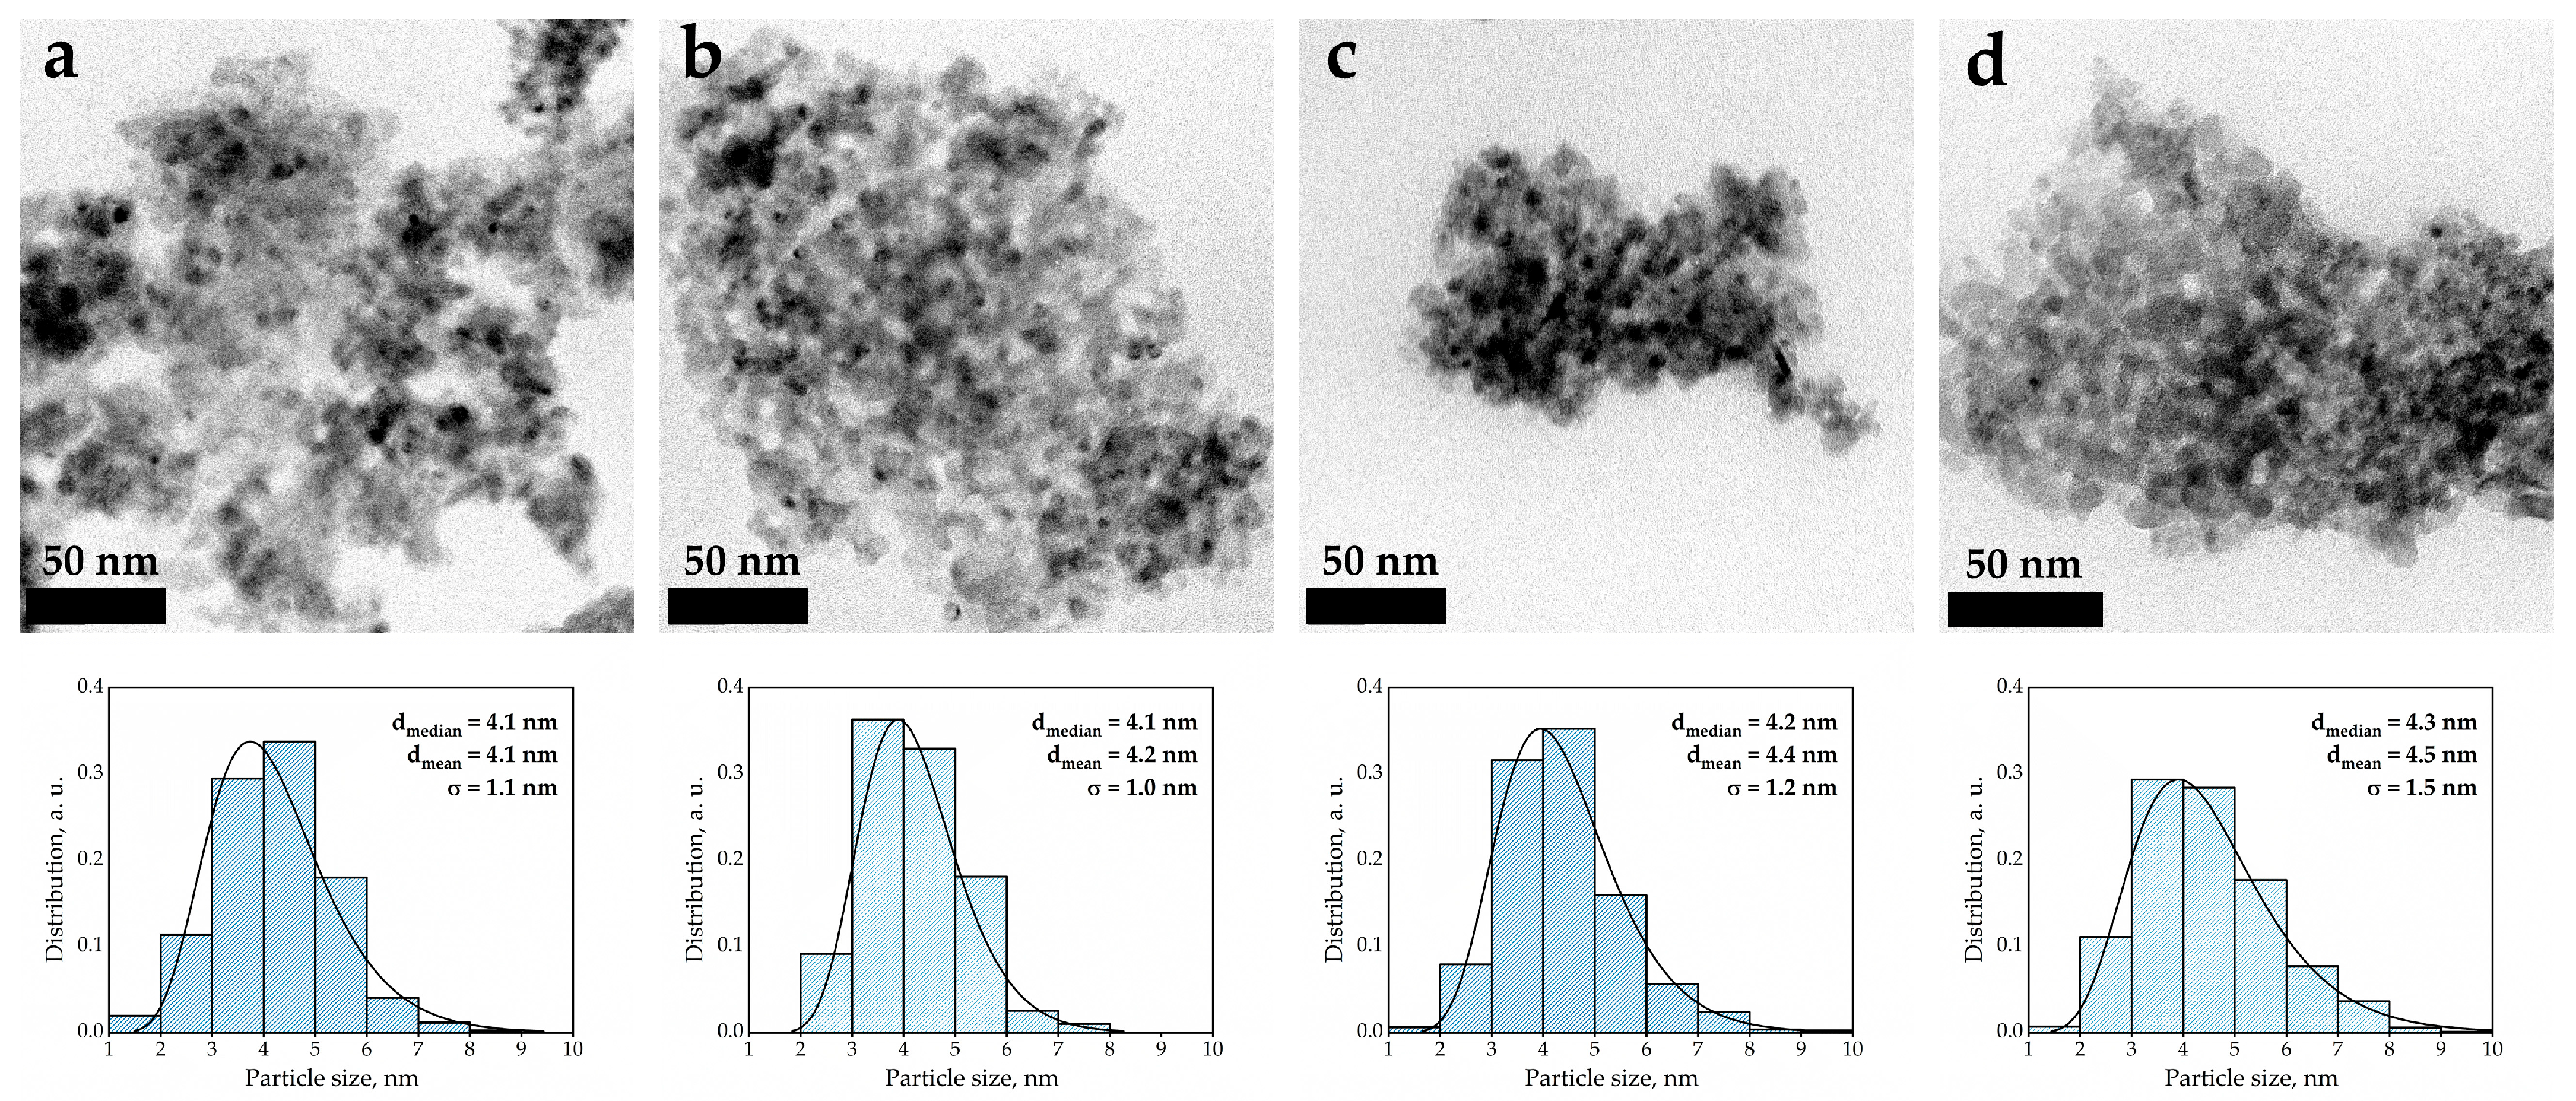
To characterize the morphology and size distribution of the supported γ-Al2O3 nanoparticles, TEM micrographs were obtained for all the samples investigated (Figure 3a–d). The images reveal a high degree of dispersion of metallic nanoparticles across all catalysts. While some localized clustering of nanoparticles was observed, likely due to adsorption on support defects, no large coherent crystallites were detected.
To analyze particle sizes and their distribution characteristics, PSD histograms were constructed for each sample (see Figure 3a–d). The distribution patterns of the histograms correspond to a log-normal distribution law. There is a clear increase in the average size of the nanoparticles with increasing Fe content in the samples, from 4.1 nm in the 20Ni-1Fe/Al2O3 sample to 4.5 nm in the 1Ni-1Fe/Al2O3 sample. The median size also increases, from 4.1 nm to 4.3 nm. However, the observed changes in average nanoparticle sizes are minimal (<0.5 nm), making the distribution profile analysis more reliable. With increasing Fe content, the particle size distribution curve becomes broader (flattened), developing a distinct tail toward larger particle sizes. This suggests that varying Ni additives promote the formation of smaller nanoparticles compared to Fe in the case of supported Ni-Fe catalysts. At the same time, the majority of nanoparticles in all samples are concentrated within the 1–8 nm range. Although no large agglomerates exceeding 10 nm were detected in TEM images, their presence cannot be entirely excluded, as they may form due to particle coalescence during high-temperature treatment [37].
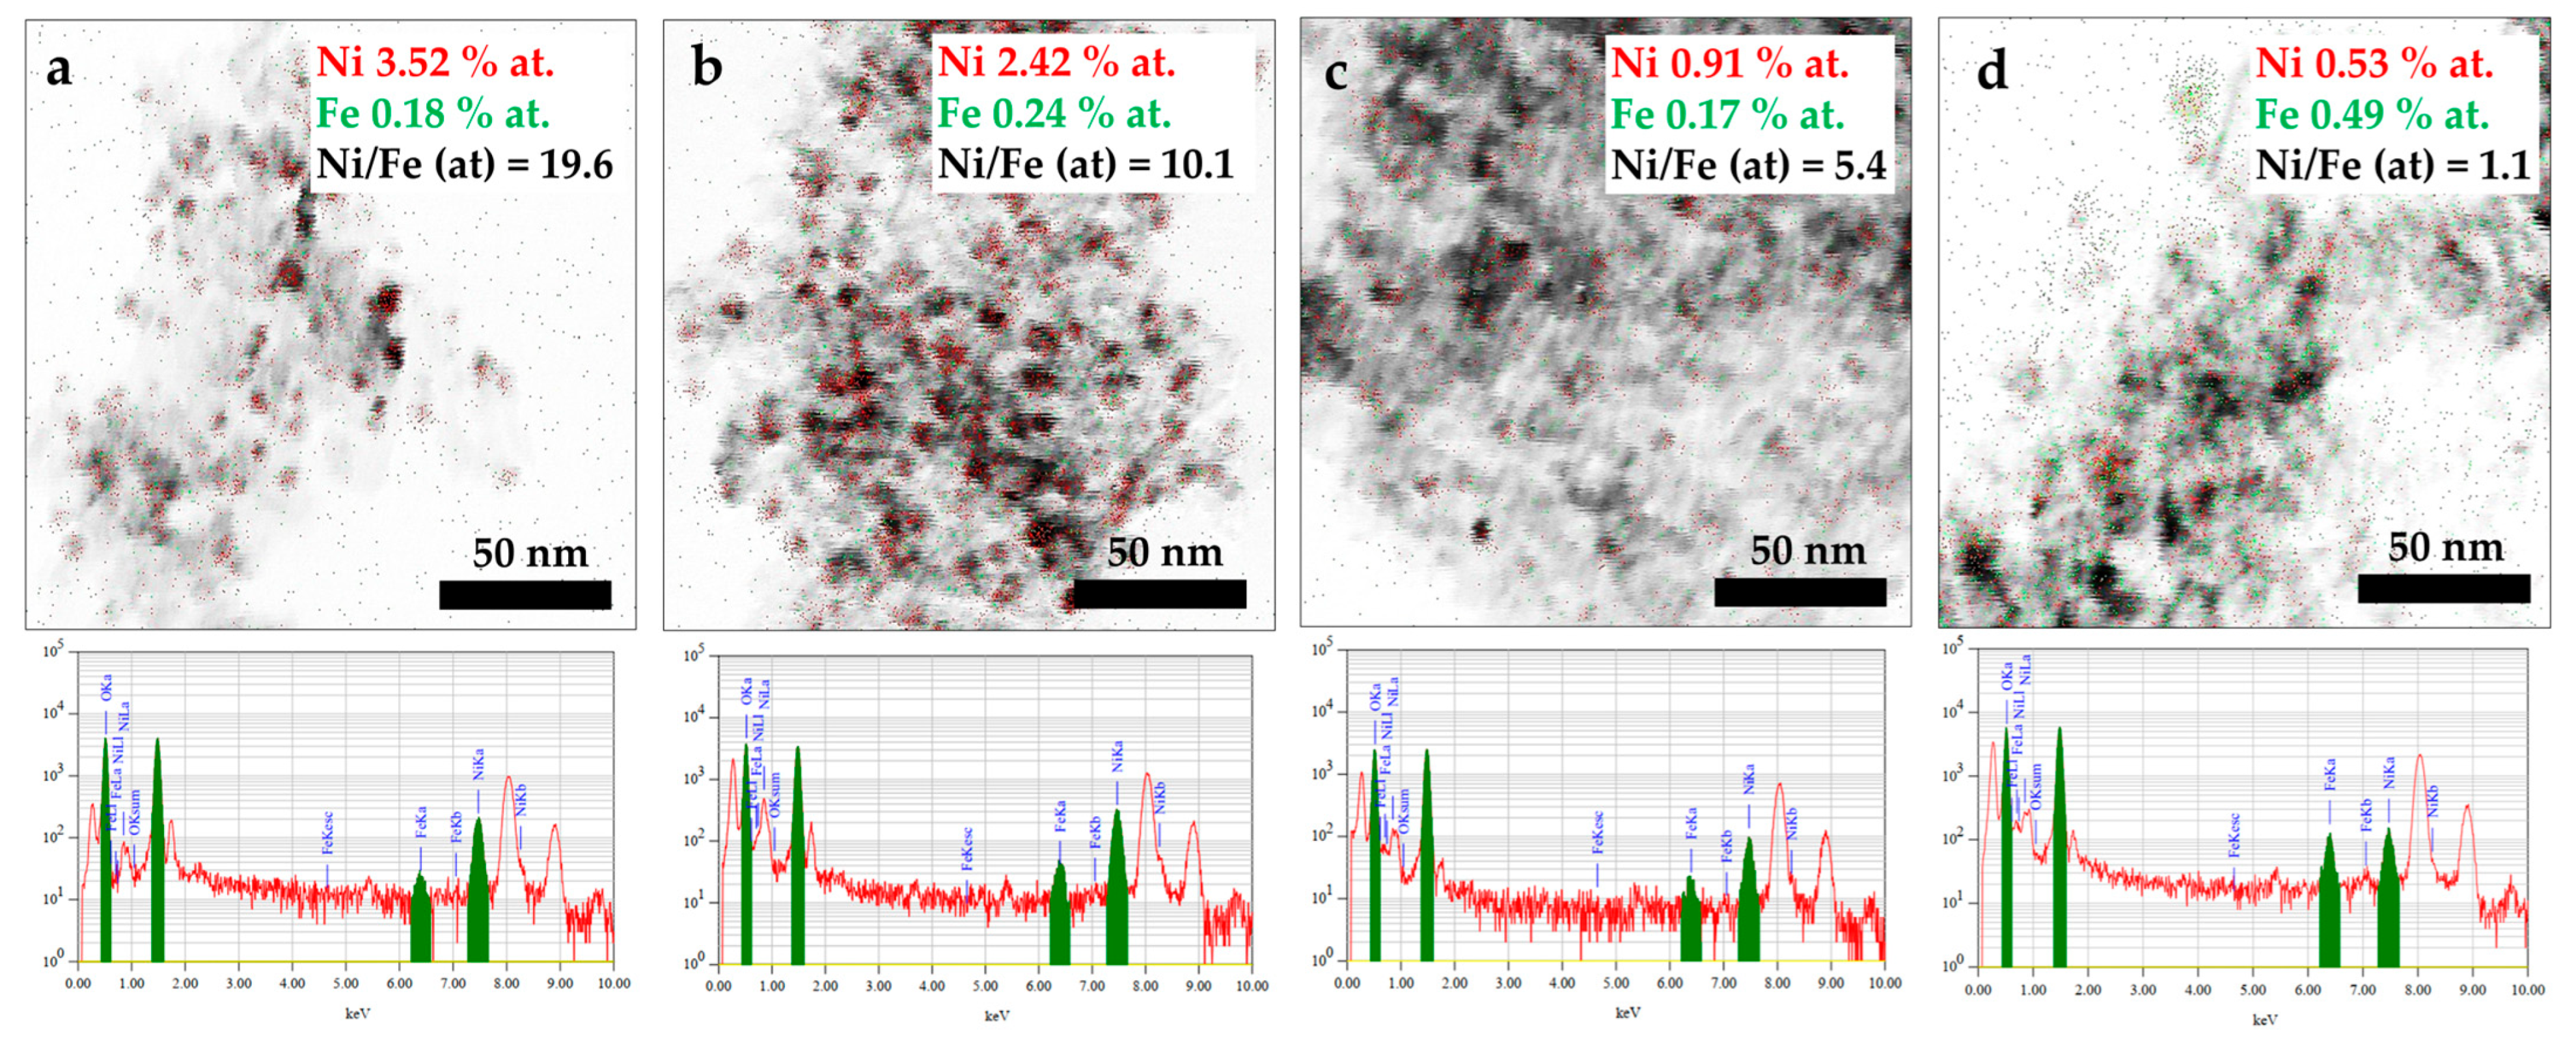
To evaluate the distribution of nickel (Ni) and iron (Fe) within the nanoparticles, TEM-EDS maps were acquired and overlaid on bright-field transmission electron microscopy (TEM-BF) images (Figure 4). It should be noted that obtaining detectable signals from the metals required prolonged acquisition times, during which image drift occurred, resulting in some blurring. Therefore, the TEM-EDS data only permits the approximate localization of elements based on regions showing the definitive presence of metallic nanoparticles. In samples with low Fe content, the selected areas exhibited weak Fe signals. For the 20Ni-1Fe/Al2O3 sample (Figure 4a), most of the observed nanoparticles were primarily composed of Ni. However, even with minor additions of Fe, trace amounts of Fe were detectable within these nanoparticles. As the Fe content increased, so did the signal intensity, ultimately revealing uniform Fe distribution across the surface and its presence in all Ni-containing nanoparticles. The 1Ni-1Fe/Al2O3 sample (Figure 4d) showed near-homogeneous co-distribution of Fe and Ni in regions containing nanoparticles. These findings provide preliminary evidence that the nanoparticles adopt bimetallic compositions (potentially as intermetallics or solid solutions) across all studied Fe concentrations. Furthermore, the measured metal contents and Ni/Fe atomic ratios from selected areas were in good agreement with the designed synthesis parameters and the experimentally determined bulk compositions (see Table 1).
X-ray phase analysis of the γ-Al2O3 support (ICDD PDF #00-010-0425) revealed a homogeneous phase composition, exhibiting characteristic reflections at 2θ angles of approximately 37°, 39°, 46° and 67°. These correspond to the (311), (222), (400) and (440) crystalline planes [38,39]. Of all the catalyst samples investigated, only the Ni/Al2O3 diffractogram (Figure 5) showed distinct, intense reflections at 2θ ≈ 44.5°, 51°, and 76.4°. These are attributed to the (111), (200), and (220) planes of face-centred cubic (fcc) metallic Ni (ICDD PDF #00-004-0850) [40,41]. An additional, weaker reflection at 2θ ≈ 63° may correspond to the (220) plane of NiO (ICDD PDF #00-047-1049) with an FCC structure [42,43]. While the formation of metal oxides cannot be ruled out, their content is likely to be low and may result from prolonged exposure to air during storage. The monometallic Fe/Al2O3 sample showed no reflections corresponding to Fe or its oxides [44], a trend that was observed in all bimetallic Ni–Fe catalysts. The absence of Fe-related reflections in the XRD patterns may indicate high dispersion, whereby the Fe atoms are uniformly distributed across the alumina surface in the form of extremely small particles that fail to form crystalline domains large enough to be detected by X-ray diffraction [45]. Similarly, the bimetallic samples lacked the intense reflections that are characteristic of nickel, its oxides, or any mixed Ni-Fe phases [44]. The XRD results demonstrate that nickel tends to form nanoparticles with higher crystallinity compared to both Ni-Fe bimetallic and Fe-only catalyst samples.
The absence of detectable nanoparticle reflections in γ-Al2O3-supported catalysts can be attributed to several factors. Firstly, the highly amorphous nature of γ-Al2O3 generates broad diffuse maxima in diffraction patterns, which mask weak nanoparticle reflections [46]. Secondly, the small size of the nanoparticles in the samples studied approaches the detection limit of the method (~3–4 nm), resulting in peaks that are severely broadened and indistinguishable from the background of the support (the nanoscale size broadening effect according to Scherrer’s law) [47]. Thirdly, the low mass concentration of the particles means their low-intensity peaks are overshadowed by the dominant support signal. For these reasons, analysis of selected-area electron diffraction (SAED) patterns (Figure 6) is a more reliable method of determining the qualitative phase composition of surface components.
The SAED pattern of the 20Ni-1Fe/Al2O3 sample (Figure 6a) shows several rings of different intensities. The innermost ring appears broadened due to dominant scattering from amorphous γ-Al2O3 (ICDD PDF #00-010-0425). The pattern suggests the presence of metallic Ni (ICDD PDF #00-004-0850) and localized Fe clusters (ICDD PDF #00-006-0696) within the analyzed area despite the sample’s low Fe content. Considering the Fe/Ni ratio and reductive, high-temperature H2 treatment, we hypothesize that Fe diffused into the Ni lattice, forming a solid solution with minor lattice distortion. However, such subtle changes at these concentrations fall within the SAED measurement error margin. To exclude the possible formation of spinel-type complex oxides (e.g., NiAl2O4 [ICDD PDF #00-010-0339] and FeAl2O4 [ICDD PDF #00-034-0192]) at the metal-support interface during high-temperature oxygen treatment, we initially confirmed the absence of their characteristic reflections. Similarly, no conclusive evidence was found for significant concentrations of NiO (ICDD PDF #00-047-1049) or Fe3O4 (ICDD PDF #00-019-0629). We performed a comparative analysis with the FeNi intermetallic standard (ICDD PDF #00-047-1405), and the measured interplanar distances and phase interpretations for this and other samples are detailed in Table 2.
As the Fe content increases, a characteristic evolution of the diffraction patterns is observed. For the 10Ni-1Fe/Al2O3 sample (Figure 6b), in addition to the metallic Ni and Fe phases, the first spotty reflections were detected, indicating the formation of a NiFe phase (d = 1.28 Å). This sample also exhibited an increased d-spacing of 1.80 Å, which corresponds to the primary Ni (200) reflection. This suggests lattice distortion resulting from the dissolution of minor Fe additions in Ni, forming a FeNi solid solution. This reflection most likely corresponds to the FeNi intermetallic phase. We favour this interpretation because we also identified a confirming FeNi (220) reflection at d = 1.28 Å, which was not previously observed in the 20Ni-1Fe/Al2O3 sample. For the 5Ni-1Fe/Al2O3 sample (Figure 6c), we can confirm with high confidence the formation of a NiFe intermetallic phase. Due to its increased interplanar spacing, we assert that the d = 2.07 Å reflection can no longer be interpreted as metallic Ni (200) (d(200) = 2.03 Å) but rather indicates an FeNi intermetallic (200) phase (d(200) = 2.07 Å). As with the previous sample, we observe low-intensity metallic Fe reflections, suggesting residual unreacted Fe. While we cannot rule out the presence of excess metallic Ni in this sample, microdiffraction cannot confirm it. For the 1Ni-1Fe/Al2O3 sample (Figure 6d), we definitively confirm the formation of a FeNi intermetallic phase alongside metallic Fe, based on the excellent agreement between the experimental data and the values in the crystallographic database. These results clearly demonstrate the changing phase composition of the surface metals on γ-Al2O3 and the formation of the FeNi intermetallic phase. A summary of the interpreted SAED phases is provided in Table 3.
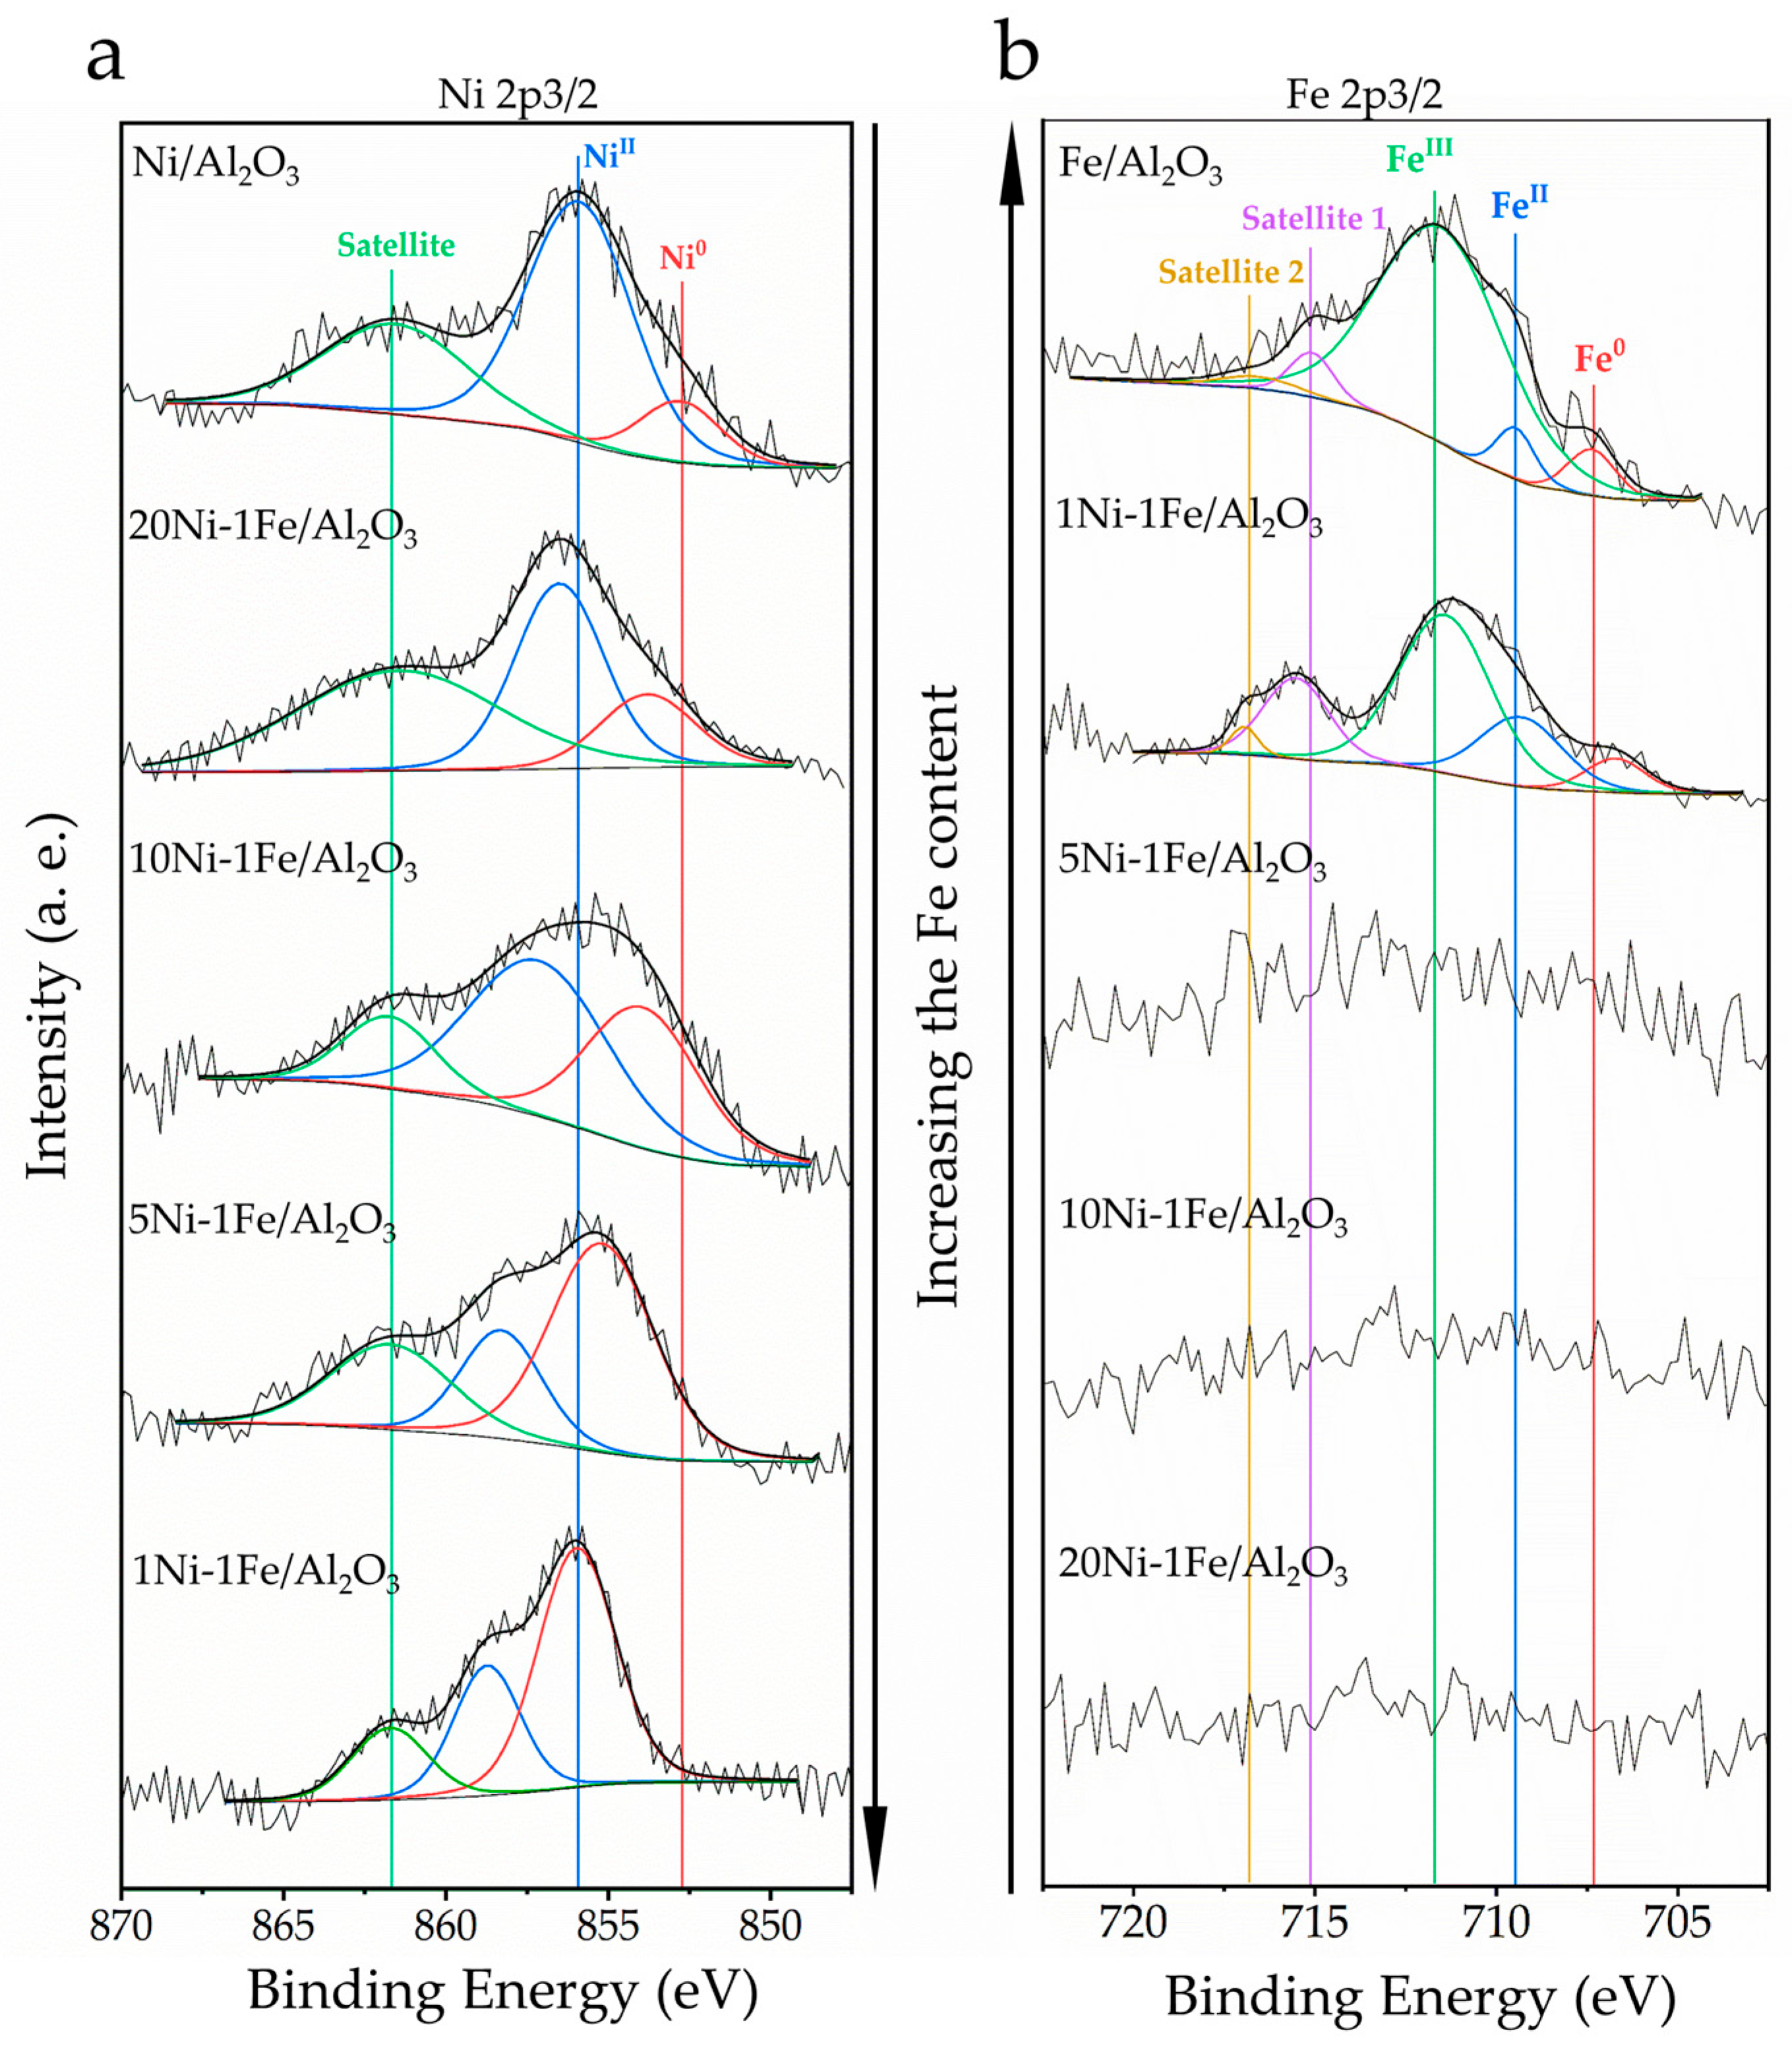
XPS was employed to probe the surface composition and valence state of the metals in the catalyst samples. Spectral deconvolution was performed to identify the respective chemical states. The Ni 2p3/2 spectra (Figure 7a) for all samples indicate the presence of both metallic (Ni0) and oxidized (NiII) species. For the monometallic Ni/Al2O3 reference, the peaks at 852.8 eV and 855.9 eV are assigned to Ni0 and NiII, respectively, while the feature at 861.5 eV is a characteristic satellite peak. Similarly, the Fe 2p3/2 spectrum (Figure 7b) of the Fe/Al2O3 reference shows peaks at 707.4 eV (Fe0), 709.5 eV (FeII), and 711.5 eV (FeIII), with satellites at 715.1 eV and 716.6 eV.
A notable finding is a significant positive binding energy (BE) shift of the Ni 2p peaks upon the introduction of Fe. This upshift indicates the formation of an electron-deficient state of Ni, suggesting a substantial electron transfer from Ni to Fe atoms. The BE shift for the Ni0 peak reaches a maximum of +2.9 eV in the 1Ni-1Fe/Al2O3 sample compared to the monometallic Ni catalyst (Table 4). This electron-deficient state of Ni can significantly modify the catalyst’s properties, potentially enhancing its activity in reactions where Ni’s ability to accept electron density from adsorbates (e.g., in hydrogenation or dehydrogenation) is crucial. Paradoxically, despite this electron deficiency, the relative concentration of metallic Ni0 increases dramatically with higher Fe loadings, reaching 68.2% and 71.1% in the Fe-richest samples. This apparent contradiction can be explained by the formation of stable Ni-Fe intermetallic or alloy phases. In such structures, the thermodynamic stability of the metallic state is enhanced. The Ni atoms, while electron-deficient due to the charge transfer, are stabilized within the crystal lattice of the alloy, preventing their re-oxidation and leading to a higher observed proportion of Ni0.
The Fe 2p3/2 spectra for most bimetallic samples were characterized by low intensity and a poor signal-to-noise ratio, complicating their interpretation. This effect is primarily attributed to the framework effect or encapsulation. We propose that in the bimetallic nanoparticles, Fe is predominantly incorporated into the bulk or core of the particles, while the surface is enriched with Ni. Additionally, the possible formation of highly dispersed Fe species or its partial incorporation into the γ-Al2O3 support structure could further dilute the surface Fe signal detected by XPS, a surface-sensitive technique.
Nevertheless, for the 1Ni-1Fe/Al2O3 sample, where the Fe signal was sufficiently intense, a negative BE shift of −0.7 eV for the Fe0 state was observed compared to the monometallic Fe reference. This downshift confirms the electron transfer inferred from the Ni spectra. It indicates an increased electron density on Fe atoms, consistent with their role as electron acceptors in the Ni-Fe system. This electron-enriched state of Fe can influence its catalytic behavior, for instance, by weakening the chemisorption of electron-donating molecules.
Experimental studies of the deposition and anodic oxidation processes of Fe-Ni bimetallic alloys in various electrolytes have demonstrated that nanostructured Fe-Ni particles with variable compositions form on Al2O3 substrates under conditions of uniform anodic dissolution. This emphasizes the importance of identifying stable Ni-Fe compound structures with different elemental ratios. While the elemental composition of these nanostructured phases on the substrate can be determined by comparing metal deposition rates, predicting complete structural information remains challenging due to the particles’ nanoscale dimensions. A critical task is to establish a crystallographic database (CDB) of stable Ni-Fe binary phases and use it to identify particles on substrates by comparing their elemental composition with CDB reference data. Successful structural identification of nanoparticles would enable the subsequent investigation of the thermodynamic properties of Ni-Fe compounds. Databases of inorganic materials such as OQMD and Materials Project [48,49] provide extensive structural and thermodynamic data for Ni-Fe alloys derived from ab initio calculations.
Experimental studies of the low-temperature phase diagram of Ni-Fe alloys [50] have revealed that an FeNi3 intermetallic compound forms with a wide homogeneity range (~20 at.% at 300 °C) at ~74 at.% Ni and ~503 °C. A eutectoid reaction γ ↔ α + FeNi3 occurs at 345 °C. Notably, no other intermetallic compounds, including FeNi, were observed experimentally. However, several ordered phases, including FeNi (P4/mmm), Fe0.9Ni0.1 (P63/mmc), Fe0.7Ni0.3 (Im3m) and FeNi3 (Fm3m, Pm3m), are listed in crystallographic databases (COD [48,49,51]), indicating that the list of stable Fe–Ni alloys discussed in [50] may be incomplete.
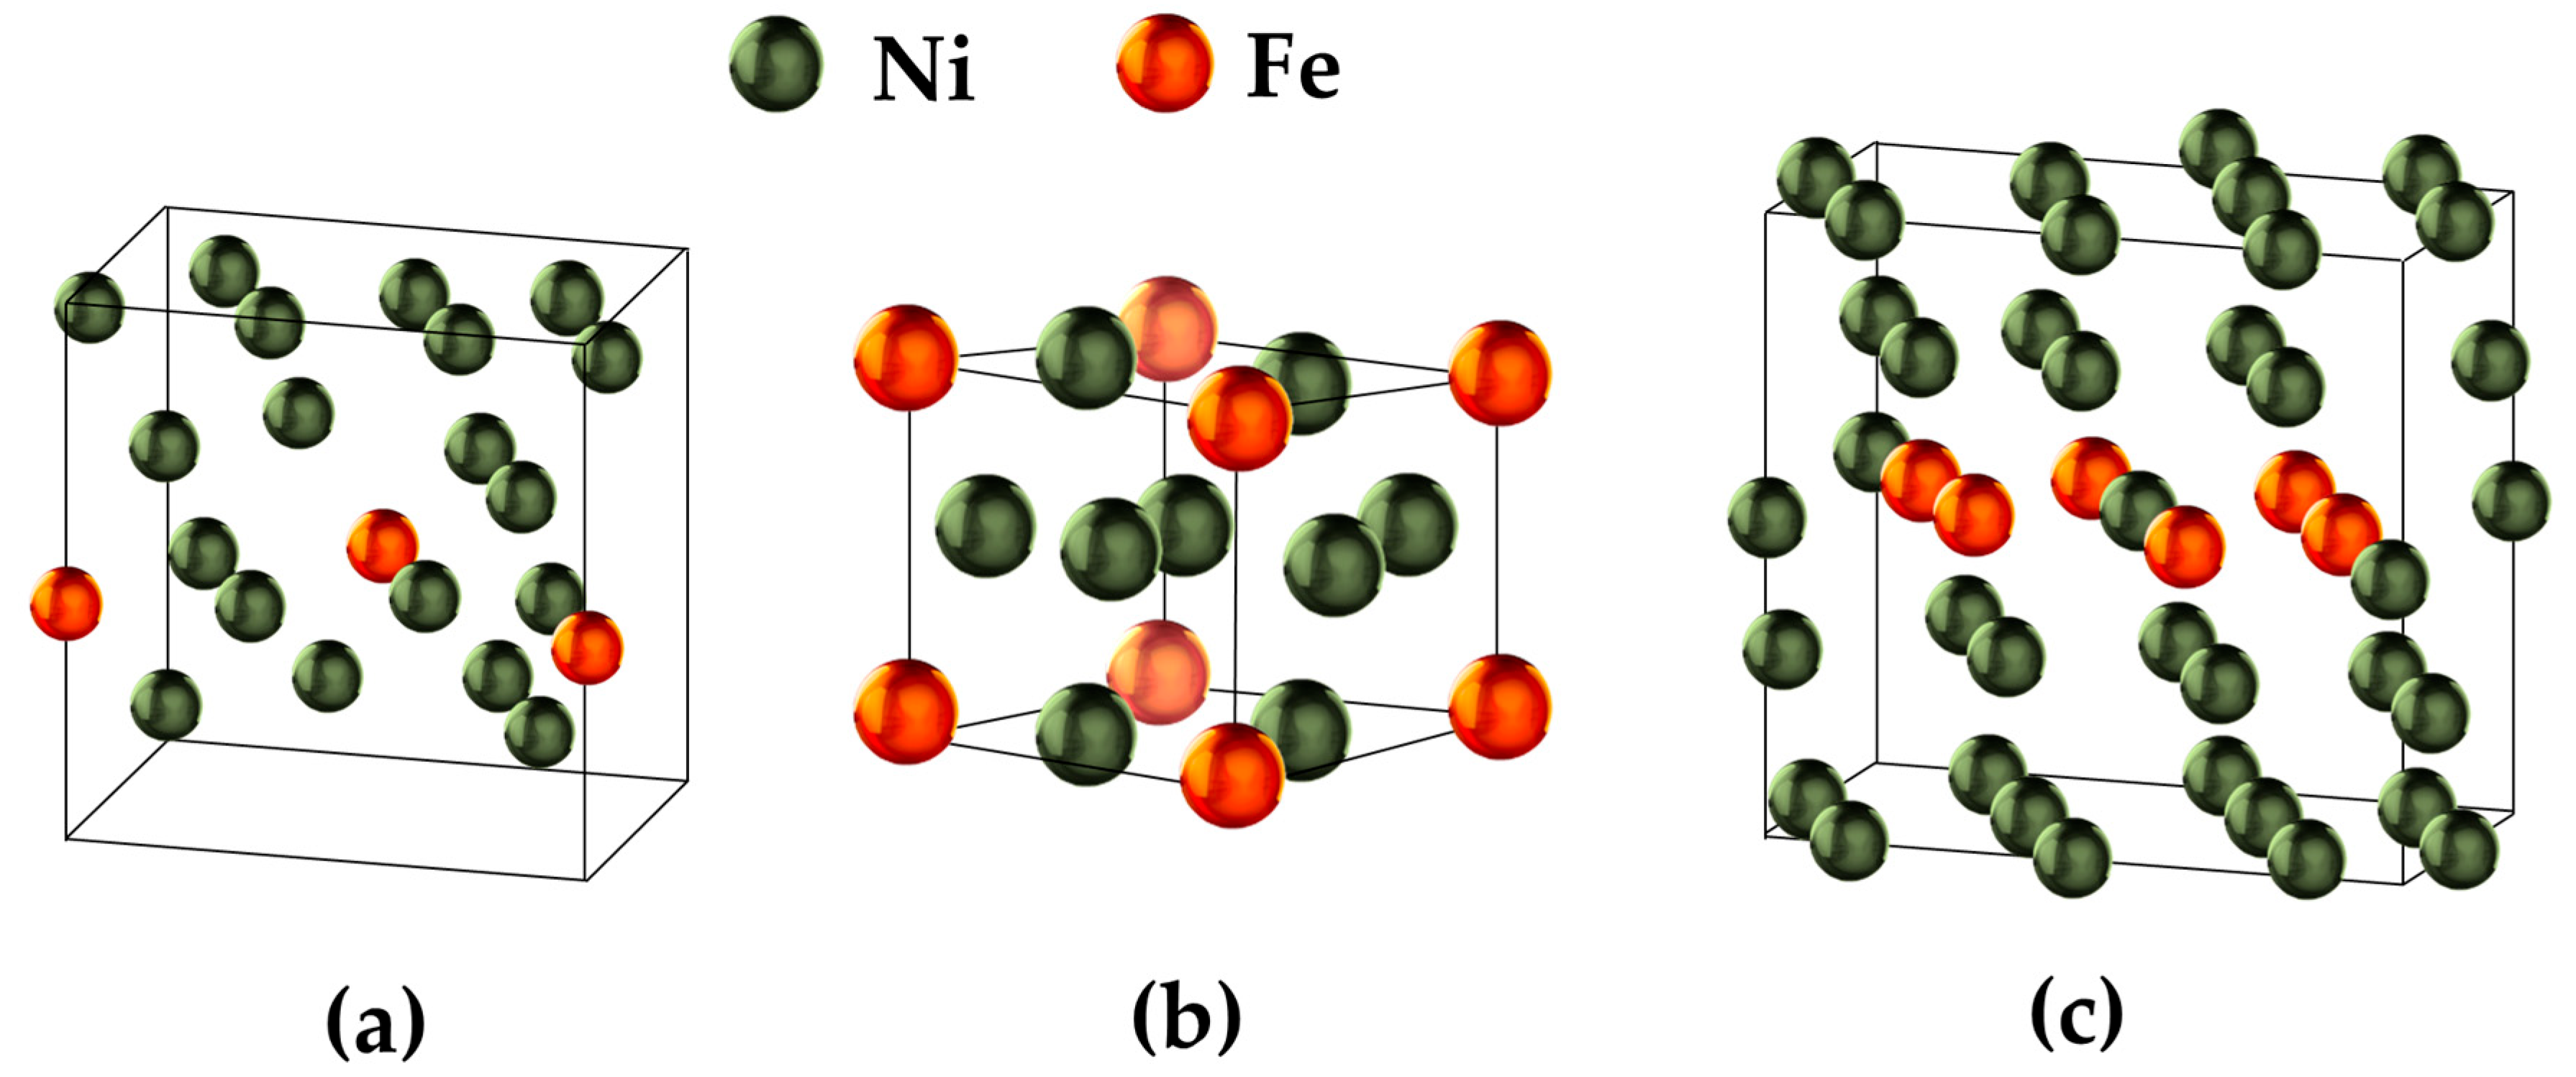
The USPEX code was used to predict the lattice structures of two compositional ranges: (1) Fe-Ni systems containing up to 10 atoms and (2) Fe-Ni systems containing 10–20 atoms. The most stable configurations in the 10–20 atom range (denoted S-1 to S-4) are shown in Figure 8 and Table 5, while the configurations for ≤10 atoms (S-5 to S-7) are shown in Figure 9 and Table 6. The results indicate that the reference phases in Table 5 and Table 6 are generally quasi-stable, except for structures S-6 and S-7 in [48,49,51]. These exceptions have lattice enthalpies below the zero-reference line, which is defined by the pure Fe/Ni elements. This makes their decomposition into pure components energetically unfavourable. Table 7 compiles literature values [52,53] for the formation enthalpies of the stable phases at various temperatures.
The results demonstrate that the stable Ni-Fe phases, Fe11Ni5, FeNi, FeNi3 and Fe8Ni, are predicted to dominate the structural evolution of nanoparticles during the electrochemical deposition and anodic oxidation of Fe-Ni alloys in various electrolytes.
The comparison of the structures predicted by the USPEX evolutionary algorithm with the experimental SAED data establishes a direct correlation between the observed interplanar spacings and the stable Ni–Fe phases at different compositions. Specifically, for the 1Ni-1Fe/Al2O3 sample, the SAED pattern clearly reveals rings with d-spacings of 2.07 Å and 1.03 Å. As listed in Table 2, these correspond to the (111) and (222) reflection planes of the FeNi intermetallic phase (ICDD PDF #00-047-1405). Among the structures predicted by USPEX, the one with the highest thermodynamic stability at a Ni:Fe ratio of ≈ 1:1 is the tetragonal phase S-3 (Ni5Fe11, space group P4/mmm). The calculated interplanar spacings for this structure, derived from the optimized unit cell with parameters a = b = 6.938 Å, c = 3.455 Å, are 2.08 Å for the (111) plane and 1.04 Å for the (222) plane. These values are in excellent agreement with the experimental data (Δd < 1%). This agreement confirms that the phase observed by SAED is an ordered FeNi intermetallic compound with a tetragonally distorted FCC structure, rather than a simple solid solution.
For the 5Ni-1Fe/Al2O3 sample (Ni:Fe ≈ 5:1), the SAED pattern shows a dominant ring with a d-spacing of 2.07 Å, which cannot be attributed to pure Ni (d111 = 2.03 Å). For the USPEX-predicted structure model S-6 with a Ni5Fe composition (hexagonal, P-62m), the calculated d111 spacing is 2.06 Å, which is in good agreement with the experimental value. This indicates the formation of a nickel-rich FeNi phase with significant lattice distortion due to the incorporation of Fe atoms.
For the nickel-rich compositions (10Ni-1Fe and 20Ni-1Fe), the SAED data indicates the coexistence of metallic Ni and α-Fe nanoclusters. This finding is consistent with the USPEX results, which do not predict any thermodynamically stable ordered phases in this composition range at 0 K; the formation energy of the predicted structures lies above the mixing line of the pure elements. Therefore, the absence of distinct intermetallic rings in the SAED patterns at low Fe content is consistent with the system’s thermodynamic tendency toward phase separation or the formation of a disordered solid solution, which would not produce distinct diffraction features.
It is important to note that X-ray diffraction (XRD) failed to detect reflections from the nanoparticles due to their small size (<5 nm), significant Scherrer broadening, and the masking effect of the amorphous background from the γ-Al2O3 support. In this context, SAED, with its local sensitivity and high d-spacing resolution, proved to be the pivotal technique for verifying the USPEX predictions. Consequently, the combination of evolutionary structure prediction and local electron diffraction enabled the determination of the composition and ordered nature of the Ni–Fe nanoparticle phases, even in the absence of discernible XRD signals.

3. Materials and Methods

γ-Al2O3 (SKTB Katalizator, Novosibirsk, Russia) with a grain fraction of 125–250 µm was used as the catalyst support. Prior to the deposition of the active component, the support underwent dehydrating pretreatment in a vacuum oven at 120 °C for 24 h to remove adsorbed moisture and organic impurities, thereby ensuring a standardized and receptive support surface for uniform precursor deposition. This improved the deposition of the metal precursors and enhanced the uniformity of the particle distribution on the support surface. The catalysts were prepared by co-impregnating γ-Al2O3 with glacial acetic acid (CH3COOH; Ecos-1, Moscow, Russia; 99.5% purity) solutions of the Ni and Fe precursors: nickel(II) acetylacetonate (Ni(C5H7O2)2; Sigma-Aldrich, St. Louis, MO, USA; 99% purity) and iron(III) acetylacetonate (Fe(C5H7O2)3; Sigma-Aldrich, St. Louis, MO, USA; 99% purity). The precursors were taken in amounts corresponding to the target atomic ratios of metals in the samples (Ni/Fe (at.%) = 1:1, 5:1, 10:1, and 20:1). The total calculated loading of metals was chosen at a level of ~5 wt.%. This value is typical for fundamental research and enables, on the one hand, to reliably characterize the supported particles and, on the other hand, to minimize the effect on the textural properties of the support. This makes it possible to focus on studying the effect of the Ni/Fe ratio on the phase composition and structure of nanoparticles. Impregnation was conducted for 18 h at a stirring rate of 250 rpm and room temperature. After impregnation, the solvent was removed using a rotary evaporator. This was followed by complete drying in a vacuum oven at 80 °C. The samples subsequently underwent sequential thermal treatments in different gas atmospheres to form active phases and improve structural characteristics [54]. The first stage involved holding at 525 °C for two hours in an argon atmosphere with a heating rate of 0.7 °C/min to remove organic compounds and stabilize metal complexes. The second stage comprised treatment at 375 °C in a pure O2 atmosphere for two hours with a heating rate of 1.0 °C/min to oxidize the residual organic matter and form oxidized metal phases. The final stage involved reduction at 525 °C in a H2 atmosphere for two hours with a heating rate of 1.0 °C/min to convert the components into a metallic state. The prepared bimetallic catalysts samples were named according to the target atomic ratios of metals: 1Ni-1Fe/Al2O3, 5Ni-1Fe/Al2O3, 10Ni-1Fe/Al2O3 and 20Ni-1Fe/Al2O3 (Ni/Fe (at.%) = 1:1, 5:1, 10:1, and 20:1, respectively). The two monometallic reference samples, Fe/Al2O3 and Ni/Al2O3, were prepared using an identical method with a total metal loading of 5 wt.%.
The qualitative and quantitative composition of the samples was analyzed using X-ray fluorescence (XRF) spectroscopy and a Lab Center XRF-1800 wavelength-dispersive sequential spectrometer (Shimadzu, Kyoto, Japan). This instrument is equipped with a 4 kW Rh-anode X-ray tube that can rotate at speeds of up to 60 rpm.
X-ray diffraction (XRD) analysis was performed using a Miniflex 600 benchtop diffractometer (Rigaku, Tokyo, Japan), which was equipped with a 600 W copper anode X-ray tube and a vertical goniometer with coupled θ-2θ scanning geometry. The detection system incorporated both scintillation and semiconductor detectors. Measurements were taken at an accelerating voltage of 40 kV and a current of 15 mA, at a scanning rate of 2.0°/min. The resulting diffraction patterns were analyzed using the PDF-4+ database from the International Centre for Diffraction Data (ICDD).
The surface morphology of the samples was examined using a Tescan MIRA 3 LMU scanning electron microscope (SEM) (Tescan, Brno, Czech Republic), equipped with an Ultim Max 40 energy-dispersive X-ray spectroscopy (EDS) system (Oxford Instruments, Abingdon, UK). Measurements were performed at an accelerating voltage of 20 kV. Since the alumina samples are non-conductive, a thin layer of gold was sputtered onto the samples prior to SEM analysis in order to prevent surface charge accumulation and obtain high-quality images.
The morphology and particle size distribution of the synthesized samples, as well as their spatial distribution on the support surface, were characterized using transmission electron microscopy (TEM) coupled with energy-dispersive X-ray spectroscopy (TEM-EDS). Particle imaging, elemental mapping and selected-area electron diffraction (SAED) patterns were acquired using a JEM-2100F transmission electron microscope (JEOL, Tokyo, Japan). This microscope is equipped with a field-emission electron gun and a high-resolution pole piece with a point resolution of 0.19 nm, as well as a JED-2300 Analysis Station spectrometer (JEOL, Tokyo, Japan). High-resolution imaging was performed at an accelerating voltage of 200 kV.
The particle size distribution (PSD) histograms were constructed using measurements of 800 nanoparticles that were randomly selected from each sample and observed. The measurement error is ±0.5 nm.
The specific surface area of the samples was measured using a TriStar 3020 automated gas adsorption analyzer (Micromeritics, Norcross, GA, USA) via nitrogen adsorption at −196 °C. The Brunauer–Emmett–Teller (BET) multipoint method was employed to determine the specific surface area (SBET) within the relative nitrogen pressure (P/P0) range of 0.05 to 0.30. The Barrett–Joyner–Halenda (BJH) method was then used to calculate the total pore volume (V) and the average pore diameter (D). Prior to measuring the surface area, the samples were degassed under vacuum at 200 °C for 2 h.
The synthesized catalysts, after the final reduction stage, were cooled to room temperature in a stream of Ar and subsequently handled in air. The authors acknowledge that exposure to ambient atmosphere inevitably leads to the formation of a thin, passive oxide layer on the surface of the Ni-Fe nanoparticles. This layer protects the metallic core of the nanoparticles from further bulk oxidation. The key conclusions about the phase composition (formation of solid solutions and intermetallic phases) are based on the results of bulk-sensitive characterization techniques such as X-ray diffraction (XRD) and selected-area electron diffraction (SAED), which primarily probe the crystalline structure of the metallic core.
To study the chemical composition and electronic state of the surface atoms of the catalyst samples, the method of X-ray photoelectron spectroscopy (XPS) was used. The measurements were carried out using a 100-micron X-ray beam on a PHI 5000 VersaProbe-II instrument (ULVAC-PHI, Chigasaki, Kanagawa, Japan) equipped with argon and electron guns, which were used to neutralize the charge arising in the analysis of non-conducting samples (double beam charge neutralization method). The accuracy of measurements of the binding energy was ±0.1 eV for all the samples. The C 1s line at 284.6 eV was used as an internal standard. The obtained XPS spectra were processed using the standard CasaXPS software (version 2.3.26). The XPS spectra were deconvoluted using a mixed Gaussian–Lorentzian (Voigt) line shape, with simultaneous Shirley background subtraction to account for inelastic scattering contributions from secondary electrons and energy-loss photoelectrons.
Bimetallic Ni-Fe structures with variable compositions (up to 21 atoms per unit cell) were predicted using the USPEX code, which was interfaced with VASP [32,55], on the ‘Blochin’ supercomputer at the International Research Institute of Intelligent Materials at Southern Federal University [56]. The USPEX calculations evaluated the lattice enthalpy of compositionally varied Ni-Fe systems using a generational scheme, in which 30% of the structures were randomly generated, 50% were created through heredity and 20% were produced via mutations. Each generation’s population consisted of 30 atoms, with a selection ratio of 0.6 for subsequent generation production. Structural optimization involved six VASP calculation cycles, while reference enthalpy calculations used the generalized gradient approximation (GGA) density functional with plane-wave pseudopotentials, as detailed in reference [55]. The static lattice energy was determined at 0 K through self-consistent calculations of electronic state orbitals, single-electron density distribution, and ground state energy. Valence electron wave functions were analyzed using a plane-wave basis set with a kinetic energy cutoff of 330 eV, achieving total energy convergence of ~0.5 × 10⁻⁶ eV/atom. Theoretical calculations pertain to ideal crystal structures at 0 K and serve as a reference database for phase identification.

4. Conclusions

Bimetallic Ni-Fe/γ-Al2O3 catalysts with varying Ni/Fe ratios (20:1 to 1:1) were synthesized via co-impregnation using acetylacetonate precursors. Despite ∼5 wt.% metal loading, BET analysis revealed negligible changes in surface area/pore volume, indicating uniform dispersion of nanoparticles across all compositions. Uniformity of elemental distribution is also confirmed by SEM-EDS mapping. Both bulk (XRF) and local (TEM-EDS) methods verified achievement of target metal ratios. However, systematic (though error-marginal) decreases in surface area suggest minor pore blocking by larger particles. This is corroborated by TEM showing median size evolution from 4.1 nm (20Ni-1Fe/γ-Al2O3) to 4.5 nm (1Ni-1Fe/γ-Al2O3), with PSD histograms developing right-tail broadening. TEM-EDS elemental mapping revealed increasing Ni-Fe proximity at higher Fe loadings—a prerequisite for synergistic interactions. XRD analysis demonstrated Fe’s dramatic impact on Ni’s phase state, with detectable changes even at 20:1 Ni/Fe ratios. SAED identified a phase evolution sequence: solid-solution Ni-Fe nanoparticles (Ni/Fe < 10) transitioning to intermetallic compounds, which are particularly valuable for catalysis due to their maximum synergistic effect. Finally, evolutionary algorithm (USPEX) simulations predicted the most stable Ni-Fe structures: Fe11Ni5, FeNi, FeNi3, and Fe8Ni. The structural features identified in the Ni-Fe/γ-Al2O3 catalysts could be useful when designing materials for important industrial processes, such as the hydrogenation of organic compounds, the Fischer–Tropsch synthesis and the transformation of CO2.

Supplementary Materials

The following supporting information can be downloaded at: https://www.mdpi.com/article/10.3390/inorganics13110349/s1. Figure S1: BJH pore size distribution curves; Figure S2: N2 adsorption-desorption isotherms; Figure S3–S5: SEM-EDS elemental mappings.

Author Contributions

Conceptualization, I.A.K. and A.K.K.; methodology S.A.G. (Semyon A. Gulevich), M.P.S.-S. and E.P.M.; formal analysis, E.P.M., A.K.S. and S.S.; investigation, A.K.S., S.S., S.A.G. (Semyon A. Gulevich), M.P.S.-S., Y.A.A. and S.A.G. (Sergey A. Guda); software, Y.A.A. and S.A.G. (Sergey A. Guda); writing—original draft preparation, S.A.G. (Semyon A. Gulevich), M.P.S.-S., Y.A.A. and S.A.G. (Sergey A. Guda); writing—review and editing, E.P.M., S.A.G. (Semyon A. Gulevich), R.K. and A.K.K.; supervision, I.A.K. and R.K.; project administration, I.A.K. and A.K.K.; funding acquisition I.A.K. and A.K.K. All authors have read and agreed to the published version of the manuscript.

Funding

This research was funded by the Ministry of Science and Higher Education (MSHE) of the Russian Federation (Grant No. 075-15-2023-468) and the Government of India (Grant No. DST/INT/MSHE/P-02/2022(G)) within the framework of international cooperation between Russia and India.

Data Availability Statement

The original contributions presented in this study are included in the article/Supplementary Material. Further inquiries can be directed to the corresponding author.

Conflicts of Interest

The authors declare no conflicts of interest.

References

  1. Xu, Z.; Wang, Z.; Shen, Y.; Chen, L.; Wang, C. Achieving Sulfur Tolerance in CO2 Methanation over Ni-Based Catalysts: Protective Effects of Fe. Energy Fuels 2024, 38, 21287–21299. [Google Scholar] [CrossRef]
  2. Hantoko, D.; Khan, W.U.; Osman, A.I.; Nasr, M.; Rashwan, A.K.; Gambo, Y.; Shoaibi, A.A.; Chandrasekar, S. Carbon–neutral hydrogen production by catalytic methane decomposition: A review. Environ. Chem. Lett. 2024, 22, 1623–1663. [Google Scholar] [CrossRef]
  3. Alharthi, A.I. Nickel-iron catalyst for decomposition of methane to hydrogen and filamentous carbon: Effect of calcination and reaction temperatures. Alex. Eng. J. 2023, 67, 129–141. [Google Scholar] [CrossRef]
  4. Huynh, H.L.; Tucho, W.M.; Yu, X.; Yu, Z. Synthetic natural gas production from CO2 and renewable H2: Towards large-scale production of Ni–Fe alloy catalysts for commercialization. J. Clean. Prod. 2020, 264, 121720. [Google Scholar] [CrossRef]
  5. Abbas, H.F.; Daud, W.M.A.W. Hydrogen production by methane decomposition: A review. Int. J. Hydrogen Energy 2010, 35, 1160–1190. [Google Scholar] [CrossRef]
  6. Fadlalla, M.I.; Babu, S.G.; Nyathi, T.M.; Weststrate, C.J.K.J.; Fischer, N.; Niemantsverdriet, J.W.H.; Claeys, M. Enhanced oxygenates formation in the Fischer–Tropsch synthesis over Co-and/or Ni-containing Fe alloys: Characterization and 2D gas chromatographic product analysis. ACS Catal. 2020, 10, 14661–14677. [Google Scholar] [CrossRef]
  7. Li, T.; Wang, H.; Yang, Y.; Xiang, H.; Li, Y. Study on an iron–nickel bimetallic Fischer–Tropsch synthesis catalyst. Fuel Process. Technol. 2014, 118, 117–124. [Google Scholar] [CrossRef]
  8. Guo, F.; Jia, X.; Liang, S.; Zhou, N.; Chen, P.; Ruan, R. Development of biochar-based nanocatalysts for tar cracking/reforming during biomass pyrolysis and gasification. Bioresour. Technol. 2020, 298, 122263. [Google Scholar] [CrossRef]
  9. Velvizhi, G.; Jacqueline, P.J.; Shetti, N.P.; K, L.; Mohanakrishna, G.; Aminabhavi, T.M. Emerging trends and advances in valorization of lignocellulosic biomass to biofuels. J. Environ. Manag. 2023, 345, 118527. [Google Scholar] [CrossRef]
  10. Putro, W.S.; Kojima, T.; Hara, T.; Ichikunia, N.; Shimazu, S. Selective hydrogenation of unsaturated carbonyls by Ni–Fe-based alloy catalysts. Catal. Sci. Technol. 2017, 7, 3637–3646. [Google Scholar] [CrossRef]
  11. Long, F.; Wu, S.; Chen, Y.; Cao, X.; Zhao, J.; Liu, P.; Jiang, J.; Zhang, X.; Xu, J. Hydrogenation of fatty acids to fatty alcohols over Ni3Fe nanoparticles anchored on TiO2 crystal catalyst: Metal support interaction and mechanism investigation. Chem. Eng. J. 2023, 464, 142773. [Google Scholar] [CrossRef]
  12. Nie, L.; de Souza, P.M.; Noronha, F.B.; An, W.; Sooknoi, T.; Resasco, D.E. Selective conversion of m-cresol to toluene over bimetallic Ni–Fe catalysts. J. Mol. Catal. A: Chem. 2014, 388, 47–55. [Google Scholar] [CrossRef]
  13. Miyazaki, M.; Ariyama, K.; Furukawa, S.; Takayama, T.; Komatsu, T. Chemoselective hydrogenation of nitroarenes using Ni−Fe alloy catalysts at ambient pressure. ChemistrySelect 2021, 6, 5538–5544. [Google Scholar] [CrossRef]
  14. Petkar, D.R.; Kadu, B.S.; Chikate, R.C. Highly efficient and chemoselective transfer hydrogenation of nitroarenes at room temperature over magnetically separable Fe–Ni bimetallic nanoparticles. RSC Adv. 2014, 4, 8004–8010. [Google Scholar] [CrossRef]
  15. Wang, F.; Xu, H.; Yu, S.; Zhu, H.; Du, Y.; Zhang, Z.; You, C.; Jiang, X.; Jiang, J. Fe-promoted Ni catalyst with extremely high loading and oxygen vacancy for lipid deoxygenation into green diesel. Renew. Energy 2022, 197, 40–49. [Google Scholar] [CrossRef]
  16. Wang, X.; Ding, C.; Long, H.; Wu, Y.; Zhao, H.; Jiang, F.; Chang, R.; Xue, S.; Shen, M.; Yang, X. Catalytic reduction of nitrogen monoxide using iron–nickel oxygen carriers derived from electroplating sludge: Novel method for the collaborative emission decrease of polluting gases. Sci. Total Environ. 2024, 927, 172315. [Google Scholar] [CrossRef]
  17. Rodríguez, J.L.; Valenzuela, M.A. Ni-based catalysts used in heterogeneous catalytic ozonation for organic pollutant degradation: A minireview. Environ. Sci. Pollut. Res. 2022, 29, 84056–84075. [Google Scholar] [CrossRef] [PubMed]
  18. Mekki, A.; Mokhtar, A.; Hachemaoui, M.; Beldjilali, M.; Meliani, M.F.; Zahmani, H.H.; Hacini, S.; Boukoussa, B. Fe and Ni nanoparticles-loaded zeolites as effective catalysts for catalytic reduction of organic pollutants. Microporous Mesoporous Mater. 2021, 310, 110597. [Google Scholar] [CrossRef]
  19. Khalafallah, D.; Zhi, M.; Hong, Z. Development trends on nickel-based electrocatalysts for direct hydrazine fuel cells. ChemCatChem 2021, 13, 81–110. [Google Scholar] [CrossRef]
  20. Zeng, Z.; Gan, L.Y.; Bin Yang, H.; Su, X.; Gao, J.; Liu, W.; Matsumoto, H.; Gong, J.; Zhang, J.; Cai, W.; et al. Orbital coupling of hetero-diatomic nickel-iron site for bifunctional electrocatalysis of CO2 reduction and oxygen evolution. Nat. Commun. 2021, 12, 4088. [Google Scholar] [CrossRef]
  21. Yan, P.; Peng, H.; Zhang, X.; Rabiee, H.; Ahmed, M.; Weng, Y.; Rozhkovskaya, A.; Vogrin, J.; Konarova, M.; Zhu, Z. Unlocking the role of Ni-Fe species in CO2 methanation. Fuel 2024, 374, 132373. [Google Scholar] [CrossRef]
  22. Medina, O.E.; Amell, A.A.; López, D.; Santamaría, A. Comprehensive review of nickel-based catalysts advancements for CO2 methanation. Renew. Sustain. Energy Rev. 2025, 207, 114926. [Google Scholar] [CrossRef]
  23. Görlin, M.; Ferreira de Araújo, J.; Schmies, H.; Bernsmeier, D.; Dresp, S.; Gliech, M.; Jusys, Z.; Chernev, P.; Kraehnert, R.; Dau, H.; et al. Tracking catalyst redox states and reaction dynamics in Ni–Fe oxyhydroxide oxygen evolution reaction electrocatalysts: The role of catalyst support and electrolyte pH. J. Am. Chem. Soc. 2017, 139, 2070–2082. [Google Scholar] [CrossRef]
  24. Yang, Y.; Zhu, X.; Yi, C.; Yang, H.; Hou, X.; Liao, X.; Chen, C.; Yu, D.; Zhou, X. An efficient NiFe binary alloy anode catalyst for direct borohydride fuel cells. Chem. Eng. J. 2023, 472, 145097. [Google Scholar] [CrossRef]
  25. Liu, Q.; Wang, F.; Hu, E.; Hong, R.; Li, T.; Yuan, X.; Cheng, X.B.; Cai, N.; Xiao, R.; Zhang, H. Nickel-iron nanoparticles encapsulated in carbon nanotubes prepared from waste plastics for low-temperature solid oxide fuel cells. iScience 2022, 25, 104855. [Google Scholar] [CrossRef]
  26. Van Loon, J.; Kubarev, A.V.; Roeffaers, M.B.J. Correlating catalyst structure and activity at the nanoscale. ChemNanoMat 2018, 4, 6–14. [Google Scholar] [CrossRef]
  27. Venezia, A.M.; La Parola, V.; Liotta, L.F. Structural and surface properties of heterogeneous catalysts: Nature of the oxide carrier and supported particle size effects. Catal. Today 2017, 285, 114–124. [Google Scholar] [CrossRef]
  28. Cuenya, B.R. Synthesis and catalytic properties of metal nanoparticles: Size, shape, support, composition, and oxidation state effects. Thin Solid Film. 2010, 518, 3127–3150. [Google Scholar] [CrossRef]
  29. Ndolomingo, M.J.; Bingwa, N.; Meijboom, R. Review of supported metal nanoparticles: Synthesis methodologies, advantages and application as catalysts. J. Mater. Sci. 2020, 55, 6195–6241. [Google Scholar] [CrossRef]
  30. Lyakhov, A.O.; Oganov, A.R.; Valle, M. Crystal structure prediction using evolutionary approach. In Modern Methods of Crystal Structure Prediction; Oganov, A.R., Ed.; Wiley-VCH, Weinheim: Berlin, Germany, 2010; pp. 147–180. [Google Scholar] [CrossRef]
  31. Oganov, A.R.; Kruglov, I.; Zhang, J.; Mahdi Davari Esfahani, M. Computational materials discovery using evolutionary algorithms. In Computational Materials Discovery; Oganov, A.R., Saleh, G., Kvashnin, A.G., Eds.; Special Collection: 2018 eBook collection; The Royal Society of Chemistry: Cambridge, UK, 2018; pp. 15–65. [Google Scholar] [CrossRef]
  32. Oganov, A.R.; Lyakhov, A.O.; Valle, M. How Evolutionary Crystal Structure Prediction Works–and Why. Acc. Chem. Res. 2011, 44, 227–237. [Google Scholar] [CrossRef] [PubMed]
  33. Tao, F.F. Synthesis, catalysis, surface chemistry and structure of bimetallic nanocatalysts. Chem. Soc. Rev. 2012, 41, 7977–7979. [Google Scholar] [CrossRef] [PubMed]
  34. Zaleska-Medynska, A.; Marchelek, M.; Diak, M.; Grabowska, E. Noble metal-based bimetallic nanoparticles: The effect of the structure on the optical, catalytic and photocatalytic properties. Adv. Colloid Interface Sci. 2016, 229, 80–107. [Google Scholar] [CrossRef] [PubMed]
  35. Singh, A.K.; Xu, Q. Synergistic catalysis over bimetallic alloy nanoparticles. ChemCatChem 2013, 5, 652–676. [Google Scholar] [CrossRef]
  36. Jiang, H.L.; Xu, Q. Recent progress in synergistic catalysis over heterometallic nanoparticles. J. Mater. Chem. 2011, 21, 13705–13725. [Google Scholar] [CrossRef]
  37. Campbell, C.T. The energetics of supported metal nanoparticles: Relationships to sintering rates and catalytic activity. Acc. Chem. Res. 2013, 46, 1712–1719. [Google Scholar] [CrossRef]
  38. Gu, C.; Chen, L.; Liu, Y.; Zhang, X.; Liu, J.; Zhang, Q.; Wang, C.; Ma, L. One-pot conversion of biomass-derived levulinic acid to furanic biofuel 2-methyltetrahydrofuran over bimetallic NiCo/γ-Al2O3 catalysts. Mol. Catal. 2022, 524, 112317. [Google Scholar] [CrossRef]
  39. Kouachi, K.; Lafaye, G.; Pronier, S.; Bennini, L.; Menad, S. Mo/γ-Al2O3 catalysts for the Biginelli reaction. Effect of Mo loading. J. Mol. Catal. A Chem. 2014, 395, 210–216. [Google Scholar] [CrossRef]
  40. Pandey, A.; Bjurström, A.; Birdsong, B.K.; Arvidsson, R.; Dezfoli, P.R.; Tjus, K.; Andrée, S.; Sädbom, S.; Björk, A.; Olsson, R.T. Carbon fibres as electrodes for the recovery of nickel from industrial wastewater. RSC Appl. Interfaces 2025, 2, 1031–1040. [Google Scholar] [CrossRef]
  41. Judanova, L.I.; Logvinenko, V.A.; Judanov, N.F. Homogeneous Nanoparticles of Nickel Coated with Shell and Metod of Their Production. R.U. Patent RU2466098C1, 29 March 2011. [Google Scholar]
  42. Asaldoust, F.; Mabhouti, K.; Jafari, A.; Taleb-Abbasi, M. Structural, magnetic, and optical characteristics of undoped and chromium, iron, cobalt, copper, and zinc doped nickel oxide nanopowders. Sci. Rep. 2025, 15, 1088. [Google Scholar] [CrossRef]
  43. Inamdar, A.I.; Kim, Y.S.; Pawar, S.M.; Kim, J.H.; Im, H.; Kim, H. Chemically grown, porous, nickel oxide thin-film for electrochemical supercapacitors. J. Power Sources 2011, 196, 2393–2397. [Google Scholar] [CrossRef]
  44. Zeifert, B.H.; Salmones, J.; Hernández, J.A.; Reynoso, R.; Nava, N.; Reguera, E.; Cabañas-Moreno, J.G.; Aguilar-Ríos, G. X-ray diffraction and Mössbauer characterization of Raney Fe-Ni catalysts. J. Radioanal. Nucl. Chem. 2000, 245, 637–639. [Google Scholar] [CrossRef]
  45. Guerrero-Ruiz, A.; Sepúlveda-Escribano, A.; Rodriguez-Ramos, I. Carbon supported bimetallic catalysts containing iron: I. Preparation and characterization. Appl. Catal. A Gen. 1992, 81, 81–100. [Google Scholar] [CrossRef]
  46. Boretskaya, A.; Il’yasov, I.D.; Lamberov, A.; Popov, A. Identification of amorphous and crystalline phases in alumina entity and their contribution to the properties of the palladium catalyst. Appl. Surf. Sci. 2019, 496, 143635. [Google Scholar] [CrossRef]
  47. Holder, C.F.; Schaak, R.E. Tutorial on powder X-ray diffraction for characterizing nanoscale materials. ACS Nano 2019, 13, 7359–7365. [Google Scholar] [CrossRef]
  48. Phase Diagram Creation. Available online: https://oqmd.org/analysis/phase_diagram/ (accessed on 11 June 2025).
  49. Automatic-Flow for Materials Discovery. Available online: https://www.aflowlib.org/aflow-chull/ (accessed on 11 June 2025).
  50. Silman, G.I. Compilative Fe–Ni phase diagram with author’s correction. Met. Sci. Heat. Treat. 2012, 54, 105–112. [Google Scholar] [CrossRef]
  51. Crystallography Open Database. Available online: http://www.crystallography.net/cod/result.php (accessed on 11 June 2025).
  52. Barber, C.; Dobkin, D.; Huhdanpaa, H. The quickhull algorithm for convex hulls. ACM Trans. Math. Softw. 1996, 22, 469–483. [Google Scholar] [CrossRef]
  53. Stevanović, V.; Lany, S.; Zhang, X.; Zunger, A. Correcting density functional theory for accurate predictions of compound enthalpies of formation: Fitted elemental-phase reference energies. Phys. Rev. B 2012, 85, 115104. [Google Scholar] [CrossRef]
  54. Sandu, M.P.; Sidelnikov, V.S.; Geraskin, A.A.; Chernyavskii, A.V.; Kurzina, I.A. Influence of the method of preparation of the Pd-Bi/Al2O3 catalyst on catalytic properties in the reaction of liquid-phase oxidation of glucose into gluconic acid. Catalysts 2020, 10, 271. [Google Scholar] [CrossRef]
  55. Oganov, A.R.; Glass, C.W. Crystal structure prediction using ab initio evolutionary techniques: Principles and applications. J. Chem. Phys. 2006, 124, 244704. [Google Scholar] [CrossRef]
  56. Abzaev, Y.A.; Guda, S.A.; Guda, A.A.; Zelenkov, A.A.; Kolesnikov, V.I. Structural Phase State of High-Entropy NbTiHfVZr Alloy. Phys. Met. Metallogr. 2023, 124, 807–815. [Google Scholar] [CrossRef]
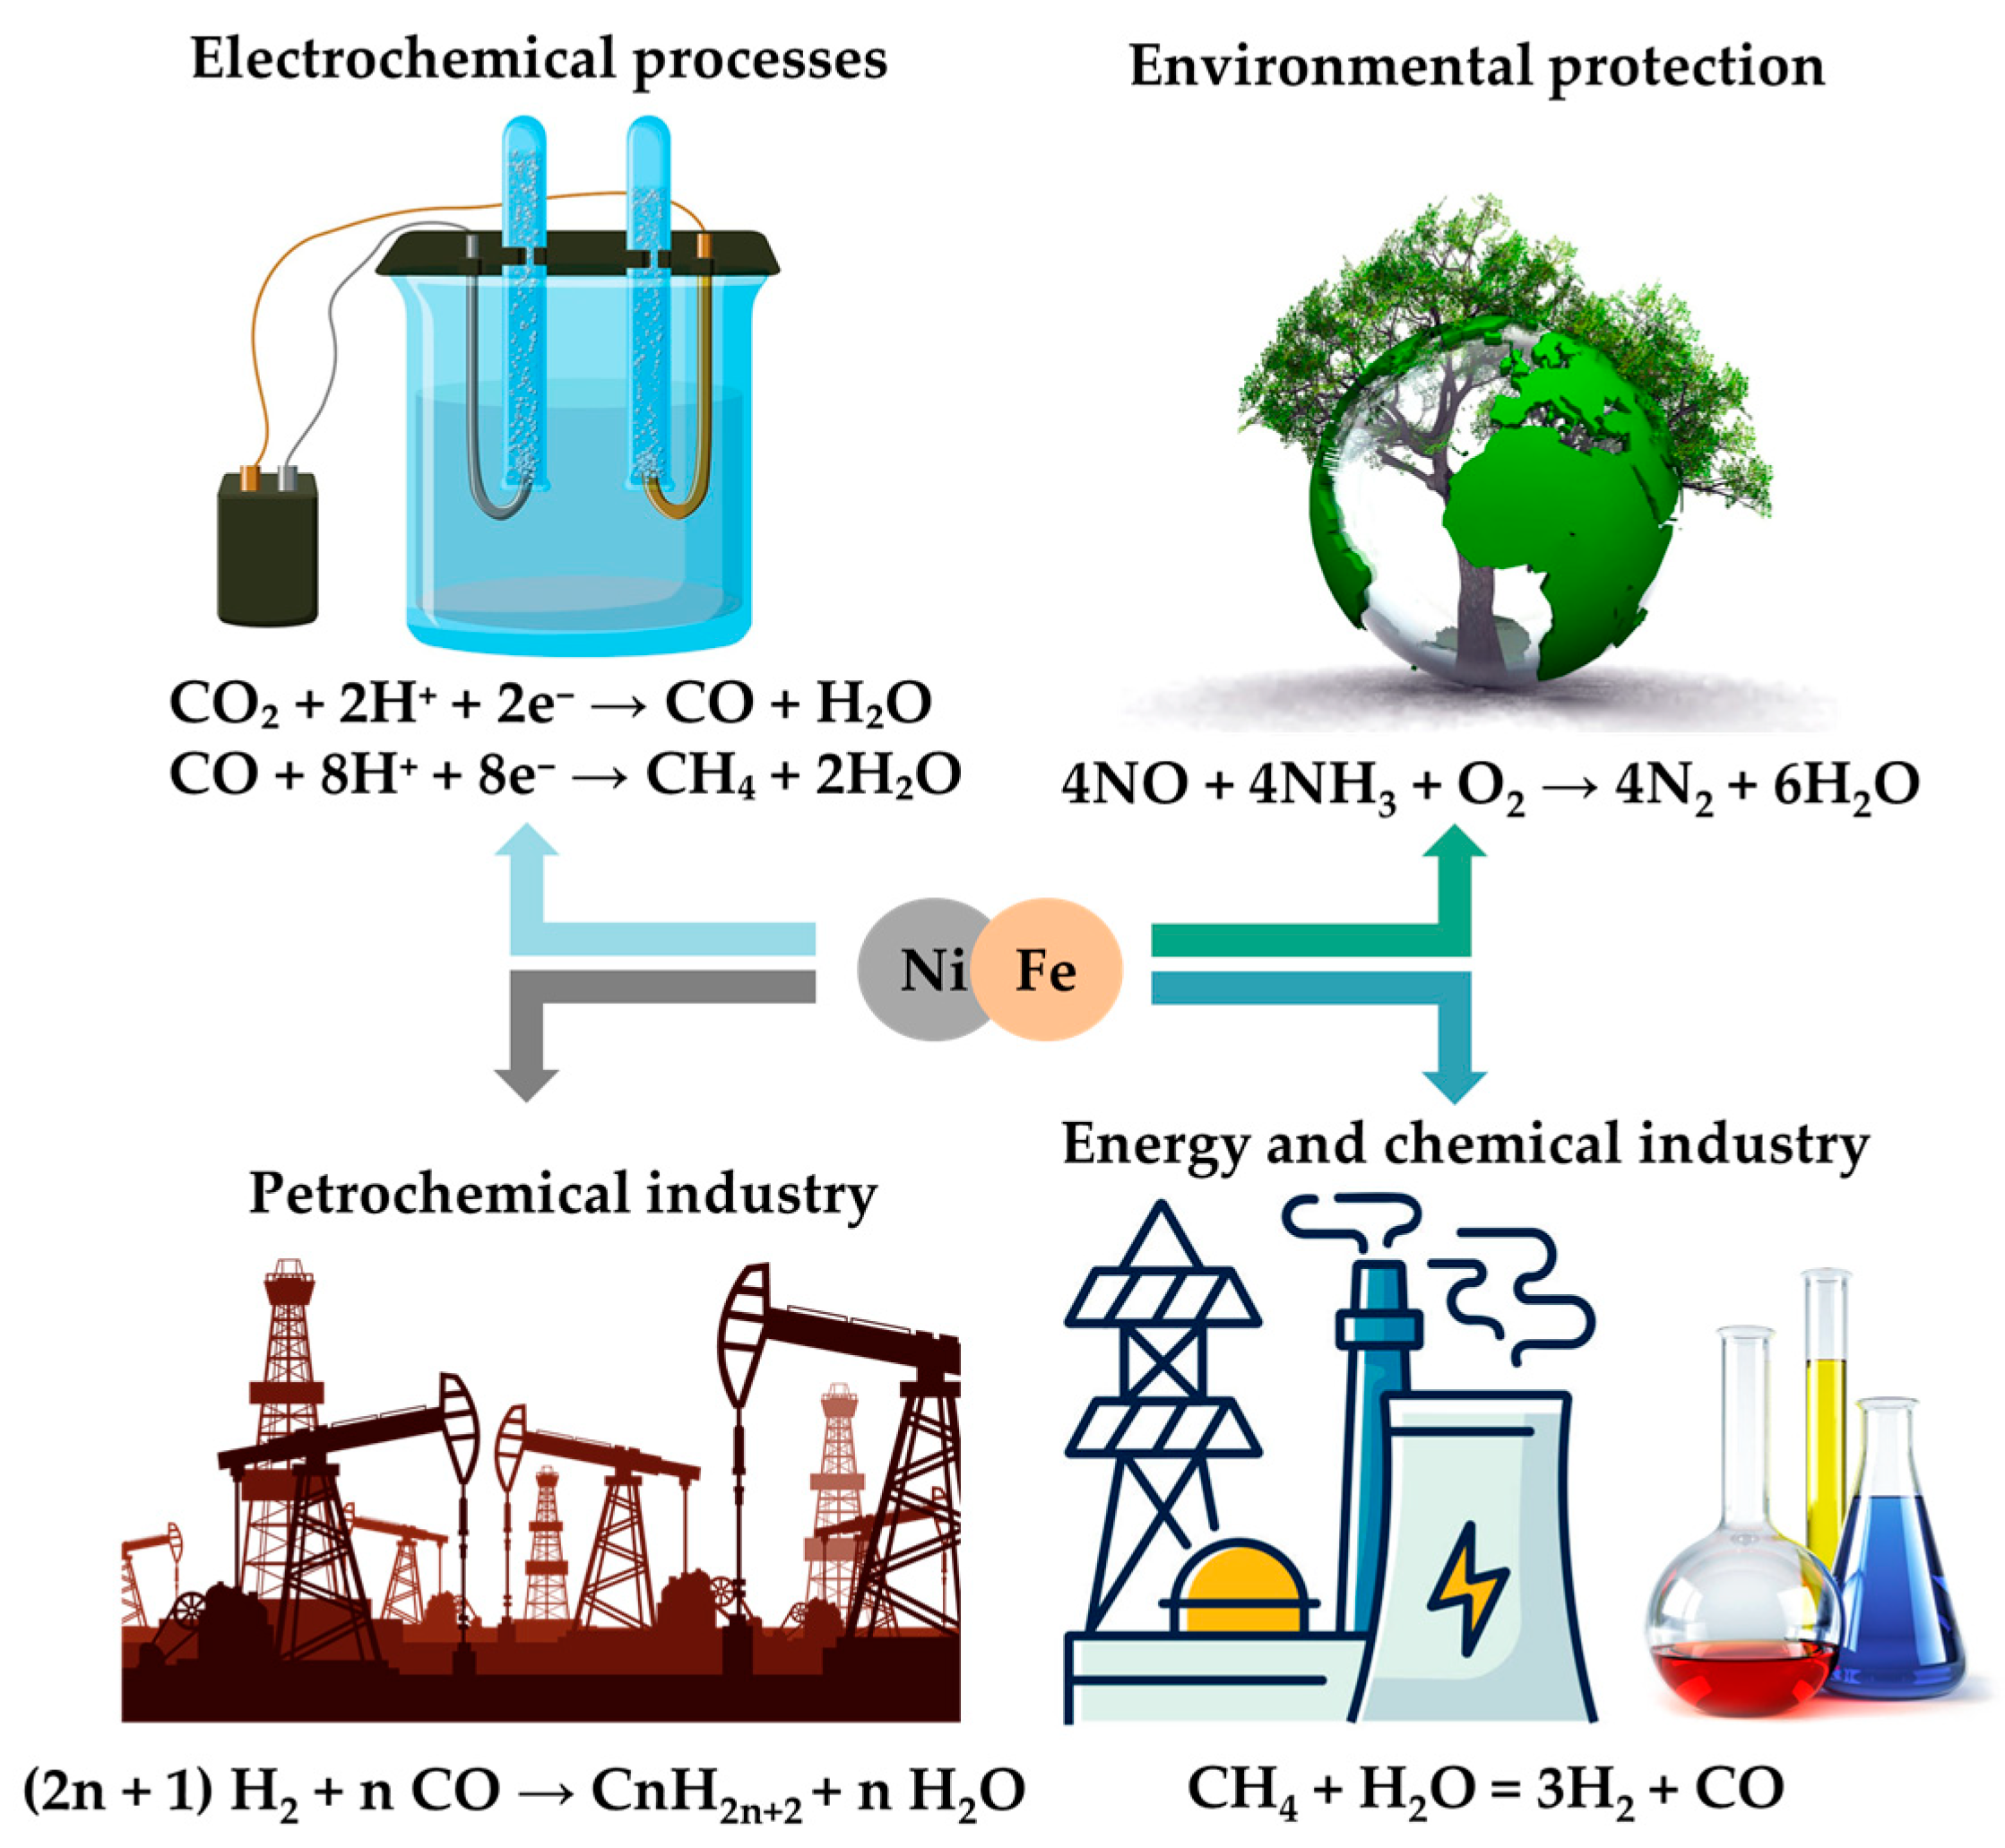
Figure 1. Applications of Ni-Fe bimetallic catalysts.
Inorganics 13 00349 g001
Figure 2. SEM micrographs of γ-Al2O3 (a) and 1Ni-1Fe/Al2O3 (b). SEM-EDS elemental mapping of 1Ni-1Fe/Al2O3 catalyst showing the powder sample (c) and an individual granule (d).
Inorganics 13 00349 g002
Figure 3. Top: TEM micrographs. Bottom: Corresponding particle size distribution (PSD) histograms obtained from statistical analysis of 800 randomly selected nanoparticles for each sample. 20Ni-1Fe/Al2O3 (a), 10Ni-1Fe/Al2O3 (b), 5Ni-1Fe/Al2O3 (c) and 1Ni-1Fe/Al2O3 (d) catalysts.
Inorganics 13 00349 g003
Figure 4. TEM-EDS elemental maps showing the distribution of Fe (green) and Ni (red) overlaid on TEM-BF images of the 20Ni-1Fe/Al2O3 (a), 10Ni-1Fe/Al2O3 (b), 5Ni-1Fe/Al2O3 (c) and 1Ni-1Fe/Al2O3 (d) samples.
Inorganics 13 00349 g004
Figure 5. XRD patterns of the synthesized bimetallic samples and the alumina support.
Inorganics 13 00349 g005
Figure 6. These are selected-area electron diffraction (SAED) patterns acquired from specified regions of the following samples: 20Ni-1Fe/Al2O3 (a), 10Ni-1Fe/Al2O3 (b), 5Ni-1Fe/Al2O3 (c) and 1Ni-1Fe/Al2O3 (d) samples.
Inorganics 13 00349 g006
Figure 7. XPS spectra of mono- and bimetallic Ni-Fe samples for Ni 2p3/2 (a) and Fe 2p3/2 (b).
Inorganics 13 00349 g007
Figure 8. Predicted 3D crystal structures of Fe-Ni systems (range of 10–20 atoms): S-1 (a), S-2 (b), S-3 (c) and S-4 (d).
Inorganics 13 00349 g008
Figure 9. Predicted three-dimensional atomic structures of Fe-Ni systems (≤10 atoms): S-5 (a), S-6 (b) and S-7 (c).
Inorganics 13 00349 g009
Table 1. The elemental composition and textural properties of the synthesized catalysts.
SampleMetal Content (wt.%)Total Metal Content (Ni + Fe) (wt.%)Ni/Fe
(Atomic Ratio)
SBET (m2/g)Pore Volume (cm3/g)Average Pore Diameter (nm)
NiFe
γ-Al2O3----1380.306.0
1Ni-1Fe/Al2O32.292.134.421.01320.286.3
5Ni-1Fe/Al2O34.430.715.145.41360.286.0
10Ni-1Fe/Al2O34.990.085.079.91380.296.0
20Ni-1Fe/Al2O35.290.035.3218.61380.296.0
Ni/Al2O34.65-4.65-1370.286.0
Fe/Al2O3-4.804.80-1230.256.3
Table 2. Interpretation of reflections in SAED patterns.
SampleMeasured d-Spacing (Å)IntensityPhase AssignmentReference d-Spacing (Å)Δd (%)DescriptionICDD Reference (PDF#)
20Ni-1Fe/Al2O32.44Highγ-Al2O3 (311)2.40−1.6%Support background00-010-0425
2.03HighNi (111)2.030%Main phase00-004-0850
1.43Highα-Fe (200)1.430%Local Fe clusters00-006-0696
1.17Weakα-Fe (211)1.170%Local Fe clusters00-006-0696
1.01Very weakNi (222)1.04+2.9%High-order reflection00-004-0850
10Ni-1Fe/Al2O32.46Highγ-Al2O3 (311)2.40−2.4%Support background00-010-0425
2.03HighNi (111)2.030%Main phase00-004-0850
1.80SpottyFeNi (200)1.79−0.5%Fe dissolution in Ni/FeNi formation00-047-1405
1.43Highα-Fe (200)1.430%Main phase00-006-0696
1.28SpottyFeNi (220)1.27−0.8%Confirms FeNi00-047-1405
1.17Very weakα-Fe (211)1.170%Confirms Fe00-006-0696
5Ni-1Fe/Al2O32.43Highγ-Al2O3 (311)2.40−1.2%Support background00-010-0425
2.07HighFeNi (111)2.03/2.07−2.0%/0%Main phase00-047-1405
1.42Highα-Fe (200)1.43+0.7%Main phase00-006-0696
1.29WeakFeNi (220)1.27−1.6%Confirms FeNi00-047-1405
1.17Spottyα-Fe (211)1.170%Confirms Fe00-006-0696
1Ni-1Fe/Al2O32.42Highγ-Al2O3 (311)2.40−0.8%Support background00-010-0425
2.07HighFeNi (111)2.070%Main phase00-047-1405
1.43Highα-Fe (200)1.430%Main phase00-006-0696
1.18Weakα-Fe (211)1.17−0.8%Confirms Fe00-006-0696
1.03WeakFeNi (222)1.04+1.0%Confirms FeNi00-047-1405
Table 3. Summary of the phases identified by SAED analysis.
SampleDetected PhasesDescription
20Ni-1Fe/Al2O3γ-Al2O3Support
NiMain phase
α-FeLocal clusters
10Ni-1Fe/Al2O3γ-Al2O3Support
NiMain phase
FeNi intermetallic/Fe-Ni solid solutionInitial formation
α-FeMain phase
5Ni-1Fe/Al2O3γ-Al2O3Support
FeNi intermetallicConfirmed phase
α-FeMain phase
1Ni-1Fe/Al2O3γ-Al2O3Support
FeNi intermetallicMain phase
α-FeMain phase
Table 4. Binding energies and ratios of metal states in the samples determined by XPS.
SampleBinding Energy, eVContribution of State, %
Ni/Al2O3Ni0 852.816.5
NiII 855.983.5
Fe/Al2O3Fe0 707.47.0
FeII 709.56.4
FeIII 711.586.6
1Ni-1Fe/Al2O3Ni0 855.768.2
NiII 858.731.8
Fe0 706.79.0
FeII 709.225.6
FeIII 711.265.3
5Ni-1Fe/Al2O3Ni0 855.271.1
NiII 858.328.9
10Ni-1Fe/Al2O3Ni0 854.042.2
NiII 857.157.8
20Ni-1Fe/Al2O3Ni0 853.829.5
NiII 856.570.5
Table 5. Structural parameters of Ni-Fe systems containing 10–20 atoms.
StructureCompositiona (Å)b (Å)c (Å)α (°)β (°)γ (°)Space Group
S-1Ni20Fe27.3725.4936.502114.9378.9977.16P1, Triclinic
S-2Ni11Fe106.1116.9146.132100.0294.01103.62P1, Triclinic
S-3Ni5Fe116.9386.9383.45590.0090.0090.00P4/mmm, Tetragonal
S-4Ni5Fe1115.9222.4648.51695.3590.0090.008, CmMonoclinic
Table 6. Structural parameters of Ni-Fe systems with ≤ 10-atom compositions.
StructureCompositiona (Å)b (Å)c (Å)α (°)β (°)γ (°)Space Group
S-5Ni9Fe4.1637.3307.98790.0099.8090.008, Cm Monoclinic
S-6Ni5Fe4.2774.2774.05890.0090.00120.00189, P-62m, Hexagonal
S-7Ni10Fe24.2837.4208.18490.0080.1390.0012 C2/m, Monoclinic
Table 7. Thermodynamic data for Ni-Fe systems were calculated ab initio and obtained from reference databases [52,53].
Material IDFormulaFunctionalEnthalpy Formation (eV/Atom)Temperature (K)
mp-13FeGGA00
mp-2213FeNiGGA−0.076
mp-1418FeNi3GGA−0.097
mp-23NiGGA0
mp-13FeGGA0300
mp-2213FeNiGGA−0.079
mp-1418FeNi3GGA−0.096
mp-23NiGGA0
mp-13FeGGA0700
mp-2213FeNiGGA−0.079
mp-1418FeNi3GGA−0.094
mp-23NiGGA0
mp-13FeGGA0900
mp-2213FeNiGGA−0.025
mp-1418FeNi3GGA−0.045
mp-23NiGGA0
mp-13FeGGA01500
mp-2213FeNiGGA+0.008
mp-1418FeNi3GGA−0.014
mp-23NiGGA0
mp-13FeGGA01700
mp-2213FeNiGGA+0.03
mp-1418FeNi3GGA+0.009
mp-23NiGGA0
Disclaimer/Publisher’s Note: The statements, opinions and data contained in all publications are solely those of the individual author(s) and contributor(s) and not of MDPI and/or the editor(s). MDPI and/or the editor(s) disclaim responsibility for any injury to people or property resulting from any ideas, methods, instructions or products referred to in the content.