Article

Screening of Carbon-Supported Platinum Electrocatalysts Using Frumkin Adsorption Isotherms

by
Ruslan M. Mensharapov
1,
Dmitry D. Spasov
1,2,
Nataliya A. Ivanova
1,
Adelina A. Zasypkina
1,
Sergey A. Smirnov
2 and
Sergey A. Grigoriev
1,2,3,*
1
National Research Center “Kurchatov Institute”, 1, Akademika Kurchatova Sq., 123182 Moscow, Russia
2
National Research University “Moscow Power Engineering Institute”, 14, Krasnokazarmennaya St., 111250 Moscow, Russia
3
HySA Infrastructure Center of Competence, Faculty of Engineering, North-West University, Potchefstroom 2531, South Africa
*
Author to whom correspondence should be addressed.
Inorganics 2023, 11(3), 103; https://doi.org/10.3390/inorganics11030103
Submission received: 30 January 2023 / Revised: 23 February 2023 / Accepted: 27 February 2023 / Published: 28 February 2023
(This article belongs to the Special Issue Electrochemical Study of Nanocarbon Based Materials)

Abstract

:
An important stage in the development of platinum electrocatalysts on carbon support is the analysis of their basic parameters. Cyclic voltammetry is an effective tool for analyzing the structural and electrochemical properties of such electrocatalysts. Using Frumkin adsorption isotherms, the contribution of the platinum surface to the hydrogen adsorption region was well described by three peaks corresponding to different crystal structures. The screening was carried out for platinum black and platinum electrocatalysts supported by carbon black, reduced graphene oxide (RGO), carbon nanotubes (CNTs), and nanofibers (CNFs). For most samples, the peak contribution to the electrochemical surface area (ESA) and corresponding hydrogen adsorption energies had close values, but the parameters deviated for Pt black and RGO-based samples was observed. The dependence of the calculated peak parameters on the number of accelerated stress test cycles was used to evaluate the effect of the type of carbon support on the stability of the electrocatalyst and the structure of platinum nanoparticles. The experimental results indicate a high degree of stability and differences in the degradation mechanisms of electrocatalysts based on nanostructured carbon compared to carbon black, which are explained by differences in the metal-support interaction and corrosion resistance of nanostructured carbon supports.

1. Introduction

Today, the fourth energy transition and decarbonization of the energy sector are actively pursued, and electrochemical systems, specifically fuel cells and water electrolyzers with a polymer electrolyte membrane (PEM), play an important role [1]. Their effective integration with energy installations based on renewable energy sources is important [2].
One of the main components of PEM electrochemical systems is a carbon-supported platinum electrocatalyst. Structural features of active nanoparticles and carbon support have a fundamental impact on the performance, durability, and efficiency of the catalyst and the electrochemical system as a whole [3]. Various electrocatalyst carriers can be used, such as carbon black [4], carbon nanotubes (CNTs) [5,6,7,8,9] and nanofibers (CNFs) [10,11,12], graphene and reduced graphene oxide (RGO) [13,14,15,16,17], as well as less studied carbon structures, such as "nano-onions" [18,19] and spheres [20,21].
The type of carbon support influences the morphology of the deposited Pt nanoparticles. The authors of [22] studied the mobility and morphology of three sizes of platinum nanoparticles (130, 249, and 498 atoms) on various carbon supports. It was shown that for all particle sizes, the diffusion coefficient of Pt nanoparticles was the lowest for carbon nanotube supports. Nanoparticles on carbon nanotubes may be subjected to less sintering and agglomeration than nanoparticles on graphite. The results of this work suggest that it is possible to adapt the catalytic properties of supported metal nanoparticles by selecting and functionalizing the support.
To optimize the synthesis method, catalyst concentration, and support type, electrocatalyst parameter screening methods are necessary. For quantitative analysis of the electrochemical surface area (ESA) and determination of the Pt structure of electrocatalysts, cyclic voltammogram (CV) data are used [23].
To study the hydrogen evolution reaction (HER) and the hydrogen oxidation reaction (HOR) on model metal catalysts at the atomic level, many experiments and theoretical studies were carried out for the elucidation of the processes of adsorption [24,25,26], diffusion [27,28,29,30], and desorption [31,32,33] of hydrogen on metal surfaces of single crystals. For example, Pt as a model catalyst effectively promotes the release of hydrogen with a high cathodic current density at low overvoltage [34,35,36,37]. The first experimental results clearly show that the order of activity of hydrogen release on Pt surfaces is as follows: Pt(110) > Pt(100) > Pt(111), and the kinetic current density on the surface (110) is about three times greater than the current density on the surface (111) [35].
In the case of platinum, the surface properties can be determined using the CV region corresponding to hydrogen adsorption; since the total adsorption charge is directly proportional to the number of atoms on the surface, it can be used to calculate the real surface area [38]. Also, the distribution of charge among different adsorption peaks gives an initial estimate of the presence of different regions of active sites on the surface of the Pt electrocatalyst [39].
Different empirical adsorption isotherms are traditionally used for model descriptions of adsorption phenomena. Processes of adsorption of charged particles are described with high accuracy by the Frumkin isotherm. The Frumkin isotherm is one of the most common in electrochemistry, especially when describing the adsorption of surface-active ions and molecules on the surface of electrodes in an electrolyte solution. In fact, the Frumkin isotherm equation considers the change in the adsorption enthalpy depending on the surface coverage, where the change is caused by lateral interaction of particles in the adsorption layer [40]. The CV curve of the hydrogen underpotential deposition reaction on the platinum surface may be considered a sum of distinct voltammetric peaks of adsorption states [23]. As a result, the Frumkin analysis is a powerful tool for determining the energy and charge associated with hydrogen adsorption on various platinum crystal surfaces [38].
The purpose of the present paper is to determine the effect of the type of carbon supports on the crystal structure of the surface of platinum nanoparticles and their stability during the accelerated stress test (AST) at high potentials. A series of electrocatalysts, such as platinum black and platinum electrocatalysts based on various carbon supports, including carbon black, CNTs, CNFs, and RGO, were synthesized using the polyol method. The obtained samples were subjected to AST, during which CV curves were recorded. To analyze the change in the structure of electrocatalysts, deconvolution of the hydrogen adsorption peaks was carried out using the Frumkin isotherms. The resulting parameters of the adsorption isotherms were used to analyze structural changes in electrocatalysts during the AST cycles.

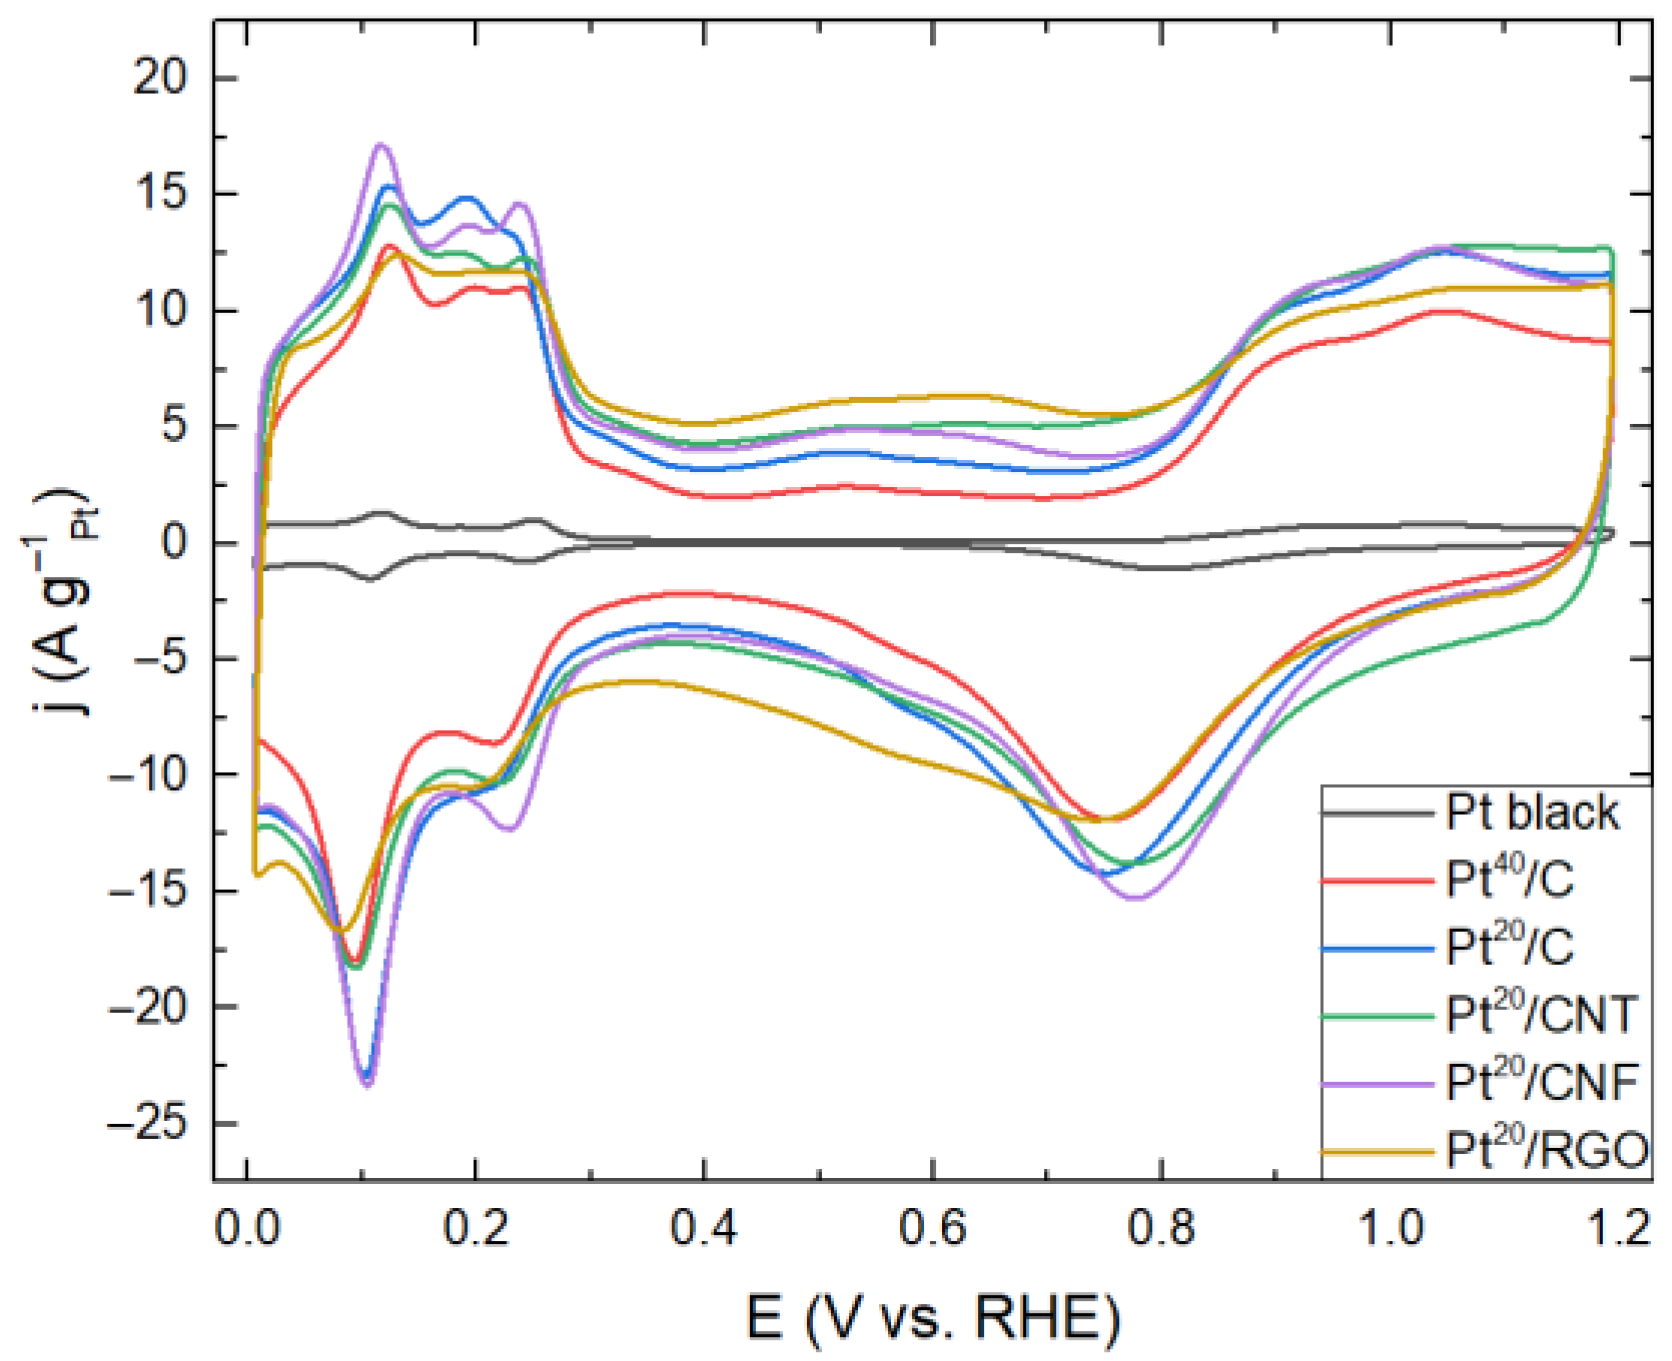
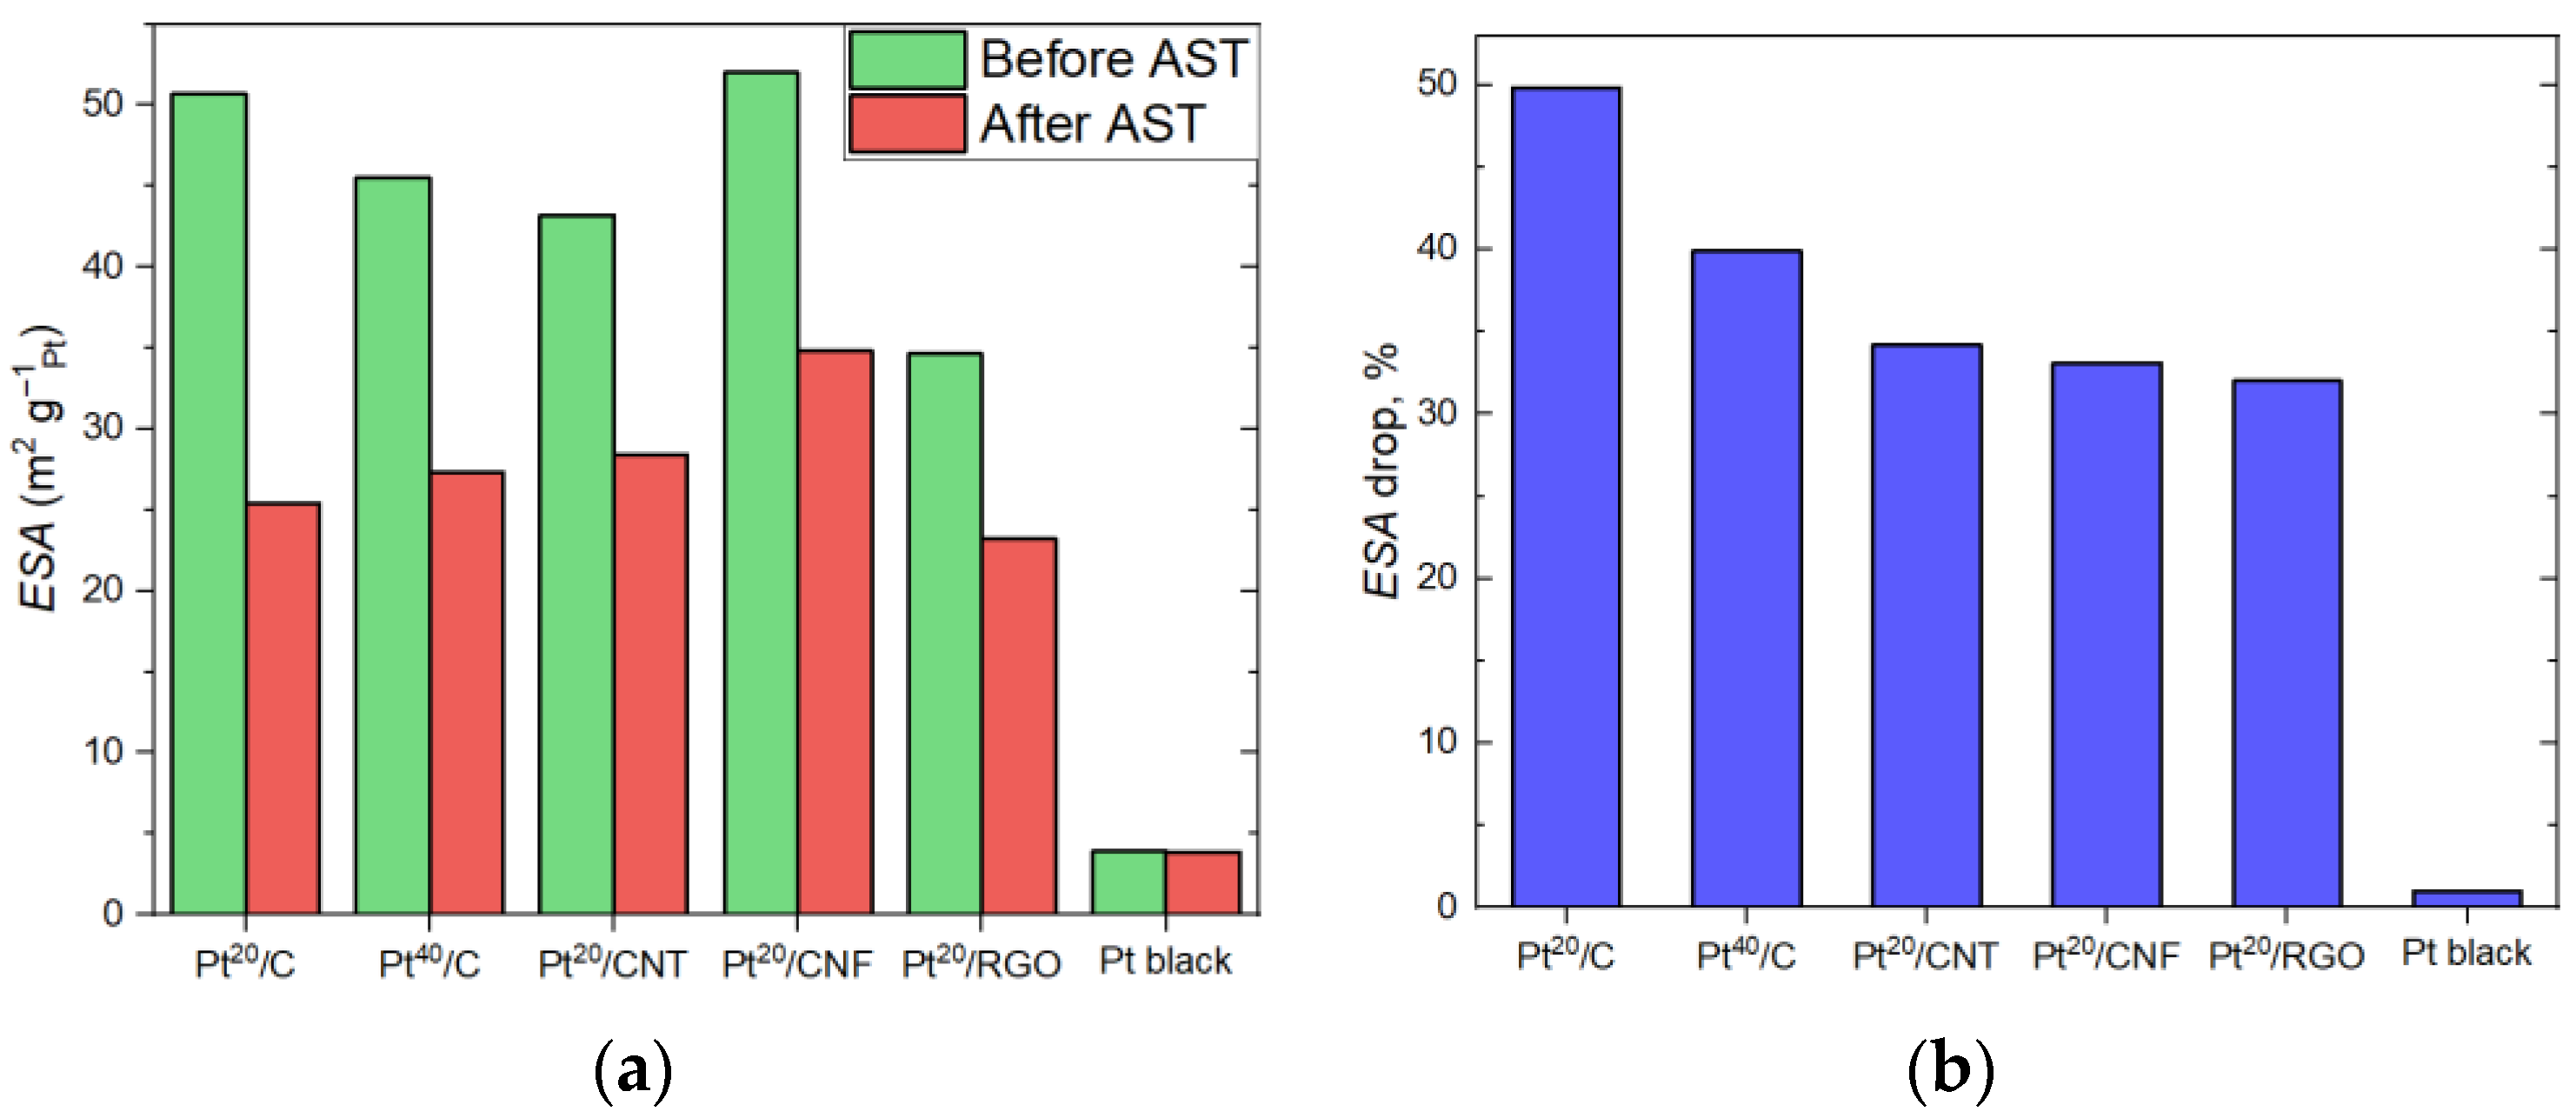
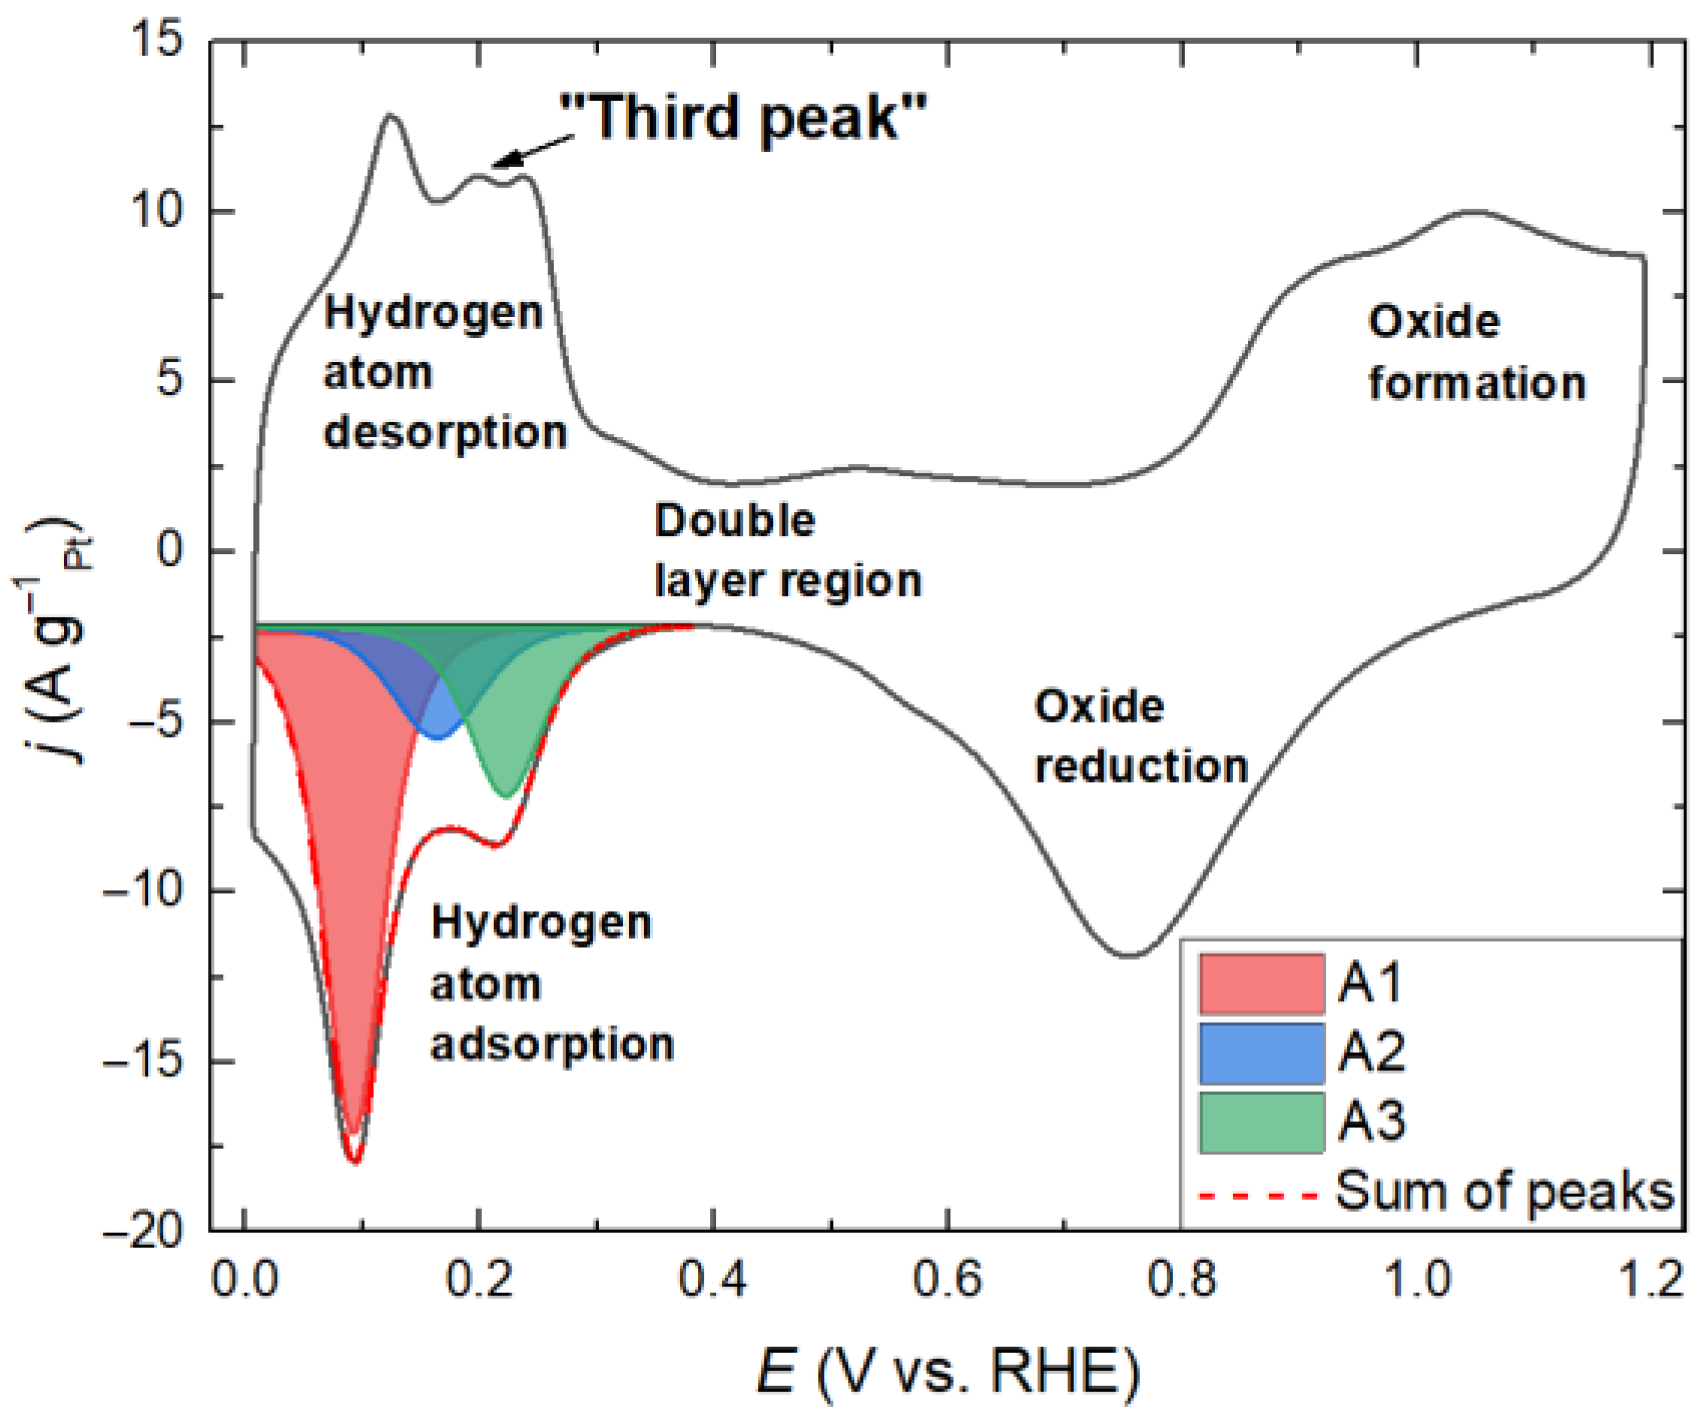
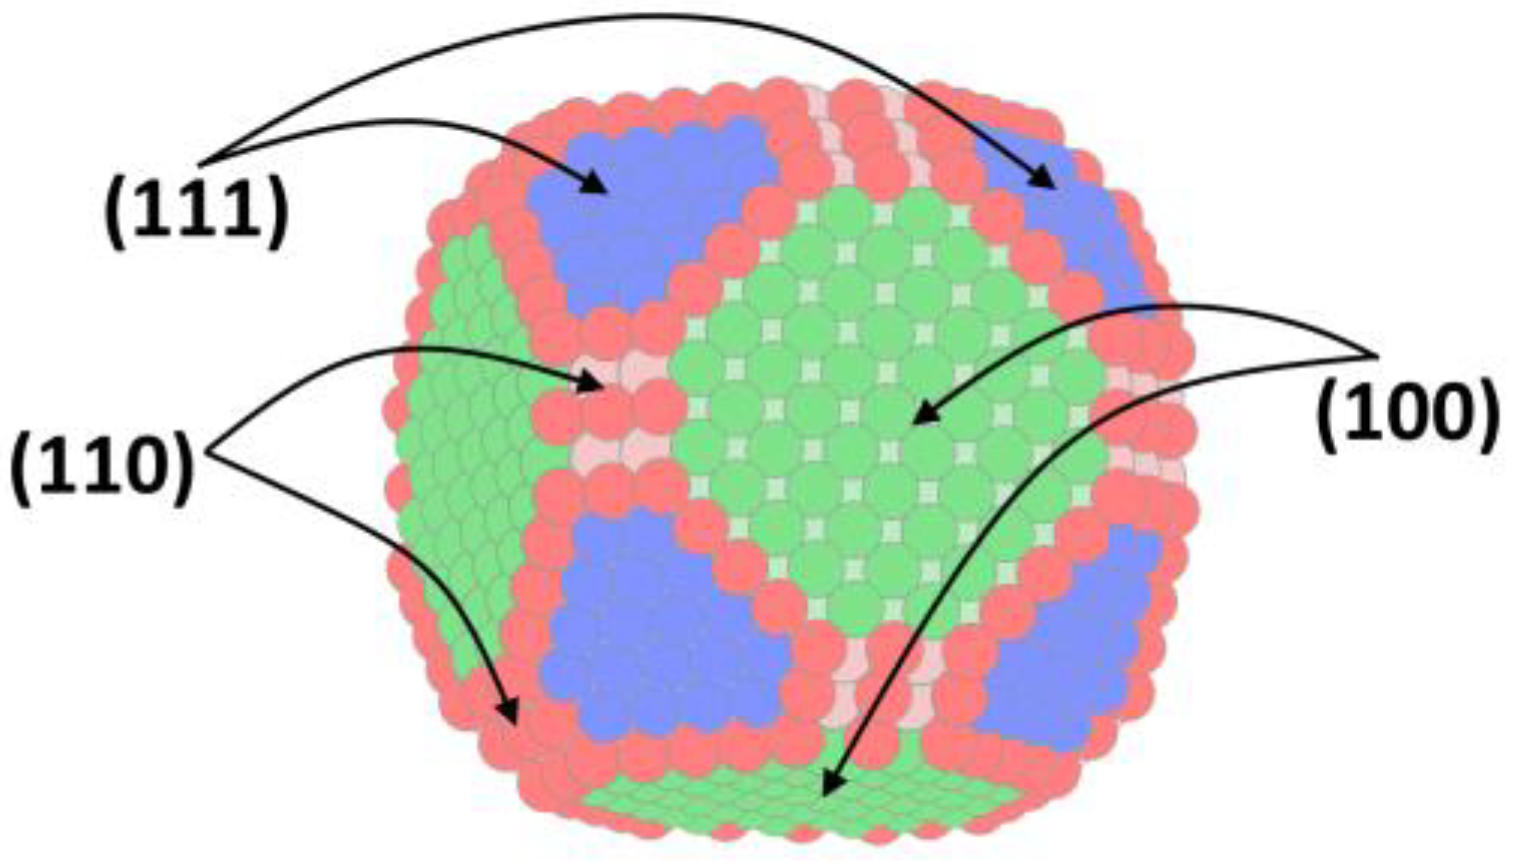
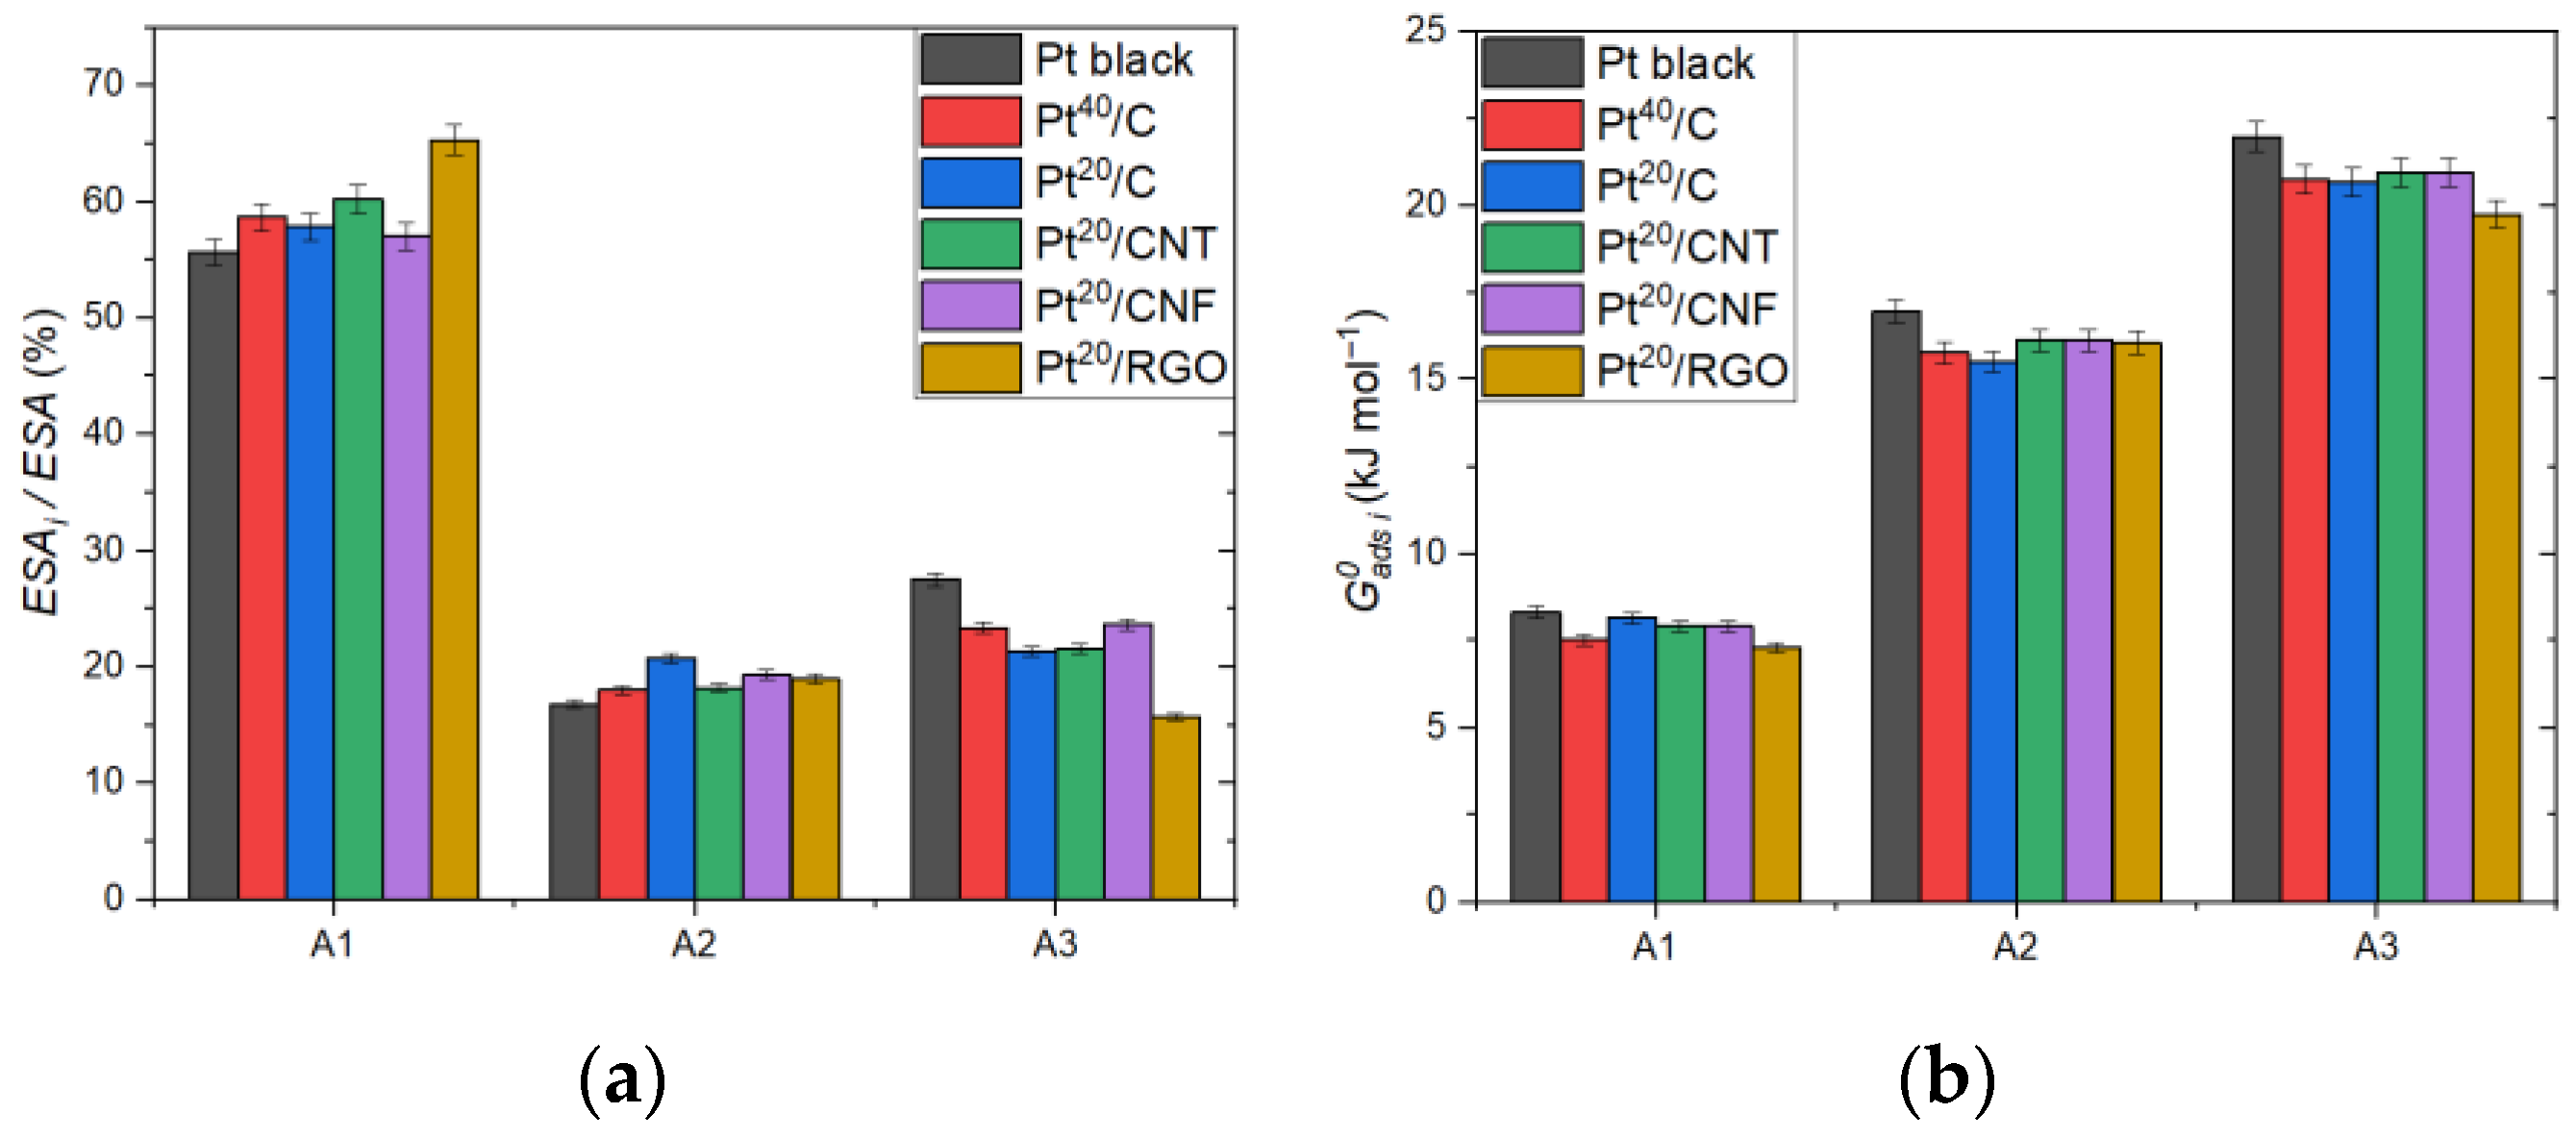
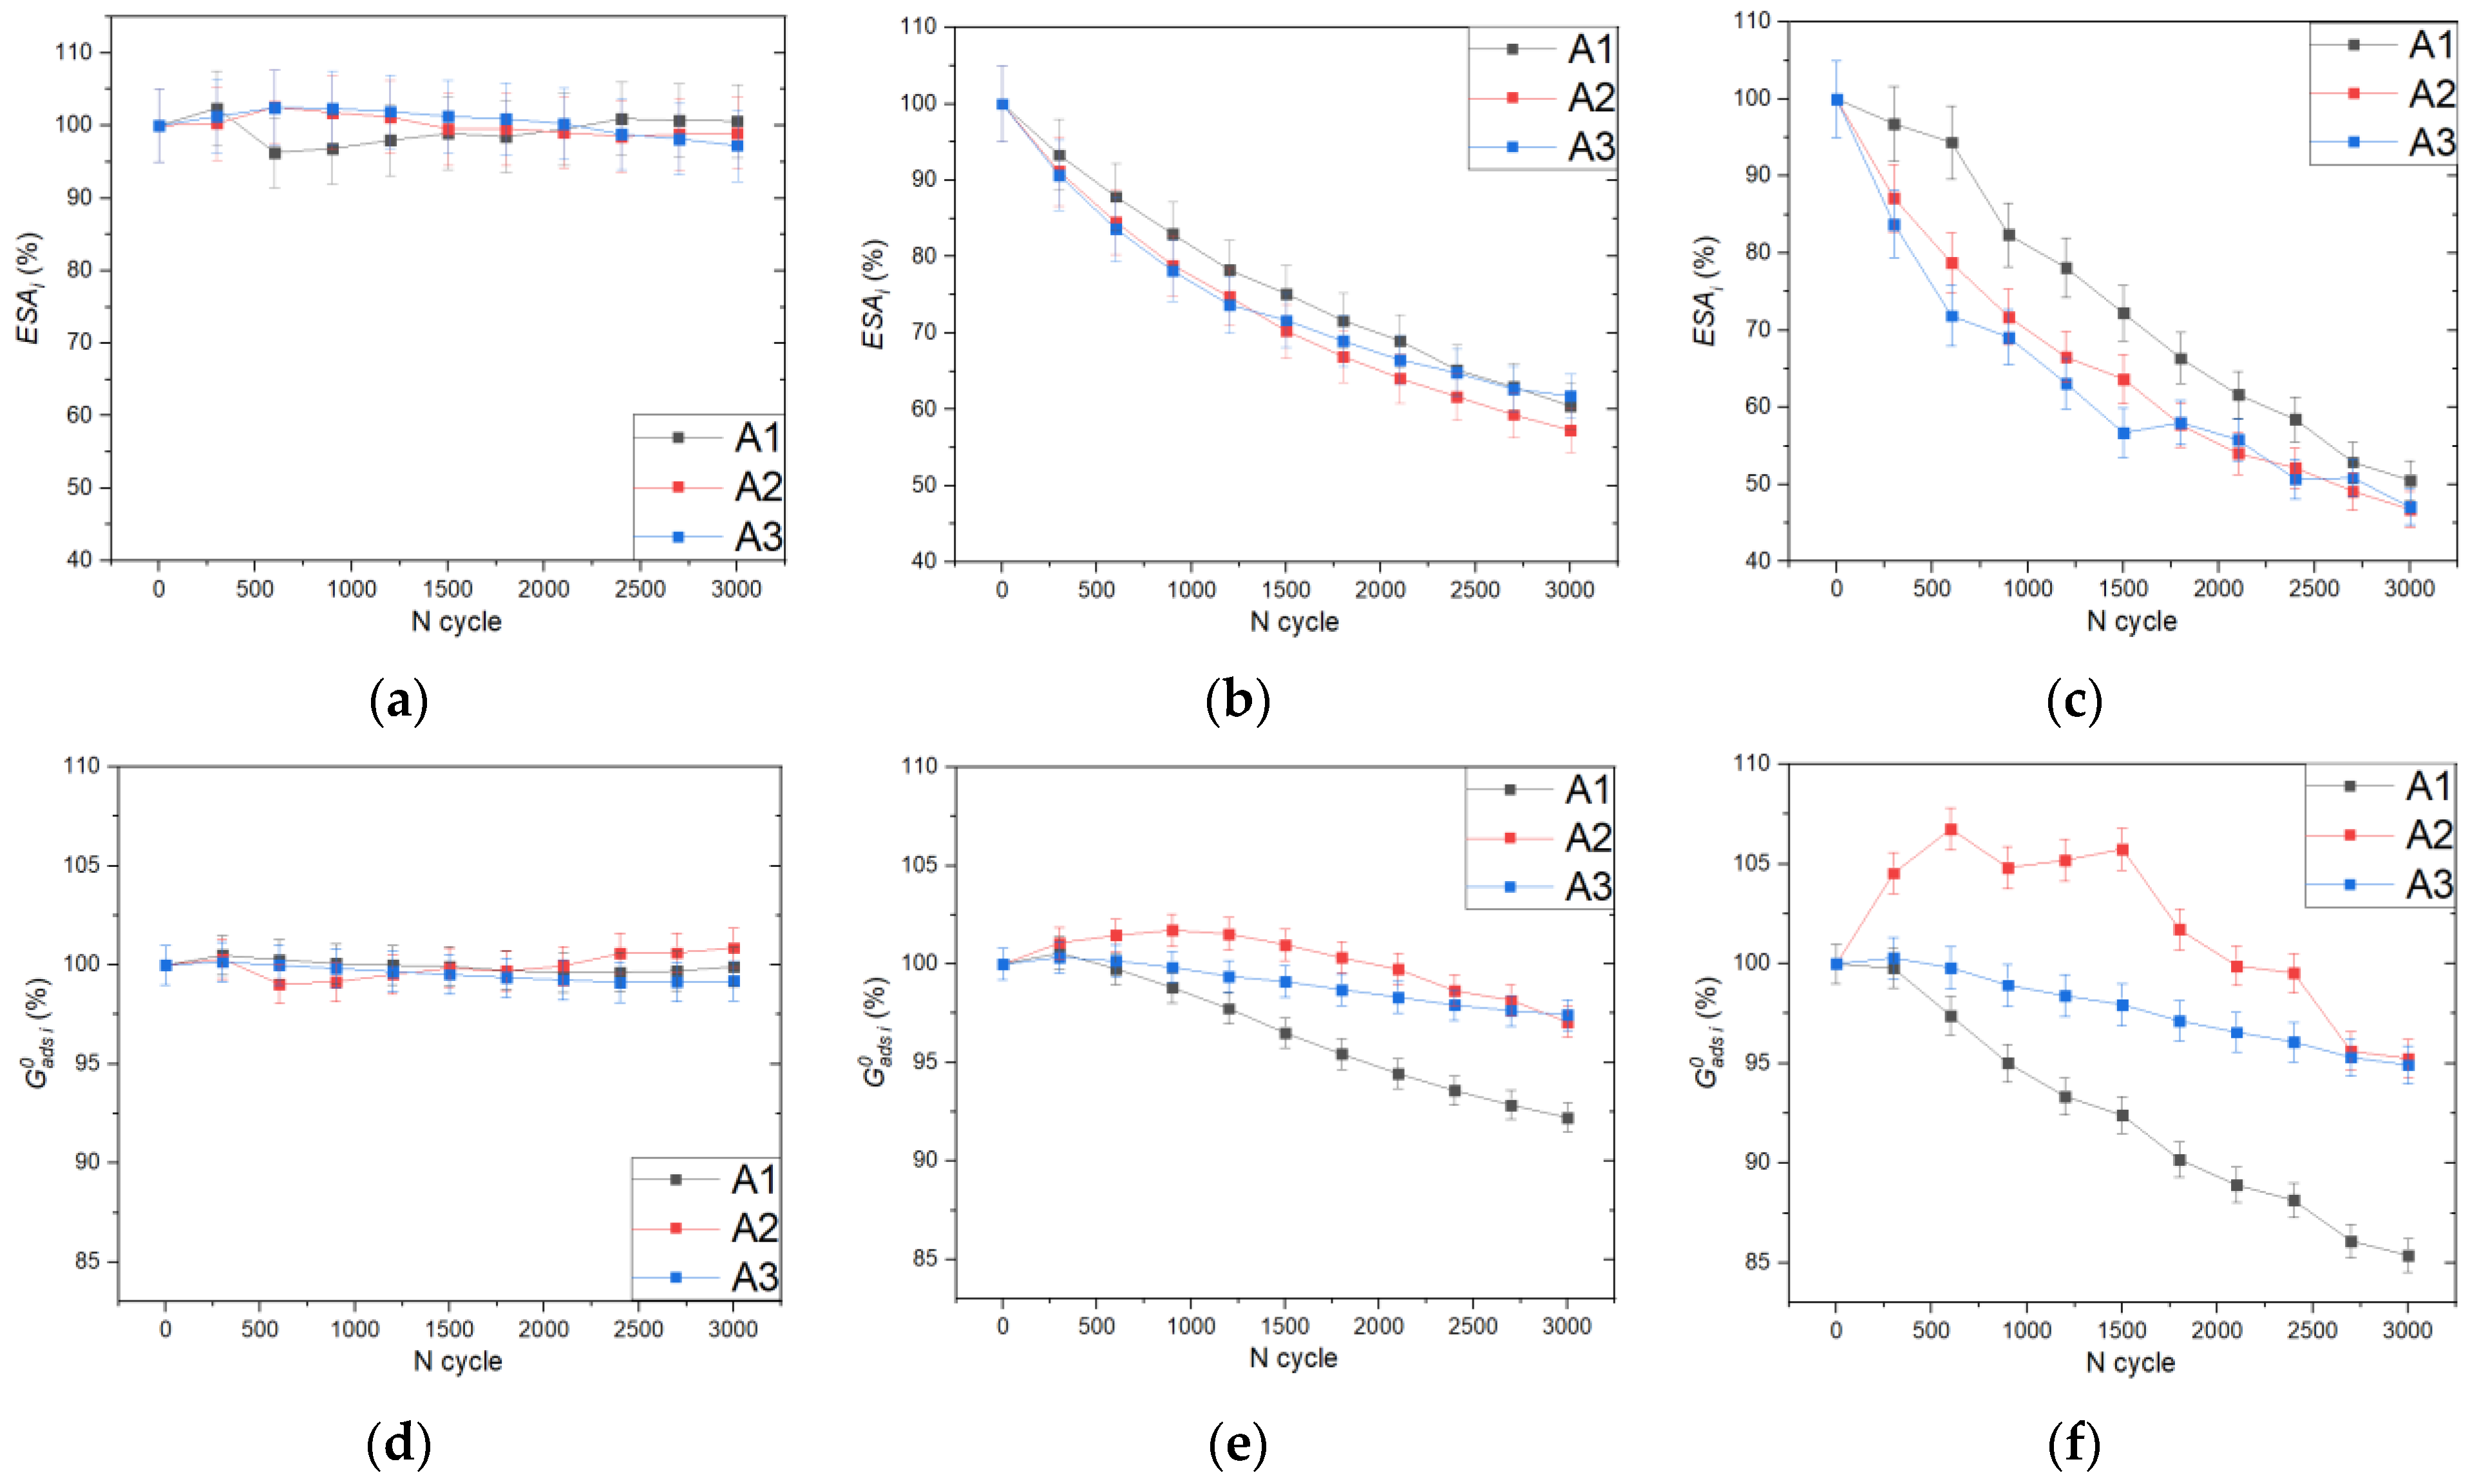
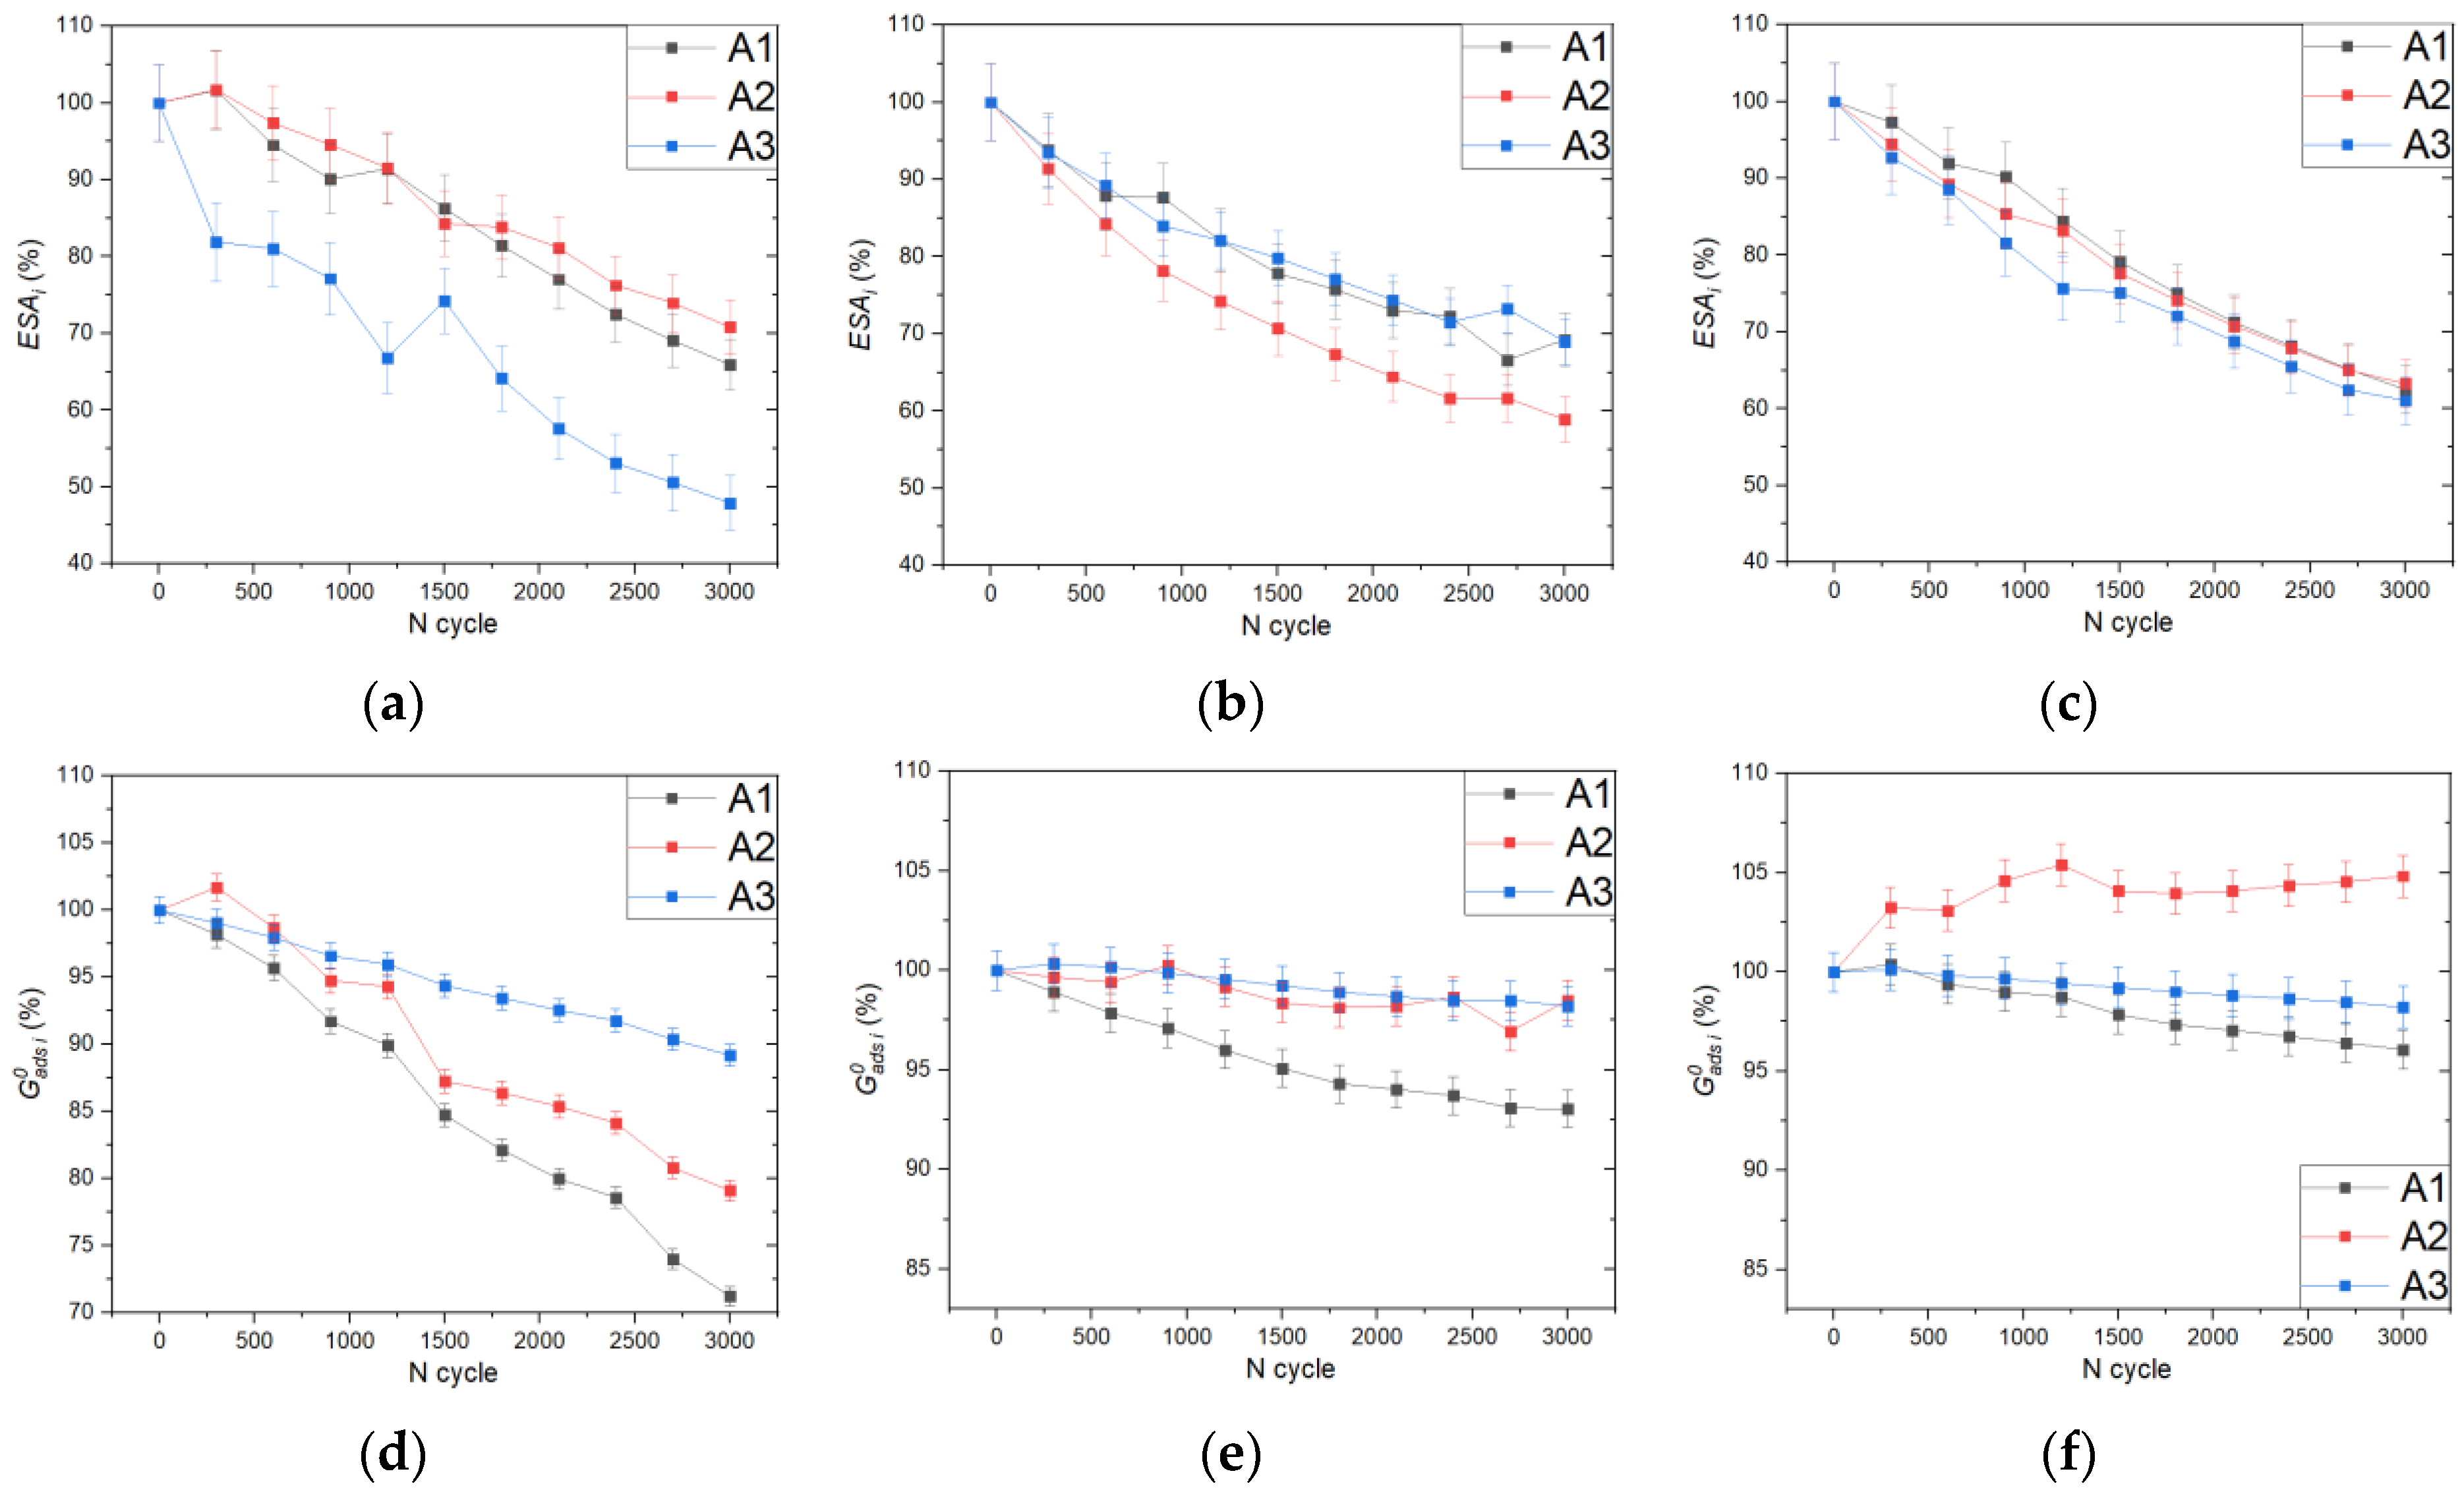
2. Results and Discussion

Figure 1 shows the CV obtained for samples of electrocatalysts.
Pronounced differences are observed on the CV curves for the current density of the double-layer region, which characterizes different types of support. For the RGO-based sample, the current density is maximum in this region, which indicates a more developed surface of this support due to the presence of a large number of defects [41]. For samples based on CNT and CNF, the values are close, reflecting the similarity of their morphology.
The ESA values and the values of the average particle diameter calculated by formulas (11) and (12), respectively, are presented in Table 1.
Since the synthesis of platinum particles was carried out under the same conditions, the differences between the ESA values for electrocatalysts with the same platinum content are caused by specific features of the support. Relatively low ESA values for samples based on complex carbon structures were obtained due to the use of a synthesis procedure optimized for a support in the form of carbon black, which was necessary to exclude the effect of synthesis conditions on the structure of platinum particles.
The change in the shape of the curves with an increase in the number of AST cycles is shown in Figure S1. The stability of the electrocatalysts can be evaluated from the change in the ESA. The ESA values before and after the 3000 AST cycles, as well as the magnitude of the ESA drop, are shown in Figure 2 and in Tables S1–S6. The Pt40/C sample is more stable in the AST than the Pt20/C one due to the greater resistance of larger particles to degradation [42]. The minimal change in the ESA corresponds to the Pt black due to the absence of a carbon support in its composition and the large particle size. The increased stability of electrocatalysts based on complex carbon structures is explained by the greater corrosion resistance of the nanostructured support [43,44], as well as better adhesion of particles to the support surface due to the strong metal–support interaction [45].
According to previous studies [46,47], the greatest contribution to the decrease in the ESA during the AST is made by such processes as (1) dissolution of platinum nanoparticles, accompanied by re-deposition of platinum on larger particles at the expense of smaller ones (Ostwald ripening), (2) agglomeration of platinum nanoparticles, (3) corrosion of carbon support material with detachment of platinum particles, and formation of carbon oxidation products that may adsorb on the Pt active sites. When evaluating the change in the ESA, it is impossible to distinguish the individual contributions of these processes to the change in the electrochemical and structural properties of the electrocatalyst. For this purpose, the hydrogen region of CV can be considered from the standpoint of spectroscopic methods. The use of a sulfuric acid solution instead of perchloric acid as an electrolyte appears more convenient in this case, since it allows registering more pronounced adsorption peaks [23].
Figure 3 shows the Pt40/C CV with characteristic regions corresponding to electrochemical reactions.
The hydrogen adsorption and desorption curves have pronounced peaks that can be described using the Frumkin isotherm peaks. In the region of hydrogen desorption, the "third peak" is observed in addition to the structure-dependent peaks [48,49]. The nature of this peak is not fully understood; however, according to a previous study [50], this peak can be associated with the replacement of adsorbed hydrogen by adsorbed -OH groups. This peak is absent in the region of hydrogen adsorption; therefore, to simplify the method, we will consider the adsorption region.
The hydrogen adsorption peak includes the contribution of different types of crystal structure on the platinum surface [23,51]. The main types of structure include the surface with Miller indices (100), (110), and (111), as shown in Figure 4.
As a result of the procedure of fitting the peaks to the experimental curves, it was found that the predominant contribution of surface structures to the hydrogen adsorption peak can be described with sufficient accuracy by three peaks of the Frumkin isotherms (A1, A2, and A3). The most intense peak (A1) is in the region of lower potentials; it corresponds to a greater extent to the structure with the low Miller index (110), namely, weak adsorption of hydrogen on step-shaped sites [23,53]. Peak A3 includes a contribution to the strong adsorption of hydrogen on the steps of (100) structure. Peak A2 corresponds to low-coordinated atoms, such as steps and kinks, as well as defects on the (110) and (111) structures formed after oxygen adsorption [53]. Structure (111), namely, well-oriented terraces, have a broad and uniform low-intensity peak over the entire region of hydrogen adsorption within the considered potential range [37,50]. This peak makes similar contributions to all three adsorption peaks under consideration and, therefore, should not have a significant effect on the relative change in the obtained parameters.
In the potential region below the A1 peak, there is also a region of molecular hydrogen evolution. The beginning of this region on the CV corresponds to the bending of the polarization curve at about 0 V relative to the reversible hydrogen electrode (see Figure 3). For accurate measurement of the ESA, it is important to exclude this region; therefore, the use of the adsorption isotherm makes it possible to determine the beginning of the hydrogen evolution process with a higher degree of accuracy [54].
Figure 5 shows the contributions of the peaks to the ESA as well as the values of the adsorption energies corresponding to the peaks. The parameters of the peaks are close in value, but there is a greater deviation between the parameters of Pt black and Pt/RGO. In the case of the ESA, the Pt black sample has the lowest A1 and A2 peak values but the highest A3 peak value. Since with an increase in the particle size the percentage of sites with the lattice of type 110, as well as edges and corners on their surface, considerably decreases, the contribution of structures of this type to the hydrogen adsorption peak is less for larger particles than for smaller ones [55,56].
The RGO-based sample shows a relatively low ESA value compared to other samples on carbon supports. This feature may be due to the influence of the graphene surface on the structure of nanoparticles or to the inaccuracy in the estimation of the total ESA and the particle size calculated from the former, which is caused by the agglomeration of graphene sheets and the blocking of a part of the platinum active sites from electrolyte exposure.
The lower hydrogen adsorption energies of carbon-supported electrocatalysts can be attributed to the significant difference in size and surface structure in comparison with Pt black. Although the platinum–support interaction may also cause the decrease in the adsorption energy and can explain the low values for the RGO-based sample, which demonstrates the strong metal–support interaction due to the presence of surface functional groups and defects [44,45].
During the AST cycles (see Supplementary Material), for most samples, there is an observed shift in the peaks towards the region of lower potentials, on average by 10–20 mV. The potential shift can be explained by a more probable detachment of platinum atoms with higher free energy, which leads to a decrease in the average hydrogen adsorption energy of the final surface.
To study processes occurring during the AST, we considered such parameters as the ESA of a certain peak and the corresponding adsorption energy, the value of which was calculated from the peak position and the interaction constant of the peak using Equation (10). Figure 6 shows variation of the ESA and adsorption energy with an increase in the number of AST cycles for Pt black, Pt40/C, and Pt20/C samples.
In the case of the Pt black sample, there are no significant changes in the ESA or hydrogen adsorption energy, which can be explained by the absence of a carbon support, which is susceptible to corrosion, and by the large size of the particles, which turn out to be much more resistant to dissolution and agglomeration. For samples based on carbon black, a proportional drop in the ESA of all peaks is observed; however, for the Pt20/C, the drop for the A1 peak in percentage terms is less pronounced compared to the A2 and A3 peaks. Despite the fact that for the Pt40/C, the drop in the A1 peak should be less pronounced than for the Pt20/C due to size effects, the second mechanism associated with CO adsorption on platinum active sites may be involved here. Carbon species, like CO, can be formed as a result of corrosion of the carbon support during cycling in the region of high potentials [57] and can be irreversibly adsorbed on structures of the 110 type to a lesser extent than on the surface structures of other types [58]. Since the carbon support to platinum ratio is higher for the Pt20/C, the effect of CO adsorption is more pronounced.
The variations in the normalized adsorption energy for the Pt20/C and Pt40/C samples are similar, but more pronounced changes are observed for the Pt20/C sample because of the size effect. The largest change corresponds to the A1 peak, due to the presence of a larger number of atoms with a low coordination number. For the A2 peak, on the contrary, an increase in the adsorption energy is observed in the initial region, which can be explained by the formation of defects as a result of surface reconstruction during oxygen adsorption; however, with an increase in the number of AST cycles, the effect of particle agglomeration and growth predominates, and as a result, the particles are less prone to defect formation.
The ESA and adsorption energy curves corresponding to adsorption peaks for the samples with carbon nanostructures are shown in Figure 7.
The ESA value of the A3 peak for the Pt20/RGO sample decreases with an increase in the number of AST cycles much faster than for the other peaks. This effect may be associated with the specifics of the particle growth and dissolution on the surface of RGO sheets and requires further study. In addition, for peaks A1 and A2, a significant change in adsorption energy is observed as the number of AST cycles increases. This effect can be explained by the formation of a large number of platinum sites with a higher adsorption energy on the corresponding surface types during the synthesis of the RGO-based electrocatalyst. During AST cycles, a more intensive reconstruction of these sites occurs.
The Pt20/CNF and Pt20/CNT samples show high stability of the ESA peaks during the AST and a rate and amount of change in these parameters similar to the Pt40/C sample, despite the lower content of platinum. This effect may be explained by the high stability and corrosion resistance of complex carbon supports. However, in the case of the Pt20/CNF, there is a loss in the ESA of the A2 peak comparable to that of the Pt40/C, suggesting a weak influence of the support type on the stability of the corresponding surface structure of Pt active sites.
The curves of the adsorption energy versus number of AST cycles for the A1 and A3 peaks are similar in shape for all samples with a nanostructured support. Peak A2 shows a similar trend for the Pt20/RGO and Pt20/CNF samples, with the value of the adsorption energy decreasing over the entire range of the AST cycles. The difference between results for the nanostructured electrocatalysts and samples based on carbon black may indicate a smaller contribution of the metal–support interaction.
For the Pt20/CNT sample, there is a reverse trend towards a change in the adsorption energy of the A2 peak, which is probably due to the influence of the support structure on the process of particle growth during the particle association and Ostwald ripening and its surface reconstruction, which cause the formation of relatively small particles with a large number of surface defects.

3. Materials and Methods

3.1. Synthesis of Electrocatalysts

In this work, electrocatalysts with the compositions Pt40/C, Pt20/C, Pt20/CNT, Pt20/CNF, and Pt20/RGO (where 20 and 40 are wt % of platinum, C—carbon black Vulcan XC-72, CNT—lab-synthesized carbon nanotubes, CNF—commercial carbon nanofibers, and RGO—commercial reduced graphene oxide) and Pt black were synthesized using the polyol method in ethylene glycol as described in our previous work [59].

3.2. Electrochemical Studies

Catalytic inks were prepared by mixing 10 mg of electrocatalyst with 1 mL of a 1:1 isopropanol/water solution, followed by ultrasonication for half an hour at room temperature. Then, the resulting catalytic ink aliquot with a volume of 25 μL was pipetted onto a polished and cleaned titanium foil electrode with a geometric area of 0.5 cm2, forming a thin catalyst layer. After that, the titanium electrode was dried until the solvent was completely removed. The final catalyst loading was about 0.5 mg cm–2. The platinum loading for Pt20/C, Pt20/CNT, Pt20/CNF and Pt20/RGO samples was 0.1 mgPt cm−2. According to the catalyst loading, the thickness of the catalyst layer was estimated to be about 0.8 μm [60,61].
The cyclic voltammograms (CVs) were measured in N2-saturated 0.5 M H2SO4 at 25 °C using a conventional three-electrode glass cell, an Ag/AgCl reference electrode, and a Pt wire counter electrode. The measurements were performed using a CorrTest CS350 electrochemical workstation (CorrTest Instruments Corp., Ltd., Wuhan, China). Before CV registration, the electrode was activated in the potential range of 0.05 to 1.20 V vs. RHE at the 50 mV/s potential sweep rate for about 30 cycles until a stable CV was obtained. The CVs of all samples were recorded at the same sweep rate of 20 mV/s in the same potential range and then normalized according to the total mass of Pt in the catalyst layer.
The electrocatalysts were subjected to AST [62,63] by cycling the potential in the range of 0.8–1.4 V vs. the RHE electrode with a sweep rate of 100 mV/s for 3000 cycles. The working 0.5 M H2SO4 solution was pre-saturated with oxygen before AST cycles. The CVs were measured initially and every 300 cycles. Before the CVs measurement, the working solution was saturated with N2. The degree of degradation of the catalyst was estimated from the change in the ESA calculated from the CVs.

4. Theory

The reaction of electrochemical adsorption of hydrogen on the surface of platinum is described by the following equation
P t   +   H 3 O +   +   e   P t H + H 2 O
At equilibrium, the adsorption process in the simplest case is described by the Langmuir isotherm, according to which the electrochemical potential of the reaction can be written as
μ a d s   = μ a d s 0 + R T l n ( θ 1 θ )
where θ is the fraction of occupied active sites on the platinum surface; μads0 is the equilibrium electrochemical potential corresponding to the case of a half-filled platinum surface (θ = 0.5); R is the universal gas constant; and T is temperature.
To take into account the interaction between ions on the platinum surface, Frumkin introduced the interaction constant g. The expression for the electrochemical potential then takes the following form
μ a d s   = μ a d s 0 + R T ( l n ( θ 1 θ ) + g θ )
The constant g takes on a positive value when the adsorbed particles repel each other and a negative value in the case of attraction. For the Frumkin isotherm, the value of the equilibrium electrochemical potential no longer corresponds to the case of θr = 0.5. The equilibrium value of θr can be found from the condition of equality to zero of the last summand in Equation (3).
For a three-electrode cell with a reversible hydrogen electrode as the reference electrode, the Frumkin isotherm for reaction (1) occurring at the working electrode will have the following form [64]
θ 1 θ exp ( g θ ) = f H 2 1 / 2 exp ( E F / R T ) exp ( Δ G a d s 0 / R T )
where f H 2 is the fugacity of H2, E is the potential at the working electrode vs. RHE, F is the Faraday constant, and Δ G a d s 0 is the standard Gibbs free energy corresponding to equilibrium value θr.
The double-layer corrected current density of the CV can be expressed as follows
j = σ H ν d θ d E
where σ H is the specific charge required for the formation of a monolayer of adsorbed hydrogen on the active sites of the platinum surface, and ν is the linear rate of potential sweep E [38].
Using expressions (4) and (5), the dependence of the current density on θ can be deduced as
j = σ H ν F R T ( 1 θ ) θ 1 + g ( 1 θ ) θ
The dependence of the potential on θ has the following form
E = R T F ( l n ( θ 1 θ ) + g θ + Δ G a d s 0 R T )
The resulting expressions can be represented as
j = j m ( 4 + g ) 1 ( ( 1 θ ) θ ) 1 + g
E = E m + R T F ( l n ( 1 θ θ ) + g ( 1 2 θ ) )
The expressions obtained correspond to the symmetric peak of the polarization curve, where jm and Em are the coordinates of the peak maximum, which is reached at θ = 0.5 [65].
According to expressions (7) and (9), the adsorption energy can be expressed from the potential of the peak maximum as
Δ G a d s 0 R T = F R T E m + g 2
The peak parameters were fitted to the experimental values using the curve_fit function of the SciPy software package of the Python programming language (version 3.10, Python Software Foundation, Wilmington, DE, USA, 2021), which is an implementation of the nonlinear least squares method. The boundary and initial values, as well as the number of peaks, were determined sequentially starting from the most intense peak, with subsequent subtraction of the approximating peak and search for parameters for the next highest peak [65]. According to the report [23], the attraction constant was assumed to be negative, and the full width at half maximum (FWHM) was taken to be less than 90 mV.
The ESA value of the electrocatalyst samples was calculated from the obtained hydrogen adsorption peaks according to the equation
E S A   =   i Q H i Q 0 M P t
where Q H i is the hydrogen adsorption charge corresponding to the i-th peak, Q0 = 2.1 C/m2 is the hydrogen monolayer adsorption charge per unit surface area of polycrystalline platinum, and MPt is the mass of platinum in the electrocatalyst sample deposited on the electrode. Based on the ESA value, the size of spherical particles can be estimated from the expression
d = 6000 ρ P t   E S A
where ρPt is the density of platinum (ρPt = 21.45 g/cm3).

5. Conclusions

In the present work, we propose a method for screening electrocatalysts based on processing the hydrogen adsorption region of the CV by peak deconvolution using Frumkin isotherms. The predominant contribution of the platinum surface to the hydrogen adsorption region was well described by three peaks of the Frumkin isotherm corresponding to different crystal structures. For most samples, the peak contribution ratio to the ESA was about 3:1:1, and the hydrogen adsorption energy values were 8, 16, and 21 kJ mol−1, respectively. The grater deviation of these parameters was observed for the Pt black, which demonstrates the largest particles compared to other samples, and for the Pt20/RGO due to the presence of functional groups and defects on the RGO surface. The proposed method also allows for the evaluation of the primary degradation mechanisms in the AST process. The ESA drop for the Pt20/C and Pt40/C samples is more related to particle growth and CO adsorption; the hydrogen adsorption energy trend is determined by the surface reconstruction during oxygen adsorption. The electrocatalysts based on nanostructured carbon showed different behavior and 15–20% higher stability, which is explained by differences in metal-support interaction and the corrosion-resistant properties of these types of supports. However, for a more accurate determination of the predominant degradation mechanisms of electrocatalysts, additional methods of physical, electrochemical, and model analysis are needed.

Supplementary Materials

The following supporting information can be downloaded at: https://www.mdpi.com/article/10.3390/inorganics11030103/s1, Figure S1: Cyclic voltammograms (CVs) of Pt black (a), Pt40/C (b), Pt20/C (c), Pt20/RGO (d), Pt20/CNF (e) and Pt20/CNT (f), recorded after each 300 cycles of the AST in N2 saturated 0.5 M H2SO4; Figure S2: CVs hydrogen adsorption region and deconvoluted peaks of Pt black before (a) and after 3000 AST cycles (b); Table S1: Computed values of adsorption isotherm parameters of Pt black: Em—the peak position; FWHM—the peak full width at half maximum; g—the interaction constant; ΔGads0i—the hydrogen adsorption energy, corresponding to the i-th peak; ESAi—the contribution of the i-th peak to the ESA, Pi—the normalized contribution of the i-th peak to the ESA; Figure S3: Hydrogen adsorption peaks of Pt black before and after 3000 AST cycles. The current density is normalized to the corresponding total ESA; Figure S4: CVs hydrogen adsorption region and deconvoluted peaks of Pt40/C before (a) and after 3000 AST cycles (b); Table S2: Computed values of adsorption isotherm parameters of Pt40/C; Figure S5: Hydrogen adsorption peaks of Pt40/C before and after 3000 AST cycles. The current density is normalized to the corresponding total ESA; Figure S6: CVs hydrogen adsorption region and deconvoluted peaks of Pt20/C before (a) and after 3000 AST cycles (b); Table S3. Computed values of adsorption isotherm parameters of Pt20/C; Figure S7: Hydrogen adsorption peaks of Pt20/C before and after 3000 AST cycles. The current density is normalized to the corresponding total ESA; Figure S8: CVs hydrogen adsorption region and deconvoluted peaks of Pt20/RGO before (a) and after 3000 AST cycles (b); Table S4: Computed values of adsorption isotherm parameters of Pt20/RGO; Figure S9: Hydrogen adsorption peaks of Pt20/RGO before and after 3000 AST cycles. The current density is normalized to the corresponding total ESA; Figure S10: CVs hydrogen adsorption region and deconvoluted peaks of Pt20/CNF before (a) and after 3000 AST cycles (b); Table S5: Computed values of adsorption isotherm parameters of Pt20/CNF; Figure S11: Hydrogen adsorption peaks of Pt20/CNF before and after 3000 AST cycles. The current density is normalized to the corresponding total ESA; Figure S12. CVs hydrogen adsorption region and deconvoluted peaks of Pt20/CNT before (a) and after 3000 AST cycles (b); Table S6. Computed values of adsorption isotherm parameters of Pt20/CNT; Figure S13. Hydrogen adsorption peaks of Pt20/CNT before and after 3000 AST cycles. The current density is normalized to the corresponding total ESA.

Author Contributions

Conceptualization, N.A.I., R.M.M., D.D.S. and S.A.S.; methodology, R.M.M., N.A.I. and D.D.S.; software, R.M.M. and A.A.Z.; validation, N.A.I. and S.A.G.; investigation, R.M.M., D.D.S., N.A.I. and S.A.S.; resources, S.A.G.; writing—original draft preparation, R.M.M. and N.A.I.; writing—review and editing, R.M.M., N.A.I. and S.A.G.; visualization, D.D.S., A.A.Z., S.A.S. and R.M.M.; supervision, S.A.G.; project administration, S.A.G.; funding acquisition, S.A.G. All authors have read and agreed to the published version of the manuscript.

Funding

The investigation has been carried out within the framework of the project “Simulation of electrochemical characteristics of catalytic layers based on complex carbon nanostructures” with the support of a subvention from the National Research University “Moscow Power Engineering Institute” for the implementation of the internal research program “Priority 2030: Future Technologies” in 2022–2024.

Data Availability Statement

The data presented in this study are available on request from the corresponding author.

Conflicts of Interest

The authors declare no conflict of interest.

Abbreviations

AbbreviationMeaning
PEMPolymer electrolyte membrane
CNTsCarbon nanotubes
CNFsCarbon nanofibers
RGOReduced graphene oxide
ESAElectrochemical surface area
CVCyclic voltammogram
HERHydrogen evolution reaction
HORHydrogen oxidation reaction
ASTAccelerated stress testing
RHEReversible hydrogen electrode
FWHMFull width at half maximum

References

  1. Ishaq, H.; Dincer, I.; Crawford, C. A Review on Hydrogen Production and Utilization: Challenges and Opportunities. Int. J. Hydrogen Energy 2022, 47, 26238–26264. [Google Scholar] [CrossRef]
  2. Grigoriev, A.S.; Skorlygin, V.V.; Grigoriev, S.A.; Melnik, D.A.; Filimonov, M.N. A Hybrid Power Plant Based on Renewables and Electrochemical Energy Storage and Generation Systems for Decentralized Electricity Supply of the Northern Territories. Int. J. Electrochem. Sci 2018, 13, 1822–1830. [Google Scholar] [CrossRef]
  3. Borup, R.L.; Kusoglu, A.; Neyerlin, K.C.; Mukundan, R.; Ahluwalia, R.K.; Cullen, D.A.; More, K.L.; Weber, A.Z.; Myers, D.J. Recent Developments in Catalyst-Related PEM Fuel Cell Durability. Curr. Opin. Electrochem. 2020, 21, 192–200. [Google Scholar] [CrossRef]
  4. Mamat, M.S.; Grigoriev, S.A.; Dzhus, K.A.; Grant, D.M.; Walker, G.S. The Performance and Degradation of Pt Electrocatalysts on Novel Carbon Carriers for PEMFC Applications. Int. J. Hydrogen Energy 2010, 35, 7580–7587. [Google Scholar] [CrossRef]
  5. Mardle, P.; Ji, X.; Wu, J.; Guan, S.; Dong, H.; Du, S. Thin Film Electrodes from Pt Nanorods Supported on Aligned N-CNTs for Proton Exchange Membrane Fuel Cells. Appl. Catal. B Environ. 2020, 260, 118031. [Google Scholar] [CrossRef]
  6. Baranov, I.E.; Grigoriev, S.A.; Ylitalo, D.; Fateev, V.N.; Nikolaev, I.I. Transfer Processes in PEM Fuel Cell: Influence of Electrode Structure. Int. J. Hydrogen Energy 2006, 31, 203–210. [Google Scholar] [CrossRef]
  7. Mensharapov, R.M.; Ivanova, N.A.; Zasypkina, A.A.; Spasov, D.D.; Sinyakov, M.V.; Grigoriev, S.A.; Fateev, V.N. Model Study of CNT-Based PEMFCs’ Electrocatalytic Layers. Catalysts 2022, 12, 1227. [Google Scholar] [CrossRef]
  8. Venkataraman, A.; Amadi, E.V.; Chen, Y.; Papadopoulos, C. Carbon Nanotube Assembly and Integration for Applications. Nanoscale Res. Lett. 2019, 14, 220. [Google Scholar] [CrossRef]
  9. MoghadamEsfahani, R.A.; Vankova, S.K.; Easton, E.B.; Ebralidze, I.I.; Specchia, S. A Hybrid Pt/NbO/CNTs Catalyst with High Activity and Durability for Oxygen Reduction Reaction in PEMFC. Renew. Energy 2020, 154, 913–924. [Google Scholar] [CrossRef]
  10. Park, G.-G.; Sohn, Y.-J.; Yim, S.-D.; Yang, T.-H.; Yoon, Y.-G.; Lee, W.-Y.; Eguchi, K.; Kim, C.-S. Adoption of Nano-Materials for the Micro-Layer in Gas Diffusion Layers of PEMFCs. J. Power Sources 2006, 163, 113–118. [Google Scholar] [CrossRef]
  11. Kannan, A.M.; Munukutla, L. Carbon Nano-Chain and Carbon Nano-Fibers Based Gas Diffusion Layers for Proton Exchange Membrane Fuel Cells. J. Power Sources 2007, 167, 330–335. [Google Scholar] [CrossRef]
  12. Sharma, S.; Pollet, B.G. Support Materials for PEMFC and DMFC Electrocatalysts—A Review. J. Power Sources 2012, 208, 96–119. [Google Scholar] [CrossRef]
  13. Grigoriev, S.A.; Fateev, V.N.; Pushkarev, A.S.; Pushkareva, I.V.; Ivanova, N.A.; Kalinichenko, V.N.; Presnyakov, M.Y.; Wei, X. Reduced Graphene Oxide and Its Modifications as Catalyst Supports and Catalyst Layer Modifiers for PEMFC. Materials 2018, 11, 1405. [Google Scholar] [CrossRef] [PubMed] [Green Version]
  14. Shaari, N.; Kamarudin, S.K. Graphene in Electrocatalyst and Proton Conductiong Membrane in Fuel Cell Applications: An Overview. Renew. Sustain. Energy Rev. 2017, 69, 862–870. [Google Scholar] [CrossRef]
  15. Hsieh, C.-T.; Wei, J.-M.; Lin, J.-S.; Chen, W.-Y. Pulse Electrodeposition of Pt Nanocatalysts on Graphene-Based Electrodes for Proton Exchange Membrane Fuel Cells. Catal. Commun. 2011, 16, 220–224. [Google Scholar] [CrossRef]
  16. Hou, J.; Liu, Z.; Zhang, P. A New Method for Fabrication of Graphene/Polyaniline Nanocomplex Modified Microbial Fuel Cell Anodes. J. Power Sources 2013, 224, 139–144. [Google Scholar] [CrossRef]
  17. Mariani, M.; Latorrata, S.; Patrignani, S.; Stampino, P.G.; Dotelli, G. Characterization of Novel Graphene-Based Microporous Layers for Polymer Electrolyte Membrane Fuel Cells Operating under Low Humidity and High Temperature. Int. J. Hydrogen Energy 2020, 45, 7046–7058. [Google Scholar] [CrossRef]
  18. Han, T.H.; Mohapatra, D.; Mahato, N.; Parida, S.; Shim, J.H.; Nguyen, A.T.N.; Cho, M.H.; Shim, J.-J. Effect of Nitrogen Doping on the Catalytic Activity of Carbon Nano-Onions for the Oxygen Reduction Reaction in Microbial Fuel Cells. J. Ind. Eng. Chem. 2020, 81, 269–277. [Google Scholar] [CrossRef]
  19. Yeon, J.H.; Park, S.J.; Choi, I.; Choi, M. Generation of Carbon Nano-Onions by Laser Irradiation of Gaseous Hydrocarbons for High Durability Catalyst Support in Proton Exchange Membrane Fuel Cells. J. Ind. Eng. Chem. 2019, 80, 65–73. [Google Scholar] [CrossRef]
  20. Fu, X.; Hassan, F.M.; Zamani, P.; Jiang, G.; Higgins, D.C.; Choi, J.-Y.; Wang, X.; Xu, P.; Liu, Y.; Chen, Z. Engineered Architecture of Nitrogenous Graphene Encapsulating Porous Carbon with Nano-Channel Reactors Enhancing the PEM Fuel Cell Performance. Nano Energy 2017, 42, 249–256. [Google Scholar] [CrossRef]
  21. Zhu, J.; Xiao, M.; Song, P.; Fu, J.; Jin, Z.; Ma, L.; Ge, J.; Liu, C.; Chen, Z.; Xing, W. Highly Polarized Carbon Nano-Architecture as Robust Metal-Free Catalyst for Oxygen Reduction in Polymer Electrolyte Membrane Fuel Cells. Nano Energy 2018, 49, 23–30. [Google Scholar] [CrossRef]
  22. Morrow, B.H.; Striolo, A. Platinum Nanoparticles on Carbonaceous Materials: The Effect of Support Geometry on Nanoparticle Mobility, Morphology, and Melting. Nanotechnology 2008, 19, 195711. [Google Scholar] [CrossRef] [PubMed]
  23. Solla-Gullón, J.; Rodríguez, P.; Herrero, E.; Aldaz, A.; Feliu, J.M. Surface Characterization of Platinum Electrodes. Phys. Chem. Chem. Phys. 2008, 10, 1359–1373. [Google Scholar] [CrossRef] [PubMed]
  24. Hofman, M.S.; Wang, D.Z.; Yang, Y.; Koel, B.E. Interactions of Incident H Atoms with Metal Surfaces. Surf. Sci. Rep. 2018, 73, 153–189. [Google Scholar] [CrossRef]
  25. Pang, X.-Y.; Xue, L.-Q.; Wang, G.-C. Adsorption of Atoms on Cu Surfaces: A Density Functional Theory Study. Langmuir 2007, 23, 4910–4917. [Google Scholar] [CrossRef]
  26. Shi, Q.; Sun, R. Adsorption Manners of Hydrogen on Pt (1 0 0), (1 1 0) and (1 1 1) Surfaces at High Coverage. Comput. Theor. Chem. 2017, 1106, 43–49. [Google Scholar] [CrossRef]
  27. Ferrin, P.; Kandoi, S.; Nilekar, A.U.; Mavrikakis, M. Hydrogen Adsorption, Absorption and Diffusion on and in Transition Metal Surfaces: A DFT Study. Surf. Sci. 2012, 606, 679–689. [Google Scholar] [CrossRef]
  28. Gremaud, R.; Slaman, M.; Schreuders, H.; Dam, B.; Griessen, R. An Optical Method to Determine the Thermodynamics of Hydrogen Absorption and Desorption in Metals. Appl. Phys. Lett. 2007, 91, 231916. [Google Scholar] [CrossRef] [Green Version]
  29. Faglioni, F.; Goddard, W.A., III. Energetics of Hydrogen Coverage on Group VIII Transition Metal Surfaces and a Kinetic Model for Adsorption/Desorption. J. Chem. Phys. 2005, 122, 14704. [Google Scholar] [CrossRef] [Green Version]
  30. Zhai, F.; Li, Y.; Yang, Y.; Jiang, S.; Shen, X. Abnormal Subsurface Hydrogen Diffusion Behaviors in Heterogeneous Hydrogenation Reactions. J. Chem. Phys. 2018, 149, 174704. [Google Scholar] [CrossRef]
  31. Shen, X.; Chen, J.; Sun, Y.M.; Liang, T. Hydrogen Diffusion on Fe Surface and into Subsurface from First Principles. Surf. Sci. 2016, 654, 48–55. [Google Scholar] [CrossRef]
  32. Li, Y.; Zhai, F.; Xiao, Z.; Zhang, X.; Shen, X. Enhanced Diffusion and Permeation of Hydrogen Species on the Partially Carbon Covered Iron Surfaces. Appl. Surf. Sci. 2020, 515, 145899. [Google Scholar] [CrossRef]
  33. Weng, M.H.; Chen, H.-T.; Wang, Y.-C.; Ju, S.-P.; Chang, J.-G.; Lin, M.-C. Kinetics and Mechanisms for the Adsorption, Dissociation, and Diffusion of Hydrogen in Ni and Ni/YSZ Slabs: A DFT Study. Langmuir 2012, 28, 5596–5605. [Google Scholar] [CrossRef] [PubMed]
  34. Clavilier, J.; El Achi, K.; Rodes, A. In Situ Probing of Step and Terrace Sites on Pt (S)-[n (111) × (111)] Electrodes. Chem. Phys. 1990, 141, 1–14. [Google Scholar] [CrossRef]
  35. Nørskov, J.K.; Bligaard, T.; Logadottir, A.; Kitchin, J.R.; Chen, J.G.; Pandelov, S.; Stimming, U. Trends in the Exchange Current for Hydrogen Evolution. J. Electrochem. Soc. 2005, 152, J23. [Google Scholar] [CrossRef] [Green Version]
  36. Marković, N.M.; Schmidt, T.J.; Grgur, B.N.; Gasteiger, H.A.; Behm, R.J.; Ross, P.N. Effect of Temperature on Surface Processes at the Pt (111)—Liquid Interface: Hydrogen Adsorption, Oxide Formation, and CO Oxidation. J. Phys. Chem. B 1999, 103, 8568–8577. [Google Scholar] [CrossRef]
  37. Marković, N.M.; Grgur, B.N.; Ross, P.N. Temperature-Dependent Hydrogen Electrochemistry on Platinum Low-Index Single-Crystal Surfaces in Acid Solutions. J. Phys. Chem. B 1997, 101, 5405–5413. [Google Scholar] [CrossRef]
  38. Lasia, A. Modeling of Hydrogen Upd Isotherms. J. Electroanal. Chem. 2004, 562, 23–31. [Google Scholar] [CrossRef]
  39. Rodes, A.; El Achi, K.; Zamakhchari, M.A.; Clavilier, J. Hydrogen Probing of Step and Terrace Sites on Pt (S)-[n (111) × (100)]. J. Electroanal. Chem. Interfacial Electrochem. 1990, 284, 245–253. [Google Scholar] [CrossRef]
  40. Kowalczyk, P.; Savard, S.; Lasia, A. Determination of the Adsorption Energy Distribution Function of Upd Hydrogen on Monocrystalline Platinum. J. Electroanal. Chem. 2004, 574, 41–47. [Google Scholar] [CrossRef]
  41. Dwivedi, S. Graphene Based Electrodes for Hydrogen Fuel Cells: A Comprehensive Review. Int. J. Hydrogen Energy 2022, 47, 41848–41877. [Google Scholar] [CrossRef]
  42. Wu, J.; Yuan, X.Z.; Martin, J.J.; Wang, H.; Zhang, J.; Shen, J.; Wu, S.; Merida, W. A Review of PEM Fuel Cell Durability: Degradation Mechanisms and Mitigation Strategies. J. Power Sources 2008, 184, 104–119. [Google Scholar] [CrossRef]
  43. Gerasimova, I.; Belenov, S.; Lyanguzov, N.; Pankov, I.; Tolstunov, M.; Pavlets, A. Role of the Potential Range during Stress Testing of Platinum-Containing Electrocatalysts at Elevated Temperature. Catalysts 2022, 12, 1179. [Google Scholar] [CrossRef]
  44. Pushkareva, I.V.; Pushkarev, A.S.; Kalinichenko, V.N.; Chumakov, R.G.; Soloviev, M.A.; Liang, Y.; Millet, P.; Grigoriev, S.A. Reduced Graphene Oxide-Supported Pt-Based Catalysts for PEM Fuel Cells with Enhanced Activity and Stability. Catalysts 2021, 11, 256. [Google Scholar] [CrossRef]
  45. Liu, M.; Zhang, R.; Chen, W. Graphene-Supported Nanoelectrocatalysts for Fuel Cells: Synthesis, Properties, and Applications. Chem. Rev. 2014, 114, 5117–5160. [Google Scholar] [CrossRef]
  46. Rice, C.A.; Urchaga, P.; Pistono, A.O.; McFerrin, B.W.; McComb, B.T.; Hu, J. Platinum Dissolution in Fuel Cell Electrodes: Enhanced Degradation from Surface Area Assessment in Automotive Accelerated Stress Tests. J. Electrochem. Soc. 2015, 162, F1175–F1180. [Google Scholar] [CrossRef]
  47. Sharma, R.; Gyergyek, S.; Li, Q.; Andersen, S.M. Evolution of the Degradation Mechanisms with the Number of Stress Cycles during an Accelerated Stress Test of Carbon Supported Platinum Nanoparticles. J. Electroanal. Chem. 2019, 838, 82–88. [Google Scholar] [CrossRef]
  48. Kinoshita, K.; Lundquist, J.; Stonehart, P. Hydrogen Adsorption on High Surface Area Platinum Crystallites. J. Catal. 1973, 31, 325–334. [Google Scholar] [CrossRef]
  49. McCrum, I.T.; Bondue, C.J.; Koper, M.T. Hydrogen-Induced Step-Edge Roughening of Platinum Electrode Surfaces. J. Phys. Chem. Lett. 2019, 10, 6842–6849. [Google Scholar] [CrossRef]
  50. Diaz-Morales, O.; Hersbach, T.J.; Badan, C.; Garcia, A.C.; Koper, M.T. Hydrogen Adsorption on Nano-Structured Platinum Electrodes. Faraday Discuss. 2018, 210, 301–315. [Google Scholar] [CrossRef]
  51. Furuya, N.; Koide, S. Hydrogen Adsorption on Platinum Single-Crystal Surfaces. Surf. Sci. 1989, 220, 18–28. [Google Scholar] [CrossRef]
  52. Momma, K.; Izumi, F. VESTA 3 for Three-Dimensional Visualization of Crystal, Volumetric and Morphology Data. J. Appl. Crystallogr. 2011, 44, 1272–1276. [Google Scholar] [CrossRef]
  53. Santos, V.P.; Camara, G.A. Platinum Single Crystal Electrodes: Prediction of the Surface Structures of Low and High Miller Indexes Faces. Results Surf. Interfaces 2021, 3, 100006. [Google Scholar] [CrossRef]
  54. Søgaard, M.; Odgaard, M.; Skou, E.M. An Improved Method for the Determination of the Electrochemical Active Area of Porous Composite Platinum Electrodes. Solid State Ion. 2001, 145, 31–35. [Google Scholar] [CrossRef]
  55. Shao, M.; Peles, A.; Shoemaker, K. Electrocatalysis on Platinum Nanoparticles: Particle Size Effect on Oxygen Reduction Reaction Activity. Nano Lett. 2011, 11, 3714–3719. [Google Scholar] [CrossRef] [PubMed]
  56. Oudenhuijzen, M.K.; Bitter, J.H.; Koningsberger, D.C. The Nature of the Pt-H Bonding for Strongly and Weakly Bonded Hydrogen on Platinum. A XAFS Spectroscopy Study of the Pt- H Antibonding Shaperesonance and Pt-H EXAFS. J. Phys. Chem. B 2001, 105, 4616–4622. [Google Scholar] [CrossRef] [Green Version]
  57. Chaparro, A.M.; Martín, A.J.; Folgado, M.A.; Gallardo, B.; Daza, L. Comparative Analysis of the Electroactive Area of Pt/C PEMFC Electrodes in Liquid and Solid Polymer Contact by Underpotential Hydrogen Adsorption/Desorption. Int. J. Hydrogen Energy 2009, 34, 4838–4846. [Google Scholar] [CrossRef]
  58. Koper, M.T. Structure Sensitivity and Nanoscale Effects in Electrocatalysis. Nanoscale 2011, 3, 2054–2073. [Google Scholar] [CrossRef]
  59. Spasov, D.D.; Ivanova, N.A.; Pushkarev, A.S.; Pushkareva, I.V.; Presnyakova, N.N.; Chumakov, R.G.; Presnyakov, M.Y.; Grigoriev, S.A.; Fateev, V.N. On the Influence of Composition and Structure of Carbon-Supported Pt-SnO2 Hetero-Clusters onto Their Electrocatalytic Activity and Durability in PEMFC. Catalysts 2019, 9, 803. [Google Scholar] [CrossRef] [Green Version]
  60. Garsany, Y.; Singer, I.L.; Swider-Lyons, K.E. Impact of Film Drying Procedures on RDE Characterization of Pt/VC Electrocatalysts. J. Electroanal. Chem. 2011, 662, 396–406. [Google Scholar] [CrossRef]
  61. Garsany, Y.; Baturina, O.A.; Swider-Lyons, K.E.; Kocha, S.S. Experimental Methods for Quantifying the Activity of Platinum Electrocatalysts for the Oxygen Reduction Reaction. Anal. Chem. 2010, 82, 6321–6328. [Google Scholar] [CrossRef] [PubMed]
  62. Ivanova, N.A.; Alekseeva, O.K.; Fateev, V.N.; Shapir, B.L.; Spasov, D.D.; Nikitin, S.M.; Presnyakov, M.Y.; Kolobylina, N.N.; Soloviev, M.A.; Mikhalev, A.I. Activity and Durability of Electrocatalytic Layers with Low Platinum Loading Prepared by Magnetron Sputtering onto Gas Diffusion Electrodes. Int. J. Hydrogen Energy 2019, 44, 29529–29536. [Google Scholar] [CrossRef]
  63. Ivanova, N.A.; Spasov, D.D.; Zasypkina, A.A.; Alekseeva, O.K.; Kukueva, E.V.; Vorobyeva, E.A.; Kudinova, E.S.; Chumakov, R.G.; Millet, P.; Grigoriev, S.A. Comparison of the Performance and Durability of PEM Fuel Cells with Different Pt-Activated Microporous Layers. Int. J. Hydrogen Energy 2021, 46, 18093–18106. [Google Scholar] [CrossRef]
  64. Jerkiewicz, G. Hydrogen Sorption ATIN Electrodes. Prog. Surf. Sci. 1998, 57, 137–186. [Google Scholar] [CrossRef]
  65. Armand, D.; Clavilier, J. Quantitative Analysis of the Distribution of the Hydrogen Adsorption States at Platinum Surfaces: Part I. Application to Pt (100) in Sulphuric Acid Medium. J. Electroanal. Chem. Interfacial Electrochem. 1987, 225, 205–214. [Google Scholar] [CrossRef]
Figure 1. CVs of Pt black, 40 wt.%-Pt/C (Pt40/C), 20 wt.%-Pt/C (Pt20/C), 20 wt.%-Pt/CNT (Pt20/CNT), 20 wt.%-Pt/CNF (Pt20/CNF) and 20 wt.%-Pt/RGO (Pt20/RGO) recorded in N2-saturateted 0.5 M H2SO4 solution at the potential sweep rate of 20 mV/s. The current density of the double-layer region characterizes carbon support.
Inorganics 11 00103 g001
Figure 2. ESA values (a) and ESA drop (b) before and after 3000 AST cycles.
Inorganics 11 00103 g002
Figure 3. Pt40/C CV with the region of hydrogen adsorption fitted by three Frumkin isotherm peaks.
Inorganics 11 00103 g003
Figure 4. Crystal structure of a platinum nanoparticle [52].
Inorganics 11 00103 g004
Figure 5. Normalized ESA (a) and adsorption energy (b) corresponding to the adsorption peaks A1, A2, and A3.
Inorganics 11 00103 g005
Figure 6. Variation of the ESA and adsorption energy for peaks A1, A2, and A3 normalized to initial values with an increasing number of the AST cycles for the Pt black (a,d), Pt40/C (b,e), and Pt20/C (c,f) samples. The trends obtained characterize the stability of the electrocatalyst and changes in the structure of platinum nanoparticles during the AST cycles.
Inorganics 11 00103 g006
Figure 7. Variation of the ESA and adsorption energy for peaks A1, A2, and A3 normalized to initial values with an increasing number of the AST cycles for the Pt20/RGO (a,d), Pt20/CNF (b,e), and Pt20/CNT (c,f) samples. The trends obtained characterize the stability of the electrocatalysts based on complex carbon nanostructures and changes in the structure of platinum nanoparticles during the AST cycles.
Inorganics 11 00103 g007
Table 1. ESA and average particle size (d) of the electrocatalysts.
ElectrocatalystESA, m2 g–1d, nm
Pt black471.1
Pt40/C456.2
Pt20/C515.5
Pt20/CNT436.5
Pt20/CNF525.4
Pt20/RGO358.1
Disclaimer/Publisher’s Note: The statements, opinions and data contained in all publications are solely those of the individual author(s) and contributor(s) and not of MDPI and/or the editor(s). MDPI and/or the editor(s) disclaim responsibility for any injury to people or property resulting from any ideas, methods, instructions or products referred to in the content.

