Article

Operando CO Infrared Spectroscopy and On-Line Mass Spectrometry for Studying the Active Phase of IrO2 in the Catalytic CO Oxidation Reaction

1
Institute of Physical Chemistry, Justus Liebig University, Heinrich Buff Ring 17, 35392 Giessen, Germany
2
Center for Materials Research, Justus Liebig University, Heinrich-Buff-Ring 16, 35392 Giessen, Germany
*
Author to whom correspondence should be addressed.
Inorganics 2023, 11(3), 102; https://doi.org/10.3390/inorganics11030102
Submission received: 1 February 2023 / Revised: 21 February 2023 / Accepted: 27 February 2023 / Published: 28 February 2023
(This article belongs to the Special Issue Recent Advancements of Metal Oxide in Catalysis)

Abstract

:
We combine operando diffuse reflectance infrared Fourier transform spectroscopy (DRIFTS) with on-line mass spectrometry (MS) to study the correlation between the oxidation state of titania-supported IrO2 catalysts (IrO2@TiO2) and their catalytic activity in the prototypical CO oxidation reaction. Here, the stretching vibration of adsorbed COad serves as the probe. DRIFTS provides information on both surface and gas phase species. Partially reduced IrO2 is shown to be significantly more active than its fully oxidized counterpart, with onset and full conversion temperatures being about 50 °C lower for reduced IrO2. By operando DRIFTS, this increase in activity is traced to a partially reduced state of the catalysts, as evidenced by a broad IR band of adsorbed CO reaching from 2080 to 1800 cm−1.

1. Introduction

The controversial discussion over whether the (late) transition metal or its oxide constitutes the active phase in a catalytic oxidation reaction such as CO or methane oxidation is still ongoing and not yet settled. The most prominent catalytic systems where this fundamental question has been risen include ruthenium [1,2], palladium [3], iridium [4], and platinum [5]. Since the catalyst may dynamically adapt its chemical composition and structure to the actual reaction mixture [6], operando characterization methods are mandatory in catalysis research to study the catalytically active phase and to unveil potential reaction intermediates on the catalyst’s surface [7,8].
Infrared (IR) spectroscopy has been demonstrated to be a powerful technique in catalysis research for identifying reaction intermediates at the catalysts’ surface [9]. Employing a probe molecule, such as CO, infrared spectroscopy can also be used to probe the status and chemical nature of the active phase of the catalyst [10,11]. There are several benefits of using CO as a probe molecule in infrared spectroscopy [12,13], most notably the large cross section of CO for IR absorption and the convenient frequency range of around 2000 cm−1. The actual stretching frequency of the adsorbed CO depends sensitively on many parameters, including the adsorption site (coordination of CO), the local chemical environment, the coverage of CO, the occupation of d-orbitals of the active component, the oxidation state of the coordinated metal ions, and the electric field at the surface [14]. This renders CO a versatile probe molecule to explore the properties of the catalyst’s surface.
Reducible oxides [15] are particularly prone to reaction-induced changes in that they can transform between the metallic and the oxide phase depending on the specific reaction conditions. Here, we consider IrO2 supported on rutile TiO2, which has revealed high activity in the combustion of methane [16,17], propane [18], and CO [19,20]. However, even more important than in thermal catalysis may be the use of these materials in electrocatalysis, including the chlorine and oxygen evolution reaction [21,22,23,24,25].
In this report, diffuse reflectance infrared Fourier transform spectroscopy (DRIFTS) [26,27] is employed to elucidate the active phase of IrO2@TiO2 by utilizing CO as a probe molecule. In doing so, we first prepare fully oxidized and fully reduced catalysts whose DRIFT spectra serve as reference spectra for the subsequent interpretation of operando CO spectra acquired during CO oxidation - a well-documented model reaction for oxidation catalysis [28] - under various reaction conditions. It turns out that the partially reduced IrO2@TiO2 catalyst constitutes the most active catalyst in the CO oxidation reaction, regardless of whether the reaction takes place under reducing or oxidizing reaction conditions.

2. Experimental Details

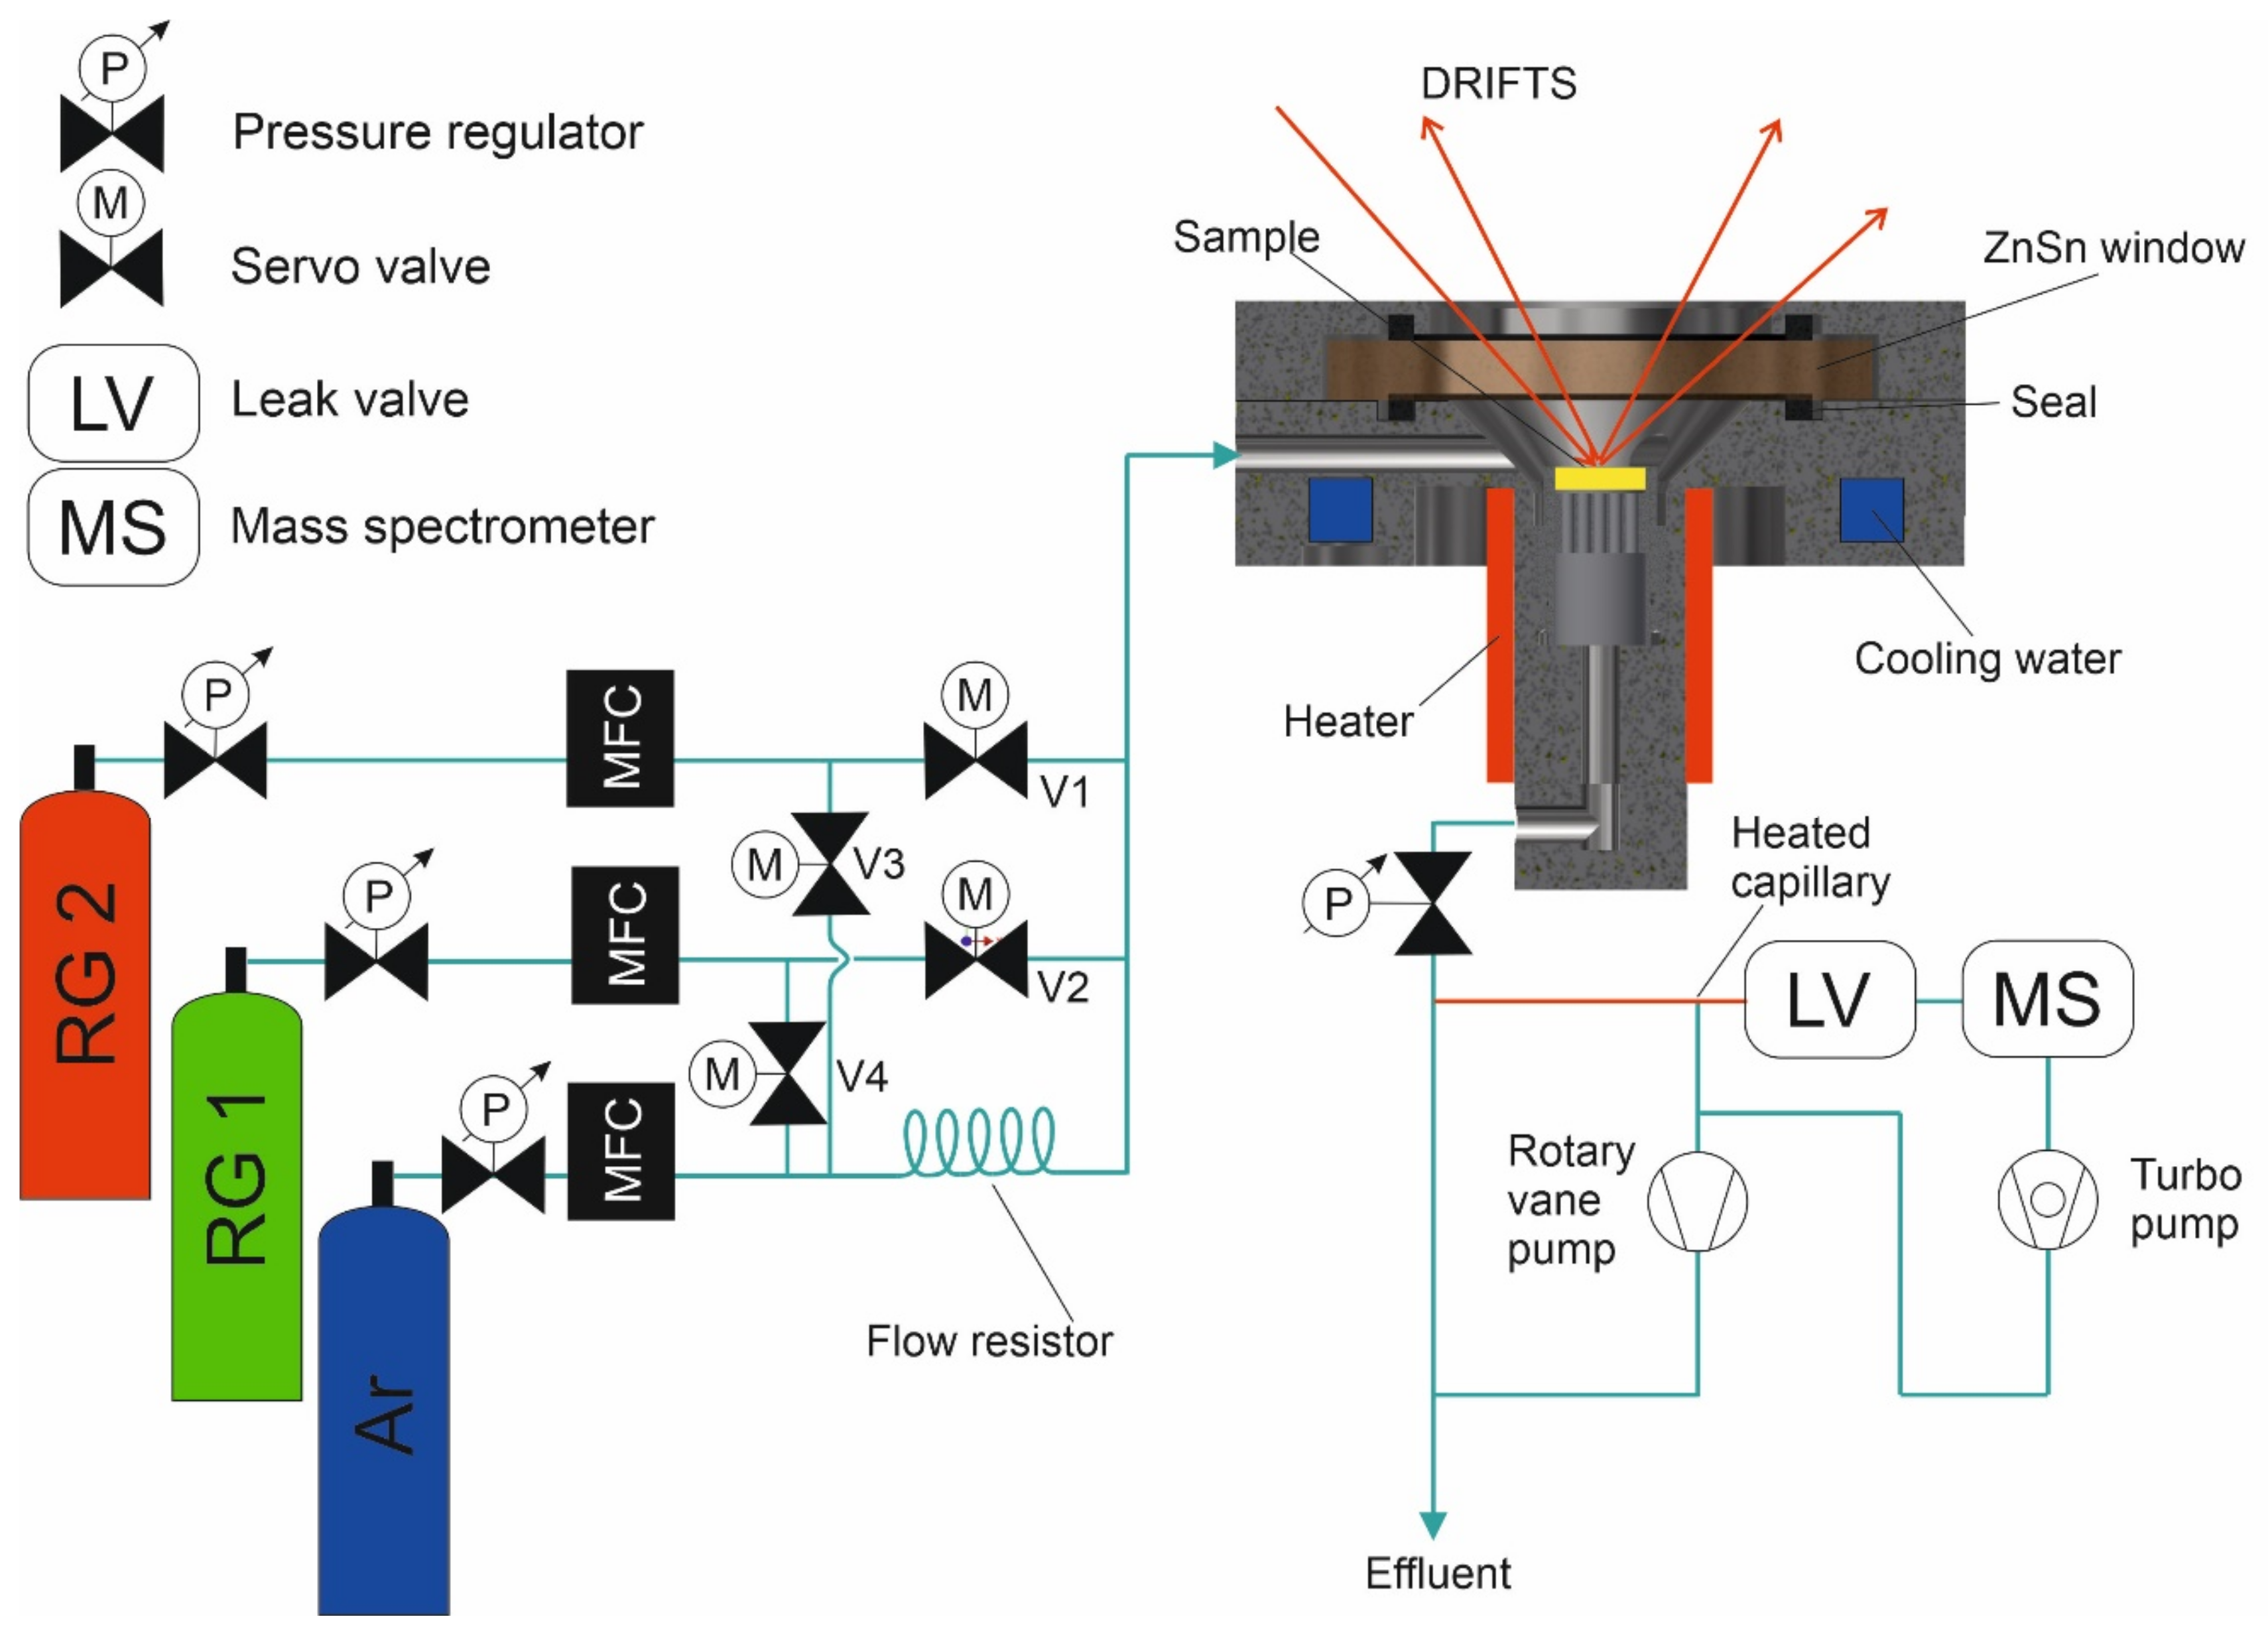
2.1. In Situ DRIFTS Cell

For the present study we constructed a new high-pressure reactor setup that is integrated into an in situ diffuse reflectance infrared Fourier transform spectrometer (spectrometer: Bruker Vertex 70v Sample; sample chamber module: Pike DiffIR) and connected to a mass spectrometer, as depicted in Figure 1.
The DRIFTS apparatus comprises four sections: gas supply, reactor cell, optics, and gas analytics. In the gas supply part (left side of Figure 1), the gas bottles are attached to mass flow controllers (MFCs) through pressure regulators. The MFCs are connected to a network of tubes and servo valves, which are used to flush the gas supply lines when switching gases during a measurement. While a reactive gas (RG) is in use, the respective horizontal shut-off valve (V1/V2) is open and the corresponding vertical flush valve (V3/V4) is closed. In this way the carrier gas goes through the flow resistor and mixes with the reactive gas at the T-junction. If a reactive gas is to be shut off, first the MFC is closed and subsequently the flush valve is opened. Due to the flow resistance, the carrier gas now mainly flows through the RG line, removing any residual reactive gas. After 15 s, both the horizontal (V1/V2) and the vertical (V3/V4) valves are closed and the reactor can resume normal operation. Without this flush system, purging the reactive gas line to below the mass spectrometer (MS) detection limit can take up to 2 h.
The reactor cell itself is made from 1.4742 Ni-free steel, as Ni-containing steel itself is a CO oxidation catalyst and readily forms Ni carbonyls that can be deposited on the catalyst bed, thus affecting its activity. If CO is used as the reactant, a nickel carbonyl trap consisting of heated copper tubing is connected between the gas bottle and the MFC. The cell is designed in a way that the dead volume is minimized, facilitating rapid gas exchange. The cell consists of a conical chamber and three gas inlets separated by 120° from each other. On top of the chamber, a ZnSe window is tightened with a metal ring and Viton seals. At the bottom of the cell, the sample cup is screwed into the shaft. On the outside of this shaft, a 300 W heater is placed. To protect the seals and window from high temperatures, the outer part of the cell has a channel connected to a water cooling system. The gas outlet is located at the lower end of the shaft, behind which an overpressure valve can be placed, enabling pressurization of the reactor up to 20 bar.
The path of the IR light from the spectrometer as well as the temperature measurement via pyrometer (B+B DM501) are illustrated in Figure S1. The pyrometer measures the temperature of the sample through the intensity of thermal radiation with a wavenumber around 4350 cm−1. To ensure accurate measurements, no light from the globar should reach the pyrometer. This is accomplished by a long-pass filter behind the globar and a short-pass filter in front of the pyrometer, both with an absorption edge at 4350 cm−1. The pyrometer is calibrated by heating the sample in the reactor with a thermocouple placed inside the catalyst bed. To make sure that the thermal radiation of the sample does not overload the mercury cadmium telluride detector, an iris aperture and a band-pass filter are placed in front of it. At the exit of the reactor cell, the effluent gas is analyzed by a quadrupole mass spectrometer (QMS, Pfeiffer QMG220). The transfer of some of the effluent stream to a T-junction is achieved by a heated steel capillary, which is evacuated by a rotary vane pump, enabling a quick gas exchange in the junction. Also attached to this junction is a leak valve that allows the introduction of a minor portion of the effluent gas to a UHV system containing the QMS. The time delay of the MS signal and the MFC gas flow is indicated in Figure S2. When the MFC gas flow is switched on, a short spike in flow is created due to the pressure build-up behind the servo valve (compare Figure S2). After 45 s, a steady state is reached in the MS signal. When the gas is switched off and flushed, it takes 40 s for all gases to be removed from the system, reaching the background intensity of the MS signal. The conversion is calculated by normalizing the CO2 signal (m/z = 44) by its maximum value (at full conversion). The point of full conversion is determined by the full consumption of O2 (for reducing conditions) or CO (for oxidizing conditions). In the latter case, some CO will always remain in the MS spectrum, due to the cracking pattern of CO2. Here, full conversion is assumed, when no further decrease in m/z = 28 and no further increase in m/z = 44 is observed with increasing temperature.
Details on the data treatment of the DRIFT spectra can be found under Figure S3.

2.2. Sample Preparation and Characterization

In DRIFTS experiments, samples with high absorbance in the investigated spectral range are commonly mixed with a reflective powder matrix. Similar to dilution in the IR spectroscopy of solutions, this serves the purpose that the light, scattered in the powder bed, has a shorter path through the absorbing medium before being reflected back. However, when mixing two powders, agglomerates of the respective components remain in the mixture. Harsh mixing methods like ball milling might reduce the amount of agglomerates, but bear the possibility of changing the sample by mechanochemistry. If light enters such an agglomerate it will likely be absorbed inside the agglomerate. To overcome this issue, we decided to prepare IrO2 supported on rutile TiO2 by a modified Pechini synthesis, as described by Khalid et al. [16]. The samples used here were prepared with a lower loading of 2 mol%, as higher loadings are not reflective enough for DRIFTS measurements. Pechini constitutes a variant of sol–gel synthesis. Here, the metal ions are dissolved in water. In our case, IrCl4 hydrate, purchased from fluorochem, was used. After complete dissolution the rutile TiO2 support (particle size <100 nm), purchased from Sigma Aldrich (St. Louis, MO, USA), was added. The use of rutile TiO2 ensures a high dispersion of rutile IrO2 as indicated by previous studies [16,29,30]. Then a 100-times stoichiometric excess of citric acid, relative to the metal ions, is added to form a chelate complex of the metal ions and the citric acid. This solution is heated to 60 °C for 30 min to ensure complete dissolution and complexation. Afterward, three times the molar amount (relative to citric acid) of ethylene glycol is added. The resulting solution is then heated with maximum heating power to induce polymerization/polycondensation. Here, the carboxylic acid groups of the citric acid/metal ion complexes and the alcohol groups of the ethylene glycol form ester bonds, resulting in a 3D carbon network. In this network, the rutile TiO2 particles are trapped and surrounded by metal ion complexes. Heating is continued until the solvent evaporates, after which the resulting gel is calcined at 450 °C for 7 h in air. During calcination the metal ions can nucleate directly on the rutile TiO2. This preparation ensures a homogeneous dispersion of the IR absorbing, catalytically active oxides on the reflective TiO2 matrix. Similar samples were thoroughly characterized by Raman spectroscopy, X-ray diffraction (XRD), and transmission electron microscopy (TEM) by Khalid et al. [16] Due to the lower loadings employed in this study, Raman spectroscopy and XRD could not be carried out on the specific samples used here. The reason for this is that the detection limits of these techniques are too low and/or the signals of IrO2 are overshadowed by TiO2. TEM images of the pure TiO2 support and 2 mol% supported IrO2 on TiO2 are shown in Figure S4.
The 2 mol% supported IrO2 on TiO2 samples obtained from the Pechini synthesis were first thermally oxidized or reduced by exposing the sample to 4% O2 or to 4% CO at 300 °C, respectively. These samples are referred to as IrO2@TiO2 or reduced IrO2@TiO2. To assign the DRIFTS CO bands of IrO2@TiO2 under reaction conditions, it is necessary to compare them with reference DRIFT spectra of purely metallic Ir and purely oxidic IrO2 samples.
When used to prepare high loadings, the Pechini synthesis tends to produce oxide particles with a metal core [31,32,33,34]. This is due to the reducing effect of the carbon matrix in the gel on the particles formed in the early stages of calcination. This effect, however, diminishes when preparing small loadings like the 2 mol% IrO2 employed in this work. Most likely, the first particles form later in the calcination process when the metal ion concentration is lower. Therefore, pure IrO2 supported on rutile TiO2 can be prepared by the Pechini synthesis approach, as evidenced by the X-ray photoelectron spectroscopy (XPS) data depicted in Figure 2A. For the XPS characterization, a PHI VersaProbe IV instrument is employed. The measurements are conducted with a photon energy of 1486.6 eV (Al Kα line).
Quite in contrast, the full reduction of IrO2@TiO2 to metallic Ir does not seem to be possible, as can be seen in Figure S5. Therefore, 33 w% of commercially available Ir metal powder (abcr GmbH) was physically mixed with TiO2 as a matrix to collect CO adsorption signals of pure metallic samples (these samples are referred to as Ir0 + TiO2). After reductive pretreatment for 4 h at 300 °C under 4% CO, the XPS indicates pure Ir metal (cf. Figure 2C) without any traces of IrO2-related spectral features.
Figure 2B,D show XP spectra of Ir0 + TiO2 and IrO2@TiO2 after being exposed to reducing CO oxidation conditions (1% O2/4% CO/95% Ar) at 300 °C. Here, the XP spectra show metal and oxide signals for Ir0 + TiO2 und IrO2@TiO2, thus evidencing a partially oxidized and reduced state, respectively. Raman spectra of Ir0 before and after the same pretreatment (Figure S6) indicate clear signatures of IrO2.

2.3. Reaction Conditions

All experiments are conducted under a total flow of 50 sccm and a heating ramp of 1.8 K∙min−1. The gas compositions for the various reaction conditions are compiled in Table 1.
The ratio of reactive gas to carrier gas had to be varied during the CO oxidation case study, due to limitations in the MFC minimum flow and trying to keep concentration of the reactants as small as possible in order to minimize temperature variations induced by the heat of reaction.

3. Experimental Results

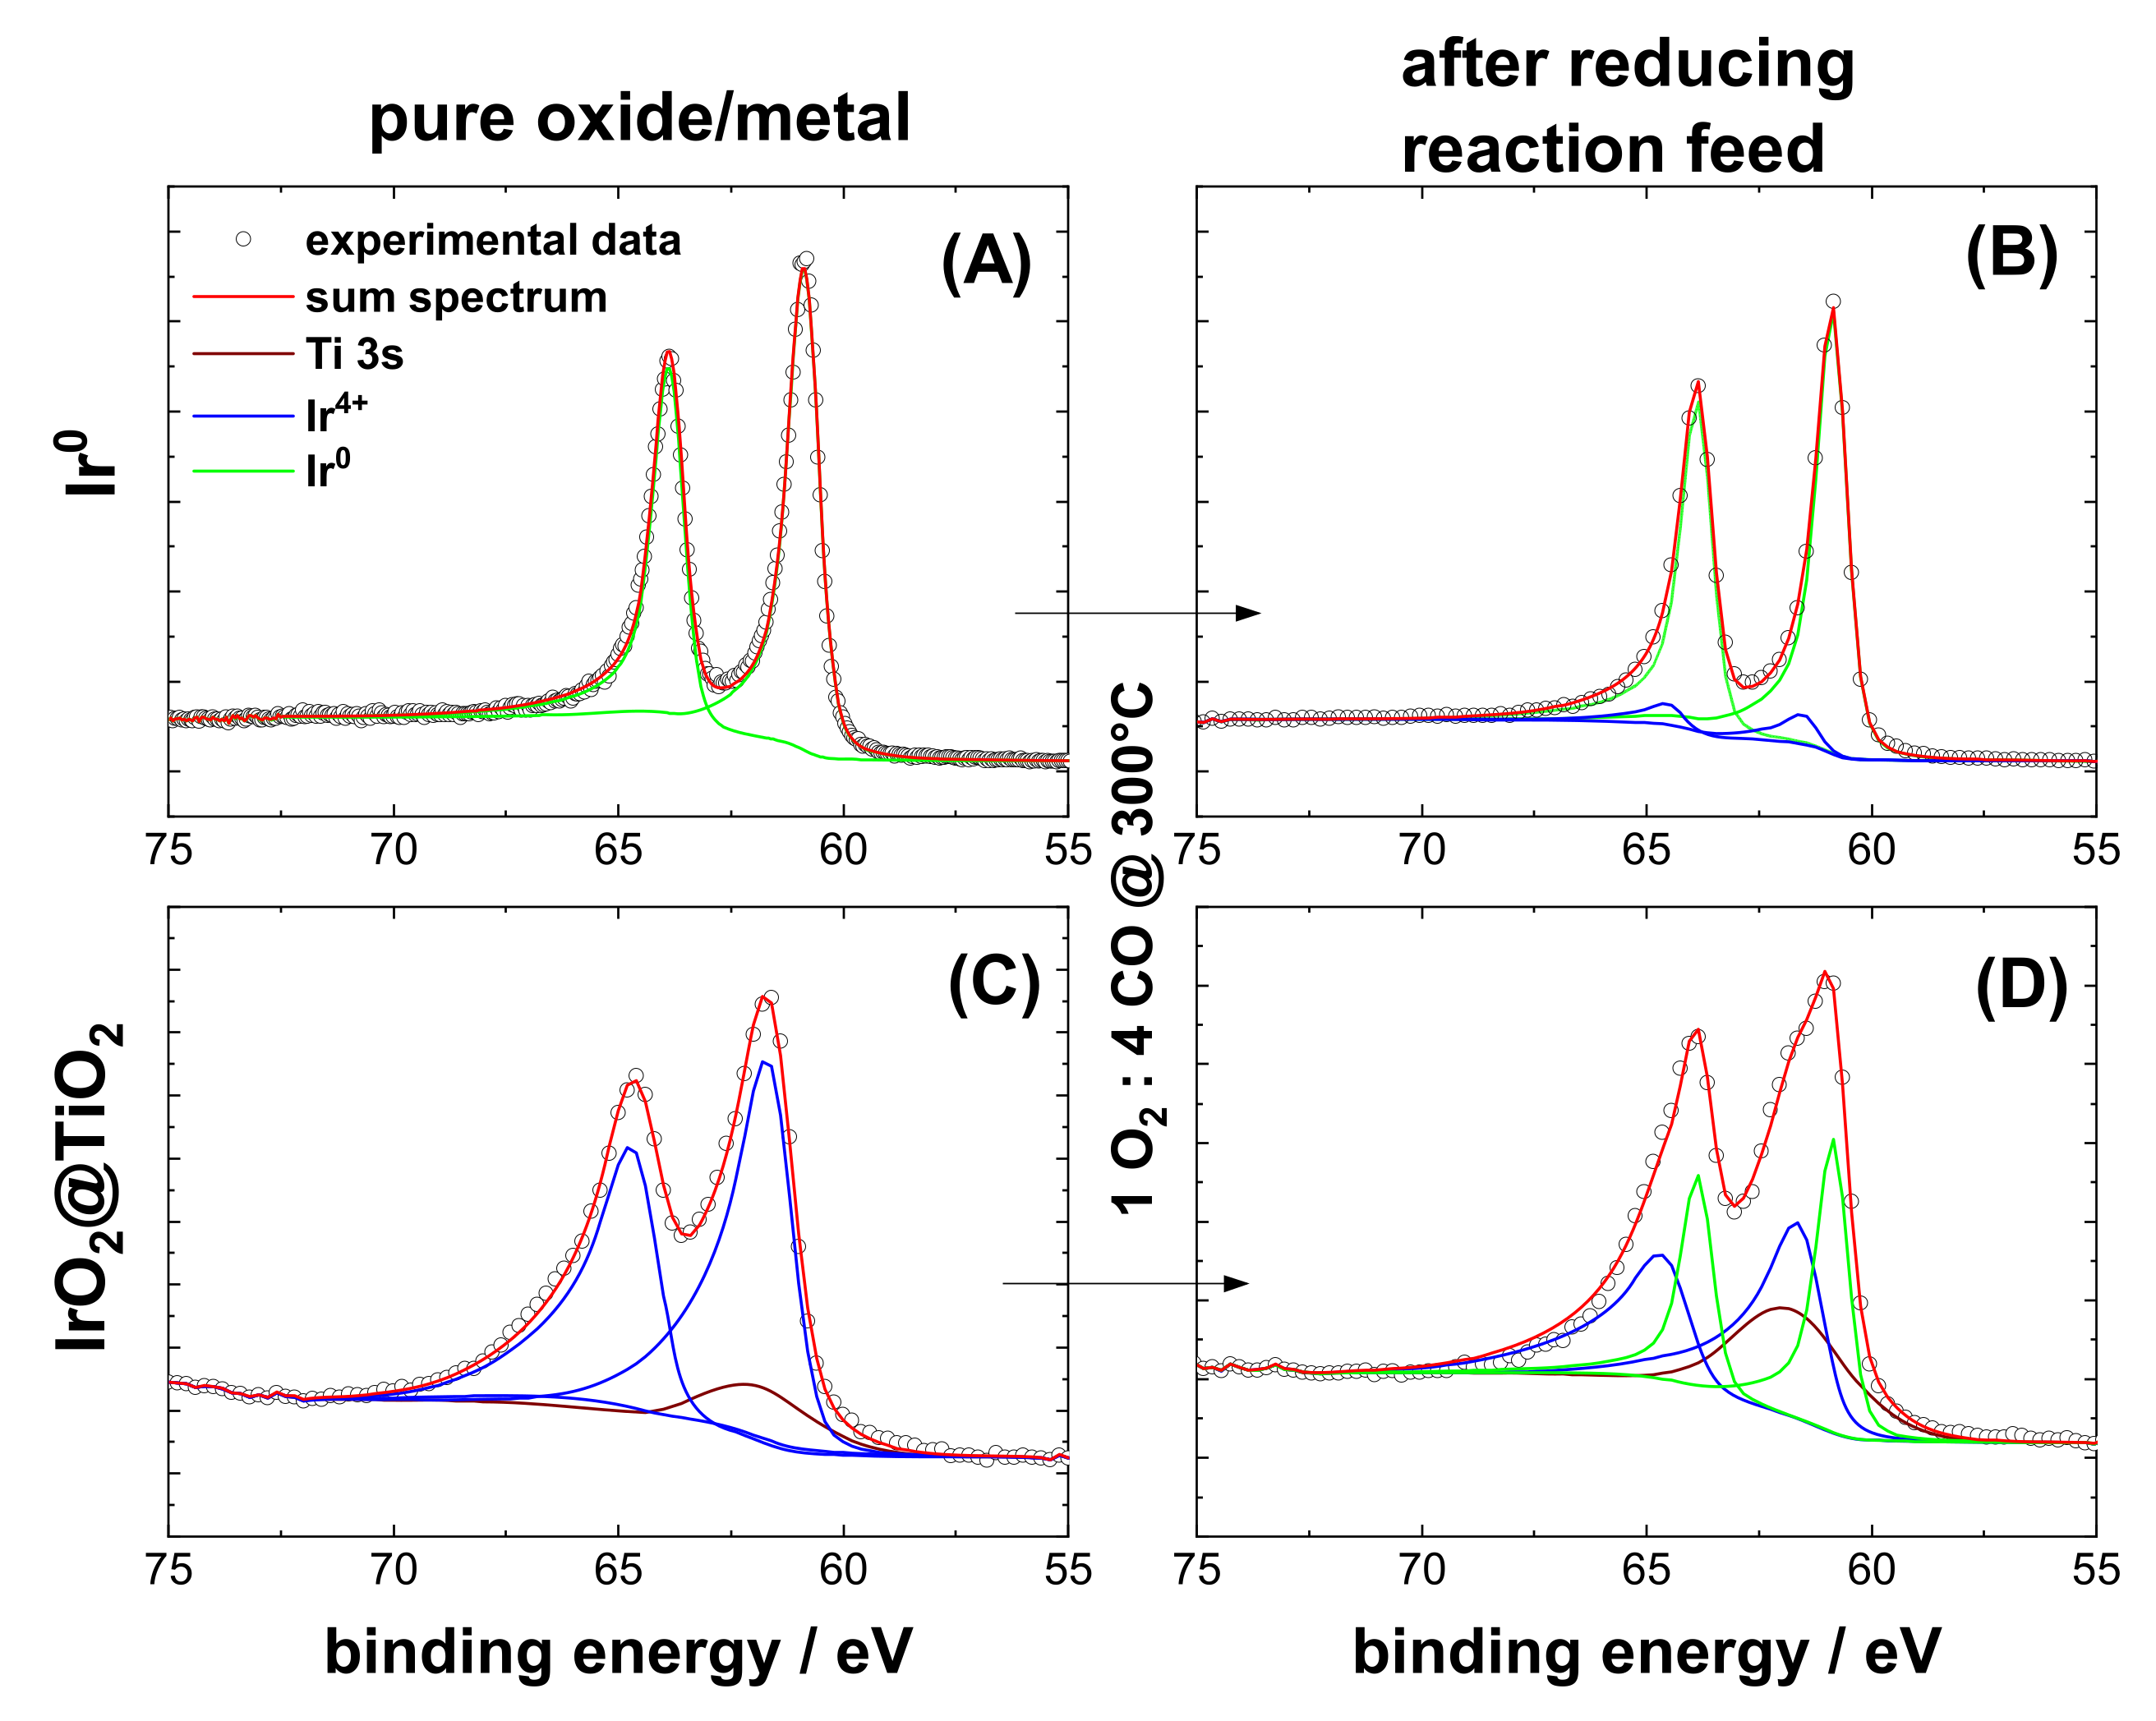
3.1. Characterization of Pre-Oxidized and Pre-Reduced IrO2@TiO2 and Ir0 + TiO2 Samples

The XP spectra in the Ir 4f binding energy region of the IrO2@TiO2 and Ir0 + TiO2 samples are summarized in Figure 2A,C. The fit parameters used can be found in the literature [35,36,37,38] and in Table S1. According to the Ir 4f spectrum in Figure 2C, iridium is fully oxidized in the case of IrO2@TiO2. Additionally, the spectrum shows a small signal of Ti 3s stemming from the TiO2 support. Attempts to reduce IrO2@TiO2 are made, with the harshest reduction conditions being 4% H2 at 600 °C for 24 h. It is, however, not possible to produce pure metallic particles, as shown by the XP spectra in Figure S5. The spectra of the mixture of Ir0 + TiO2 are dominated by the Ti 3s signal so heavily that a meaningful deconvolution is not possible, therefore the pure Ir0 powder was used instead for XPS analysis. Here the Ir 4f XP spectrum shows pure metallic Ir0. Under reducing CO oxidation conditions (1% O2/4% CO/95% Ar), the XP spectra of Ir0 + TiO2 and IrO2@TiO2 in Figure 2B,D, respectively, indicate spectral features of both metallic and oxidic Ir. For Ir0 + TiO2 this effect seems to be less pronounced than for IrO2@TiO2, which is likely due to the large size of the Ir0 particles that can only be oxidized at the surface, so that the XPS signal is dominated by the bulk metal signal.

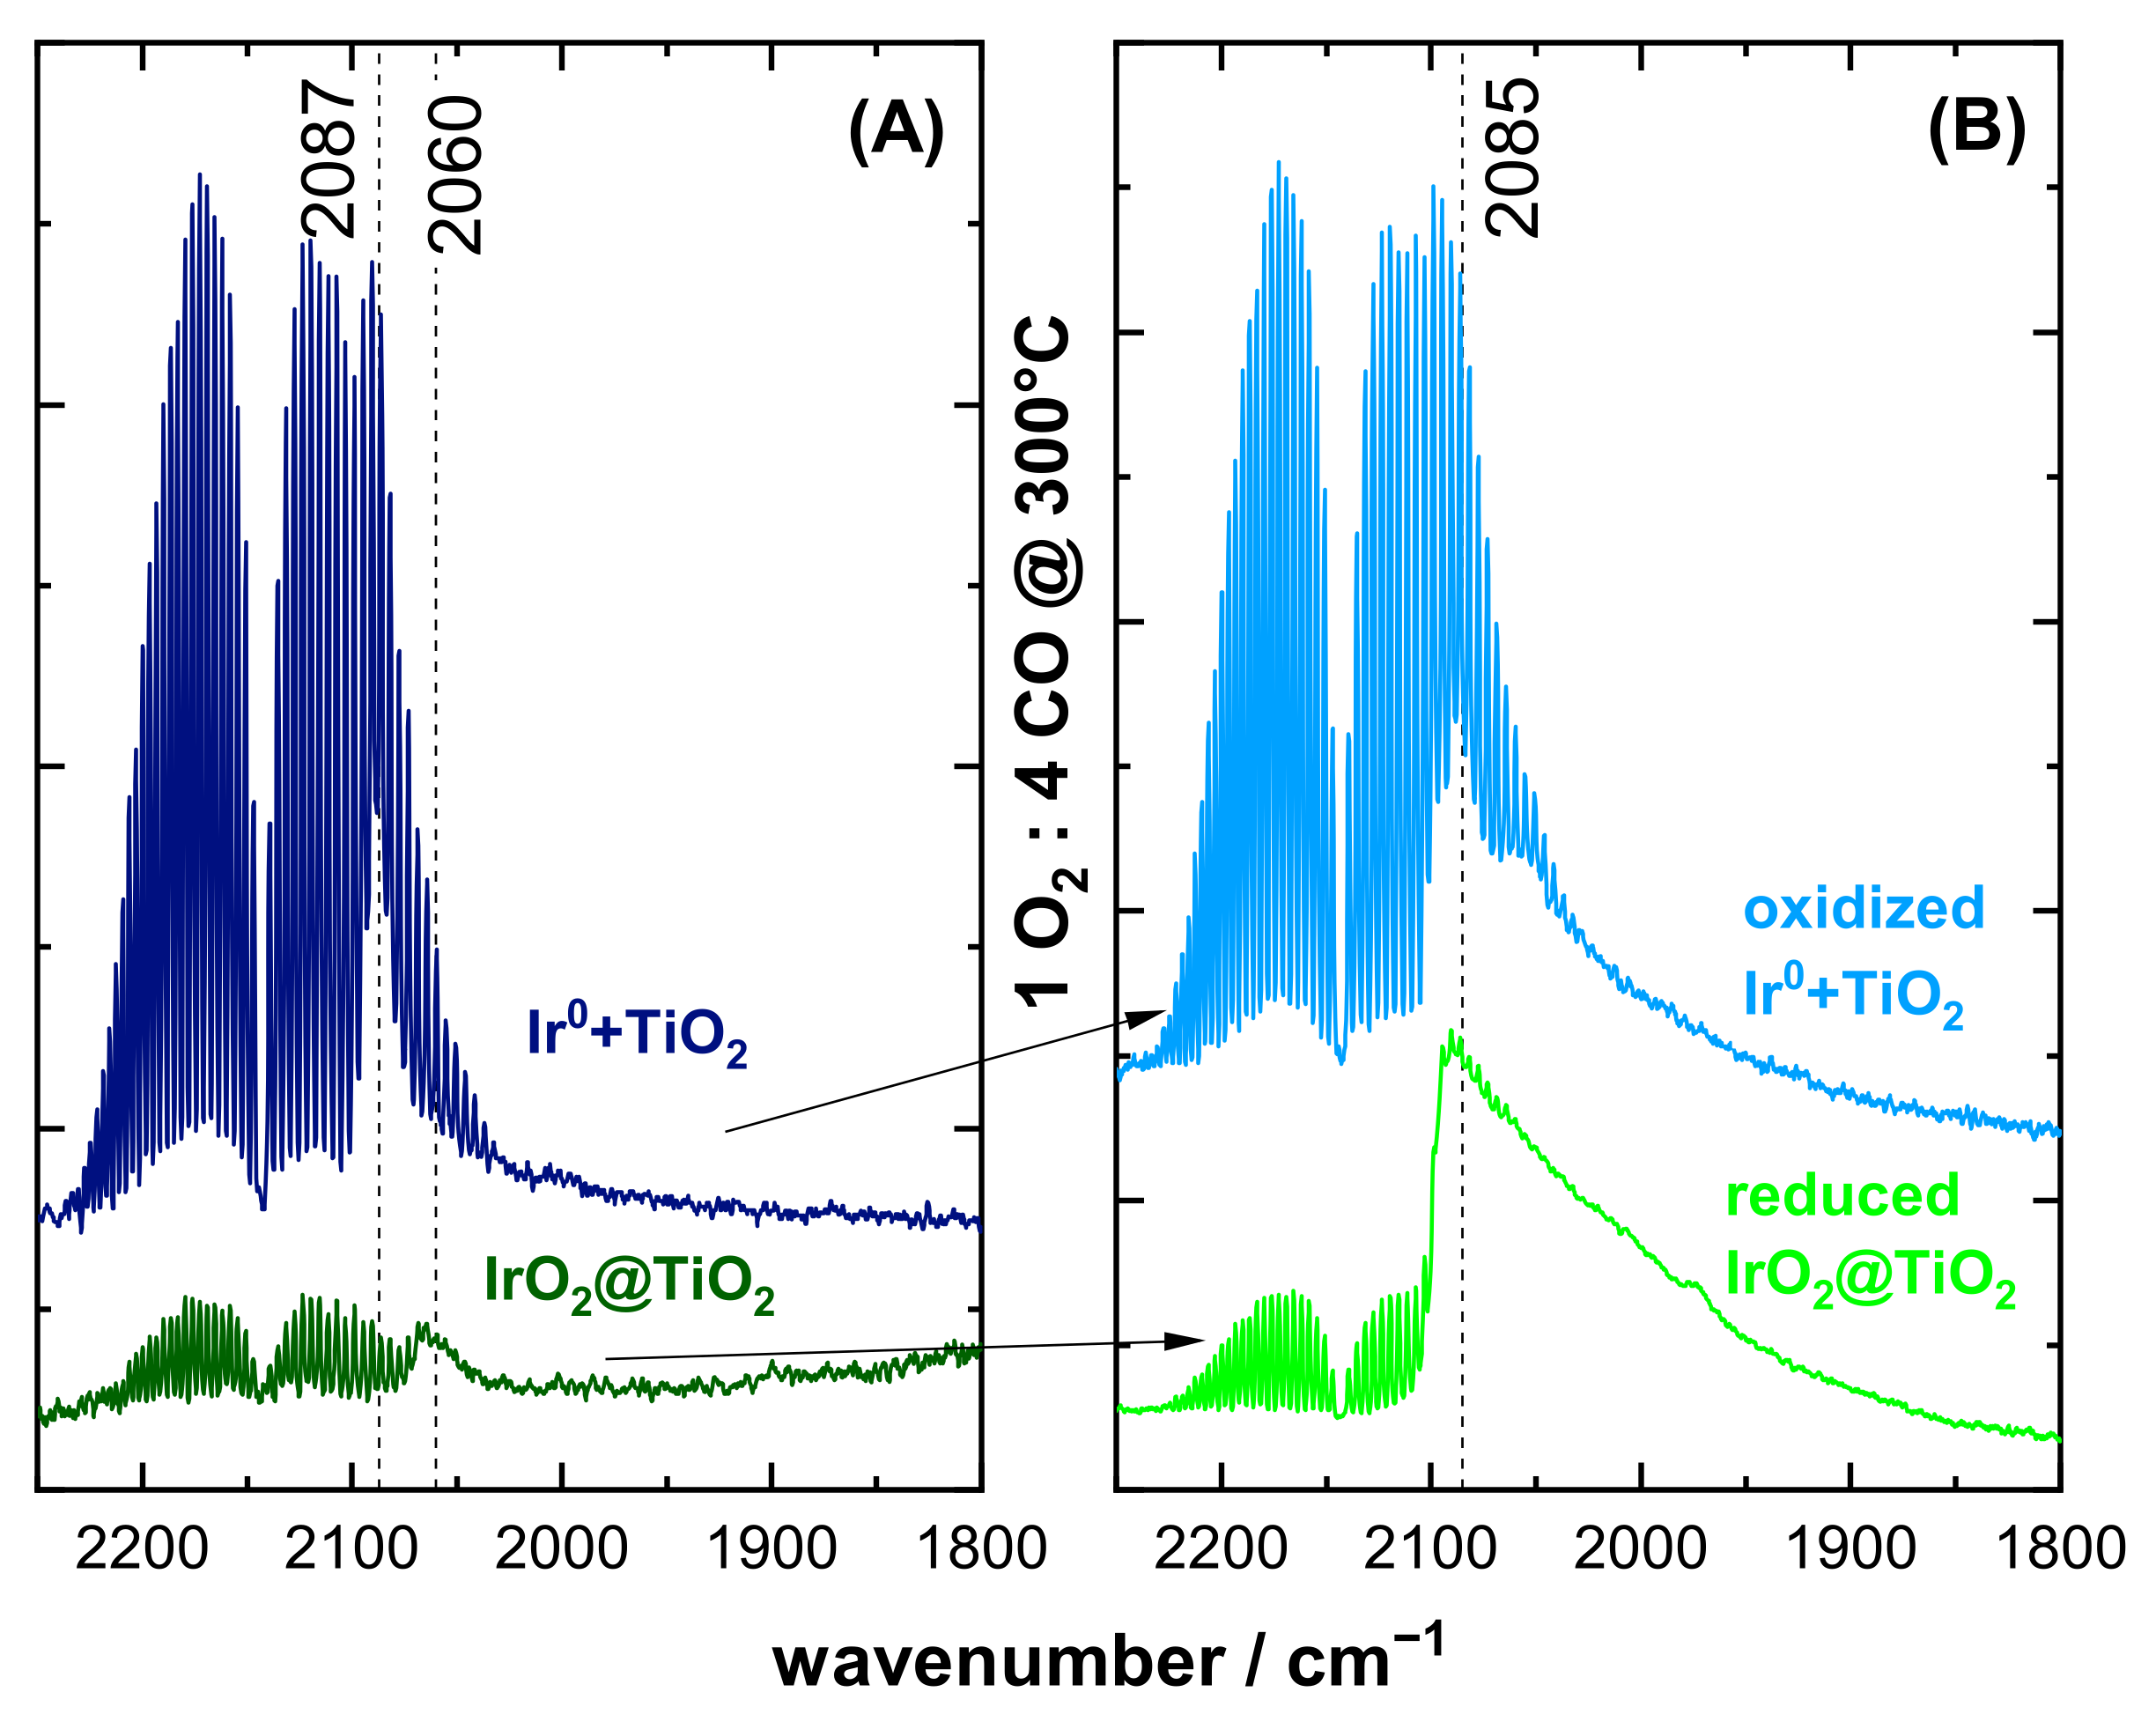
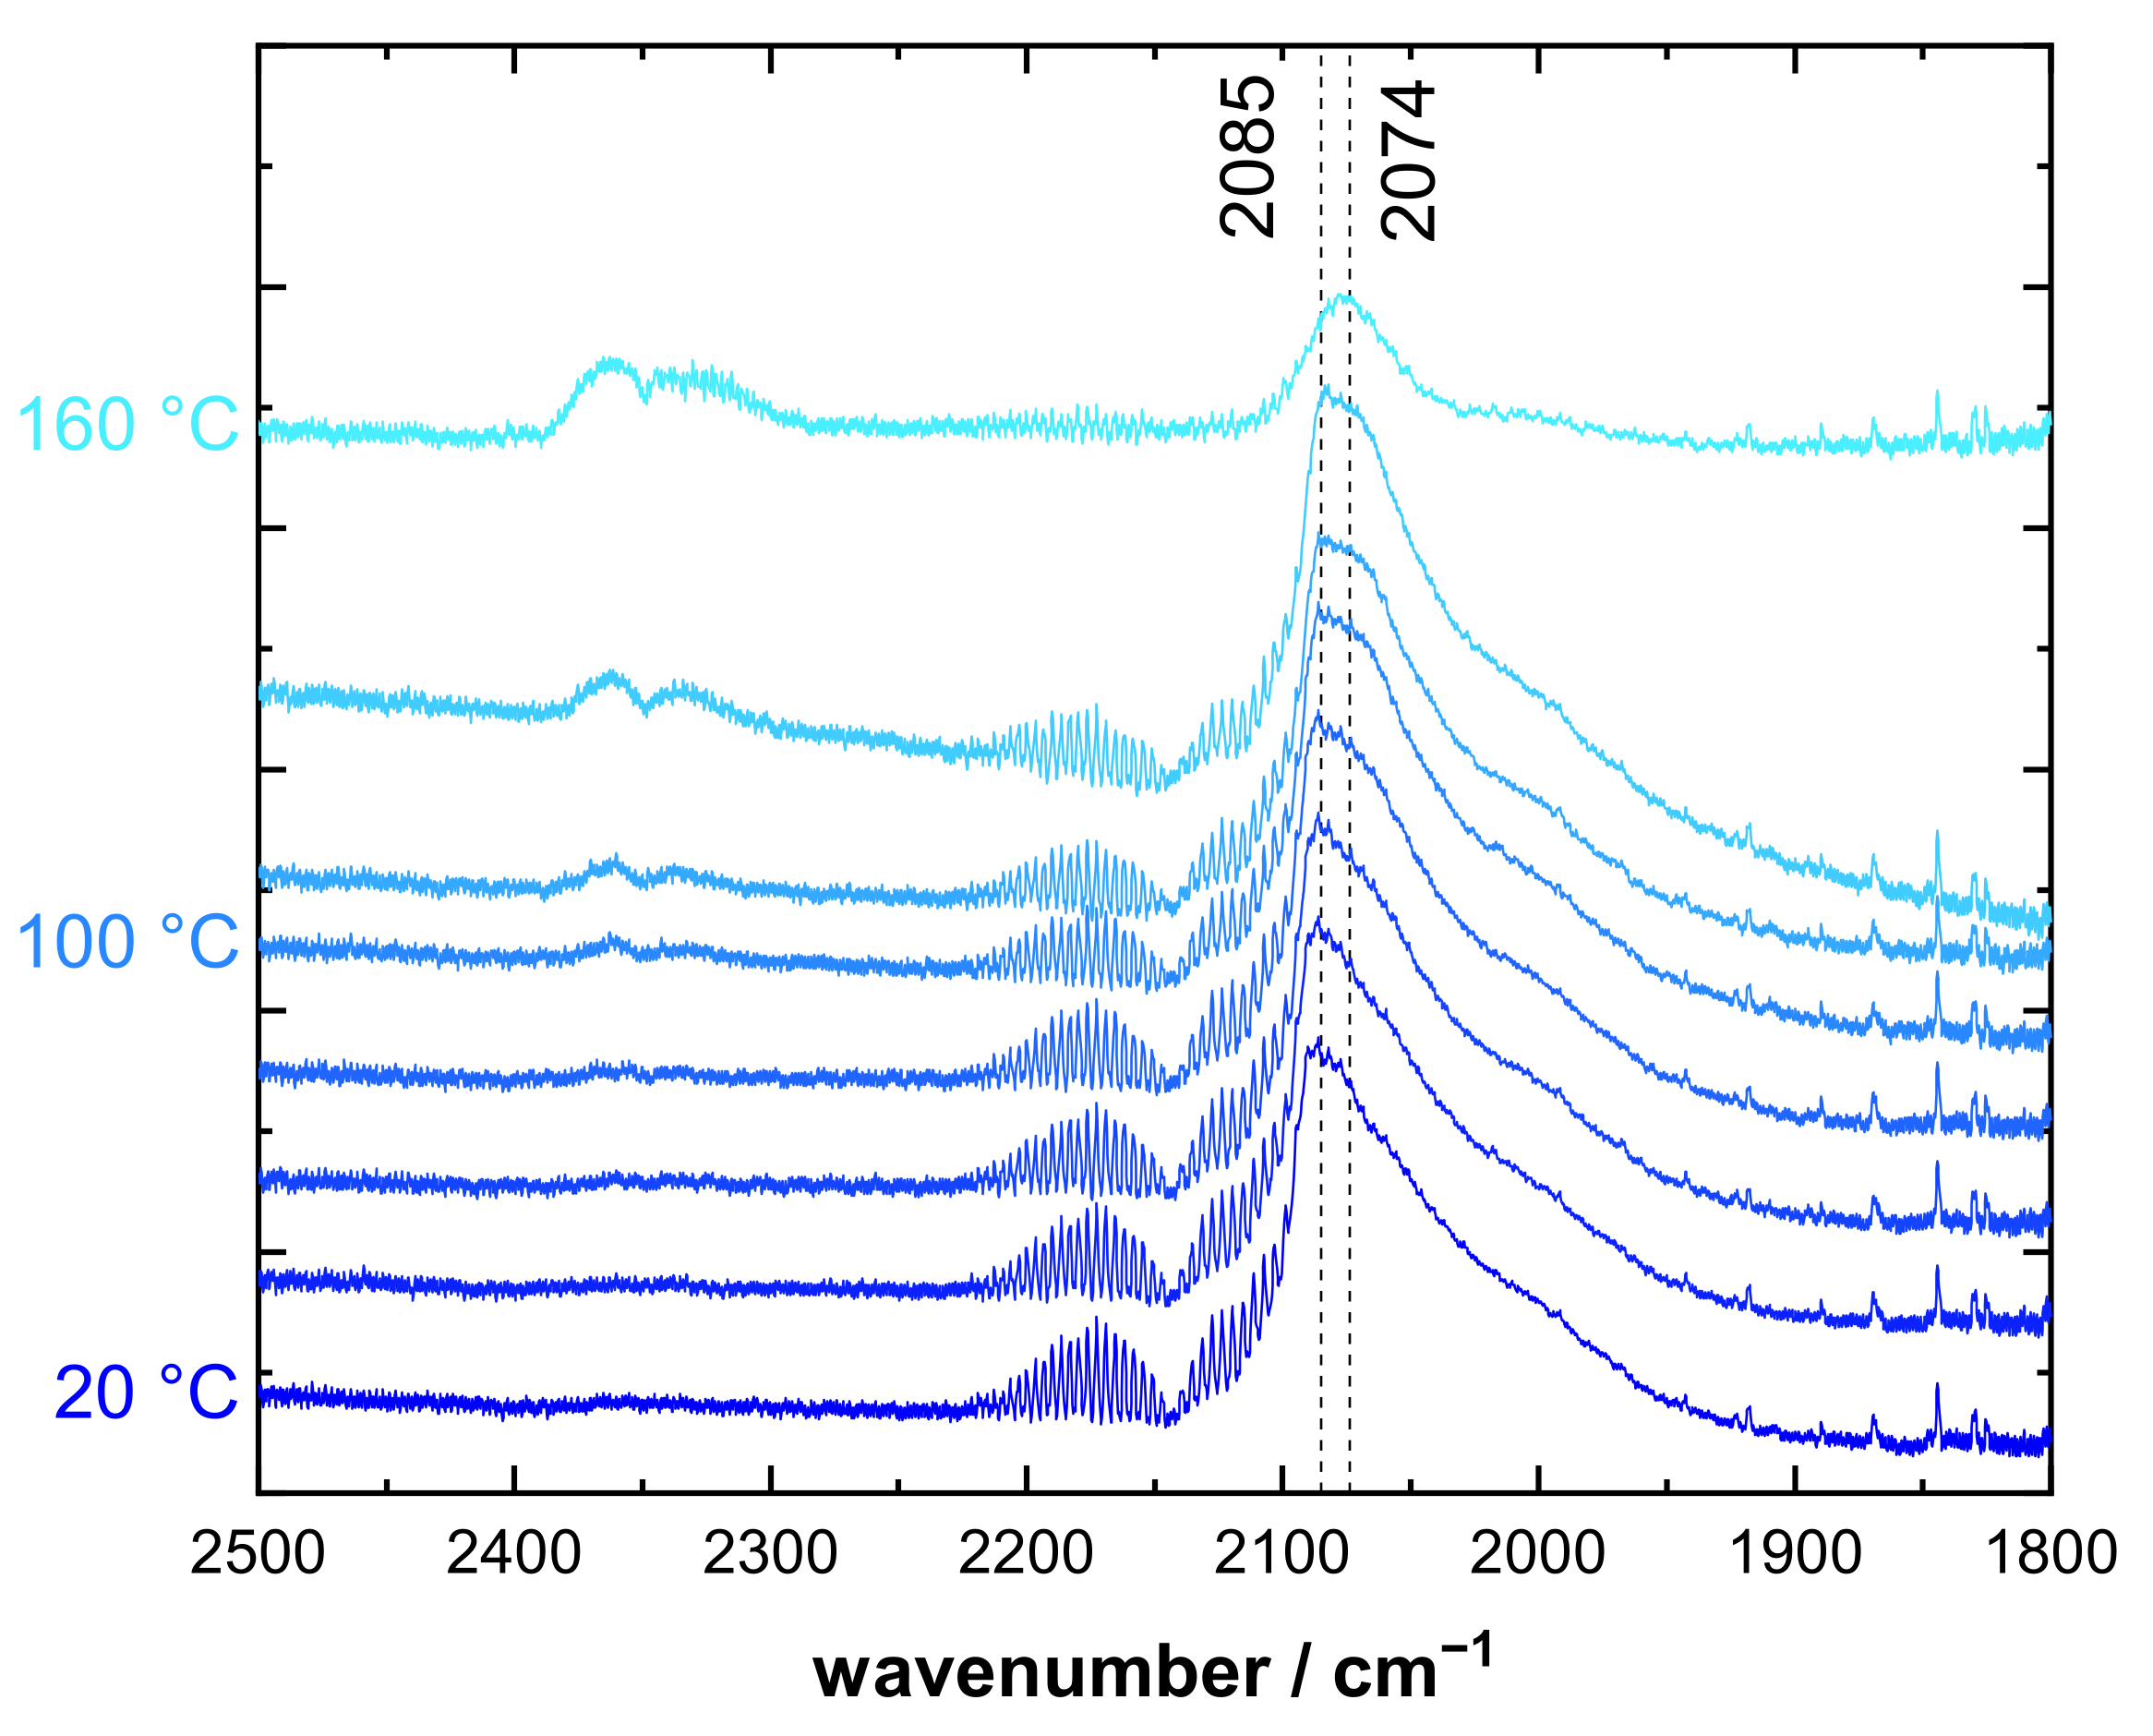
3.2. CO DRIFTS Experiments of Oxidized and Reduced IrO2@TiO2 and Ir0 + TiO2 Samples

Figure 3A shows the CO DRIFT spectra of IrO2@TiO2 and Ir0 + TiO2. As the samples consist of pure IrO2 and pure metal Ir0, as demonstrated by the XPS, the DRIFT data serve as benchmark spectra to firmly assign characteristic spectral features of the DRIFT spectra during the CO oxidation. Here, only one distinct signal at 2060 cm−1 and 2087 cm−1 is revealed for IrO2@TiO2 and Ir0 + TiO2, respectively. However, the band position of IrO2@TiO2 at 2060 cm−1 varies under reaction conditions slightly with the temperature (cf. Figure 4A). As such, the oxidation state of the catalyst cannot unambiguously be derived from band position in DRIFTS alone.
Under reaction conditions, the oxidation state of a catalyst may change dynamically when varying the temperature or the feed composition. It is therefore of particular interest to investigate the catalyst in an intermediary state of partial reduction/oxidation. In order to achieve this, the samples are exposed to a reducing CO oxidation mixture (1% O2/4% CO/95% Ar) at 300 °C. Under this reaction condition, Ir0 + TiO2 is able to partially oxidize, while IrO2@TiO2 may partially reduce, thus forming an intermediate phase for both catalysts. The DRIFT spectra of the samples after cooling to room temperature under reaction conditions are depicted in Figure 3B. Here, both samples show a major absorption band at 2085 cm−1 with a very broad shoulder reaching down to 1800 cm−1. Some minor differences in the peak shape can be observed, like additional shoulder peaks at around 2060 cm−1 and slightly above 2085 cm−1 for the oxidized Ir0 + TiO2. The overall characteristic shape of the DRIFT spectra for both samples is, however, very similar and is indicative of a unique intermediate phase that is formed by the partial reduction of IrO2 and partial oxidation of Ir0.
Blank spectra are provided in Figure S7 for the rutile TiO2 support alone without the active component. Here, no CO adsorption is discernible. A CO DRIFT spectrum of Ir0 + TiO2, having undergone oxidative pretreatment with 4% O2 at 300 °C, is shown in Figure S8. As for IrO2@TiO2, only a single band without a broad shoulder is observed, indicating that the surface of Ir0 + TiO2 can form a surface oxide similar to that of IrO2@TiO2.

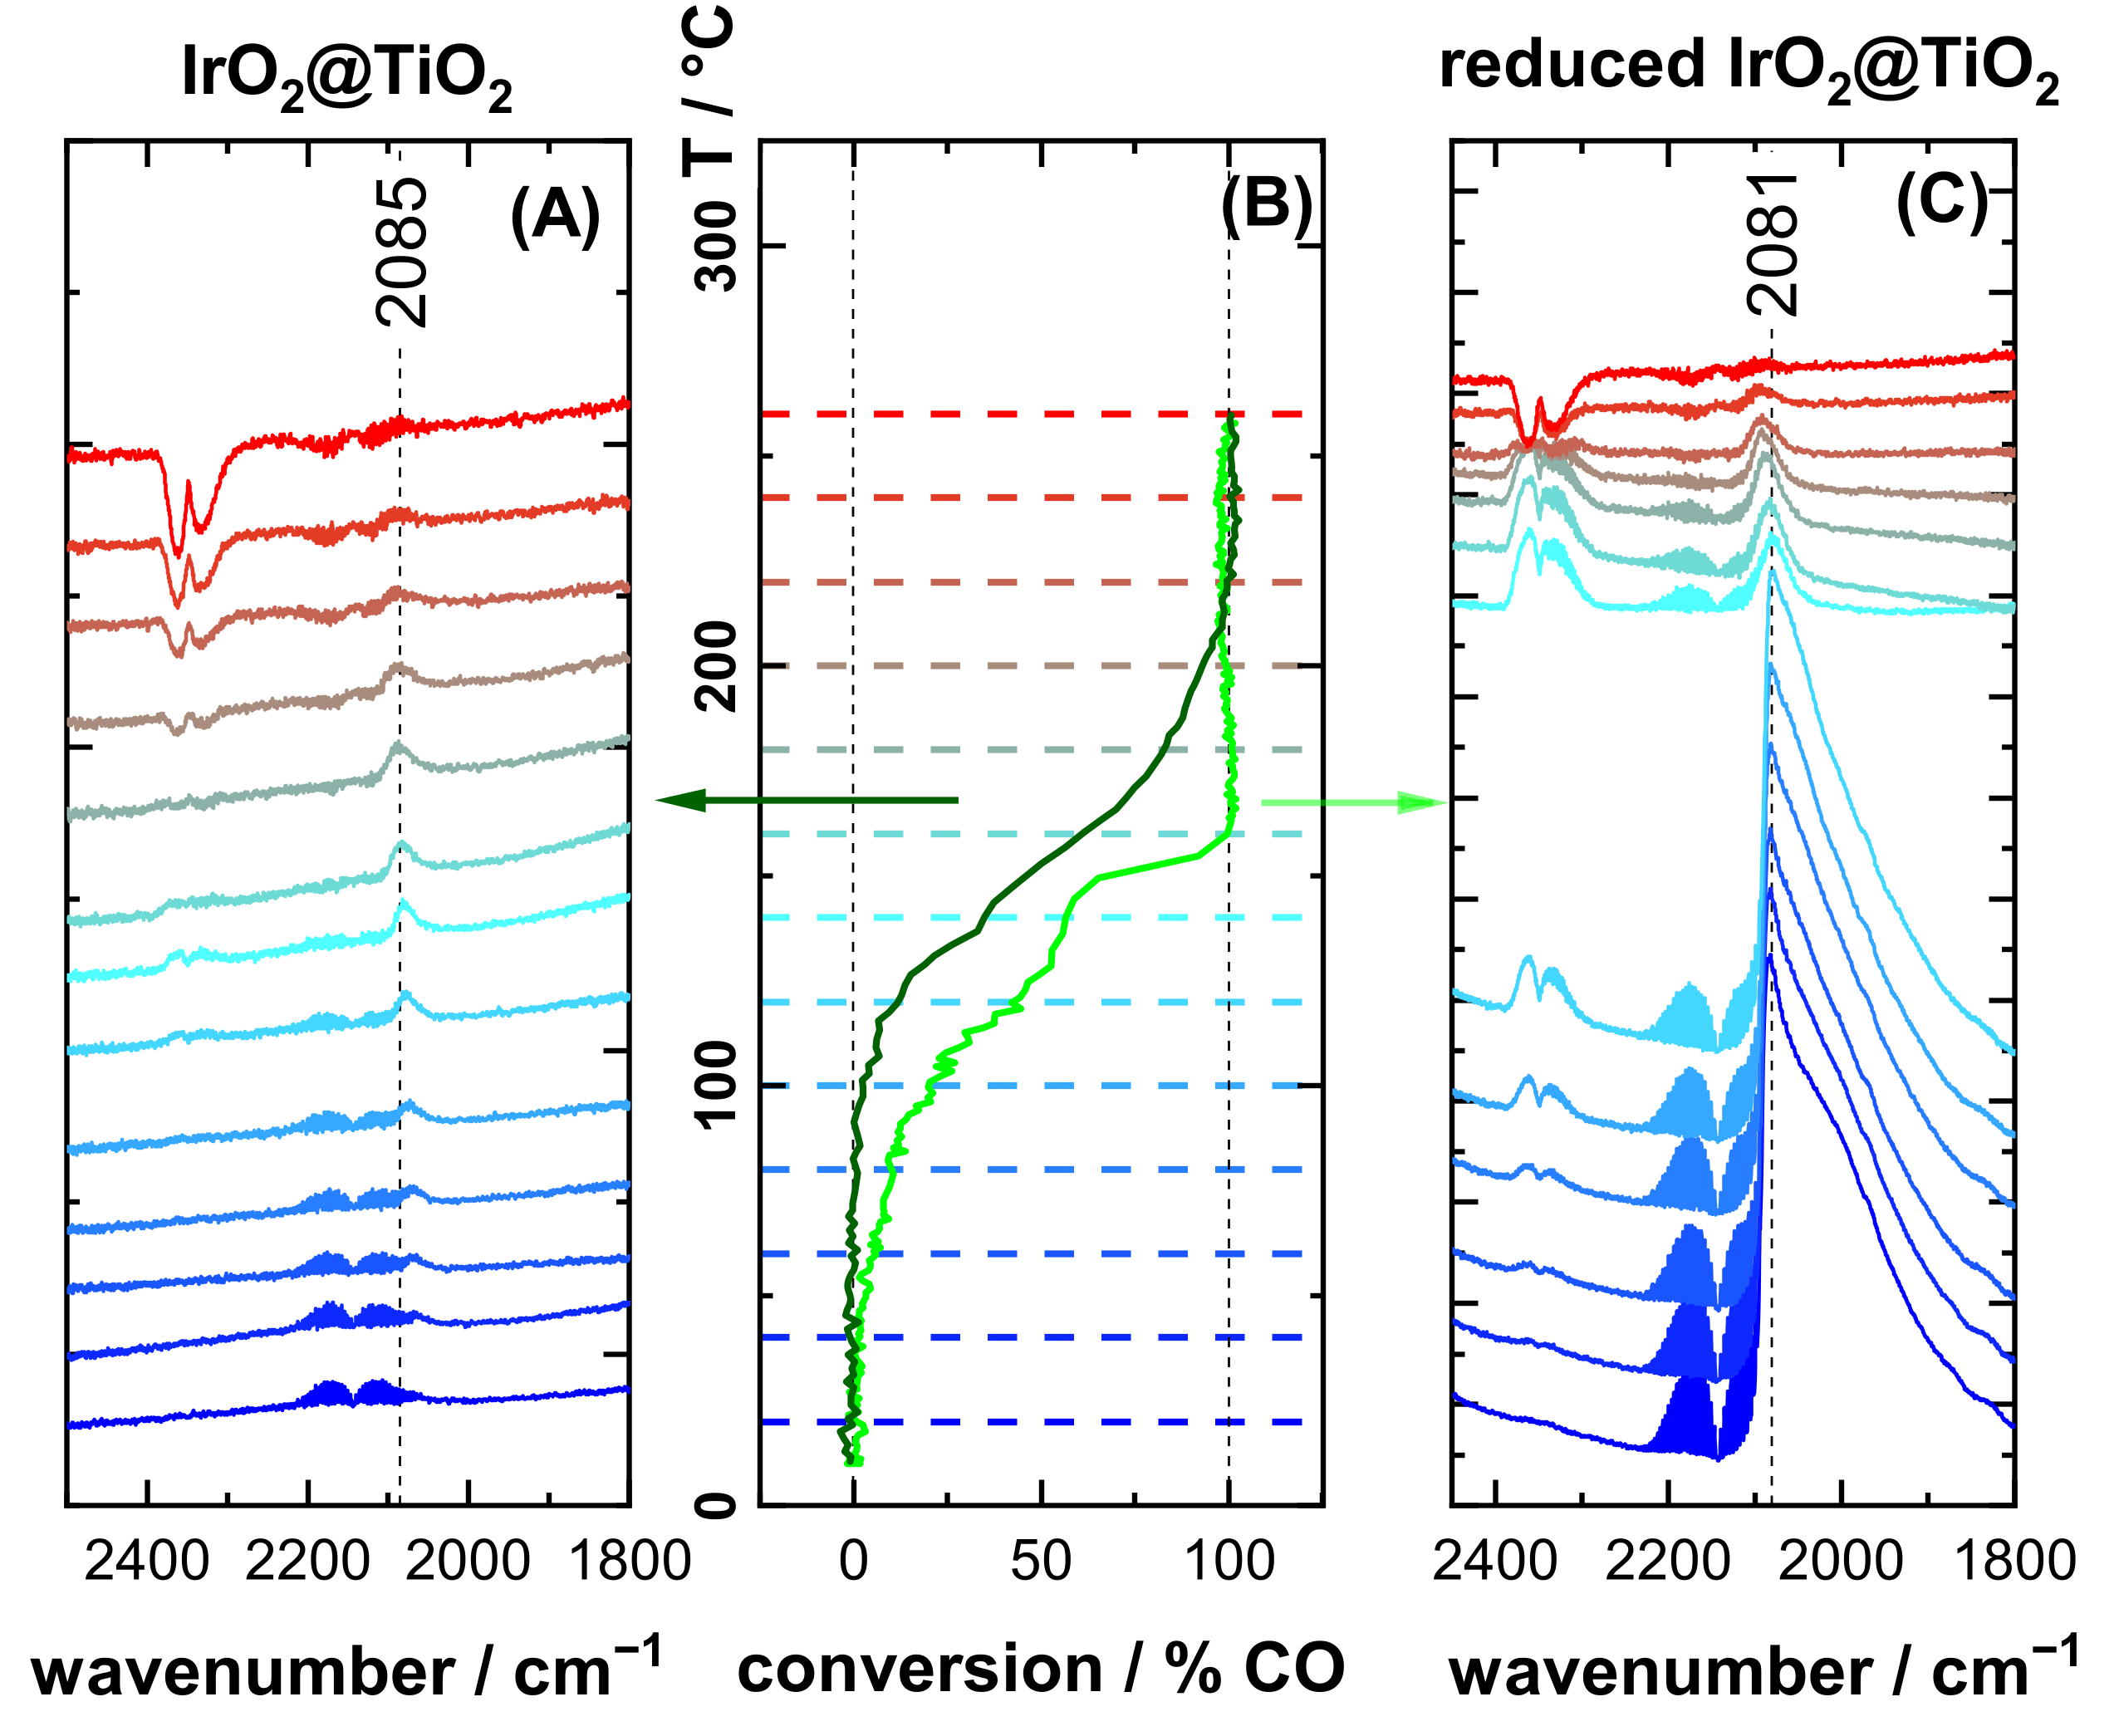
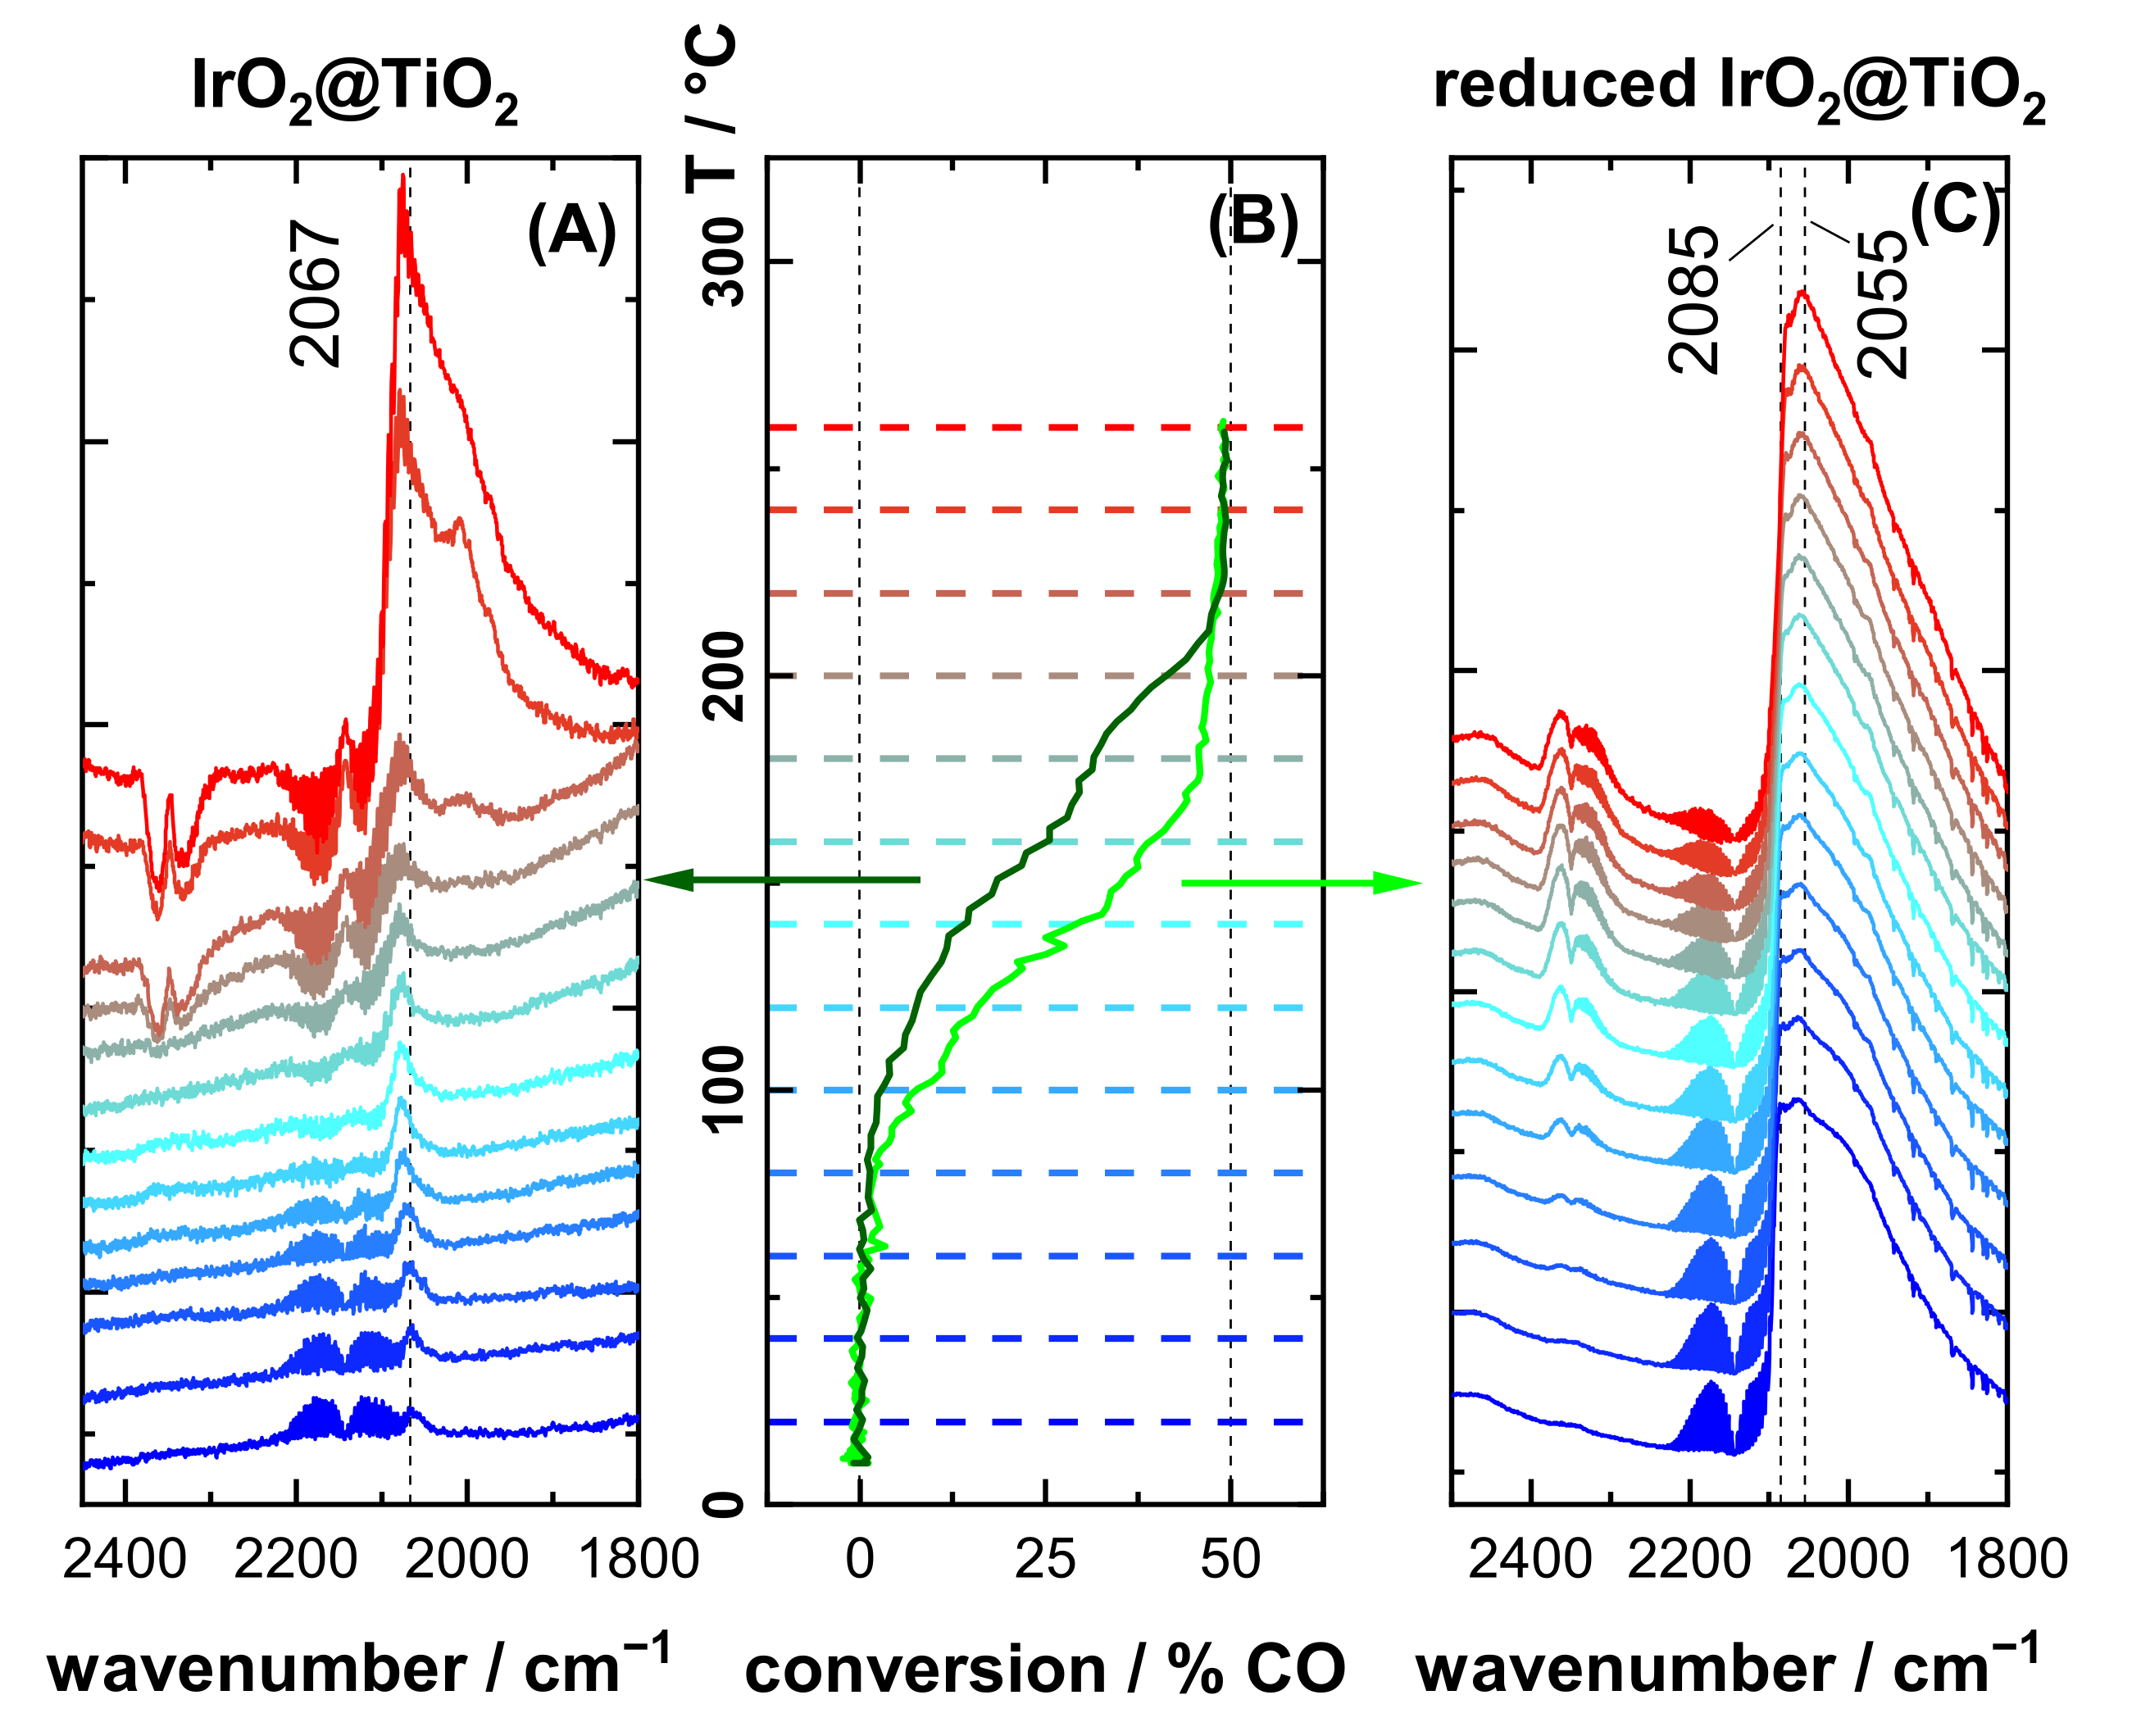
3.3. CO Oxidation Experiments of IrO2@TiO2 Samples

Figure 4 depicts the DRIFT spectra of IrO2@TiO2 and reduced IrO2@TiO2 during CO oxidation reaction under oxidizing conditions (2% O2/2% CO/96% Ar) at various temperatures, together with the corresponding CO conversion. Conversion data were produced by normalizing mass spectrometer (MS) data to their respective maxima, corresponding to the full conversion of CO.
For IrO2@TiO2, a single band appears at 2085 cm−1 (Figure 4A), as also observed in Figure 3A. This band remains unchanged in position and shape till it starts to diminish between 160 °C and 240 °C, while the reaction rate (MS) concomitantly increases. No further CO adsorption signals can be detected in DRIFTS above 240 °C. The CO conversion starts at around 100–120 °C as indicated by MS (Figure 4B) and the appearance of the CO2 gas phase signal in DRIFTS starts at around 2350 cm−1. As the temperature increases, heated gases (here CO and CO2) in and directly above the catalyst layer start to emit IR radiation themselves. This causes the gas phase signals in the IR spectra to flip around 180–220 °C and look like “negative absorption”.
On reduced IrO2@TiO2, the dominant absorption band is again at 2080 cm−1 with a broad shoulder reaching down to 1800 cm−1 (Figure 4C). Here, the MS and CO2 gas phase signal in DRIFTS show a significantly earlier onset of activity at ca. 50 °C, which is about 50 °C lower in temperature than observed for the CO oxidation on IrO2@TiO2. Furthermore, MS shows higher activity of the reduced IrO2@TiO2 compared to IrO2@TiO2 throughout the entire temperature range, until IrO2@TiO2 reaches full conversion at 220 °C. A steep increase in activity is evident for the reduced IrO2@TiO2 in the temperature range from 140 °C to 160 °C, while full conversion is reached at 160 °C. This steep increase in activity is correlated with a pronounced change in the DRIFT spectra, where CO from the broad band is consumed leaving the previously observed single band at 2081 cm−1. This band then slowly diminishes with increasing temperature until at 260 °C no surface CO signal is observable in DRIFTS.
Figure 5 shows the DRIFT spectra of reduced IrO2@TiO2 under oxidizing conditions during the cool down from 160 °C. Before those spectra are recorded, the sample is heated to 160 °C, so the broad shoulder is consumed as previously seen in Figure 4C.
As soon as this occurred, the sample is cooled down again, while keeping the oxidizing feed composition. One can recognize in Figure 5 that with decreasing temperature the broad shoulder re-emerges, demonstrating that the catalyst is in fact not fully oxidized at this point.
Figure 6 summarizes the operando DRIFTS experiments of IrO2@TiO2 and reduced IrO2@TiO2 during the CO oxidation reaction under reducing conditions (1% O2/4% CO/95% Ar) at various temperatures and includes on-line CO conversion data. The MS data are normalized to their respective maxima, corresponding to a full conversion of O2 that is equivalent to a 50% conversion of CO.
In DRIFTS of IrO2@TiO2 (Figure 6A) a single band is observed as already shown in Figure 3. Here the band position is 2067 cm−1. At 180 °C the broad shoulder starts to appear indicating the beginning of the reduction of the catalyst. This shoulder then keeps growing with the increasing reaction temperature until it reaches down to 1800 cm−1. The CO conversion for IrO2@TiO2 (Figure 6B) under reducing conditions starts at 80–100 °C, i.e., slightly earlier than under oxidizing conditions. The conversion then increases in an Arrhenius-like fashion up to about 160 °C. At 180 °C, concurrent with the appearance of the shoulder in DRIFTS, the conversion increases rapidly until it levels off at 220 °C.
In DRIFTS of the reduced IrO2@TiO2 (Figure 6C) a broad shoulder reaching from 2085 cm−1 down to 1800 cm−1 is recognizable. The shape differs slightly from the previously shown spectra in Figure 3B and Figure 4C, with a band at 2055 cm−1 being more dominant. The shape and position of the bands do not vary significantly throughout the entire temperature range. MS and CO2 gas phase signals in DRIFTS indicate the onset of CO conversion at about 60 °C. The higher conversion of reduced IrO2@TiO2 relative to IrO2@TiO2 under reducing conditions is at first not as clearly observable in MS as under oxidizing conditions. However, above 80 °C, reduced IrO2@TiO2 shows markedly higher activity. At 180 °C the conversion then levels off in a similar fashion as IrO2@TiO2. Above 220 °C the conversion curves of both samples are practically identical.

4. Discussion

4.1. CO as a Probe Molecule for the Surface Oxidation State of IrO2

In the literature, signals around 2063–2073 cm−1 are reported for CO adsorption on single-crystalline IrO2(110) films and polycrystalline IrO2 supported on Al2O3 [36,39,40]. For single-crystalline Ir(111) and metallic Ir supported on Al2O3, CO band positions in the spectral range of 2020–2065 cm−1 are found [40,41,42]. The band positions found in this work (Figure 3A) are similar, with CO adsorption resulting in one distinct signal in the region of 2060–2085 cm−1 on both Ir metal and oxide IrO2. The exact band position varies slightly so that a characterization of the chemical status of the catalyst by this spectral feature alone does not seem to be possible. The presence of only a single band in DRIFTS found here is, however, quite surprising since the surface of the supported IrO2-based particles surely comprises many different facets and adsorption sites. The fact that only one symmetrical band is observed in DRIFTS points toward efficient dipole–dipole coupling of the vibrational modes of all sites. This coupling of different CO species was reported for RuO2(110): although CO adsorbs in both the bridge and on-top positions on the mildly reduced RuO2(110) surface, only a single CO stretch frequency is observed in RAIRS around 2086 cm−1 [43].
When exposing IrO2@TiO2 and Ir0 + TiO2 to a reducing reaction mixture (1% O2/4% CO/95% Ar) both samples show very similar CO adsorption patterns as reconciled by a broad CO band reaching from 2080 down to 1800 cm−1 in DRIFTS (cf. Figure 3B). The XP spectra in Figure 2 show that under these conditions IrO2@TiO2 is partially reduced due to excess CO in the gas feed, while Ir0 + TiO2 is partially oxidized due to the presence of O2. The oxidation of Ir0 + TiO2 is corroborated by Raman spectroscopy in Figure S6. The full oxidation of Ir0 + TiO2 is, however, inhibited, due to excess CO in the gas feed. The CO adsorption pattern observed for both catalysts is dominated by a spectral feature at 2060–2085 cm−1 with a broad shoulder stretching down to 1800 cm−1. We therefore conclude that this spectral feature is characteristic for partially reduced IrO2 or partially oxidized Ir, while a single symmetric band is characteristic for pure Ir oxide or pure Ir metal.

4.2. Case Study: Catalytic CO Oxidation

When the IrO2@TiO2 and reduced IrO2@TiO2 samples were exposed to CO oxidation reaction conditions significant differences in activity were observed. Under both reducing and oxidizing gas feed compositions, reduced IrO2@TiO2 reveals a lower onset temperature for CO conversion than IrO2@TiO2 by about 50 °C and a higher activity throughout the entire temperature range. Under oxidizing conditions, full conversion is reached for reduced IrO2@TiO2 at 160 °C, i.e., 60 °C lower than for IrO2@TiO2. Under reducing conditions, the CO conversion saturates at 180 °C and 220 °C for reduced IrO2@TiO2 and IrO2@TiO2, respectively.
This increase in activity can further be correlated to the partially reduced state of IrO2@TiO2 via the characteristic broad shoulder observed in DRIFTS. Under reducing reaction conditions the activity of IrO2@TiO2 increases steeply at 180 °C, which is accompanied in DRIFTS by the appearance of the broad CO band at 2050 cm−1 reaching down to 1800 cm−1. Under oxidizing reaction conditions the broad CO shoulder in DRIFTS of reduced IrO2@TiO2 disappears as the conversion jumps up at 140 °C, leaving the oxide signal at 2081 cm−1. At first glance, this may suggest a sudden oxidation of the catalyst or a simple desorption of CO due to the high temperature. We conclude, however, that, considering the otherwise higher activity of the reduced catalyst, the disappearance of the broad CO band is due to the reaction of this reactive CO species on the reduced IrO2@TiO2 and thus only CO at oxidized parts of the catalyst remain visible in DRIFTS. This interpretation can further be corroborated by cooling the catalyst immediately after the broad shoulder reacted off, as summarized in Figure 5. Here the shoulder reappears as soon as the catalyst is cooled, demonstrating that the reactive CO is re-populated. The disappearance of the reactive CO species is not due to desorption above 140 °C, since this species is shown to be stable up to 260 °C under a reducing feed mixture (cf. Figure 6A,C).
On RuO2 the mechanism of heterogeneous CO oxidation catalysis has been shown to proceed with the following mechanism [43,44]: (1) CO adsorbing on the catalyst surface; (2) CO combining with O from the oxide lattice to form CO2; (3) CO2 desorbing; and (4) O vacancy in the oxide lattice being replenished with O2 from the gas phase. Both oxides occur in rutile structure and Ru and Ir are close to each other on the periodic table. Therefore, on IrO2 a similar mechanism is expected to take place. The higher activity of reduced IrO2 could then be explained in two ways. Firstly, the lattice oxygen in reduced IrO2 is more facile to be extracted due to lower binding energies. Secondly, oxygen may be more mobile in the defect-rich lattice, allowing active sites to be replenished with oxygen more easily. The latter interpretation would fit well with the recent findings of Martin et al. [4], who reported that subsurface oxygen replacing oxygen on bridge positions plays a role in methane oxidation on IrO2.

5. Conclusions

Operando diffuse reflectance infrared Fourier transform spectroscopy (DRIFTS) is combined with on-line mass spectrometry (MS) to study, with CO serving as probe molecule, the actual oxidation state of a supported IrO2@TiO2 catalyst during the CO oxidation reaction. In doing so, we prepare first pure metal and oxide Ir catalysts to identify characteristic fingerprints in CO stretching vibrations for the pure metallic and the oxidic state of the catalysts, which aid the subsequent interpretation of the CO spectra acquired during the CO oxidation reaction. The CO DRIFT spectra of the pure oxide IrO2@TiO2 samples as well as the pure metal Ir0 + TiO2 are governed by a single mode at 2060 cm−1 and 2087 cm−1, respectively. This finding is quite surprising, since CO vibrations from several facets and adsorption sites of the active particles (with varying frequencies) contribute to the DRIFT spectra. It seems that all these vibrational modes couple via dipole interaction, thus culminating in a single band. Quite in contrast, the CO DRIFT spectra of the reduced IrO2@TiO2 and oxidized Ir0 + TiO2 samples show a pronounced broad band ranging from 2085 cm−1 to 1800 cm−1, revealing a partially reduced IrO2 catalyst.
For reduced IrO2@TiO2, the reaction onset and maximum conversion occur at lower temperatures than for IrO2@TiO2. Under oxidizing conditions, CO conversion on IrO2@TiO2 starts at 100–120 °C while for reduced IrO2@TiO2 it already starts at 50 °C. Full conversion is accomplished at 220 °C (IrO2@TiO2) and 160 °C (reduced IrO2@TiO2). The DRIFT spectra for reduced IrO2@TiO2 under oxidizing conditions evidence that the broad shoulder is consumed preferentially as the catalyst experiences a steep activity increase at 140 °C, thus indicating that this species is the reactive CO on the surface.
Under reducing conditions, the onset of conversion is observed at 80–100 °C for IrO2@TiO2 and at 60 °C for reduced IrO2@TiO2. Maximum conversion is reached at 220 °C for IrO2@TiO2 and 180 °C for reduced IrO2@TiO2. IrO2@TiO2 under reducing conditions reveals a steep increase of activity at 180 °C that is accompanied by a reduction of the catalyst as evidenced by DRIFTS.
The combination of operando DRIFTS and on-line MS therefore provide compelling evidence that the activity of partially reduced IrO2@TiO2 catalysts is significantly higher than that of IrO2@TiO2 under both oxidizing and reducing CO oxidation reaction conditions.

Supplementary Materials

The following supporting information can be downloaded at: https://www.mdpi.com/article/10.3390/inorganics11030102/s1, Figure S1: Light path and temperature Detection; Figure S2: Time response of the MS system; Figure S3: DRIFTS data processing; Figure S4: TEM of IrO2@TiO2; Figure S5: XP spectra of incomplete reduction of IrO2@TiO2 with H2; Figure S6: Raman spectra of Ir0 before and after reducting CO oxidation conditions; Table S1: XPS fit parameters; Figure S7: Blank DRIFT spectra of rutile-TiO2 without active component; Figure S8: DRIFT spectrum of CO adsorption on Ir0+TiO2 after oxidative pretreatment.

Author Contributions

Conceptualization, H.O. and P.T.; methodology, P.T.; XPS investigation, T.W. and L.G.; writing—original draft preparation, P.T. and H.O.; writing—review and editing, P.T., T.W., L.G. and H.O.; funding acquisition, H.O. All authors have read and agreed to the published version of the manuscript.

Funding

The research was funded by the Deutsche Forschungsgemeinschaft (DFG, German Research Foundation-493681475).

Institutional Review Board Statement

Not applicable.

Informed Consent Statement

Not applicable.

Data Availability Statement

The data used to support the findings of this study are included within the article.

Conflicts of Interest

The authors declare no conflict of interest.

References

  1. Over, H.; Balmes, O.; Lundgren, E. Direct Comparison of the Reactivity of the Non-Oxidic Phase of Ru(0001) and the RuO2 Phase in the CO Oxidation Reaction. Surf. Sci. 2009, 603, 298–303. [Google Scholar] [CrossRef]
  2. Gao, F.; Goodman, D.W. CO Oxidation over Ruthenium: Identification of the Catalytically Active Phases at near-Atmospheric Pressures. Phys. Chem. Chem. Phys. 2012, 14, 6688–6697. [Google Scholar] [CrossRef]
  3. Gustafson, J.; Balmes, O.; Zhang, C.; Shipilin, M.; Schaefer, A.; Hagman, B.; Merte, L.R.; Martin, N.M.; Carlsson, P.A.; Jankowski, M.; et al. The Role of Oxides in Catalytic CO Oxidation over Rhodium and Palladium. ACS Catal. 2018, 8, 4438–4445. [Google Scholar] [CrossRef]
  4. Martin, R.; Kim, M.; Lee, C.J.; Mehar, V.; Albertin, S.; Hejral, U.; Merte, L.R.; Asthagiri, A.; Weaver, J.F. Isothermal Reduction of IrO2(110) Films by Methane Investigated Using in Situ x-Ray Photoelectron Spectroscopy. ACS Catal. 2021, 11, 5004–5016. [Google Scholar] [CrossRef]
  5. Weaver, J.F. Surface Chemistry of Late Transition Metal Oxides. Chem. Rev. 2013, 113, 4164–4215. [Google Scholar] [CrossRef]
  6. Schlögl, R. Heterogeneous Catalysis. Angew. Chemie Int. Ed. 2015, 54, 3465–3520. [Google Scholar] [CrossRef] [Green Version]
  7. Weckhuysen, B.M. Determining the Active Site in a Catalytic Process: Operando Spectroscopy Is More than a Buzzword. Phys. Chem. Chem. Phys. 2003, 5, 4351–4360. [Google Scholar] [CrossRef]
  8. Grunwaldt, J.D.; Baiker, A. In Situ Spectroscopic Investigation of Heterogeneous Catalysts and Reaction Media at High Pressure. Phys. Chem. Chem. Phys. 2005, 7, 3526–3539. [Google Scholar] [CrossRef]
  9. Ryczkowski, J. IR Spectroscopy in Catalysis. Catal. Today 2001, 68, 263–381. [Google Scholar] [CrossRef]
  10. Zaera, F. Infrared Absorption Spectroscopy of Adsorbed CO: New Applications in Nanocatalysis for an Old Approach. ChemCatChem 2012, 4, 1525–1533. [Google Scholar] [CrossRef]
  11. Meunier, F.C. Relevance of IR Spectroscopy of Adsorbed CO for the Characterization of Heterogeneous Catalysts Containing Isolated Atoms. J. Phys. Chem. C 2021, 125, 21810–21823. [Google Scholar] [CrossRef]
  12. Hoffman, F.M. Infrared Reflection-Absorption Spectroscopy of Adsorbed Molecules. Surf. Sci. Rep. 1983, 3, 107–192. [Google Scholar] [CrossRef]
  13. Hollins, P.; Pritchard, J. Infrared Studies of Chemisorbed Layers on Single Crystals. Prog. Surf. Sci. 1985, 19, 275–349. [Google Scholar] [CrossRef]
  14. Villegas, I.; Weaver, M.J. Modeling Electrochemical Interfaces in Ultrahigh Vacuum: Molecular Roles of Solvation in Double-Layer Phenomena. J. Phys. Chem. B 1997, 101, 10166–10177. [Google Scholar] [CrossRef]
  15. Van Santen, R.A.; Tranca, I.; Hensen, E.J.M. Theory of Surface Chemistry and Reactivity of Reducible Oxides. Catal. Today 2015, 244, 63–84. [Google Scholar] [CrossRef]
  16. Khalid, O.; Spriewald Luciano, A.; Drazic, G.; Over, H. Mixed RuxIr1−xO2 Supported on Rutile TiO2: Catalytic Methane Combustion, a Model Study. ChemCatChem 2021, 13, 3983–3994. [Google Scholar] [CrossRef]
  17. Martin, R.; Lee, C.J.; Mehar, V.; Kim, M.; Asthagiri, A.; Weaver, J.F. Catalytic Oxidation of Methane on IrO2 (110) Films Investigated Using Ambient-Pressure X-Ray Photoelectron Spectroscopy. ACS Catal. 2022, 12, 2840–2853. [Google Scholar] [CrossRef]
  18. Wang, Z.; Wang, W.; Khalid, O.; Weber, T.; Luciano, A.S.; Zhan, W.; Smarsly, B.M.; Over, H. Supported RuxIr1-xO2 Mixed Oxides Catalysts for Propane Combustion: Resistance Against Water Poisoning. ChemCatChem 2022, 14, e202200149. [Google Scholar] [CrossRef]
  19. Assmann, J.; Narkhede, V.; Breuer, N.A.; Muhler, M.; Seitsonen, A.P.; Knapp, M.; Crihan, D.; Farkas, A.; Mellau, G.; Over, H. Heterogeneous Oxidation Catalysis on Ruthenium: Bridging the Pressure and Materials Gaps and Beyond. J. Phys. Condens. Matter 2008, 20, 184017. [Google Scholar] [CrossRef]
  20. Khalid, O.; Weber, T.; Drazic, G.; Djerdj, I.; Over, H. Mixed RuxIr1-xO2 Oxide Catalyst with Well-Defined and Varying Composition Applied to CO Oxidation. J. Phys. Chem. C 2020, 124, 18670–18683. [Google Scholar] [CrossRef]
  21. Trasatti, S. Electrocatalysis: Understanding the Success of DSA®. Electrochim. Acta 2000, 45, 2377–2385. [Google Scholar] [CrossRef]
  22. Kötz, R.; Stucki, S. Stabilization of RuO2 by IrO2 for Anodic Oxygen Evolution in Acid Media. Electrochim. Acta 1986, 31, 1311–1316. [Google Scholar] [CrossRef]
  23. Over, H. Atomic Scale Insights into Electrochemical versus Gas Phase Oxidation of HCl over RuO2-Based Catalysts: A Comparative Review. Electrochim. Acta 2013, 93, 314–333. [Google Scholar] [CrossRef]
  24. Over, H. Fundamental Studies of Planar Single-Crystalline Oxide Model Electrodes (RuO2, IrO2) for Acidic Water Splitting. ACS Catal. 2021, 11, 8848–8871. [Google Scholar] [CrossRef]
  25. Fabbri, E.; Habereder, A.; Waltar, K.; Kötz, R.; Schmidt, T.J. Developments and Perspectives of Oxide-Based Catalysts for the Oxygen Evolution Reaction. Catal. Sci. Technol. 2014, 4, 3800–3821. [Google Scholar] [CrossRef] [Green Version]
  26. Drochner, A.; Fehlings, M.; Krauß, K.; Vogel, H. A New DRIFTS Cell for the In-Situ Investigation of Heterogeneously Catalyzed Reactions. Chem. Eng. Technol. 2000, 23, 319–322. [Google Scholar] [CrossRef]
  27. Meunier, F.C. Pitfalls and Benefits of: In Situ and Operando Diffuse Reflectance FT-IR Spectroscopy (DRIFTS) Applied to Catalytic Reactions. React. Chem. Eng. 2016, 1, 134–141. [Google Scholar] [CrossRef]
  28. Freund, H.J.; Meijer, G.; Scheffler, M.; Schlögl, R.; Wolf, M. CO Oxidation as a Prototypical Reaction for Heterogeneous Processes. Angew. Chemie Int. Ed. 2011, 50, 10064–10094. [Google Scholar] [CrossRef]
  29. Abb, M.J.S.; Weber, T.; Glatthaar, L.; Over, H. Growth of Ultrathin Single-Crystalline IrO2(110) Films on a TiO2(110) Single Crystal. Langmuir 2019, 35, 7720–7726. [Google Scholar] [CrossRef]
  30. He, Y.; Langsdorf, D.; Li, L.; Over, H. Versatile Model System for Studying Processes Ranging from Heterogeneous to Photocatalysis: Epitaxial RuO2(110) on TiO2(110). J. Phys. Chem. C 2015, 119, 2692–2702. [Google Scholar] [CrossRef]
  31. Mamaca, N.; Mayousse, E.; Arrii-Clacens, S.; Napporn, T.W.; Servat, K.; Guillet, N.; Kokoh, K.B. Electrochemical Activity of Ruthenium and Iridium Based Catalysts for Oxygen Evolution Reaction. Appl. Catal. B Environ. 2012, 111–112, 376–380. [Google Scholar] [CrossRef]
  32. Terezo, A.J.; Pereira, E.C. Preparation and Characterization of Ti/RuO2 Anodes Obtained by Sol-Gel and Conventional Routes. Mater. Lett. 2002, 53, 339–345. [Google Scholar] [CrossRef]
  33. Reksten, A.; Sunde, S.; Seland, F.; Moradi, F. Iridium-Ruthenium Mixed Oxide for Oxygen Evolution Reaction Prepared By Pechini Synthesis. ECS Meet. Abstr. 2013, MA2013-02, 80. [Google Scholar] [CrossRef]
  34. Rosario, A.V.; Bulhoões, L.O.S.; Pereira, E.C. Investigation of Pseudocapacitive Properties of RuO2 Film Electrodes Prepared by Polymeric Precursor Method. J. Power Sources 2006, 158, 795–800. [Google Scholar] [CrossRef]
  35. Freakley, S.J.; Ruiz-Esquius, J.; Morgan, D.J. The X-Ray Photoelectron Spectra of Ir, IrO2 and IrCl3 Revisited. Surf. Interface Anal. 2017, 49, 794–799. [Google Scholar] [CrossRef]
  36. Abb, M.J.S.; Weber, T.; Langsdorf, D.; Koller, V.; Gericke, S.M.; Pfaff, S.; Busch, M.; Zetterberg, J.; Preobrajenski, A.; Grönbeck, H.; et al. Thermal Stability of Single-Crystalline IrO2(110) Layers: Spectroscopic and Adsorption Studies. J. Phys. Chem. C 2020, 124, 15324–15336. [Google Scholar] [CrossRef]
  37. Over, H. Surface Chemistry of Ruthenium Dioxide in Heterogeneous Catalysis and Electrocatalysis: From Fundamental to Applied Research. Chem. Rev. 2012, 112, 3356–3426. [Google Scholar] [CrossRef]
  38. Morgan, D.J. Resolving Ruthenium: XPS Studies of Common Ruthenium Materials. Surf. Interface Anal. 2015, 47, 1072–1079. [Google Scholar] [CrossRef]
  39. Solymosi, F.; Novák, É.; Molnár, A. Infrared Spectroscopic Study on CO-Induced Structural Changes of Iridium on an Alumina Support. J. Phys. Chem. 1990, 94, 7250–7255. [Google Scholar] [CrossRef]
  40. Solymosi, F.; Raskó, J. An Infrared Study of CO and NO Adsorption on Alumina-Supported Iridium Catalyst. J. Catal. 1980, 62, 253–263. [Google Scholar] [CrossRef]
  41. Lauterbach, J.; Boyle, R.W.; Schick, M.; Mitchell, W.J.; Meng, B.; Weinberg, W.H. The Adsorption of CO on Ir(111) Investigated with FT-IRAS. Surf. Sci. 1996, 350, 32–44. [Google Scholar] [CrossRef]
  42. Fujitani, T.; Nakamura, I.; Kobayashi, Y.; Takahashi, A.; Haneda, M.; Hamada, H. Adsorption and Reactions of NO on Clean and CO-Precovered Ir(111). J. Phys. Chem. B 2005, 109, 17603–17607. [Google Scholar] [CrossRef] [PubMed]
  43. Farkas, A.; Mellau, G.C.; Over, H. Novel Insight in the CO Oxidation on RuO2(110) by in Situ Reflection-Absorption Infrared Spectroscopy. J. Phys. Chem. C 2009, 113, 14341–14355. [Google Scholar] [CrossRef]
  44. Farkas, A.; Hess, F.; Over, H. “First-Principles” Kinetic Monte Carlo Simulations Revisited: CO Oxidation over RuO2(110). J. Comput. Chem. 2011, 33, 757–766. [Google Scholar] [CrossRef]
Figure 1. Scheme of the reactor setup with gas supply and analytics. The green lines represent steel tubes. The red arrows show the IR light striking the sample. Reactive gases are denoted as RG 1 and RG 2. The outer dimensions of the reactor cell are 55 mm in diameter and height. The catalyst bed (yellow) is 7 mm in diameter and 3 mm high.
Inorganics 11 00102 g001
Figure 2. Ir 4f XP spectra of (A) Ir0 as well as (C) IrO2@TiO2. The latter sample is measured without TiO2, as otherwise the spectra were dominated by the Ti 3s feature. (B,D) show the respective samples after being exposed to reducing CO oxidation conditions (1% O2/4% CO/95% Ar) at 300 °C. The fit parameters for decomposition of the experimental spectra (circles) are provided in Table S1 of the Supplementary Materials.
Inorganics 11 00102 g002
Figure 3. CO DRIFT spectra are shown for (A) commercial Ir0 + TiO2 in the purely metallic state of Ir as well as on IrO2@TiO2 as prepared by the Pechini synthesis in the purely oxidic state of Ir on the left. In (B), similar spectra are shown for the same samples after being exposed to reducing CO oxidation conditions (1% O2/4% CO/95% Ar) at 300 °C. All spectra are recorded at room temperature.
Inorganics 11 00102 g003
Figure 4. Operando DRIFT spectra of (A) IrO2@TiO2 and (C) reduced IrO2@TiO2, as well as (B) corresponding CO conversion data as measured by MS for oxidizing (2% O2/2% CO/96% Ar) reaction feed composition. For the MS data, the dark green line corresponds to IrO2@TiO2, and the light green line to reduced IrO2@TiO2. The temperature axis of MS and the color code of the dashed lines signify the temperatures of the DRIFT spectra. The temperature increment between consecutive spectra is 20 °C. The heating ramp is 1.8 K·min−1.
Inorganics 11 00102 g004
Figure 5. DRIFT spectra of reduced IrO2@TiO2 after being heated under an oxidizing (2% O2/2% CO/96% Ar) reaction feed composition to 160 °C. The spectra show the cool down to 20 °C directly after 160 °C is reached. The temperature increment between consecutive spectra is 20 °C. The heating ramp is 1.8 K·min−1. As the catalyst is cooled down, the broad shoulder, indicative of partial reduction, reappears.
Inorganics 11 00102 g005
Figure 6. Operando DRIFT spectra of (A) IrO2@TiO2 and (C) reduced IrO2@TiO2 as well as (B) corresponding CO conversion data as measured by MS under reducing (1% O2/4% CO/95% Ar) feed composition. For the MS data, the dark green line corresponds to IrO2@TiO2, and the light green line to reduced IrO2@TiO2. The temperature axis of MS and the color code of the dashed lines signify the temperatures of the DRIFT spectra. The temperature increment between consecutive spectra is 20 °C. The heating ramp is 1.8 K·min−1.
Inorganics 11 00102 g006
Table 1. Gas compositions for different experiments.
Reaction ConditionsAr/%O2/%CO/%
Oxidizing9622
Reducing9514
CO only96-4
Disclaimer/Publisher’s Note: The statements, opinions and data contained in all publications are solely those of the individual author(s) and contributor(s) and not of MDPI and/or the editor(s). MDPI and/or the editor(s) disclaim responsibility for any injury to people or property resulting from any ideas, methods, instructions or products referred to in the content.

