

Study of the Kinetics of Reduction of IrO2 on TiO2 (Anatase) by Temperature-Programmed Reduction


Abstract

1. Introduction
2. Results and Discussion
3. Experimental
3.1. Catalyst Preparation
3.2. Temperature Programmed Reduction (TPR)
3.3. Kinetic Study
4. Conclusions
Supplementary Materials
Author Contributions
Funding
Data Availability Statement
Conflicts of Interest
References
- van Deelen, T.W.; Mejía, C.H.; de Jong, K.P. Control of metal-support interactions in heterogeneous catalysts to enhance activity and selectivity. Nat. Catal. 2019, 2, 955–970. [Google Scholar] [CrossRef]
- Liu, L.; Corma, A. Metal Catalysts for Heterogeneous Catalysis: From Single Atoms to Nanoclusters and Nanoparticles. Chem. Rev. 2018, 118, 4981–5079. [Google Scholar] [CrossRef] [PubMed]
- Moulijn, J.A.; van Leeuwen, P.W.N.M.; van Santen, R.A. (Eds.) An Integrated Approach to Homogeneous, Heterogeneous and Industrial Catalysis, Chapter 11, Temperature Programmed Reduction and Sulphiding. Stud. Surf. Sci. Catal. 1993, 79, 401–417. [Google Scholar]
- Hurst, N.W.; Gentry, S.J.; Jones, A.; McNicol, B.D. Temperature Programmed Reduction. Catal. Rev. Sci. Eng. 1982, 24, 233–309. [Google Scholar] [CrossRef]
- Lou, Y.; Xu, J.; Zhang, Y.; Pana, C.; Dong, Y.; Zhu, Y. Metal-Support Interaction for Heterogeneous Catalysis: From Nanoparticles to Single Atoms. Mat. Today Nano 2020, 12, 100093. [Google Scholar] [CrossRef]
- Abdel Halim, K.S.; El-Geassy, A.A.; Ramadan, M.; Nasr, M.I.; Hussein, A.; Fathy, N.; Alghamdi, A.S. Reduction Behavior and Characteristics of Metal Oxides in the Nanoscale. Metals 2022, 12, 2182. [Google Scholar] [CrossRef]
- Diagne, C.; Idriss, H.; Pearson, K.; Gómez-García, M.A.; Kiennemann, A. Efficient Hydrogen Production by Ethanol Reforming over Rh Catalysts. Effect of Addition of Zr on CeO2 for the Oxidation of CO to CO2. Comptes Rendus Chim. 2004, 7, 617–622. [Google Scholar] [CrossRef]
- Al-Shankiti, I.; Al-Otaibi, F.M.; Al-Salik, Y.; Idriss, H. Solar Thermal Hydrogen Production over CeO2 Based Materials. Top. Catal. 2013, 56, 1129–1138. [Google Scholar] [CrossRef]
- Lokteva, E.S.; Golubina, E.V. Metal-Support Interactions in the Design of Heterogeneous Catalysts for Redox Processes. Pure Appl. Chem. 2019, 91, 609–631. [Google Scholar]
- Wang, Y.; Arandiyan, H.; Bartlett, S.A.; Trunschke, A.; Sunf, H.; Scott, J.; Lee, A.F.; Wilson, K.; Maschmeyer, T.; Schlögl, R.; et al. Inducing Synergy in Bimetallic RhNi Catalysts for CO2 Methanation by Galvanic Replacement. Appl. Catal. B Environ. 2020, 277, 119029. [Google Scholar] [CrossRef]
- Fedorov, A.V.; Kukushkin, R.G.; Yeletsky, P.M.; Bulavchenko, O.A.; Chesalov, Y.A.; Yakovlev, V.A. Temperature-Programmed Reduction of Model CuO, NiO and Mixed CuO-NiO Catalysts with Hydrogen. J. Alloy. Comp. 2020, 844, 156135. [Google Scholar] [CrossRef]
- Kissinger, H.E. Reaction Kinetics in Differential Thermal Analysis. Anal. Chem. 1957, 29, 1702–1706. [Google Scholar] [CrossRef]
- Adnađević, B.J.; Mentus, S. The Kinetic Study of Temperature-Programmed Reduction of Nickel Oxide in Hydrogen Atmosphere. Chem. Eng. Sci. 2008, 63, 567–575. [Google Scholar]
- Ghaani, M.R.; Catti, M. Investigation on the Kinetic Mechanism of the Reduction of Fe2O3/CoO-Decorated carbon Xerogels: A Non-Isothermal Study. J. Solid State Chem. 2019, 277, 368–375. [Google Scholar] [CrossRef]
- Samoila, P.; Boutzeloit, M.; Especel, C.; Epron, F.; Marécot, O. Relationship Between the Structural Properties of Supported Bimetallic Pt–Rh Catalysts and their Performances for Methylcyclopentane ring opening. J. Catal. 2010, 276, 237–248. [Google Scholar] [CrossRef]
- Srisin Eaimsumang, S.; Prataksanon, P.; Pongstabodee, S.; Luengnaruemitchai, A. Effect of Acid on the Crystalline Phase of TiO2 Prepared by Hydrothermal Treatment and its Application in the Oxidative Steam Reforming of Methanol. Res. Chem. Intermed. 2020, 46, 1235–1254. [Google Scholar] [CrossRef]
- Kammert, J.; Moon, J.; Wu, Z. A review of the Interactions Between Ceria and H2 and the Applications to Selective Hydrogenation of Alkynes. Chin. J. Catal. 2020, 41, 901–914. [Google Scholar] [CrossRef]
- Al-Taweel, S.; Nadeem, M.A.; Idriss, H. A study of CexFe1-xO2 as a reducible oxide for the thermal hydrogen production from water. Energy Technol. 2021, 10, 2100491. [Google Scholar] [CrossRef]
- Boodts, J.C.F.; Trsdstti, S. Hydrogen Evolution on Iridium Oxide Cathodes. J. Appl. Electrochem. 1988, 19, 255–262. [Google Scholar] [CrossRef]
- Gao, J.; Liu, Y.; Liu, B.; Huang, K.W. Progress of Heterogeneous Iridium-Based Water Oxidation Catalysts. ACS Nano 2022, 16, 17761–17777. [Google Scholar] [CrossRef]
- Hunt, L.B. A History of Iridium Overcoming the Difficulties Of Melting and Fabrication. Platin. Met. Rev. 1987, 31, 32–41. [Google Scholar]
- Jin, R.; Peng, M.; Li, A.; Deng, Y.; Jia, Z.; Huang, F.; Ling, Y.; Yang, F.; Fu, H.; Xie, J.; et al. Low Temperature Oxidation of Ethane to Oxygenates by Oxygen over Iridium-Cluster Catalysts. J. Am. Chem. Soc. 2019, 141, 18921–18925. [Google Scholar] [CrossRef] [PubMed]
- Liu, F.; Pak, E.B.; Singh, B.; Jensen, C.M.; Goldman, A.S. Dehydrogenation of n-Alkanes Catalyzed by Iridium “Pincer” Complexes: Regioselective Formation of r-Olefins. J. Am. Chem. Soc. 1999, 121, 4086–4087. [Google Scholar] [CrossRef]
- Liang, Z.; Li, T.; Kim, M.; Asthagiri, A.; Weaver, J.F. Low-temperature Activation of Methane on the IrO2(110) Surface. Science 2017, 356, 299–303. [Google Scholar] [CrossRef] [PubMed]
- Seth, J.; Dubey, P.; Chaudhari, V.R.; Prasad, B.L.V. Preparation of Metal Oxide Supported Catalysts and Their Utilization for Understanding the Effect of a Support on the Catalytic Activity. New J. Chem. 2018, 42, 402–410. [Google Scholar] [CrossRef]
- Czioska, S.; Boubnov, A.; Escalera-López, D.; Geppert, J.; Zagalskaya, A.; Röse, P.; Saraçi, E.; Alexandrov, V.; Krewer, U.; Cherevko, S.; et al. Increased Ir–Ir Interaction in Iridium Oxide during the Oxygen Evolution Reaction at High Potentials Probed by Operando Spectroscopy. ACS Catal. 2021, 11, 10043–10057. [Google Scholar] [CrossRef]
- Alrushaid, M.; Wahab, K.A.; Nadeem, M.A.; Idriss, H. Extracting Turn Over Frequencies of Electron Transfer in Heterogeneous Catalysis. A study of IrO2-TiO2 Anatase for Water Oxidation Using Ce4+ Cations. Catalysts 2021, 11, 1030. [Google Scholar] [CrossRef]
- Bashir, S.; Idriss, H. Temperature Programmed Desorption of ethanol Over TiO2 and M/TiO2 (M = Au, Pd and Au-Pd) Catalysts: Dehydration Versus de-Carbonylation Pathways. Top. Catal. 2018, 61, 487–498. [Google Scholar] [CrossRef]
- Bashir, S.; Idriss, H. Mechanistic Study of the Role of Au, Pd and Au-Pd on the Surface Photo-Reactions of Ethanol Over TiO2. Catal. Sci. Technol. 2017, 7, 5301–5320. [Google Scholar] [CrossRef]
- King, R.; Idriss, H. Acetone Reactions Over the Surfaces of Polycrystalline UO2. A Kinetic and Spectroscopic Study. Langmuir 2009, 25, 4543–4555. [Google Scholar] [CrossRef]
- Bashir, S.; Idriss, H. The Reaction of Hydrogen Peroxide and Propylene to Propylene Oxide on the Surface of CeO2: An in situ FTIR Spectroscopy and Temperature Programmed Desorption Study. J. Chem. Phys. 2020, 152, 044712. [Google Scholar] [CrossRef]
- Wilson, J.R.; Idriss, H. Reactions of Ammonia on Stoichiometric and Reduced TiO2(001) Single Crystal Surfaces. Langmuir 2004, 20, 10956–11096. [Google Scholar] [CrossRef]
- Millican, S.L.; Androshchuk, I.; Tran, J.T.; Trottier, R.M.; Bayon, A.; Al Salik, Y.; Idriss, H.; Musgrave, C.B.; Weimer, A.W. Oxidation Kinetics of Hercynite Alloys for Solar Thermochemical Fuel Production. Chem. Eng. J. 2020, 401, 126015. [Google Scholar] [CrossRef]
- Yarar, M.; Bouziani, A.; Uner, D. Pd as a Reduction Promoter for TiO2: Oxygen and Hydrogen Transport at 2D and 3D Pd Interfaces with TiO2 Monitored by TPR, Operando 1H NMR and CO Oxidation Studies. Catal. Comm. 2023, 174, 106580. [Google Scholar] [CrossRef]
- Hernaìndez-Cristoìbal, O.; Díaz, G.; Gómez-Cortés, A. Effect of the Reduction Temperature on the Activity and Selectivity of Titania-Supported Iridium Nanoparticles for Methylcyclopentane Reaction. Ind. Eng. Chem. Res. 2014, 53, 10097–10104. [Google Scholar] [CrossRef]
- Yu, H.; Wada, K.; Fukutake, T.; Feng, Q.; Uemura, S.; Isoda, K.; Hirai, T.; Iwamoto, S. Effect of Phosphorus-Modification of Titania Supports on the Iridium Catalyzed Synthesis of Benzimidazoles. Catal. Today 2021, 375, 410–417. [Google Scholar] [CrossRef]
- Rice, R.W.; Chien, C.C. Simulation of Supported Iridium Catalyst Sintering and Redispersion. J. Catal. 1987, 103, 140–150. [Google Scholar] [CrossRef]
- Zhang, Y.; Zhang, Z.; Yang, X.; Wang, R.; Duan, H.; Shen, Z.; Li, L.; Su, Y.; Yang, R.; Zhang, Y.; et al. Tuning Selectivity of CO2 Hydrogenation by Modulating the Strong Metal–Support Interaction Over Ir/TiO2 catalysts. Green Chem. 2020, 22, 6855–6861. [Google Scholar] [CrossRef]
- Pfeifer, V.; Jones, T.E.; Vélez, J.J.V.; Massué, C.; Arrigo, R.; Teschner, D.; Girgsdies, F.; Scherzer, M.; Greiner, M.T.; Allan, J. The Electronic Structure of Iridium and its Oxides. Surf. Interface Anal. 2016, 48, 261–273. [Google Scholar] [CrossRef]
- Bashir, S.; Wahab, A.K.; Idriss, H. Synergism and Photocatalytic Water Splitting to Hydrogen Over Pt/TiO2 Catalysts: Effect Particle Size. Catal. Today 2015, 240, 242–247. [Google Scholar] [CrossRef]
- Gamisch, B.; Huber, L.; Gaderer, M.; Dawoud, B. On the Kinetic Mechanisms of the Reduction and Oxidation Reactions of Iron Oxide/Iron Pellets for a Hydrogen Storage Process. Energies 2022, 15, 8322. [Google Scholar] [CrossRef]
- Munteanu, G.; Segal, E. Sestak–Berggren Function in Temperature-Programmed Reduction. J. Therm. Anal. Calorim. 2010, 101, 89–95. [Google Scholar] [CrossRef]
- Bond, G.C.; Keane, M.A.; Kral, H.; Lercher, J.A. Compensation Phenomena in Heterogeneous Catalysis: General Principles and a Possible Explanation. Catal. Rev. Sci. Eng. 2010, 42, 323–383. [Google Scholar] [CrossRef]
- Lup, A.N.K.; Abnisa, F.; Daud, W.M.A.; Aroua, M.K. Temperature-Programmed Reduction of Silver(I) Oxide Using a Titania-Supported Silver Catalyst Under a H2 Atmosphere. J. Chin. Chem. Soc. 2019, 66, 1443–1455. [Google Scholar] [CrossRef]
- Manchili, S.K.; Wendel, J.; Hryha, E.; Nyborg, L. Analysis of Iron Oxide Reduction Kinetics in the Nanometric Scale Using Hydrogen. Nanomaterials 2020, 10, 1276. [Google Scholar] [CrossRef]
- Musolino, M.G.; Busacca, C.; Mauriello, F.F.; Rosario Pietropaolo, R. Aliphatic Carbonyl Reduction Promoted by Palladium Catalysts Under Mild Conditions. Appl. Catal. A Gen. 2010, 379, 77–86. [Google Scholar] [CrossRef]
- Wei, G.; Wang, Y.; Huang, C.; Gao, Q.; Wang, Z.; Xu, L. The stability of MEA in SPE Water Electrolysis for Hydrogen Production. Int. J. Hydrog. Energy 2010, 35, 3951–3957. [Google Scholar] [CrossRef]
- Hara, M.; Asami, K.; Hashimoto, K.; Masumoto, T. An X-ray Photoelectron Spectroscopic Study of Electrocatalytic Activity of Platnium Group Metals for Chlorine revolution. Electrochem. Acta 1983, 28, 1073–1081. [Google Scholar] [CrossRef]
- Amaya, S.A.D. Electrochemical Evaluation of Oxygen Evolution Reaction Electrocatalysts: The Case of Ultraporous Iridium Oxide and Iridium-Based Mixed Oxide Materials. Ph.D. Thesis, Institut Polytechnique de Paris, Paris, France, 2021. [Google Scholar]


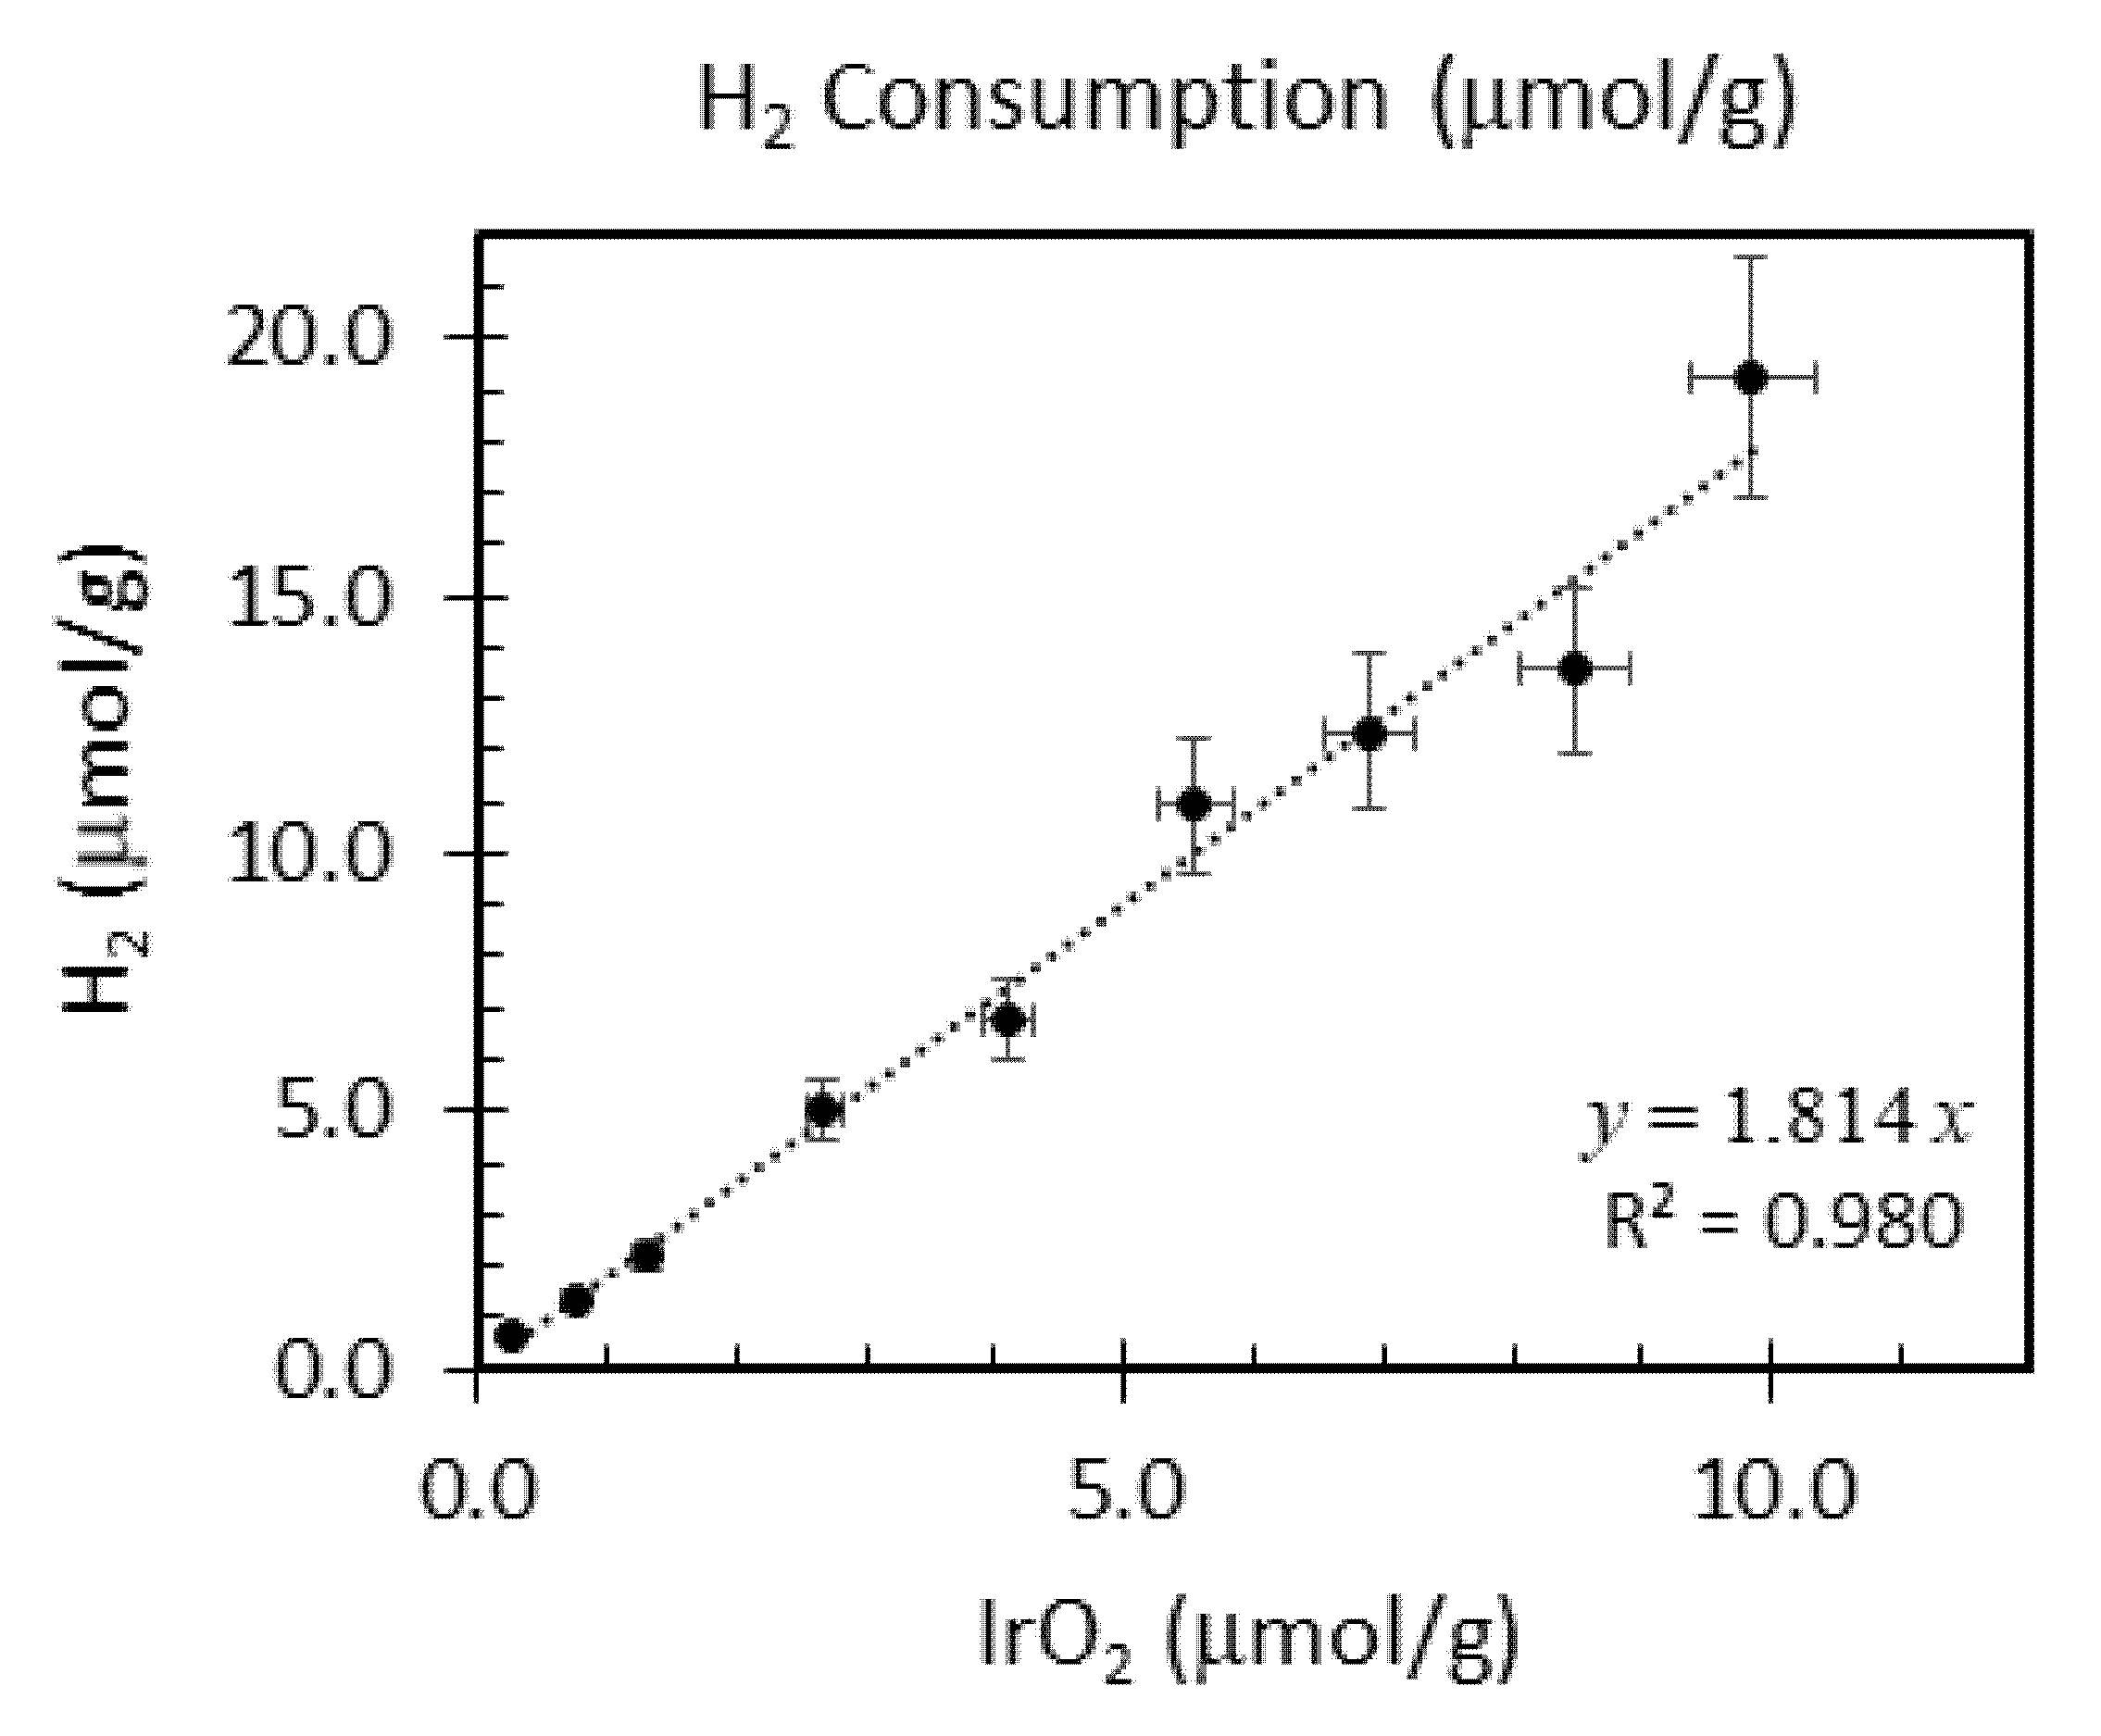
| Ir wt.% Loading ±0.01 | Temperature Range °C ±1 | Integrated Peak Area (cm3/g) ±0.1 | IrO2 (μmol/g) | Total H2 Consumption (μmol/g) ±5% | H/Ir ±0.2 |
|---|---|---|---|---|---|
| 0.1 | 86–156 | 0.24 | 0.270 | 0.62 | 4.7 |
| 0.3 | 82–142 | 0.53 | 0.781 | 1.37 | 3.5 |
| 0.5 | 50–179 | 0.83 | 1.32 | 2.17 | 3.3 |
| 1.0 | 28–200 | 1.9 | 2.68 | 5.02 | 3.7 |
| 1.5 | 82–140 | 2.51 | 4.10 | 6.78 | 3.3 |
| 2.0 | 76–252 | 4.01 | 5.55 | 11.0 | 4.0 |
| 2.5 | 76–261 | 4.57 | 6.88 | 12.4 | 3.6 |
| 3.0 | 47–243 | 4.46 | 8.47 | 13.6 | 3.2 |
| 3.5 | 81–261 | 6.94 | 9.85 | 19.2 | 3.9 |
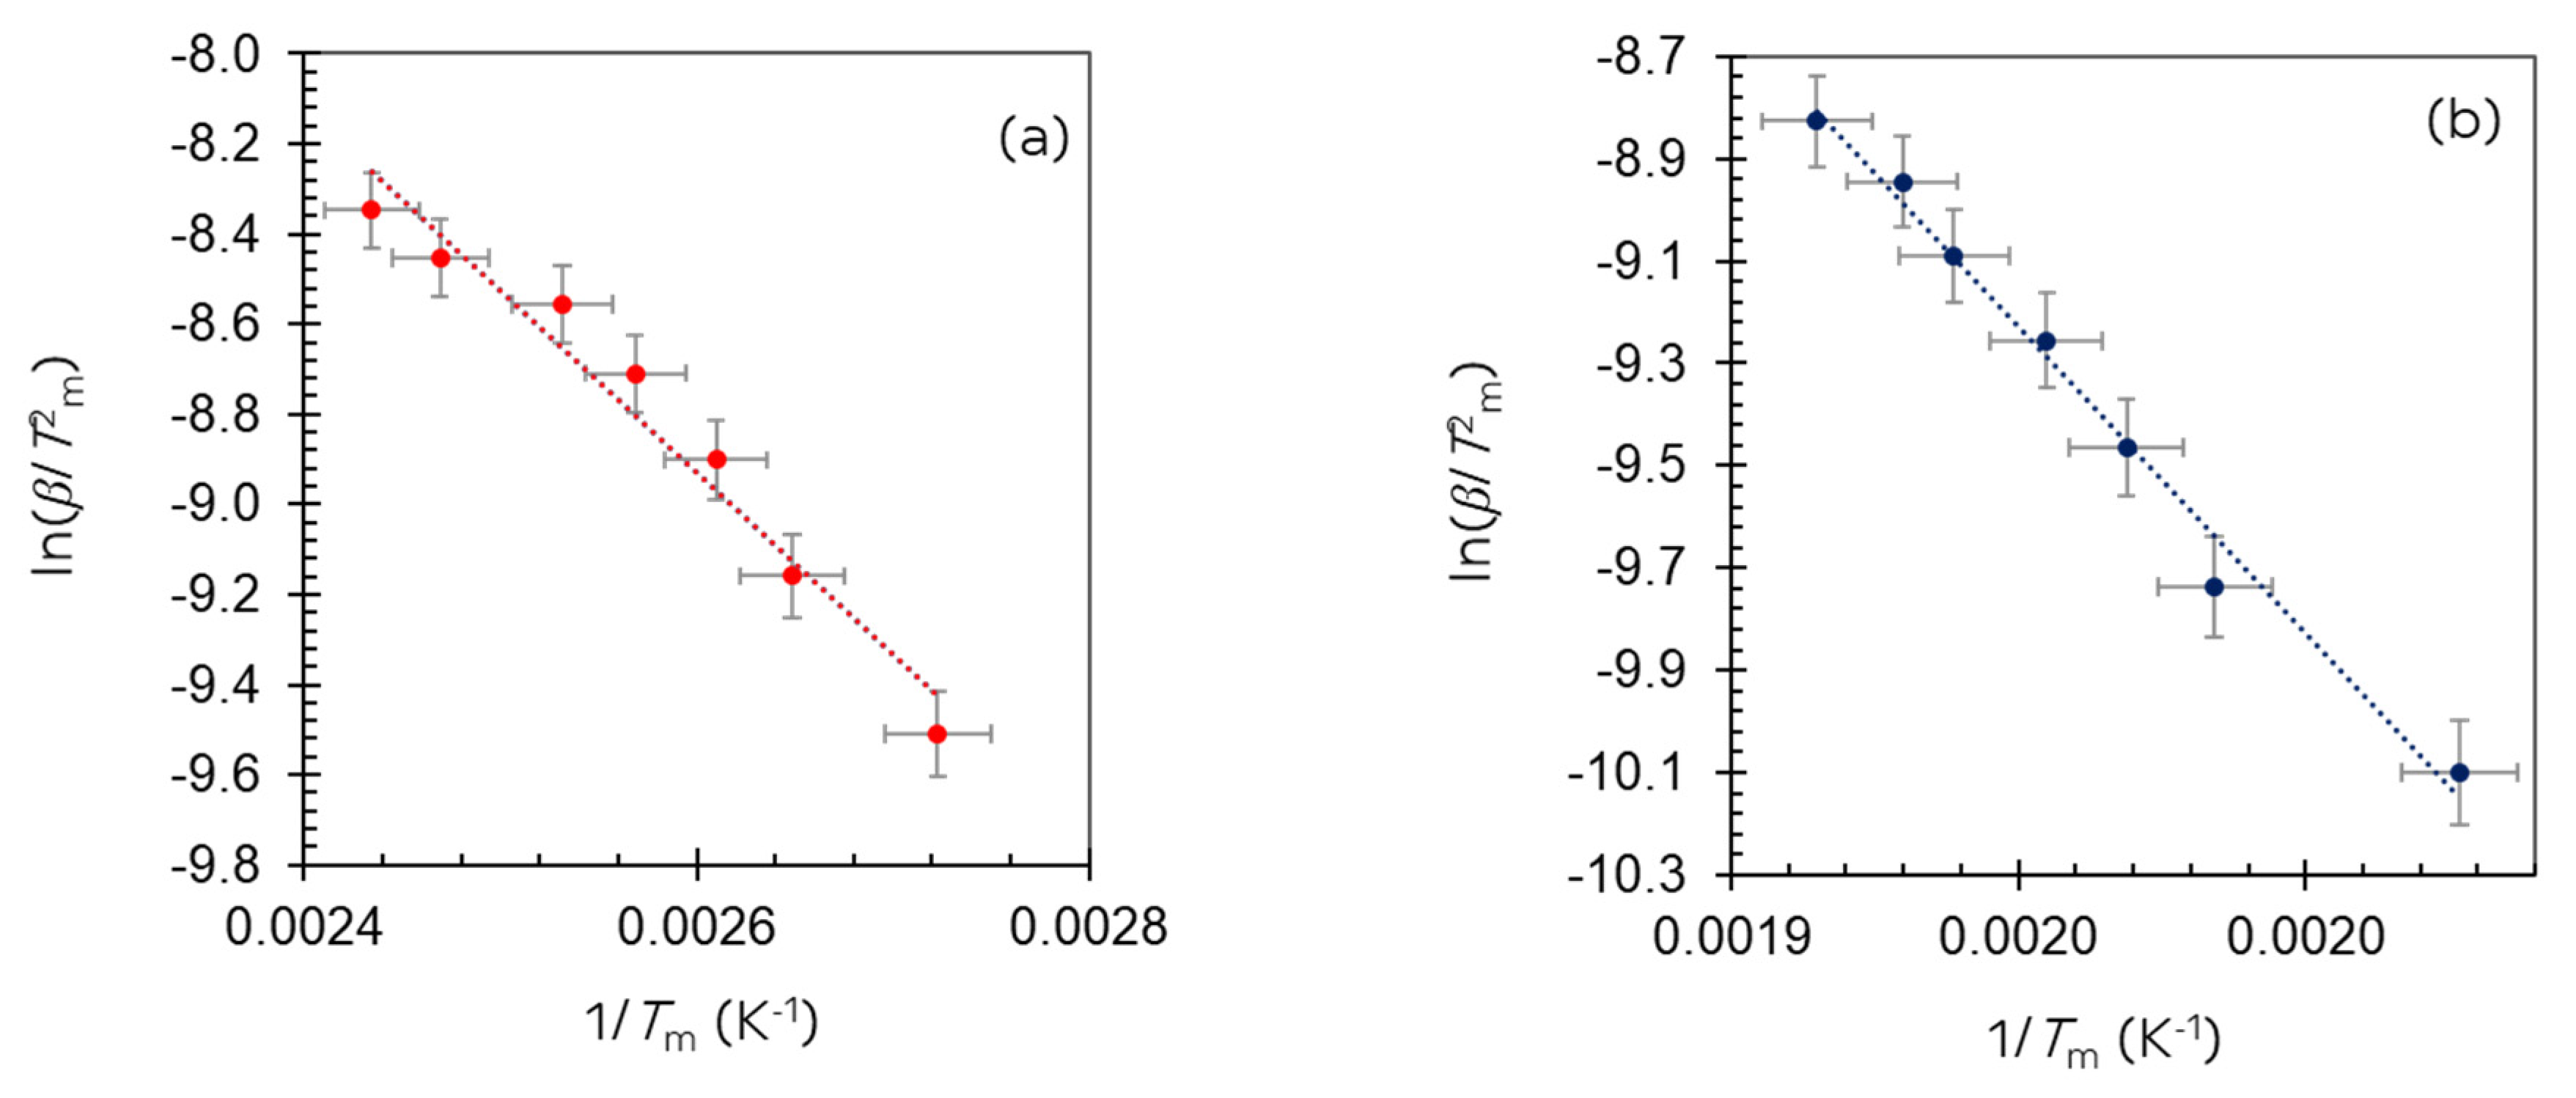
| β (K/min) | Integrated Peak Area (cm3/g) ±0.1 | Trapezoid Area (Using end Points as Baseline) ± 0.05 | H2 (mL/g) ± 0.01 | H/Ir ±0.2 | Tm (°C) | ||
|---|---|---|---|---|---|---|---|
| 1st Peak ±1 | 2nd Peak ±1 | 3rd Peak ±1 | |||||
| 10 | 6.83 | 0.72 | 0.43 | 4.23 | 94 | 220 | 309 |
| 15 | 6.82 | 0.90 | 0.41 | 4.23 | 105 | 231 | 330 |
| 20 | 6.50 | 1.08 | 0.40 | 4.02 | 110 | 235 | 335 |
| 25 | 6.31 | 1.52 | 0.39 | 3.91 | 104 | 239 | 331 |
| 30 | 6.48 | 1.73 | 0.39 | 4.01 | 117 | 243 | 333 |
| 35 | 6.28 | 2.07 | 0.39 | 3.89 | 132 | 245 | 343 |
| 40 | 6.00 | 2.20 | 0.37 | 3.71 | 138 | 249 | 348 |
| Kinetic Parameters | n-Order Reaction | Sestak-Berggren |
|---|---|---|
| apparent activation energy (kJ/mol) | 150 | 102 |
| pre-exponential factor (s−1) | 6.5 × 10¹⁹ | 1013 |
| n | 3.2 | 2.56 |
| m | - | 0.21 |
| p | - | 0.06 |
TM = 373 K | 0.384 | 0.384 |
| Kinetic Parameters | n-Order Reaction | n-Dimensional Nucleation | Phase Boundary Controlled |
|---|---|---|---|
| apparent activation energy (kJ/mol) | 78 | 75 | 36 |
| pre-exponential factor (s−1) | 2 × 10⁶ | 7 × 10⁵ | 10 |
| n | 1.4 | 0.7 | 2.7 |
TM = 503 K | 0.0952 | 0.0952 | 0.0952 |
| Reaction Model | |
|---|---|
| n-dimensional nucleation-Avrami-Erofeev | |
| n-order reaction | |
| Phase boundary-controlled | |
| 1-D diffusion | |
| 2-D diffusion | |
| 3-D diffusion | |
| Sestak–Berggren |
Disclaimer/Publisher’s Note: The statements, opinions and data contained in all publications are solely those of the individual author(s) and contributor(s) and not of MDPI and/or the editor(s). MDPI and/or the editor(s) disclaim responsibility for any injury to people or property resulting from any ideas, methods, instructions or products referred to in the content. |
© 2023 by the authors. Licensee MDPI, Basel, Switzerland. This article is an open access article distributed under the terms and conditions of the Creative Commons Attribution (CC BY) license (https://creativecommons.org/licenses/by/4.0/).
Share and Cite
Batubara, S.; Alrushaid, M.; Amtiaz Nadeem, M.; Idriss, H. Study of the Kinetics of Reduction of IrO2 on TiO2 (Anatase) by Temperature-Programmed Reduction. Inorganics 2023, 11, 66. https://doi.org/10.3390/inorganics11020066
Batubara S, Alrushaid M, Amtiaz Nadeem M, Idriss H. Study of the Kinetics of Reduction of IrO2 on TiO2 (Anatase) by Temperature-Programmed Reduction. Inorganics. 2023; 11(2):66. https://doi.org/10.3390/inorganics11020066
Chicago/Turabian StyleBatubara, Shahad, Mogbel Alrushaid, Muhammad Amtiaz Nadeem, and Hicham Idriss. 2023. "Study of the Kinetics of Reduction of IrO2 on TiO2 (Anatase) by Temperature-Programmed Reduction" Inorganics 11, no. 2: 66. https://doi.org/10.3390/inorganics11020066
APA StyleBatubara, S., Alrushaid, M., Amtiaz Nadeem, M., & Idriss, H. (2023). Study of the Kinetics of Reduction of IrO2 on TiO2 (Anatase) by Temperature-Programmed Reduction. Inorganics, 11(2), 66. https://doi.org/10.3390/inorganics11020066