Article

Stabilization of {Ag20(StBu)10} and {Ag19(StBu)10} Toroidal Complexes in DMSO: HPLC-ICP-AES, PL, and Structural Studies

by
Victoria V. Volchek
1,
Alexey S. Berezin
1,
Maxim N. Sokolov
1 and
Pavel A. Abramov
1,2,*
1
Nikolaev Institute of Inorganic Chemistry SB RAS, 3 Akad. Lavrentiev Ave, 630090 Novosibirsk, Russia
2
Institute of Natural Sciences and Mathematics, Ural Federal University Named after B.N. Yeltsin, 620075 Yekaterinburg, Russia
*
Author to whom correspondence should be addressed.
Inorganics 2022, 10(12), 225; https://doi.org/10.3390/inorganics10120225
Submission received: 11 October 2022 / Revised: 21 November 2022 / Accepted: 22 November 2022 / Published: 26 November 2022

Abstract

:
The presence of DMSO provides a unique ability to stabilize silver toroidal complexes in the direct reaction between AgStBu and AgNO3 at 80 °C. Slow cooling results in large crystals of [NO3@Ag19.2(StBu)10(DMSO)5.2(NO3)8.2]·3DMSO (1), which were isolated and characterized by single crystal X-ray diffraction (SCXRD) analysis. The crystal structure contains both {Ag20(StBu)10} and {Ag19(StBu)10} clusters. The solution of these material in DMSO was studied with HPLC techniques, which demonstrated the presence of both complexes in solution. The use of [SiW12O40]4– as counter anion gives crystals of a double complex salt [Ag17.8(NO3)3.8(StBu)10][SiW12O40]·30DMSO (2) under the same conditions. Temperature-dependent photoluminescence (PL) was studied.

Graphical Abstract

1. Introduction

Reaction of (AgSR)n polymers with Ag+ source in different organic solvents produces a huge pool of polynuclear silver complexes of different size and topologies [1,2,3,4]. Some small anions can occupy the central cavity of such cages playing two possible roles: (i) template for the self-assembly process or (ii) guest for the complex stabilization.
In particular, there is a class of torus-like silver complexes of {X@Ag20SR10} (Scheme 1) with different guest molecules (X). Here a few CO32–-templated Ag20 cluster thiolates exist. For example, in {[CO3@Ag20(StBu)10(CH3COO)8(DMF)2]·2H2O}n the Ag–CO3 bond distances range from 2.26(2) to 2.56(2) Å. Sun et al. also found [CO3@Ag20(StBu)10(OAc)8(DMF)4]·DMF·CH3OH [5] and [SO4@Ag20(SiBu)10(PhSO3)8(H2O)4⋅2H2O]n with sulfate in the cluster center [6]. With different thiolates Mak et al. reported {Ag[CO3@Ag20(SiPr)10(CO2CF3)9(CO2HCF3)(CH3OH)2]}n and {Ag2[CO3@Ag20(SCy)10(CO2CF3)10(CO2HCF3)2(H2O)2]·3H2O·3CH3OH}n 2D coordination networks (d(Ag-O) 2.534–2.694 Å) [7]. Zhang et al. presented a set of carbonate-centered complexes [(CO3)@Ag20(StBu)10(NO3)8(DMAc)4], [(CO3)@Ag20(StBu)10(C6H5COO)8(DMAc)2]·2CH3CN, [(CO3)@Ag20(StBu)10(C12H6O2NCH2COO)8]·4CH3CN and [(CO3)@Ag20(StBu)10(CpFeC5H4COO)8(CH3CN)4]·CH3CN·2H2O (DMAc = N,N-dimethylacetamide) [8]. Typical Ag-CO3 distances vary from 2.4 to 2.5 Å. It should be noted that in all those structures two carboxylate anions block the central cavity by coordination to the rim Ag atoms.
Several examples of Cl templated silver thiolate clusters have been reported. A family of coordination polymers including [Cl@Ag14(StBu)8(CF3COO)5(bpy)2(DMF)]·2DMF, [Cl@Ag15(StBu)8(CF3COO)5.67(NO3)0.33(bpy)2(DMF)2]·4.3DMF·H2O, and [Cl@Ag16(StBu)8(CF3COO)7(DMF)4(H2O)]·1.5DMF was reported by Bakr et al. [9]. The chloride anion can serve as a template for a larger Ag20 cluster isolated as [Cl@Ag20(StBu)10(CF3COO)2]·(CF3COO)7·5CH3OH. Here it is trapped inside the core as a supramolecular guest with very long Ag∙∙∙Cl distances of 3.4–3.5 Å [10]. In the structure of {S@Ag12S6@Ag36(tBuCC)12(tBuS)12(nBuPO3)2(nBuPO3H)6}, the templating S2– results from C-S bond cleavage [11]. The S@Ag12 central fragment is related to I@Ag12 and I@Cu12 units observed in [I@Ag12I4{S2P(CH2CH2Ph)2}6] and [PyH][I@Cu12(TpMo)4S16] [12,13].
Recently we reported new large-sized silver thiolates [NO3@Ag20(StBu)10(NO3)9(DMF)6] and [NO3@Ag20(StBu)10(NO3)8(NMP)8][NO3@Ag19(StBu)10(NO3)8(NMP)6]2(NO3), which were isolated from DMF and NMP (N-methylpyrrolidone) solutions, correspondingly. The presence of Br in the reaction mixture can affect self-assembly process leading to [Br@Ag16(StBu)8(NO3)5(DMF)3](NO3)2 host–guest complex [14]. Sometimes ligands can play a crucial role in intra-cluster and inter-cluster assembly [15]. A lot of interesting co-crystals was reported by M. Jansen [16], N. Zheng [17], and Q.-M. Wang [18].
In this research, we present our studies concerning self-assembly of AgStBu and Ag+ in DMSO. Here we present the first analytical studies of silver thiolate complexes using separation techniques. The PL data show nice correlation with the structural and analytical results.

2. Results and Discussion

2.1. Synthesis and Structure

Recently we proposed a simple way to produce {Ag20(StBu)10} complexes in DMF and NMP solutions [14]. According to the SCXRD data, crystals collected from DMSO had the same unit cell parameters as grown from DMF. The purity of all solvents is crucial for successful synthesis of the Ag clusters. The use of commercial DMF resulted in fast silver reduction even at −30 °C. In the case of DMSO only freshly distilled solvent is strictly recommended for the synthesis. Another very important point is correct temperature regime. Indeed, the use of freshly distilled DMSO gives an advantage to heat the reaction solution over 80 °C, thus significantly increasing the reaction rate. Based on these two principles we developed a very efficient way to generate Ag-StBu torus-like complexes, which can be isolated just after cooling the reaction solution. The use of this protocol gives an advantage to isolate complex 1 in excellent yield up to 60%. Unfortunately, the isolated crystalline material is light sensitive and progressively becomes black under irradiation. Moreover, traces of organics on the vial walls (unsatisfactory cleaned vials or organics in the lab air) immediately destroy silver thiolate complexes.
The crystal structure of 1 was studied with single crystal X-ray diffraction analysis (See Supplementary Materials, Table S1). The main structural unit is a torus like defective [NO3@Ag20-x(StBu)10(DMSO)6-x(NO3)10-x] complex (Figure 1). The refinement gives the x value close to 0.8. Accordingly, the bulk formula can be defined as [NO3@Ag19.2(StBu)10(DMSO)5.2(NO3)8.2]. Formulation Ag19.2 means the presence of both {Ag20(StBu)10} and {Ag19(StBu)10} complexes in one crystal with the second one being a major component. Two defective positions of Ag atoms are marked in cyan (Figure 1). Four positions with closely disordered Ag atoms are marked in pink. The complex geometry is very close to an earlier reported [NO3@Ag20(StBu)10(NO3)9(DMF)6] complex [14]. All NO3 anions have practically the same geometry in both structures. Ag-O distances for the inner NO3 anions vary in 2.66–2.68 Å interval, which can be compared with 2.5–2.8 Å found in the structure with coordinated DMF. Presence of defects in Ag-atom positions can be a key to speciation in solution. The loss of cyan-marked {AgDMSO)} fragments or pink marked rim Ag atoms can generate {Ag19} or {Ag18} complexes in solution.
Crystals of 1 demonstrate good stability toward light exposure and vacuum drying. Grey coloration of the crystalline sample can be detected after keeping several days in air at ambient temperature. X-ray powder diffraction data show crystallinity loss after acetone washing and further vacuum drying (Figure S1).
Addition of [H4SiW12O40] to the AgNO3/AgStBu reaction mixture results in the formation of 2 upon cooling. It should be noted that addition of [H3PW12O40] or [H3PMo12O40] did not produce crystals. In the structural model of 2, silver nanoclusters and polyoxometalate (POM) anions form pseudo layers oriented in [011] crystal direction (Figure 2). The layers alternate in a ABAB∙∙∙ motif. Inside each layer, both silver clusters and POM anions fill the space according to 36 plane net topology (more about topologies can be found here [19]). The structure cannot be well refined due to strong disordering of POM anions, Ag thiolate clusters, coordinated and solvated DMSO molecules and NO3 anions. X-ray powder diffraction analysis results are in a good agreement with SCXRD data (Figure S2). The complex composition was found based on analytical data. It should be noted that refinement give 17.83 Ag atom per silver thiolate nanocluster. This means presence of more defective {Ag20(StBu)10} units in the crystal structure.

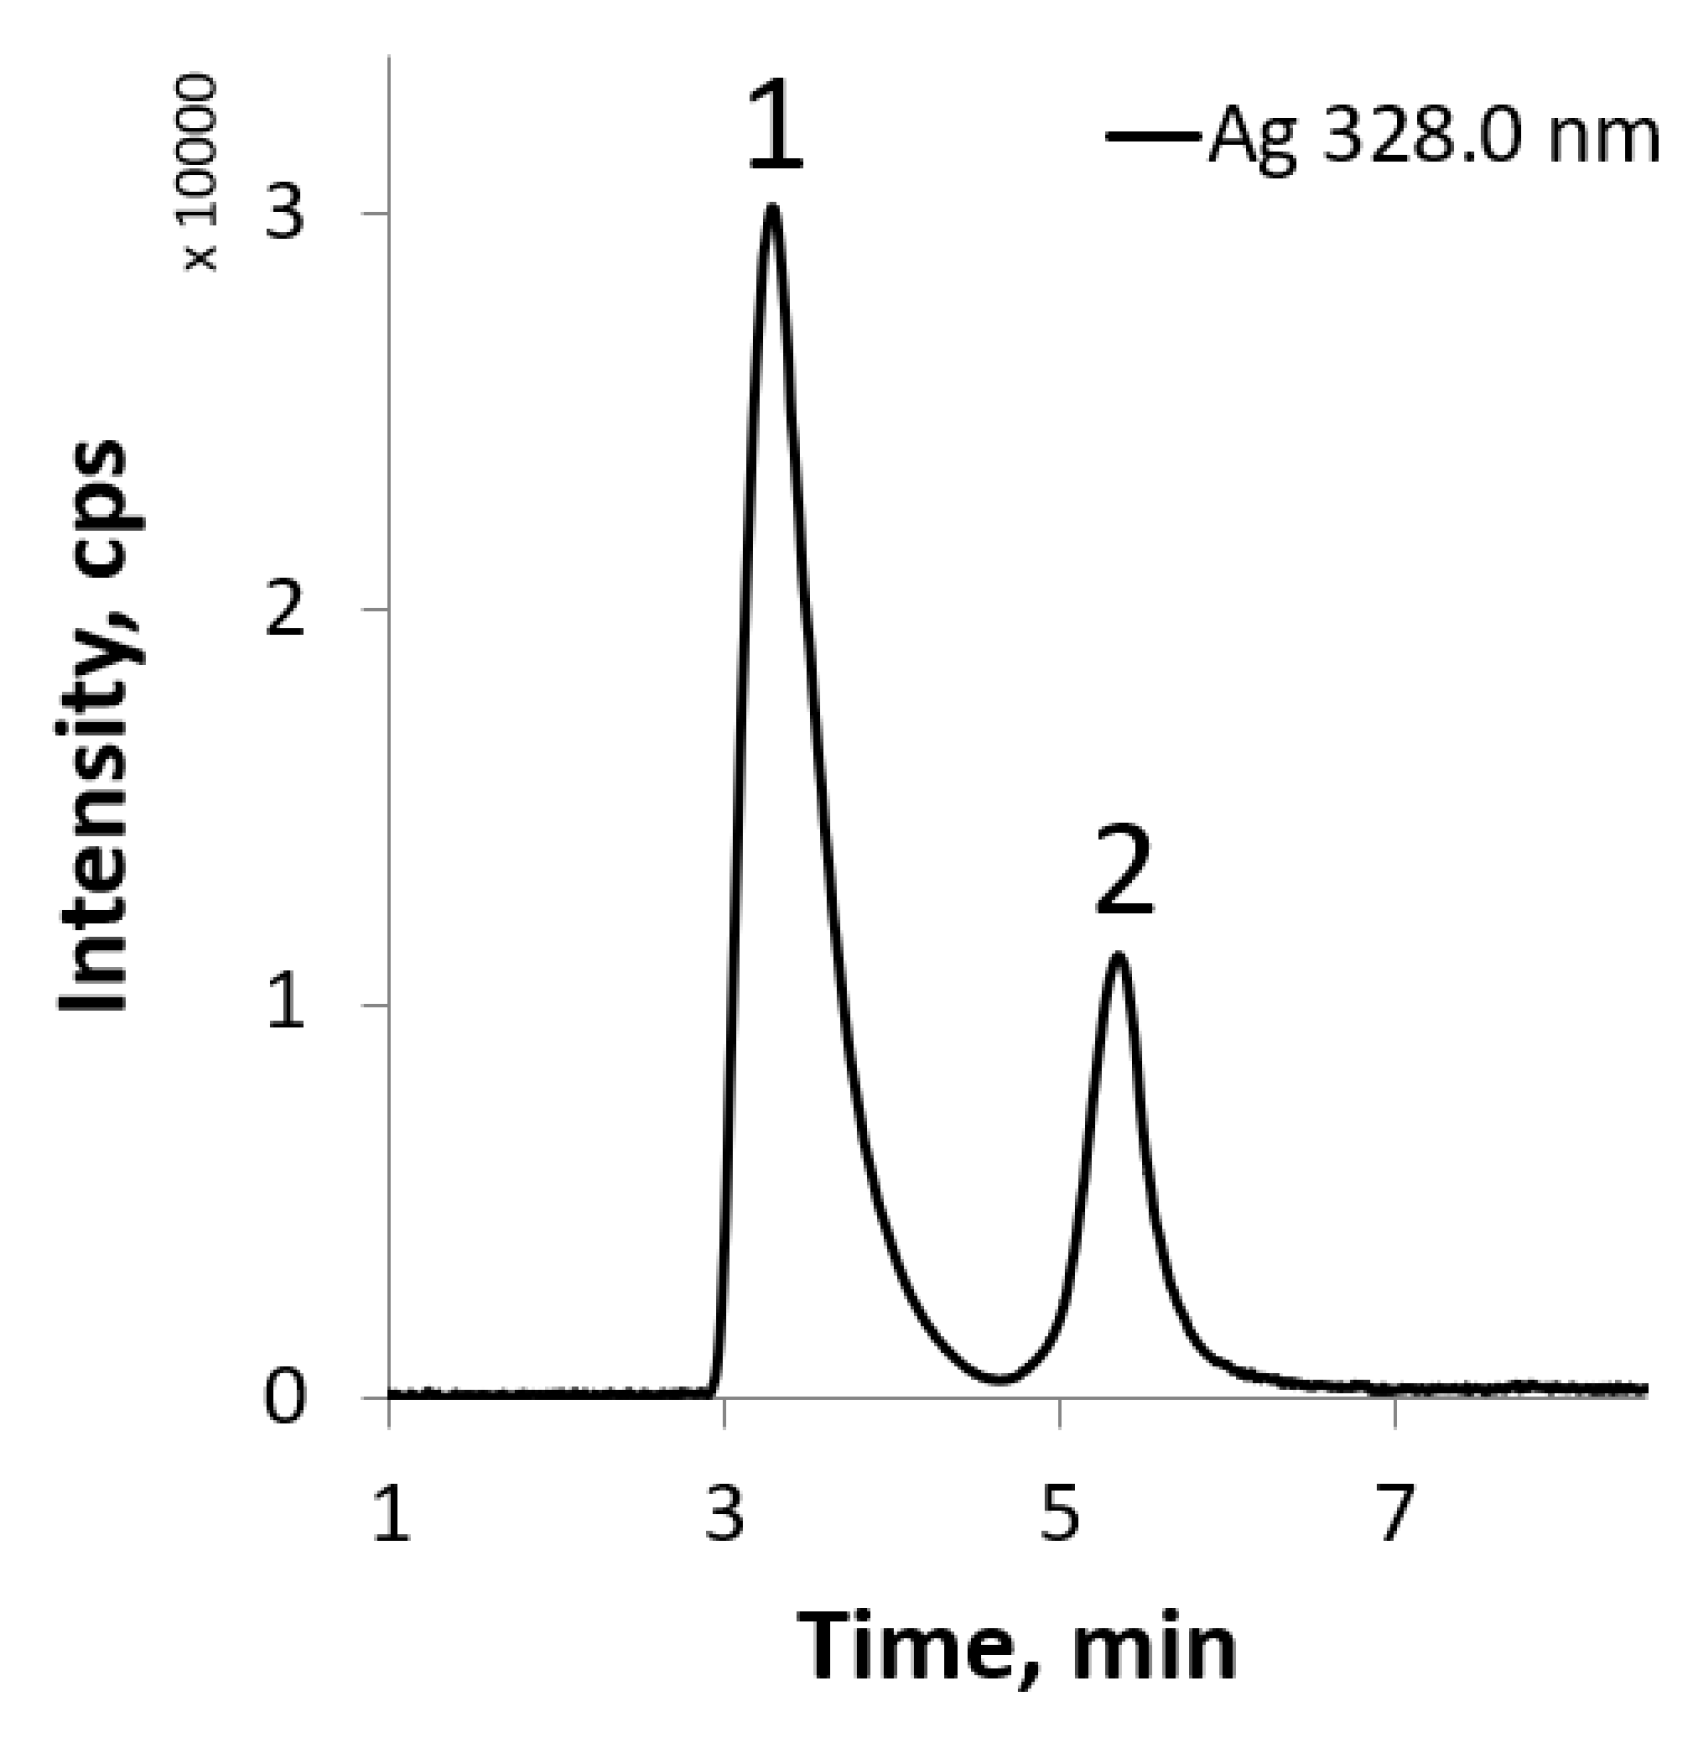
2.2. Chromatography Studies

Adaptation of liquid chromatography to the study of polynuclear silver thiolates has been realized as specific modification of the silica gel with Ag+ ions. It should be noted, silver covalently anchored onto the thiol moiety of a mercaptopropyl modified silica gel has been tested for the separation of polycyclic aromatic hydrocarbons [20]. This approach was applied for the liquid chromatographic analysis of unsaturated fatty acid ethyl esters, triglycerols (TAGs), and long-chain alkenones [21] or mono-, di-, and triglycerols [22,23]. In fact, there is no information about analytical chemistry or separation of silver thiolate complexes in solution. From our previous data obtained from the HR-ESI-MS analysis of CH3CN solutions of [NO3@Ag20(StBu)10(NO3)9(DMF)6], [NO3@Ag20(StBu)10(NO3)8(NMP)8][NO3@Ag19(StBu)10(NO3)8(NMP)6]2(NO3), and [Br@Ag16(StBu)8(NO3)5(DMF)3](NO3)2 we can propose the appearance of a huge number of equilibrated species in such solutions [14]. Such equilibria, without doubt, will be very sensitive to concentration or solvent. Here we used straightforward HPLC-ICP-AES technique [24] for the analysis of Ag-StBu species.
Crystals of 1 were dissolved in DMSO to extract the information about real complex forms in solution. The HPLC-ICP-AES chromatogram shows two baseline-resolved peaks (tR = 3.3 min, 5.3 min), that confirms the presence of {Ag19}n+ (peak 1 in Figure 3) and {Ag20}n+ (peak 2 in Figure 3) species in a ratio of 77:23, according to HPLC-ICP-AES analysis. The eluting species are detected by monitoring the silver atomic emission line at 328.0 nm following the separation by high-performance liquid chromatography. Adding an ion-pairing reagent (sodium dodecyl sulfate, SDS) to the mobile phase does not significantly affect the chromatographic behavior of the species but increases the retention time, which can be associated with an interaction of the cationic analyte with SDS. Thus, we indeed found two peaks with the ratio nearly matching found by crystal structure refinement.
The combination of structural and chromatographic data gives an assignment of each observed peak, which is the base for further solution studies. The products of the reaction between AgNO3 (100 mg) and AgStBu (76 mg) in 3 mL of DMSO were monitored using combined HPLC-ICP-AES. The obtained chromatogram (Figure 4a) of a freshly prepared solution of silver clusters shows two baseline-resolved peaks (tR = 3.3 min, 5.3 min), reflecting the presence of {Ag19(StBu)10} and {Ag20(StBu)10} species in a ratio of 77:23. The chromatogram of this solution aged for 8 h (Figure 4b) shows two peaks with percentage ratio and retention times the same as for the freshly prepared solution, but the intensity of the peaks decreased by a factor of 3.6, which can be associated with the products crystallization.
Similar behavior was observed for the products of the reaction between AgSO3CF3 (100 mg) and AgStBu (76 mg) in DMSO (3 mL). The HPLC-ICP-AES chromatogram of the freshly prepared solution (Figure 5a) also shows two resolved baseline peaks (tR = 3.3 min, 5.3 min); however, the replacement of the AgNO3 reagent by AgSO3CF3 led to a slight change in the ratio of the resulting products, which was 70:30 for {Ag19(StBu)10} and {Ag20(StBu)10}, respectively. Keeping the solution for 8 h (Figure 5b) also led to a 3.5-fold decrease in the peak intensity due to the product crystallization.
From these observations following conclusions can be drawn: (i) The essential stability of {Ag20(StBu)10} structural type in solution; (ii) the change of NO3 for SO3CF3 does not affect the formation of the torus-like silver thiolate complexes; (iii) the ratio between the two species remains constant indicating frozen equilibrium.
The comparison between our earlier data [14] from HR-ESI-MS measured in CH3CN solution and HPLC-ICP-AES for DMSO shows better stability of DMSO solutions. In the literature there are two different dynamic processes reported for the Ag nanoclusters. Bakr et al. observed complete thiolate-for-thiolate exchange for [Ag44(SR)30]4– [25]. Wang et al. found isotopic exchange between [107Ag44(SR)30] and [109Ag44(SR)30] (SR = 4-mercaptobenzoic acid) nanoclusters resulting in complete exchange of all Ag atoms in the [Ag44(SR)30] structure [26]. In our studies we found stability of the {Ag19(StBu)10} and {Ag20(StBu)10} cluster cores, but the DMSO/NO3 exchange can still occur and must be studied with other techniques.
To study the species evolution in the reaction solution we keep NO3-containing solution for 3 months. The changes were checked by UV-VIS and HPLC-ICP-AES techniques. We found appearance of a new peak in the UV-VIS spectrum at 350 nm indicating the presence of a new complex in solution (peak 1 in Figure 6, left). The results from hyphenated method confirm this reflecting a new peak with tR = 2.71 min (Figure 6, right). Taking into account the tendency to reduce tR with reducing of the Ag atoms number we can suggest the formation of {Ag18} cluster during aging.

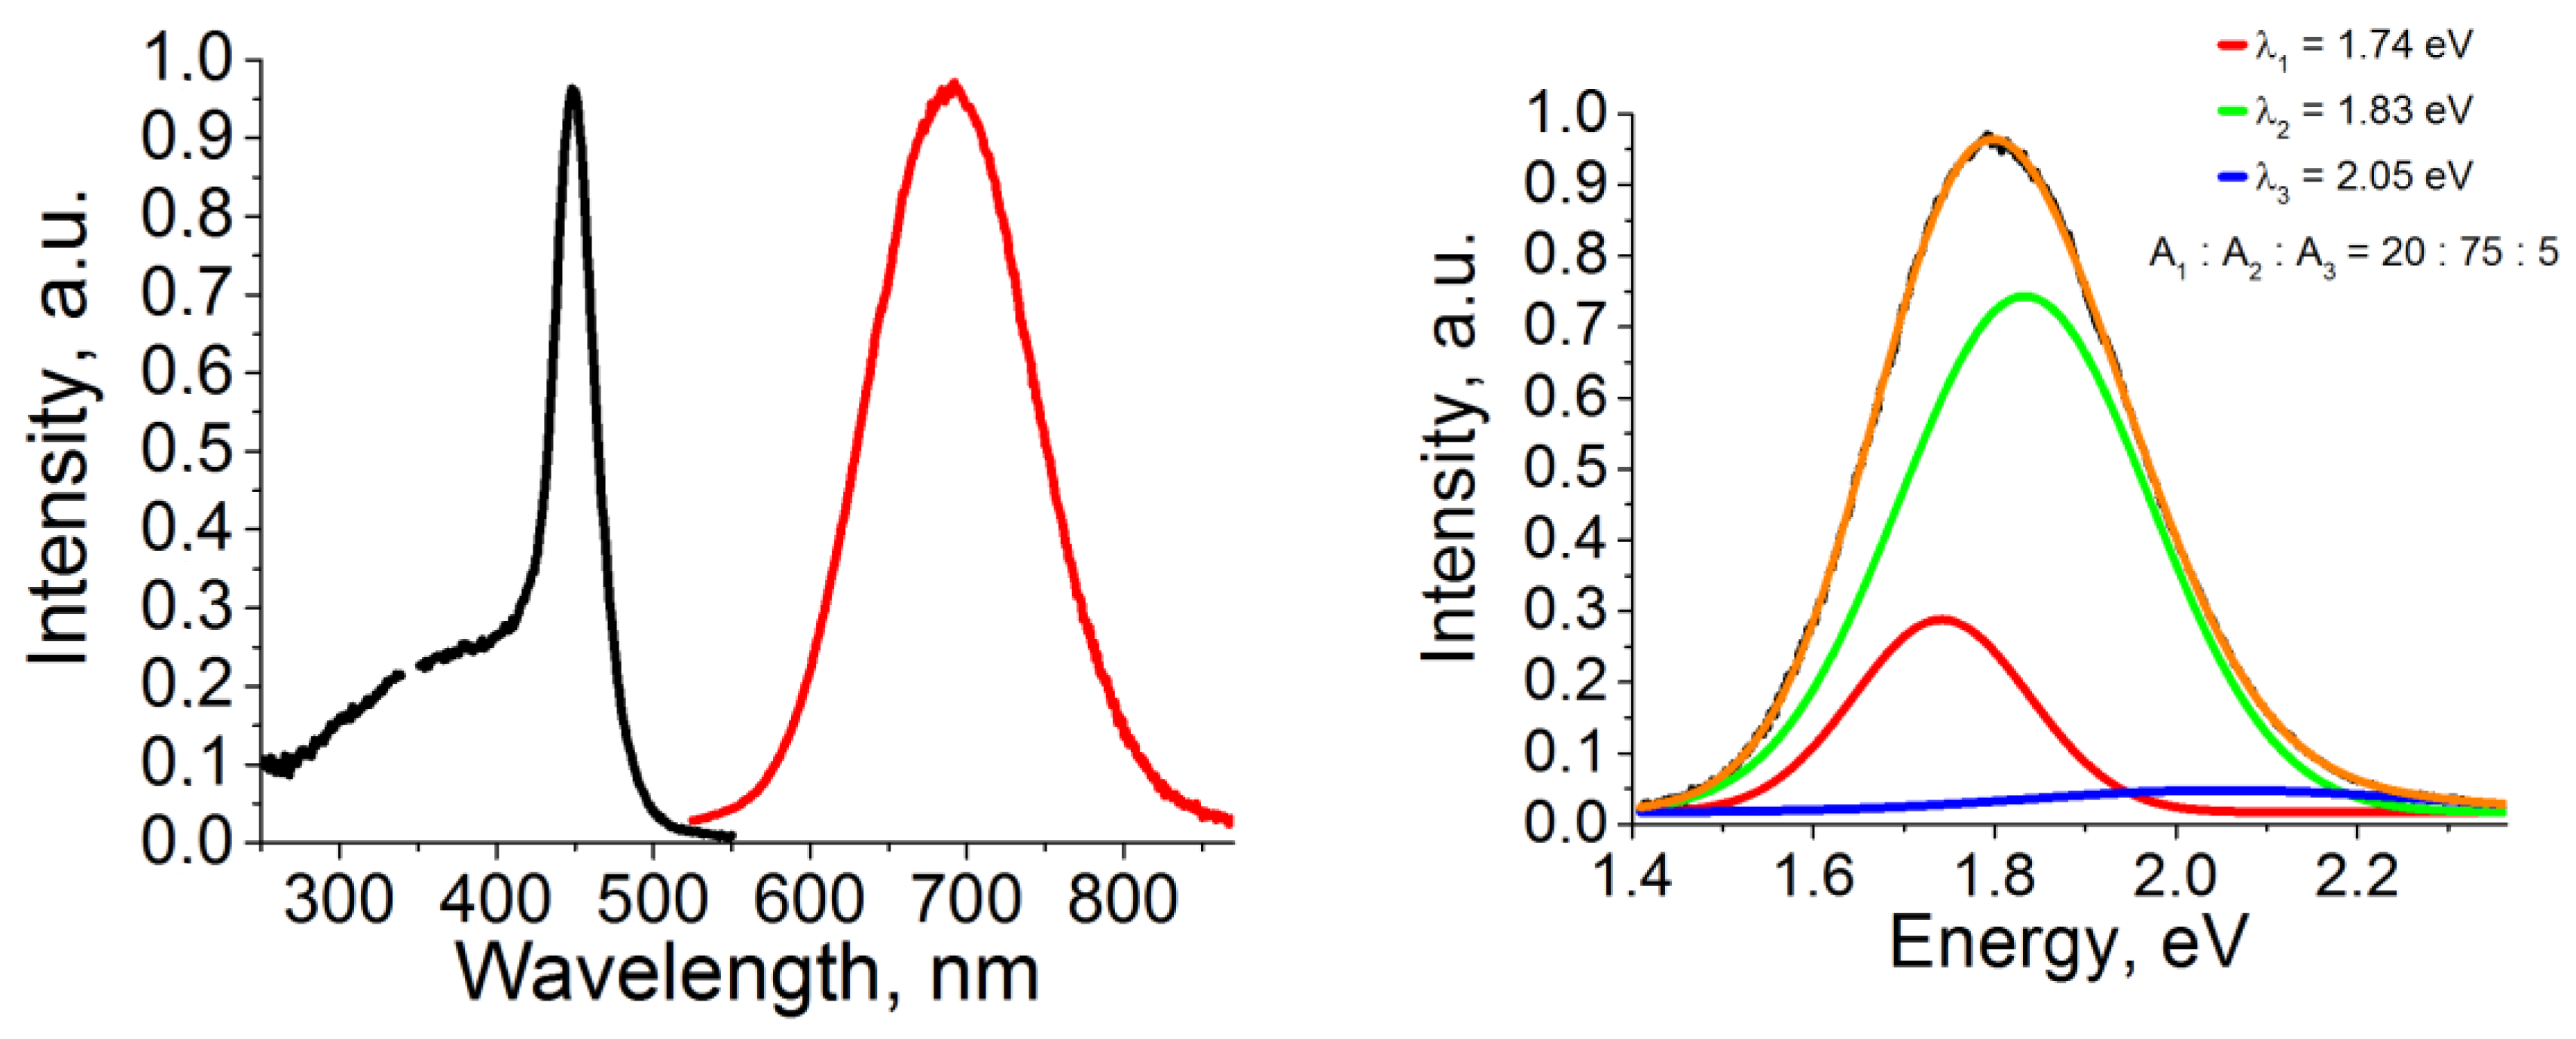
2.3. Photoluminescence

Luminescence properties of silver-based complexes are of particular interest [27,28]. In the case of silver-based nanoclusters there are metalloid and non-metalloid polynuclear complexes. Both types of objects have interesting luminescence properties with a potential for applications. Recently a silver complex with 110 ms lifetime has been reported [29]. Silver-NMP (NMP = N-methyl-2-pyrrolidone) complexes stabilized by POM anions show 30 ms lifetime [30]. The [Ag17(R/S-NYA)12](NO3)3 (R/S-NYA = N-((R/S)-1-(naphthalen-4-yl)ethyl)prop-2-yn-1-amine) crystals demonstrate a broad emission peak (centered at 745 nm) with a PLQY (photoluminescence quantum yield) of 8% and τ of 61.02 μs. The spectra of solutions containing the R/S-Ag17 cluster exhibit a slight blue shift to 715 nm with a PLQY of 1.08% and τ = 5.06 μs. When the Ag nanoclusters were embedded in polymer films, the PLQY was enhanced to 6.23%, τ increased to 46.90 μs, and the emission peak returned to approximately 745 nm. According to the calculations [31,32,33] in [Ag17(R/S-NYA)12](NO3)3 the LUMO → HOMO transitions between cluster orbitals are responsible for the NIR emission, which could be slightly affected by the ligand.
[Ag31S3(StBu)17(CF3COO)7(CO3)0.5(CF3COOH)0.5(DMF)4]·3DMF·CH3OH demonstrates temperature-dependent orange-red emission with λmax = 648 nm (excitation at 365 nm) at 77 K and λmax = 631 nm at 298 K [34]. The emission can be assigned as LMCT from S 3p to Ag 5s perturbed by Ag∙∙∙Ag interactions [35,36,37]. Moreover, emission maximum and temperature are in good linear relationship, which can be described as I (intensity) = −196.654 T (temperature) + 62762.0157 (correlation coefficient = 0.991). The difference between metalloid and non-metalloid silver clusters emission can be more than 100 nm caused by the different nature of transitions.
In the case of 1, we observed luminescence with wide asymmetrical profile of the emission peak (Figure 7 and Figure S4). The luminescence maximum λEm = 625 nm at 77 K shifts to the λEm = 605 nm at 170 K and then returns to λEm = 625 nm at 220 K. The PL spectra can be described by at least two Gauss functions with maxima λ1 = 1.98 eV (626 nm) and λ2 = 2.23 eV (556 nm) (Figure 8 and Figure S5). The integral intensity of λ1 monotonously decreases with temperature increasing and cannot be described with the two energy levels approach. At the same time, the integral intensity of λ2 increases from 77 K to 150 K up to two times and then decreases by two orders at 220 K. Such temperature behavior can be a sign of the interrelation between these bands. Taking this into account, the luminescence can be induced by several ways: (i) emission of {Ag19} and {Ag20} with the possible intercluster transition; (ii) emission from the same centers of both clusters caused by LMCT from S 3p to Ag 5s [38] together with {Ag19} and {Ag20} intracluster CC transition (or ligand-to-metal−metal charge transfer LMMCT [39]).
The temperature dependence of the luminescence in 2 is shown in Figure 9. The PL spectra at each temperature consist of two well-resolved bands and can be described by at least two Gauss functions with maxima λ1 = 1.73 eV (717 nm) and λ2 = 2.03 eV (611 nm) (Figure S6). The integral intensities of both bands monotonously decrease with temperature increasing (Figure 9, right).
It is assumed that the high-energy band corresponds to the Ag clusters without splitting into two bands such as in 1. The low energy band can be ascribed either to the emission of the charge transfer excited state between the Ag cluster and POM [40] or to specific defects in the Ag cluster structure. The observation of the low-energy band in the POM-free solution (Figure 8) can indicate that the low-energy luminescence band comes from the Ag-clusters. The polyoxometalate can change the transitions probabilities, and hence, the intensities of the luminescence bands in the solid. The presence of polyoxometalate in the crystal structure of 2 results in the enhanced intensity of the low energy emission. It appears that polyoxometalate can be used for luminescence tuning in the Ag thiolate clusters.
Reaction solution containing AgNO3 and AgStBu demonstrates a bright emission with λEm = 690 nm (Figure 10). The PL spectrum can be matched with three Gauss functions with the maxima λ1 = 1.74 eV (713 nm), λ2 = 1.83 eV (678 nm), and λ3 = 2.05 eV (605 nm). The integral intensities of the bands follow the ratio 20:75:5. The bands with close maxima are observed in both 1 and 2. The values found in solution and in solids are listed in Table 1.
So, the addition of POM resulted in solution speciation change to the appearance of the third component in a large amount. The comparison between PL data and chromatography results is a good point to find species with significantly lower concentrations. Probably this complex form has more reactivity toward chromatography column material and we did not detect its presence in solution.

3. Materials and Methods

3.1. General Information

AgStBu was prepared according to the standard procedure from AgNO3 and HStBu in CH3CN with an addition of Et3N. DMSO was distilled in vacuo over NaOH. [H4SiW12O40]·14H2O was manufactured by “The Red Chemist” (Saint Petersburg, USSR), and checked with FT-IR and TGA prior to use. Other reagents were of commercial quality (Sigma Aldrich, St. Louis, MO, USA) and were used as purchased. FT-IR spectra were recorded on a Vertex 80 spectrometer. Elemental analysis was carried out on a Eurovector EA 3000 CHN analyzer (Pavia, Italy). UV-VIS spectra were recorded on a Cary 60 spectrometer (Agilent, Santa Clara, CA, USA).

3.2. Synthesis

Synthesis of [NO3@Ag19.2(StBu)10(DMSO)5.2(NO3)8.2]·3DMSO (1):
AgNO3 (100 mg, 0.6 mmol) followed by AgStBu (76 mg, 0.4 mmol) was added into 2 mL of DMSO. The mixture was heated under vigorous stirring until full dissolution of AgStBu. Crystals of 1 slowly appear just after cooling of the reaction mixture. Final crop of the crystalline material was collected after 12 h and washed several times with Et2O. Solid material was obtained after drying in vacuo for 5–7 h. Yield 60% (based on AgNO3).
Analysis. Found C, H, N, S (%): 16.7, 3.9, 2.9, 13.2. Calcd. for 1 C, H, N, S (%): 16.2, 3.4, 3.0, 13.9.
IR (KBr, cm−1, Figure S3): 2957(m), 2930(w), 2914(w), 2888(w), 2851(w), 1471(m), 1440(s), 1386(vs), 1355(vs), 1217(w), 1165(s), 1024(s), 950(m), 820(m), 705(w), 675(w), 620(w), 561(m).
Synthesis of [Ag17.8(NO3)3.8(StBu)10][SiW12O40]·30DMSO (2):
AgNO3 (100 mg, 0.06 mmol) and AgStBu (76 mg, 0.4 mmol) were subsequently added into 2 mL of DMSO. The mixture was heated under rigorous stirring until full dissolution of AgStBu. After that, 20 mg of [H4SiW12O40]·14H2O was added to the reaction mixture. Crystals of 2 slowly appear just after cooling of the reaction mixture. Final crop of the crystalline material was collected after 12 h and washed several times with Et2O. Solid material was obtained after drying in vacuo for 5–7 h. Yield 75% (based on AgNO3).
Analysis. Found C, H, N, S (%): 14.8, 3.8, 0.7, 15.9. Calcd. for 2 C, H, N, S (%) 14.5, 3.3, 0.6, 15.5.
IR (KBr, cm−1, Figure S3): the same to 1 with an addition of [H4SiW12O40] fingerprints at 967(m), 920(s), 883(w), 802(s) [41] and more clearly appeared stretches at 1315(m), 1274(m), 523(w).

3.3. PL

Corrected luminescence spectra were recorded on a Fluorolog 3 spectrometer (Horiba Jobin Yvon, Edison, NJ, USA) with a cooled PC177CE-010 photon detection module equipped with R2658 photomultiplier; with continuous 450 W Xe-lamp; with two Czerny–Turner double monochromators. Temperature dependences of luminescence were studied using Optistat DN optical cryostat (Oxford Instruments, Abingdon, UK).

3.4. X-ray Diffraction on Single Crystals

Crystallographic data and refinement details are given in Table S1. The diffraction data for 1 and 2 were collected on a Bruker D8 Venture diffractometer with a CMOS PHOTON III detector and IµS 3.0 source (Mo Kα radiation, λ = 0.71073 Å) at 150 K. The φ- and ω-scan techniques were employed. Absorption correction was applied by SADABS (Bruker Apex3 software suite: Apex3, SADABS-2016/2 and SAINT, version 2018.7-2; Bruker AXS Inc.: Madison, Fitchburg, WI, USA, 2017.). Structures were solved by SHELXT [42] and refined by full-matrix least-squares treatment against |F|2 in anisotropic approximation with SHELX 2014/7 [43] in ShelXle program [44].
In the case of 2, there is a set of problems that avoided full structural refinement: (i) fast decrease of the reflections intensity after d = 1 Å; (ii) full positional disordering of each Ag coordination environment; (iii) highly disordered solvent molecules of crystallization and nitrate anions; (iv) position disordering of POM anions. Such problems resulted in unstable refinement of “light” atoms. H-atoms were not located due to complicated disordering of C-atoms. SQUEEZE procedure was applied to model as the solvent mask. The full complex composition was found using analytical techniques.
CCDC 2211734 and 2211735 contain the supplementary crystallographic data for 1 and 2 correspondingly. These data can be obtained free of charge via http://www.ccdc.cam.ac.uk/conts/retrieving.html (accessed on 10 October 2022), or from the Cambridge Crystallographic Data Centre, 12 Union Road, Cambridge CB2 1EZ, UK; Fax: +44-1223-336-033; or e-mail: [email protected].

3.5. XRPD

X-ray powder diffraction patterns were measured on a Bruker D8 Advance diffractometer using LynxEye XE T discriminated CuKα radiation. Samples were layered on a flat plastic specimen holder.

3.6. HPLC-ICP-AES

Separations were performed with HPLC system Milichrom A-02 (EcoNova, Novosibirsk, Russia) equipped with a two-beam spectrophotometric detector at the wavelength range of 190−360 nm (ProntoSIL 120-5-C18AQ, 2 × 75 mm), eluents: A—water, B—acetonitrile. The gradient mode conditions: 0–1 min, 0–30% B; 1–7 min, 30–80% B; flow rate—0.2 mL min−1. An ICP-AES spectrometer iCap 6500 Duo (Thermo Scientific, Waltham, MA, USA) with concentric nebulizer was applied as detector in hyphenated HPLC-ICP-AES mode. For quantitative estimations the Ag 328.0 nm spectral line was selected. All measurements were performed in three replicates. The data acquisition and processing were carried out with iTEVA (Thermo Scientific, Waltham, MA, USA) software. The ICP-AES working parameters: power supply—1150 W, nebulizer Ar flow rate—0.70 L min−1, auxiliary—0.50 L min−1, cooling—12 L min−1. In order to eliminate plasma quenching, we diluted the liquid coming out of the column into the spray chamber with deionized water. The steady state of the plasma and the optimal values of analytical signals were finally achieved at the eluent flow rate of 0.2 mL min−1, and the eluent velocity of 3 mL min−1 (peristaltic pump speed—75 rpm).

4. Conclusions

This work shows formation of {Ag20-x(StBu)10} clusters in DMSO in the presence of either NO3 or CF3SO3. Analytical separation methods for the control of the reactions were used for the first time in this chemistry. Crystallization from AgNO3/AgStBu solutions leads to the isolation of co-crystals containing both {Ag19} and {Ag20} clusters. Addition of [H4SiW12O40] to the reaction solution gives crystals of double complex salt with interesting PL properties. We found a significant increase in low-energy PL intensity band at 717 nm in the presence of POM. This can be explained by CT between the silver thiolate cluster and POM unit.

Supplementary Materials

The following supporting information can be downloaded at: https://www.mdpi.com/article/10.3390/inorganics10120225/s1. Table S1: SCXRD Experimental details; Figure S1: Comparison of experimental (298 K) and simulated (150 K) powder diffraction patterns for 1; Figure S2: Comparison of experimental (298 K) and simulated (150 K) powder diffraction patterns for 2; Figure S3: FT-IR spectra of 1 and 2.; Figure S4: Temperature dependence of the PL spectra (λEx = 400 nm) of 1 with two Gauss approximation (λ1 = 1.98 eV, λ2 = 2.23 eV); Figure S5: PL spectrum (λEx = 400 nm) of 1 at 300 K with two Gauss approximation (λ1 = 1.98 eV, λ2 = 2.23 eV); Figure S6: Temperature dependence of the PL spectra (λEx = 400 nm) of 2 with two Gauss approximation (λ1 = 1.73 eV, λ2 = 2.03 eV).

Author Contributions

Conceptualization, P.A.A.; methodology, P.A.A.; software, P.A.A.; validation, P.A.A., A.S.B. and V.V.V.; formal analysis, P.A.A.; investigation, A.S.B. and V.V.V.; resources, A.S.B. and V.V.V.; data curation, P.A.A.; writing—original draft preparation, P.A.A.; writing—review and editing, P.A.A. and M.N.S.; visualization, P.A.A., V.V.V. and A.S.B.; supervision, P.A.A.; project administration, P.A.A.; funding acquisition, P.A.A. All authors have read and agreed to the published version of the manuscript.

Funding

This work was supported by the grant of the President of the Russian Federation for young scientists—Doctors of sciences MD-396.2021.1.3.

Data Availability Statement

CCDC 2211734 and 2211735 contain the supplementary crystallographic data for 1 and 2 correspondingly. These data can be obtained free of charge via http://www.ccdc.cam.ac.uk/conts/retrieving.html (accessed on 10 October 2022), or from the Cambridge Crystallographic Data Centre, 12 Union Road, Cambridge CB2 1EZ, UK; Fax: +44-1223-336-033; or e-mail: [email protected].

Acknowledgments

Authors thank Ministry of Science and Higher Education of RF for the access to SCXRD and luminescence facilities.

Conflicts of Interest

The authors declare no conflict of interest. The funders had no role in the design of the study; in the collection, analyses, or interpretation of data; in the writing of the manuscript; or in the decision to publish the results.

References

  1. Yang, L.; Wang, X.-Y.; Tang, X.-Y.; Wang, M.-Y.; Ni, C.-Y.; Yu, H.; Song, Y.-L.; Abrahams, B.F.; Lang, J.-P. Temperature-dependent chloride-mediated access to atom-precise silver thiolate nanoclusters. Sci. China Chem. 2022, 65, 1094–1099. [Google Scholar] [CrossRef]
  2. Cheng, L.-P.; Luo, G.; Zhao, Q.-Q.; Wang, Z.; Wang, X.-P.; Sun, D. Synthesis, structures and luminescence of silver (I) thiolate nanoclusters based on anion templates. Sci. Sin. Chim. 2017, 47, 695–704. [Google Scholar] [CrossRef]
  3. Pan, Z.-H.; Deng, C.-L.; Wang, Z.; Lin, J.-Q.; Luo, G.-G.; Sun, D. Silver clusters templated by homo- and hetero-anions. CrystEngComm 2020, 22, 3736–3748. [Google Scholar] [CrossRef]
  4. Wang, Z.; Gupta, R.K.; Luo, G.; Sun, D. Recent Progress in Inorganic Anions Templated Silver Nanoclusters: Synthesis, Structures and Properties. Chem. Rec. 2020, 20, 389–402. [Google Scholar] [CrossRef]
  5. Sun, D.; Wang, H.; Lu, H.-F.; Feng, S.-Y.; Zhang, Z.-W.; Sun, G.-X.; Sun, D.-F. Two birds with one stone: Anion templated ball-shaped Ag56 and disc-like Ag20 clusters. Dalton Trans. 2013, 42, 6281. [Google Scholar] [CrossRef] [PubMed]
  6. Wang, Z.; Su, H.-F.; Wang, X.-P.; Zhao, Q.-Q.; Tung, C.-H.; Sun, D.; Zheng, L.-S. Johnson Solids: Anion-Templated Silver Thiolate Clusters Capped by Sulfonate. Chem. Eur. J. 2018, 24, 1640–1650. [Google Scholar] [CrossRef]
  7. Chen, Z.-Y.; Tam, D.Y.S.; Zhang, L.L.-M.; Mak, T.C.W. Silver Thiolate Nano-sized Molecular Clusters and Their Supramolecular Covalent Frameworks: An Approach Toward Pre-templated Synthesis. Chem. Asian J. 2017, 12, 2763–2769. [Google Scholar] [CrossRef]
  8. Li, S.; Du, X.-S.; Li, B.; Wang, J.-Y.; Li, G.-P.; Gao, G.-G.; Zang, S.-Q. Atom-Precise Modification of Silver(I) Thiolate Cluster by Shell Ligand Substitution: A New Approach to Generation of Cluster Functionality and Chirality. J. Am. Chem. Soc. 2018, 140, 594–597. [Google Scholar] [CrossRef]
  9. Alhilaly, M.J.; Huang, R.-W.; Naphade, R.; Alamer, B.; Hedhili, M.N.; Emwas, A.-H.; Maity, P.; Yin, J.; Shkurenko, A.; Mohammed, O.F.; et al. Assembly of Atomically Precise Silver Nanoclusters into Nanocluster-Based Frameworks. J. Am. Chem. Soc. 2019, 141, 9585–9592. [Google Scholar] [CrossRef] [Green Version]
  10. Zhou, K.; Wang, X.-L.; Qin, C.; Wang, H.-N.; Yang, G.-S.; Jiao, Y.-Q.; Huang, P.; Shao, K.-Z.; Su, Z.-M. Serendipitous anion-templated self-assembly of a sandwich-like Ag 20 S 10 macrocycle-based high-nuclearity luminescent nanocluster. Dalton Trans. 2013, 42, 1352–1355. [Google Scholar] [CrossRef]
  11. Jin, J.-L.; Xie, Y.-P.; Cui, H.; Duan, G.-X.; Lu, X.; Mak, T.C.W. Structure-Directing Role of Phosphonate in the Synthesis of High-Nuclearity Silver(I) Sulfide-Ethynide-Thiolate Clusters. Inorg. Chem. 2017, 56, 10412–10417. [Google Scholar] [CrossRef] [PubMed]
  12. Wei, Z.-H.; Ni, C.-Y.; Li, H.-X.; Ren, Z.-G.; Sun, Z.-R.; Lang, J.-P. [PyH][{TpMo(μ3-S)4Cu3}412-I)]: A unique tetracubane cluster derived from the S–S bond cleavage and the iodide template effects and its enhanced NLO performances. Chem. Commun. 2013, 49, 4836. [Google Scholar] [CrossRef] [PubMed]
  13. Liao, J.-H.; Latouche, C.; Li, B.; Kahlal, S.; Saillard, J.-Y.; Liu, C.W. A Twelve-Coordinated Iodide in a Cuboctahedral Silver(I) Skeleton. Inorg. Chem. 2014, 53, 2260–2267. [Google Scholar] [CrossRef]
  14. Chupina, A.V.; Yanshole, V.V.; Sulyaeva, V.S.; Kokovkin, V.V.; Abramov, P.A.; Sokolov, M.N. Self-assembly patterns of non-metalloid silver thiolates: Structural, HR-ESI-MS and stability studies. Dalton Trans. 2022, 51, 705–714. [Google Scholar] [CrossRef]
  15. Tang, L.; Yin, Z.; Wang, R.; Wang, B.; Jiang, K.; Ding, M.; Wang, S. Understanding a ligand’s effects on intra-cluster and inter-cluster assembly. Nanoscale 2022, 14, 8842–8848. [Google Scholar] [CrossRef] [PubMed]
  16. Gruber, F.; Schulz-Dobrick, M.; Jansen, M. Structure-Directing Forces in Intercluster Compounds of Cationic [Ag14(C≡CtBu)12 Cl]+ Building Blocks and Polyoxometalates: Long-Range versus Short-Range Bonding Interactions. Chem. Eur. J. 2010, 16, 1464–1469. [Google Scholar] [CrossRef] [PubMed]
  17. Yan, J.; Malola, S.; Hu, C.; Peng, J.; Dittrich, B.; Teo, B.K.; Häkkinen, H.; Zheng, L.; Zheng, N. Co-crystallization of atomically precise metal nanoparticles driven by magic atomic and electronic shells. Nat. Commun. 2018, 9, 3357. [Google Scholar] [CrossRef] [PubMed] [Green Version]
  18. Xiao, Y.; Wang, Q.-M. Luminescence Responsive Charge Transfer Intercluster Crystals. Chem. Eur. J. 2012, 18, 11184–11187. [Google Scholar] [CrossRef] [Green Version]
  19. O’Keefe, M.; Hyde, B.G. Plane nets in crystal chemistry. Philos. Trans. R. Soc. London. Ser. A Math. Phys. Sci. 1980, 295, 553–618. [Google Scholar]
  20. Aponte, J.C.; Dillon, J.T.; Tarozo, R.; Huang, Y. Separation of unsaturated organic compounds using silver–thiolate chromatographic material. J. Chromatogr. A 2012, 1240, 83–89. [Google Scholar] [CrossRef]
  21. Liao, S.; Dillon, J.T.; Huang, C.; Santos, E.; Huang, Y. Silver (I)-dimercaptotriazine functionalized silica: A highly selective liquid chromatography stationary phase targeting unsaturated molecules. J. Chromatogr. A 2021, 1645, 462122. [Google Scholar] [CrossRef] [PubMed]
  22. Dillon, J.T.; Aponte, J.C.; Tarozo, R.; Huang, Y. Efficient liquid chromatographic analysis of mono-, di-, and triglycerols using silver thiolate stationary phase. J. Chromatogr. A 2012, 1240, 90–95. [Google Scholar] [CrossRef] [PubMed]
  23. Arena, P.; Sciarrone, D.; Dugo, P.; Donato, P.; Mondello, L. Pattern-Type Separation of Triacylglycerols by Silver Thiolate×Non-Aqueous Reversed Phase Comprehensive Liquid Chromatography. Separations 2021, 8, 88. [Google Scholar] [CrossRef]
  24. Shuvaeva, O.V.; Zhdanov, A.A.; Romanova, T.E.; Abramov, P.A.; Sokolov, M.N. Hyphenated techniques in speciation analysis of polyoxometalates: Identification of individual [PMo12−xVxO40]−3−x (x = 1–3) in the reaction mixtures by high performance liquid chromatography and atomic emission spectrometry with inductively coupled. Dalton Trans. 2017, 46, 3541–3546. [Google Scholar] [CrossRef]
  25. AbdulHalim, L.G.; Kothalawala, N.; Sinatra, L.; Dass, A.; Bakr, O.M. Neat and Complete: Thiolate-Ligand Exchange on a Silver Molecular Nanoparticle. J. Am. Chem. Soc. 2014, 136, 15865–15868. [Google Scholar] [CrossRef] [PubMed]
  26. Tang, L.; Kang, X.; Wang, X.; Zhang, X.; Yuan, X.; Wang, S. Dynamic Metal Exchange between a Metalloid Silver Cluster and Silver(I) Thiolate. Inorg. Chem. 2021, 60, 3037–3045. [Google Scholar] [CrossRef]
  27. Yuan, X.; Setyawati, M.I.; Tan, A.S.; Ong, C.N.; Leong, D.T.; Xie, J. Highly luminescent silver nanoclusters with tunable emissions: Cyclic reduction–decomposition synthesis and antimicrobial properties. NPG Asia Mater. 2013, 5, e39. [Google Scholar] [CrossRef]
  28. Veselska, O.; Dessal, C.; Melizi, S.; Guillou, N.; Podbevšek, D.; Ledoux, G.; Elkaim, E.; Fateeva, A.; Demessence, A. New Lamellar Silver Thiolate Coordination Polymers with Tunable Photoluminescence Energies by Metal Substitution. Inorg. Chem. 2019, 58, 99–105. [Google Scholar] [CrossRef]
  29. Shafikov, M.Z.; Czerwieniec, R.; Yersin, H. Ag(I) complex design affording intense phosphorescence with a landmark lifetime of over 100 milliseconds. Dalton Trans. 2019, 48, 2802–2806. [Google Scholar] [CrossRef]
  30. Shmakova, A.A.; Berezin, A.S.; Abramov, P.A.; Sokolov, M.N. Self-Assembly of Ag+/[PW11NbO40]4− Complexes in Nonaqueous Solutions. Inorg. Chem. 2020, 59, 1853–1862. [Google Scholar] [CrossRef]
  31. Weerawardene, K.L.D.M.; Aikens, C.M. Theoretical Insights into the Origin of Photoluminescence of Au25(SR)18− Nanoparticles. J. Am. Chem. Soc. 2016, 138, 11202–11210. [Google Scholar] [CrossRef] [PubMed]
  32. Aikens, C.M. Electronic and Geometric Structure, Optical Properties, and Excited State Behavior in Atomically Precise Thiolate-Stabilized Noble Metal Nanoclusters. Acc. Chem. Res. 2018, 51, 3065–3073. [Google Scholar] [CrossRef] [PubMed]
  33. Li, Q.; Zhou, M.; So, W.Y.; Huang, J.; Li, M.; Kauffman, D.R.; Cotlet, M.; Higaki, T.; Peteanu, L.A.; Shao, Z.; et al. A Mono-cuboctahedral Series of Gold Nanoclusters: Photoluminescence Origin, Large Enhancement, Wide Tunability, and Structure–Property Correlation. J. Am. Chem. Soc. 2019, 141, 5314–5325. [Google Scholar] [CrossRef]
  34. Feng, Y.-H.; Lin, Z.-S.; Liu, S.-Q.; Shi, J.-F.; Zhou, K.; Ji, J.-Y.; Bi, Y.-F. A stably discrete 31-nuclearity silver(I) thiolate nanocluster luminescent thermometer supported by DMF auxiliary ligands. New J. Chem. 2020, 44, 663–667. [Google Scholar] [CrossRef]
  35. Yam, V.W.-W.; Au, V.K.-M.; Leung, S.Y.-L. Light-Emitting Self-Assembled Materials Based on d 8 and d 10 Transition Metal Complexes. Chem. Rev. 2015, 115, 7589–7728. [Google Scholar] [CrossRef] [PubMed]
  36. Barbieri, A.; Accorsi, G.; Armaroli, N. Luminescent complexes beyond the platinum group: The d10 avenue. Chem. Commun. 2008, 2185. [Google Scholar] [CrossRef] [PubMed]
  37. Li, G.; Lei, Z.; Wang, Q.-M. Luminescent Molecular Ag−S Nanocluster [Ag62S13(SBut)32](BF4)4. J. Am. Chem. Soc. 2010, 132, 17678–17679. [Google Scholar] [CrossRef]
  38. Yang, T.-Q.; Peng, B.; Shan, B.-Q.; Zong, Y.-X.; Jiang, J.-G.; Wu, P.; Zhang, K. Origin of the Photoluminescence of Metal Nanoclusters: From Metal-Centered Emission to Ligand-Centered Emission. Nanomaterials 2020, 10, 261. [Google Scholar] [CrossRef] [PubMed] [Green Version]
  39. Chen, Y.; Yang, T.; Pan, H.; Yuan, Y.; Chen, L.; Liu, M.; Zhang, K.; Zhang, S.; Wu, P.; Xu, J. Photoemission Mechanism of Water-Soluble Silver Nanoclusters: Ligand-to-Metal–Metal Charge Transfer vs Strong Coupling between Surface Plasmon and Emitters. J. Am. Chem. Soc. 2014, 136, 1686–1689. [Google Scholar] [CrossRef]
  40. You, M.-H.; Li, M.-H.; Di, Y.-M.; Zhang, S.-Q.; Lin, M.-J. Photochromic Polyoxometalate/Perylenediimide Donor–Acceptor Hybrid Crystals with Interesting Luminescent Properties. Inorg. Chem. 2022, 61, 105–112. [Google Scholar] [CrossRef]
  41. Xu, C.; Gan, J.; Mei, X.; Zhou, Y.; Duanmu, J.; Zhu, G.; Zhang, H.; Han, X.; Wang, Y.; Liu, S.-B. Highly Active Silver ion-Exchanged Silicotungstic Acid Catalysts for Selective Esterification of Glycerol with Lauric Acid. Catal. Letters 2020, 150, 3584–3597. [Google Scholar] [CrossRef]
  42. Sheldrick, G.M. SHELXT—Integrated space-group and crystal-structure determination. Acta Crystallogr. Sect. A Found. Adv. 2015, 71, 3–8. [Google Scholar] [CrossRef] [PubMed] [Green Version]
  43. Sheldrick, G.M. Crystal structure refinement with SHELXL. Acta Crystallogr. Sect. C Struct. Chem. 2015, 71, 3–8. [Google Scholar] [CrossRef] [Green Version]
  44. Hübschle, C.B.; Sheldrick, G.M.; Dittrich, B. ShelXle: A Qt graphical user interface for SHELXL. J. Appl. Crystallogr. 2011, 44, 1281–1284. [Google Scholar] [CrossRef] [PubMed]
Scheme 1. The structure of {X@Ag20(SR)10} core when X atom indicates center of gravity for the guest molecule, Ag is green, S is yellow. Organic radicals are omitted for clarity.
Inorganics 10 00225 sch001
Figure 1. The structure of [NO3@Ag19.2(StBu)10(DMSO)5.2(NO3)9.2] in ball and stick model. Two capping NO3 and tBu-groups are omitted for clarity. Pairs of disordered Ag atoms are colored in pink. Vacant Ag sites are colored in cyan.
Inorganics 10 00225 g001
Figure 2. Crystal packing of 2. Disordered NO3, oxoligands, and DMSO molecules are omitted for clarity. [SiW12O40]4– anions are presented as polyhedra.
Inorganics 10 00225 g002
Figure 3. The HPLC-ICP-AES chromatogram of the solution of 1 in coordinates “retention time–line intensity”.
Inorganics 10 00225 g003
Figure 4. The HPLC-ICP-AES chromatogram of the Ag clusters in coordinates “retention time–line intensity”: (a) fresh solution of AgNO3 and AgStBu in DMSO, (b) after 8 h. Peaks No.1 and No.2 correspond to silver clusters containing 19 and 20 atoms, respectively.
Inorganics 10 00225 g004
Figure 5. The HPLC-ICP-AES chromatogram of the Ag clusters in coordinates “retention time–line intensity”: (a) fresh solution of AgSO3CF3 and AgStBu in DMSO, (b) after 8 h. Peaks No.1 and No.2 correspond to silver clusters containing 19 and 20 atoms, respectively.
Inorganics 10 00225 g005
Figure 6. The UV-VIS spectra of the NO3-containing reaction solution (black curve—as synthesized, red curve—aged for 3 months) (left); The HPLC-ICP-AES chromatogram of the reaction solution aged for 3 months (right). Peaks No.2 and No.3 correspond to silver clusters containing 19 and 20 atoms, respectively.
Inorganics 10 00225 g006
Figure 7. Temperature dependence of the PLE spectra (λEm = 620 nm) of 1 (left); temperature dependence of the PL spectra (λEx = 365 nm) (right).
Inorganics 10 00225 g007
Figure 8. PL spectrum (λex = 400 nm) of 1 at 300 K with two Gauss approximation in direct energy units (λ1 = 1.98 eV, λ2 = 2.23 eV) (left); temperature dependence of the PL bands integral intensities (λEx = 400 nm) of 1 using two Gauss approximation (λ1 = 1.98 eV, λ2 = 2.23 eV) (right).
Inorganics 10 00225 g008
Figure 9. Temperature dependence of the PL spectra (λEx = 400 nm) of 2 with two Gauss approximation (λ1 = 1.73 eV, λ2 = 2.03 eV) (left); temperature dependence of the PL bands integral intensities (λEx = 400 nm) of 2 using two Gauss approximation (λ1 = 1.73 eV, λ2 = 2.03 eV) (right).
Inorganics 10 00225 g009
Figure 10. PLE spectrum (black curve, λEm = 690 nm) and PL spectrum (red curve, λEx = 490 nm) of AgNO3/AgStBu reaction mixture in DMSO (left); PL spectrum (λEx = 490 nm) of the reaction solution with three Gauss approximation (λ1 = 1.74 eV, λ2 = 1.83 eV, λ3 = 2.05 eV) (right).
Inorganics 10 00225 g010
Table 1. The comparison between PL maxima of the reaction solutions and of solid 1 and 2.
MaximaSolution12
λ11.74 1.73
λ21.831.98
λ32.052.232.03
Publisher’s Note: MDPI stays neutral with regard to jurisdictional claims in published maps and institutional affiliations.

