Abstract
Since optical wireless power transmission (OWPT) transmits power by light, which has a narrow diffraction angle feature, it is a strong candidate for wireless power transmission systems supporting long ranges. To develop a realistic operational OWPT system, clarification of system level requirements is essential. In this study, to fill a gap between the concept/initial demonstration and an operational system, the required conditions were analyzed regarding the effects of beam alignment and shaping on the power generation ratio which is a system level efficiency factor with extension from the formerly reported one-dimensional analysis to three-dimensional to include errors in all degrees of freedom is presented. This extension is regarded as an indispensable methodology to evaluate the system level performance of general OWPT systems. Numerical requirements for beam alignment and shaping are derived for both non-cooperative and cooperative OWPT. In non-cooperative OWPT, the direction of the solar cell module is fixed, and the transmitter aligns its beam with the module. In cooperative OWPT, the module and transmitter mutually align in the same direction. Though the cooperative OWPT is more restrictive than the non-cooperative one, its advantages were clarified.
1. Introduction
Wireless power transmission (WPT), which is coming into practice, supports a wide range of system scales [1]. It covers from small systems of a few hundred milliwatts’ transmission power and a few meters’ transmission range [2,3,4,5] to large systems of more than a hundred kilowatts’ power and more than a hundred kilometers’ range [6,7,8,9]. Optical wireless power transmission (OWPT) transmits power by light, which has a narrow diffraction angle feature. There are some WPT methods that outperform OWPT in efficiency in particular conditions, and optical beams are easily blocked by obstacles. OWPT’s benefit is that it supports long ranges and has better efficiency. If such systems become practical, they would bring large benefits and impact to our society.
There are many studies regarding OWPT from basic performance calculation [10] to system concept [11,12,13] and from device level experiments [14,15,16] to demonstrations of OWPT [17] so far. In one demonstration, the range between transmitter and receiver is fixed and the beam shape is predetermined [18]. In another one, the transmitter is fixed, and the receiver moves under control from the transmitter side [19]. Even though the size and alignment of the irradiated beam look adjusted or steered in each case, the system configuration is fixed for the transmitter’s convenience. To fully utilize the advantage of a light beam, which has a narrow diffraction angle, one needs precise beam alignment and shaping. Since requirements for optics such as beam alignment and shaping are essential parameters for OWPT system design and are quite effective for the feasibility, cost, scale, etc., of the system, it is necessary to consolidate such requirements in more general configurations and to clarify trade-off items and some essential values.
This study focused on filling a gap between the initial concept/demonstration and an operational system. The objectives of this study are:
- To propose a methodology based on a simple model to simulate and evaluate system level performance of OWPT in a general configuration;
- To clarify the system level requirements regarding beam alignment and shaping based on a particular parameter set such as the beam divergence angle and the size of the solar array;
- To propose a beam alignment and shaping concept based on derived requirements to assess necessary sensors and components for optics of OWPT.
The structure of this paper is as follows. In Section 2, basic model of an OWPT system is explained. In Section 3, a methodology based on a simple model to simulate and evaluate the system level performance of OWPT is discussed for general configuration. In Section 4, system level requirements in a non-cooperative OWPT regarding beam alignment are discussed, and in Section 5, system level requirements in a cooperative OWPT are discussed. In Section 6, the obtained numerical results are summarized and compared for non-cooperative and cooperative OWPT. In Section 7, a conceptual discussion of beam alignment procedure and conditions in a cooperative OWPT is presented. Finally, in Section 8, the report is concluded.
The geometry and optics analysis model of a non-cooperative OWPT in Section 4 was originally presented in the international conference of OWPT2022 [20] as a preliminary calculation of the power generation ratio. The calculation is extended in this paper towards a complete description regarding the system level requirements of a non-cooperative OWPT.
2. Definition of OWPT System Model and Requirement Analysis Study
Generally, in an OWPT system, a ‘cooperative’ system configuration and a ‘non-cooperative one can be classified and defined as follows. In a non-cooperative OWPT configuration, the solar cell array is fixed, and the power transmitter aligns its beam with the solar array face. In a cooperative OWPT configuration, the solar array and power transmitter mutually align each other, which is similar to the configuration Imai et al. demonstrated as an optical wireless communication system [21]. Even though a cooperative OWPT is more demanding than a non-cooperative one in system level design, its advantages were clarified in this study.
System level requirement analysis is conducted regarding the effects of beam shaping and alignment on the efficiency of power generation with a simple OWPT system. To estimate power generation, the power generation ratio, which Tang et al. investigated, is introduced. Even though their study was limited to a one-dimensional configuration, it is extended in this study to a three-dimensional one to include errors in all degrees of freedom (DoF) and to derive all requirements regarding beam alignment and shaping. This extension is regarded as a methodology to evaluate the system level performance of general OWPT systems. Numerical requirements for beam alignment and shaping are derived from relationships between errors and the power generation ratio. Even though they depend on some particular parameters such as the beam divergence angle and the size of the solar array assumed in the model in this study, another requirement is easily generated for another parameter set with the same methodology.
Following these requirements’ consolidation, the beam alignment concept is proposed for a cooperative OWPT. In the case of powering a moving solar cell target or powering several targets of different range and attitude, it is necessary to search for targets and find their attitude as well as range and to adjust and steer the beam shape and direction with necessary accuracy. Consolidation of the alignment concept clarifies the scale of the system and specifies necessary sensor subsystems and components, which determines the configuration of the optics subsystem of the OWPT system.
The above requirements’ consolidation and alignment concept study determines the fundamental building blocks of feasibility, scale, and cost of an OWPT system to be developed. An OWPT test and system integration concept was proposed in the literature [22]. This study provides a basis for such a system integration plan.
3. Factors of Efficiency in OWPT Systems
Since power transmission is the essential function of OWPT, its efficiency is a quite important characteristic for every OWPT system. The efficiency of OWPT () is the product of some factors, such as efficiency of the light source (), efficiency of the light transmission that accounts for scattering and absorption (), and efficiency of the solar cell () [23]. and are performance parameters specific to devices and is an environmental parameter and is not controllable. In addition to these, to analyze system performance, there needs to be another factor to evaluate system level performance, which is separated from device-specific, environmental performances and includes the effect the of system level performance, including optics such as beam alignment and shaping. Such a factor can be defined using the ‘power generation ratio’ concept, which Tang et al. studied [24], with extensions to include all DoF of beam alignment and shaping. Thus, there is a power generation ratio factor () to be included and is extended and defined as follows:
The new factor, the ‘power generation ratio ()’, coming into , accounts for the light beam power contributing to power generation in the solar cell, which is a portion of the power transferred by the incident beam. is defined as the product of two factors. The first one (factor A) accounts for the portion of light beam that irradiates the solar cell module. For a beam of uniform power, it is given by the ratio of the incident beam area overlapping with the solar cell to the total area of the incident beam. For a non-uniform beam, the effect of non-uniformity should be additionally included as a correction, or an appropriate homogenizing scheme should be included in transmitter or receiver optics [25]. The second one (factor B) accounts for the output characteristics of the solar cell array. An example discussed by Tang et al. is a solar array module with a series of connected solar cells without any bypass diodes. If it includes a non-irradiated (shadowed) cell, the module does not generate any power and such behavior results in nonlinear output characteristics of the solar cell array against irradiated power. In a more general case, factor B is extended to a non-linear correction factor, which accounts for the general shadowing condition of any solar cell array module. Factor B will depend on the detailed internal configuration of the array, such as the number, shape, and orientation of each solar cell element and additional components such as bypass diodes. As a whole, the power generation ratio describes the non-linear output nature of a shadowed array against irradiated power, and naturally, it becomes 1 (100%) if there is no shadowing on the array. The electrical output power of the solar cell array can be obtained by multiplying this power generation ratio by the photoelectric conversion efficiency of the solar cell array at a specific light intensity density under uniform light irradiation and the light source emission beam intensity.
Since the objective of this study was to derive a simple estimation of requirements for beam alignment, etc., to maximize the power generation ratio, an assumption was adopted that the second factor depends only on the ratio of irradiated area in the solar cell to the total area of the solar cell module and factor B is expressed by the nonlinear function that Tang et al. investigated empirically. This assumption would be valid in the neighborhood of the point where the focus and beam alignment are perfect. With this assumption, their power generation ratio concept was extended to include errors of all DoF of beam alignment, shaping as perturbation.
In many use cases of solar cell arrays for solar power generation and indoor lighting power generation, one may naturally assume that the whole area of the solar cell array module is uniformly irradiated and both factors A and B can achieve nearly 100%. However, in OWPT, in which beam size is finite, the situation is totally different. One needs to adjust the incident beam shape to the solar cell array’s to avoid a non-irradiated portion in the array and power loss due to shape mismatch between the beam and the array. In other words, from a system efficiency point of view, one needs active control of the beam alignment and its shape to maximize both factor A and B of and to maintain its high efficiency. If the beam size is large enough to cover the solar cell array, factor B becomes 100% and requirement for factor B would be much relaxed. However, light beam power spilled from the array deteriorates factor A, since this degrades the overall efficiency, and spilled power may cause eye safety problems if such power is larger than the safety standard [26]; thus, the size of the irradiation beam should not be oversized.
4. Beam Shaping and Beam Alignment Requirement in Non-Cooperative OWPT
It is necessary to introduce appropriate simulation models to evaluate the system level requirements. These are a geometrical configuration and an optics model. For a non-cooperative OWPT, it is the same as the previous report [20].
4.1. Geometrical Configuration
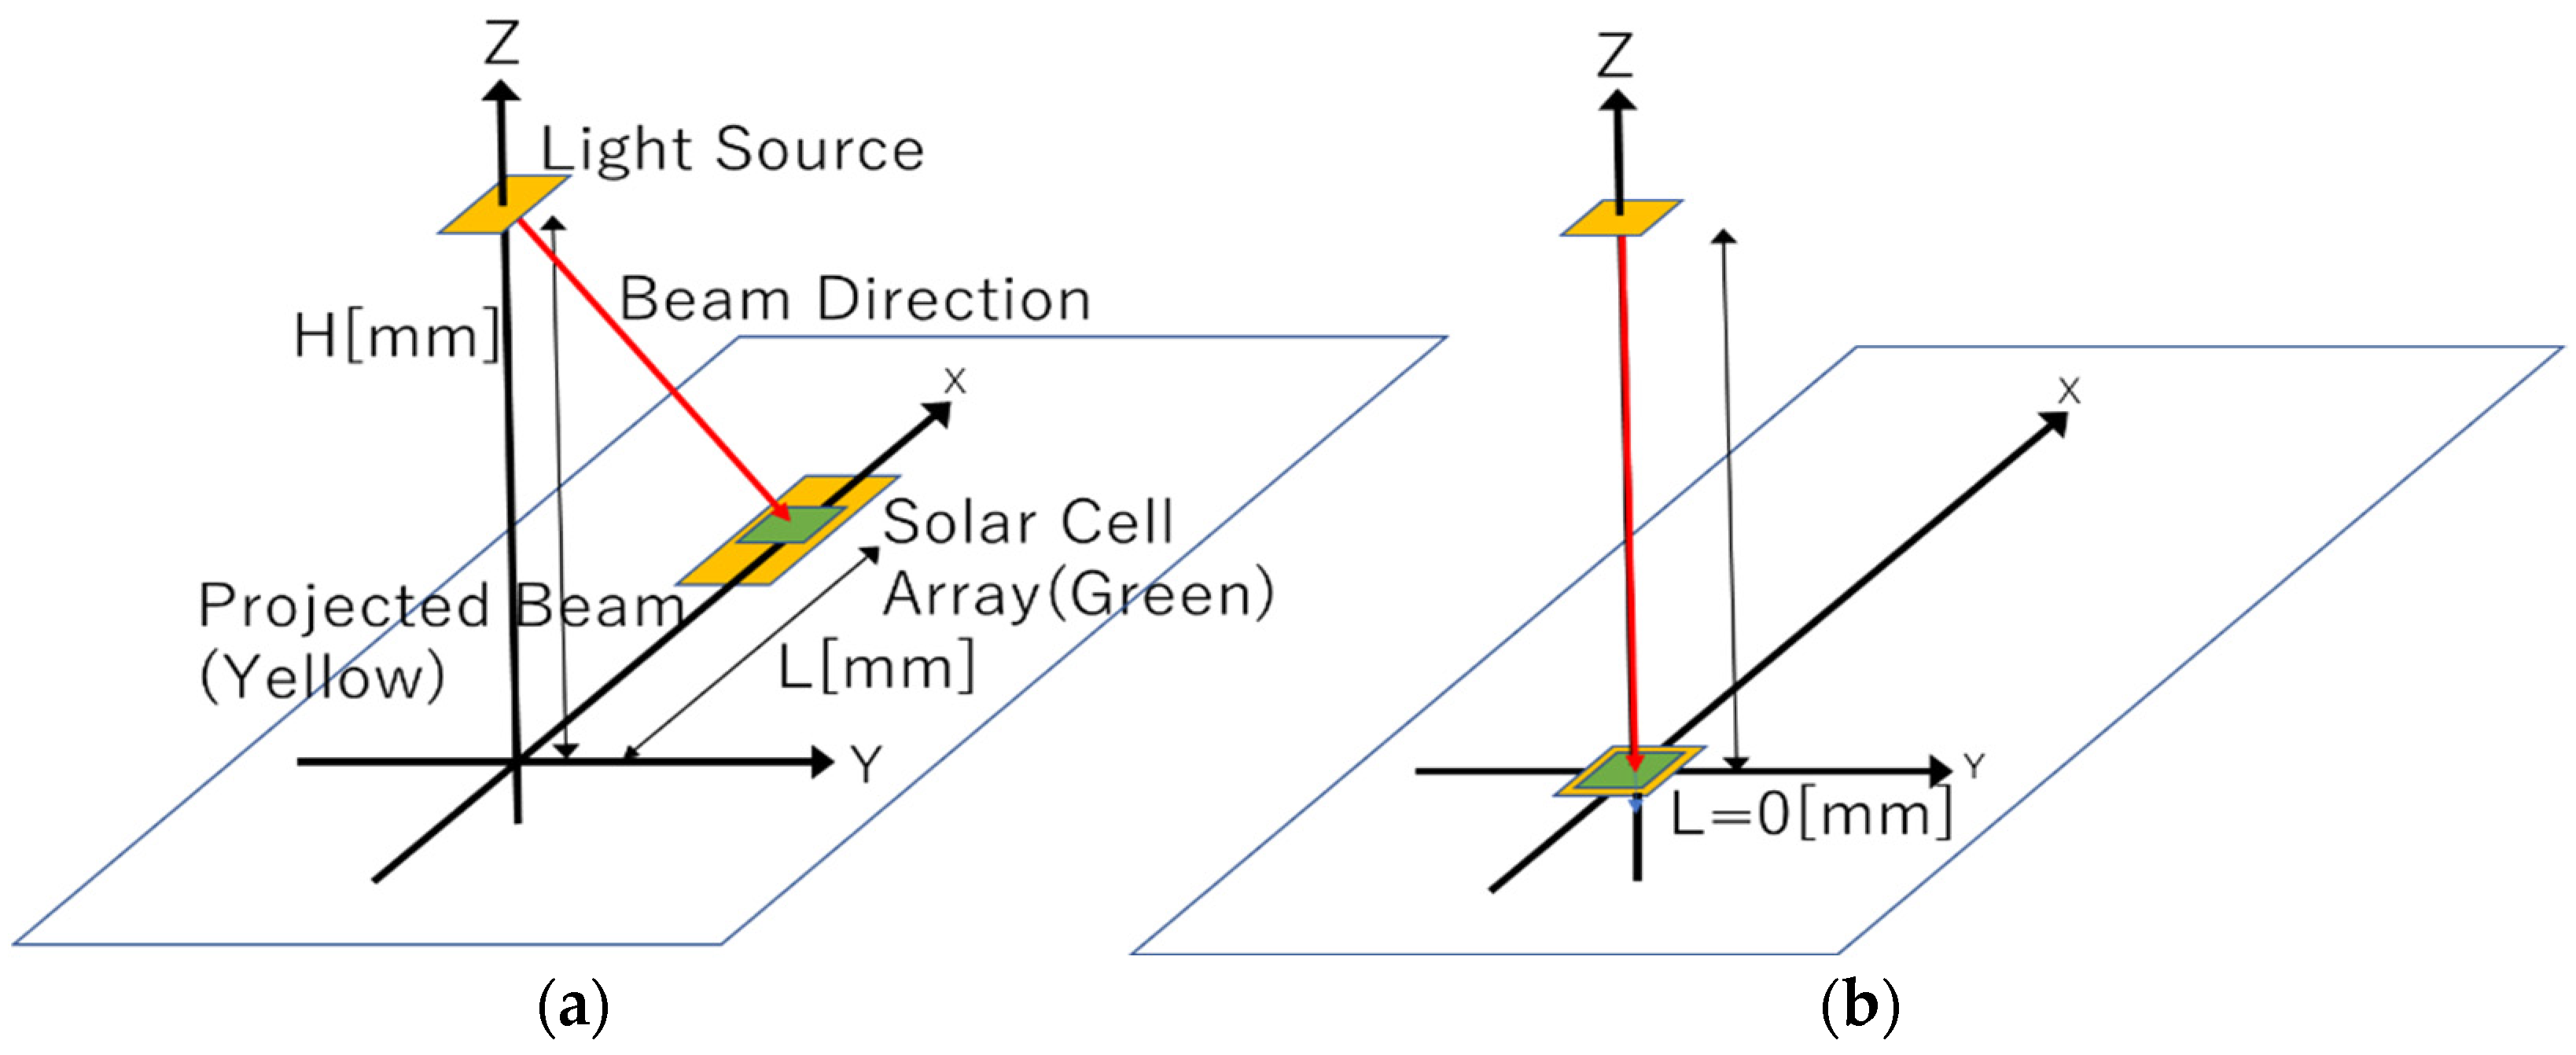
Figure 1 is geometrical configuration of the analysis. The shape of the solar cell array module is a 100 mm × 100 mm square, which would generate power up to a few tens of watts, and it is placed at (L, 0, 0) in the coordinate system in Figure 1a. L varies from 0 mm in Figure 1b to 100,000 mm (100 m). The size of this array is suitable for light beam propagation and many indoor and outdoor applications of OWPT of this scale are expected. The shape of the array is assumed as a rectangle and its orientation is fixed along the X-axis. A typical realization of this configuration is movements of an automatic guided vehicle (AGV), which would move along a fixed axis during some period of time. There would be more than one transmitter in a service area and one of the transmitters tracks AGV and adjusts the beam shape and alignment within the limit of its own service area, and then hand over to the other transmitter outside of it. The emission center of the beam is (0, 0, H) on the Z-axis, and H is fixed as H = 2500 mm (2.5 m), which is expected to be an easily accommodative condition realized as an indoor facility’s typical height of ceiling or in an outdoor environment. The beam shape is square and is tilted around the Y-axis to irradiate the array displaced in the X direction on the XY plane, while the position of the emission center is fixed. The beam propagates with a particular beam divergence angle and its projected shape is deformed from square to generally trapezoid, which is strongly dependent on L.
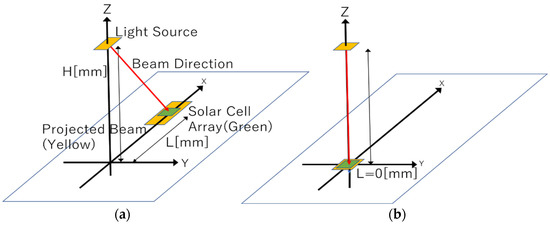
Figure 1.
Geometrical configuration of non-cooperative OWPT studied: (a) general configuration of L ≠ 0; (b) configuration of L = 0.
4.2. Orthogonal Cylindrical Beam Expander Optics
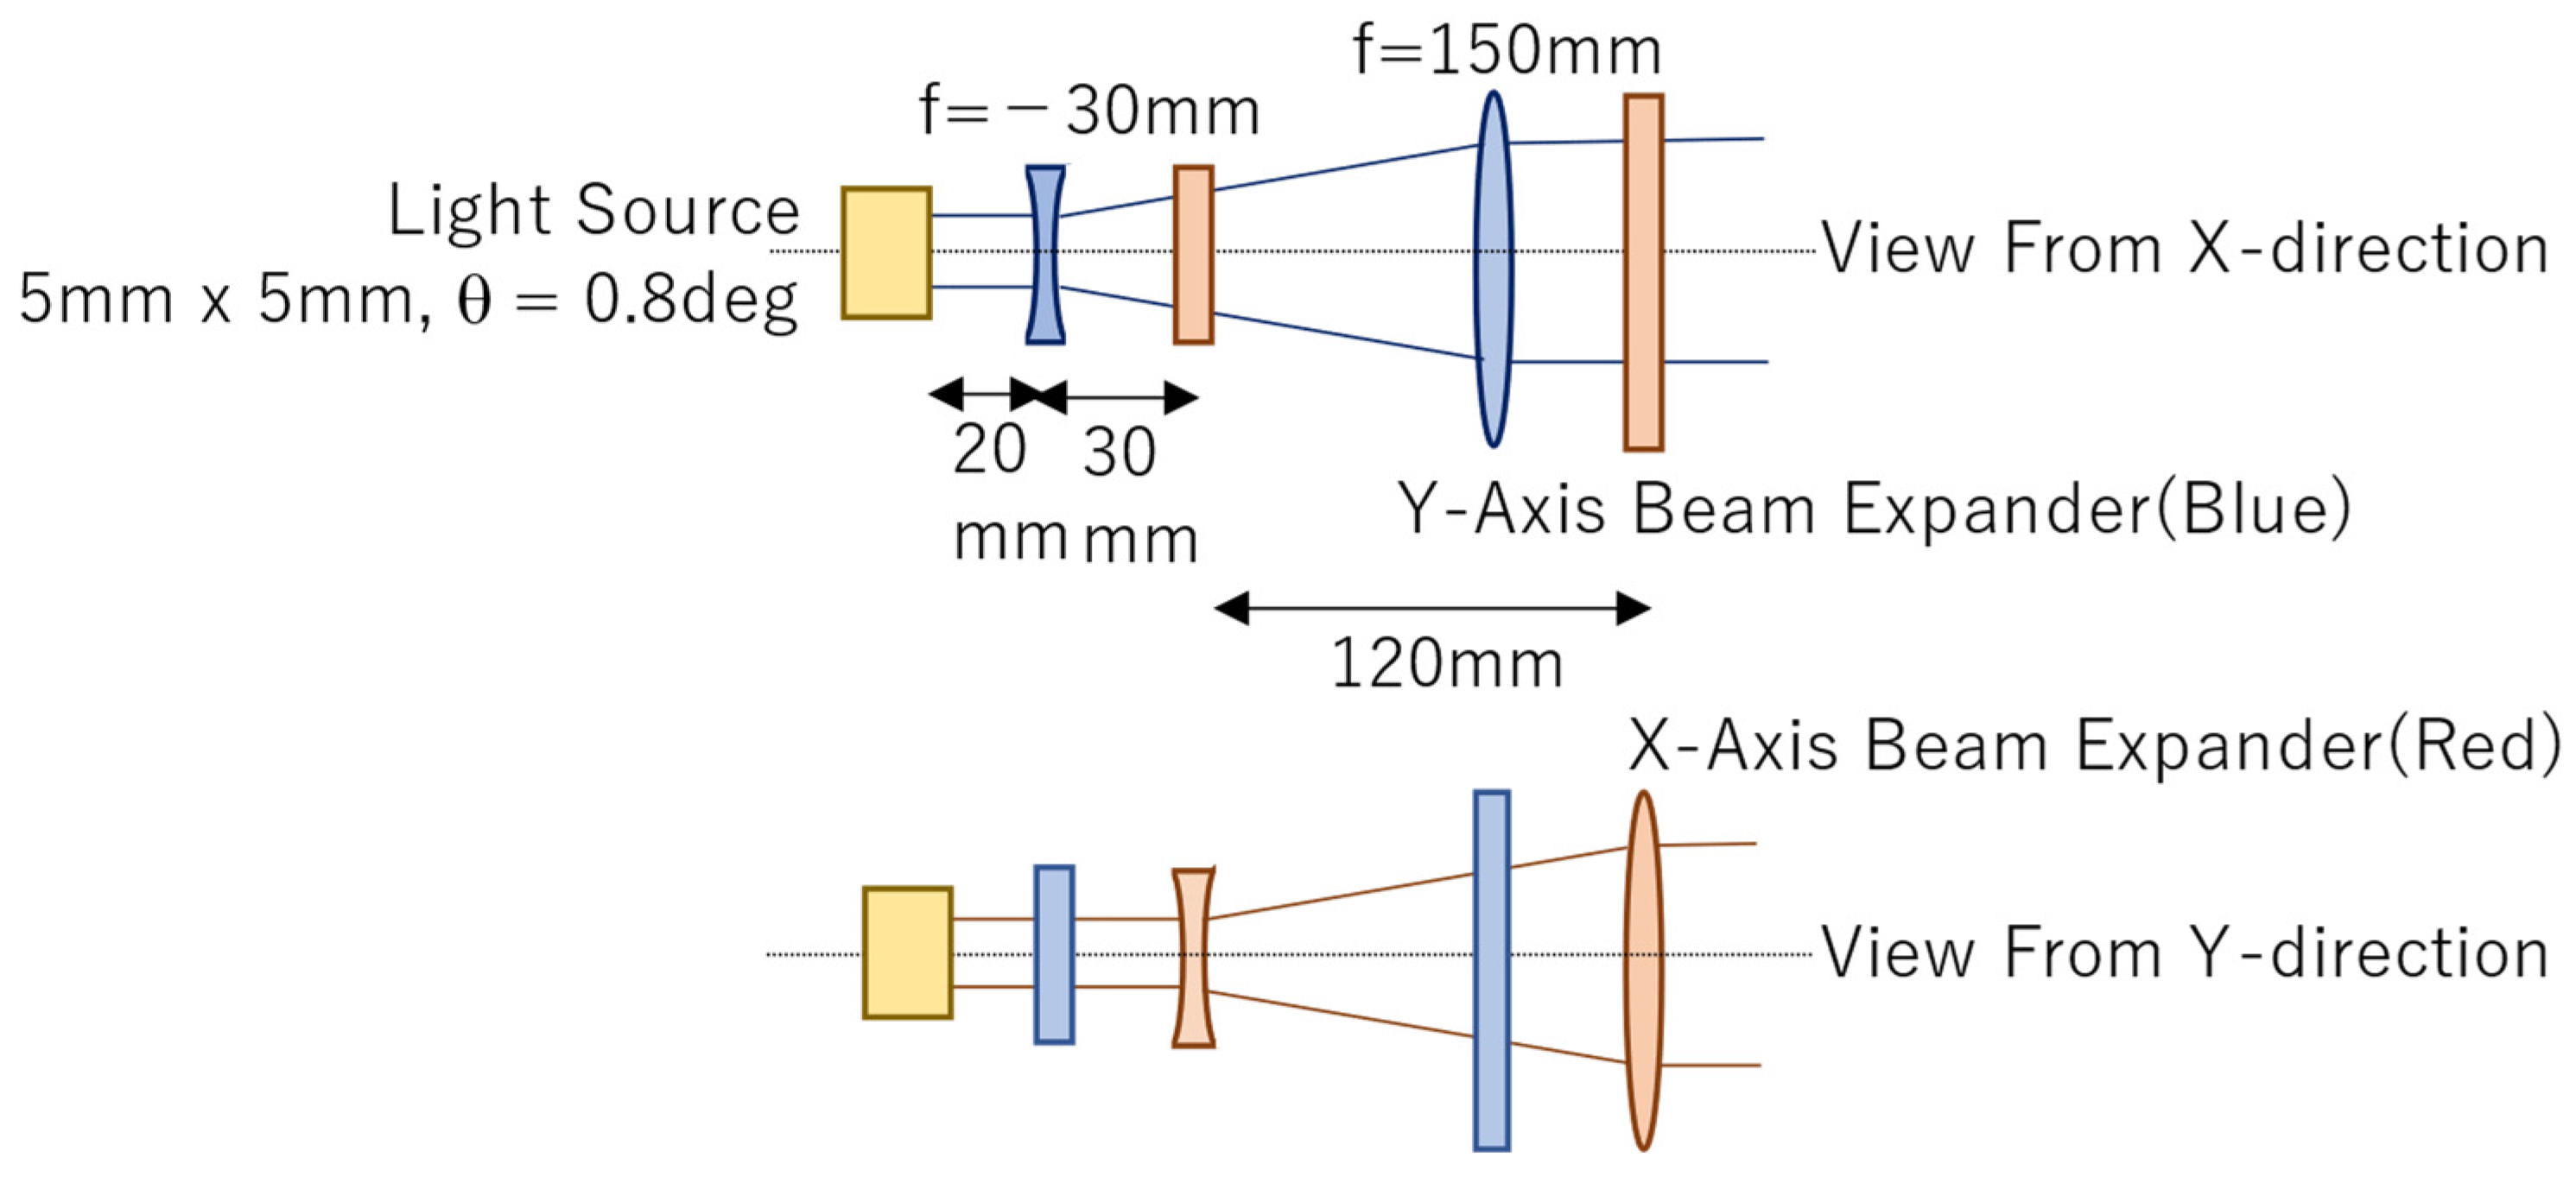
To evaluate errors and to consolidate requirements for all DoF of beam alignment and shaping, an appropriate optics model is necessary to conduct a performance simulation dealing with three-dimensional errors. Even though beam shaping mechanisms are proposed for OWPT [27,28], they consist of static beam shaping, or a complex mechanism for quite long-range utilizing adaptive optics. Here we propose a simple model that supports variation of focus to adopt moving targets with about 100 m range. The size of the light source at (0,0,H) is 5 mm × 5 mm (square), its beam divergence is 0.8 degrees (half angle), and its power profile is top hat. For much longer distance transmission, a gaussian beam with a homogenizer at the receiver side will provide essentially the same result as this power profile. Since the projected beam shape at the solar cell array location on the XY plane is different in the X and Y directions, independent beam shape correction is necessary on each axis. Then, as shown in Figure 2, an optical system is proposed based on two independent beam expanders consisting of convex and concave lenses. To perform beam shape corrections independently for the X- and Y-axis directions, two identical cylindrical beam expanders are configured orthogonally and shifted 30 mm along the optical axis (beam direction). The lenses of each beam expander are cylindrical, and their focal lengths are 150 mm (convex) and −30 mm (concave), and the two lenses are separated 120 mm nominally. Some of the given geometric parameters in Figure 2 can be changed and adjusted depending on the actual operational system design.
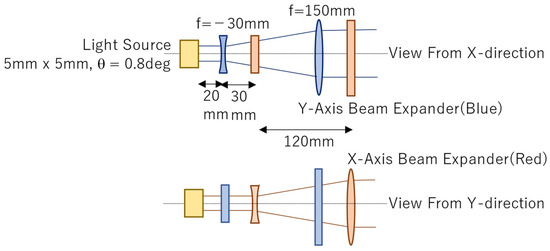
Figure 2.
Orthogonal cylindrical beam expander optics.
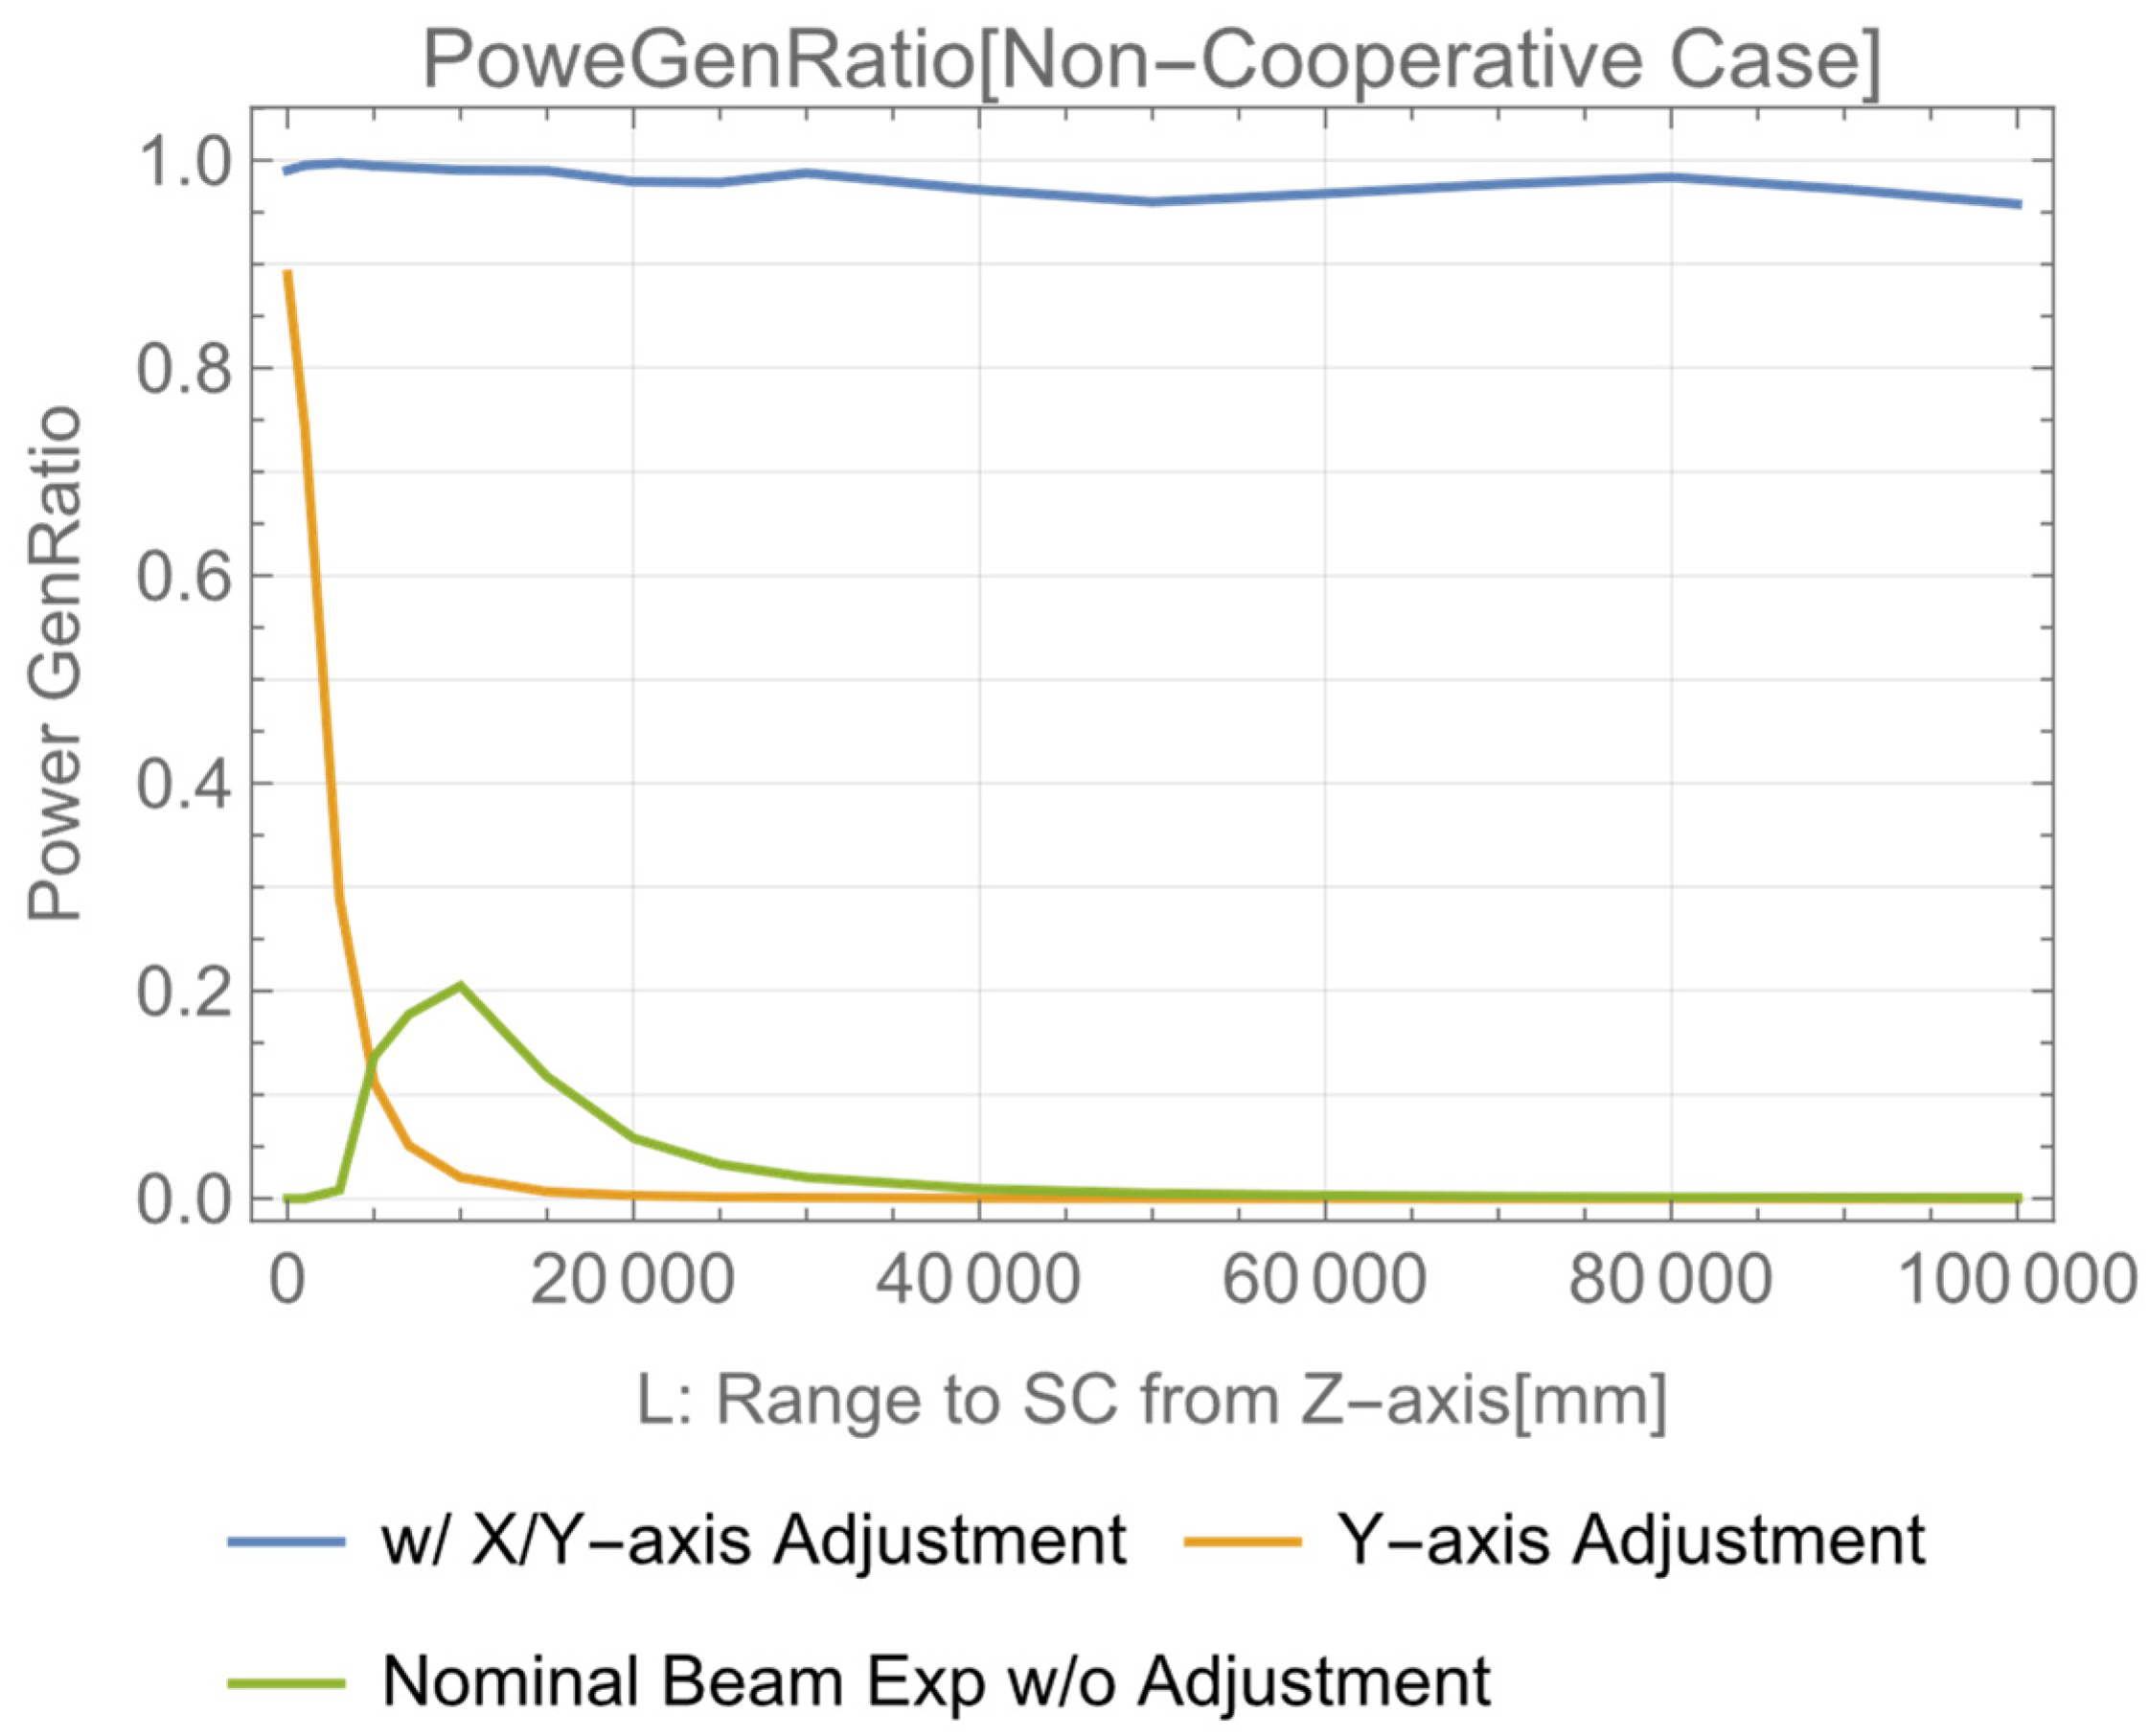
Knowing the slant range from light source to the solar panel and defocusing two convex lenses in the X and Y directions independently, one can adjust the projected beam shape to the solar cell array. Figure 3 shows the relation between the power generation ratio and position L. The results of different beam control configurations are also shown, such as a single axis beam expander (“Y-axis Adjustment” plot) and without (no) beam expander configuration (“Nominal Beam Expander w/o Adjustment” plot). By using the orthogonal cylindrical beam expander optics, it is shown that the power generation ratio maintains 100% even for L = 100 m ranges from the foot of the solar panel and expects efficient power transfer from the light source to the panel (“w/X/Y Axis Adjustment” plot). When a single axis beam expander is applied, or without beam expander optics, the power generation ratio is largely degraded and operation is restricted within the short distance L. This means OWPT efficiency would be quite low without appropriate optimization. This study shows requirements to optimize OWPT optics. Details of the simulation method for the range-dependent optimization of the power generation ratio are summarized in Appendix A and Appendix B.
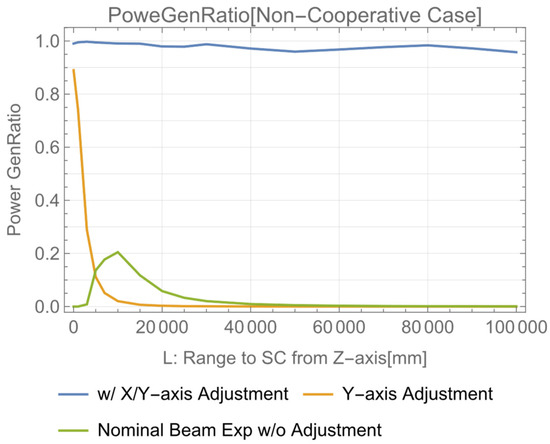
Figure 3.
Power generation ratio (non-cooperative OWPT).
4.3. Requirement for Focus Adjustment (Beam Size Control)
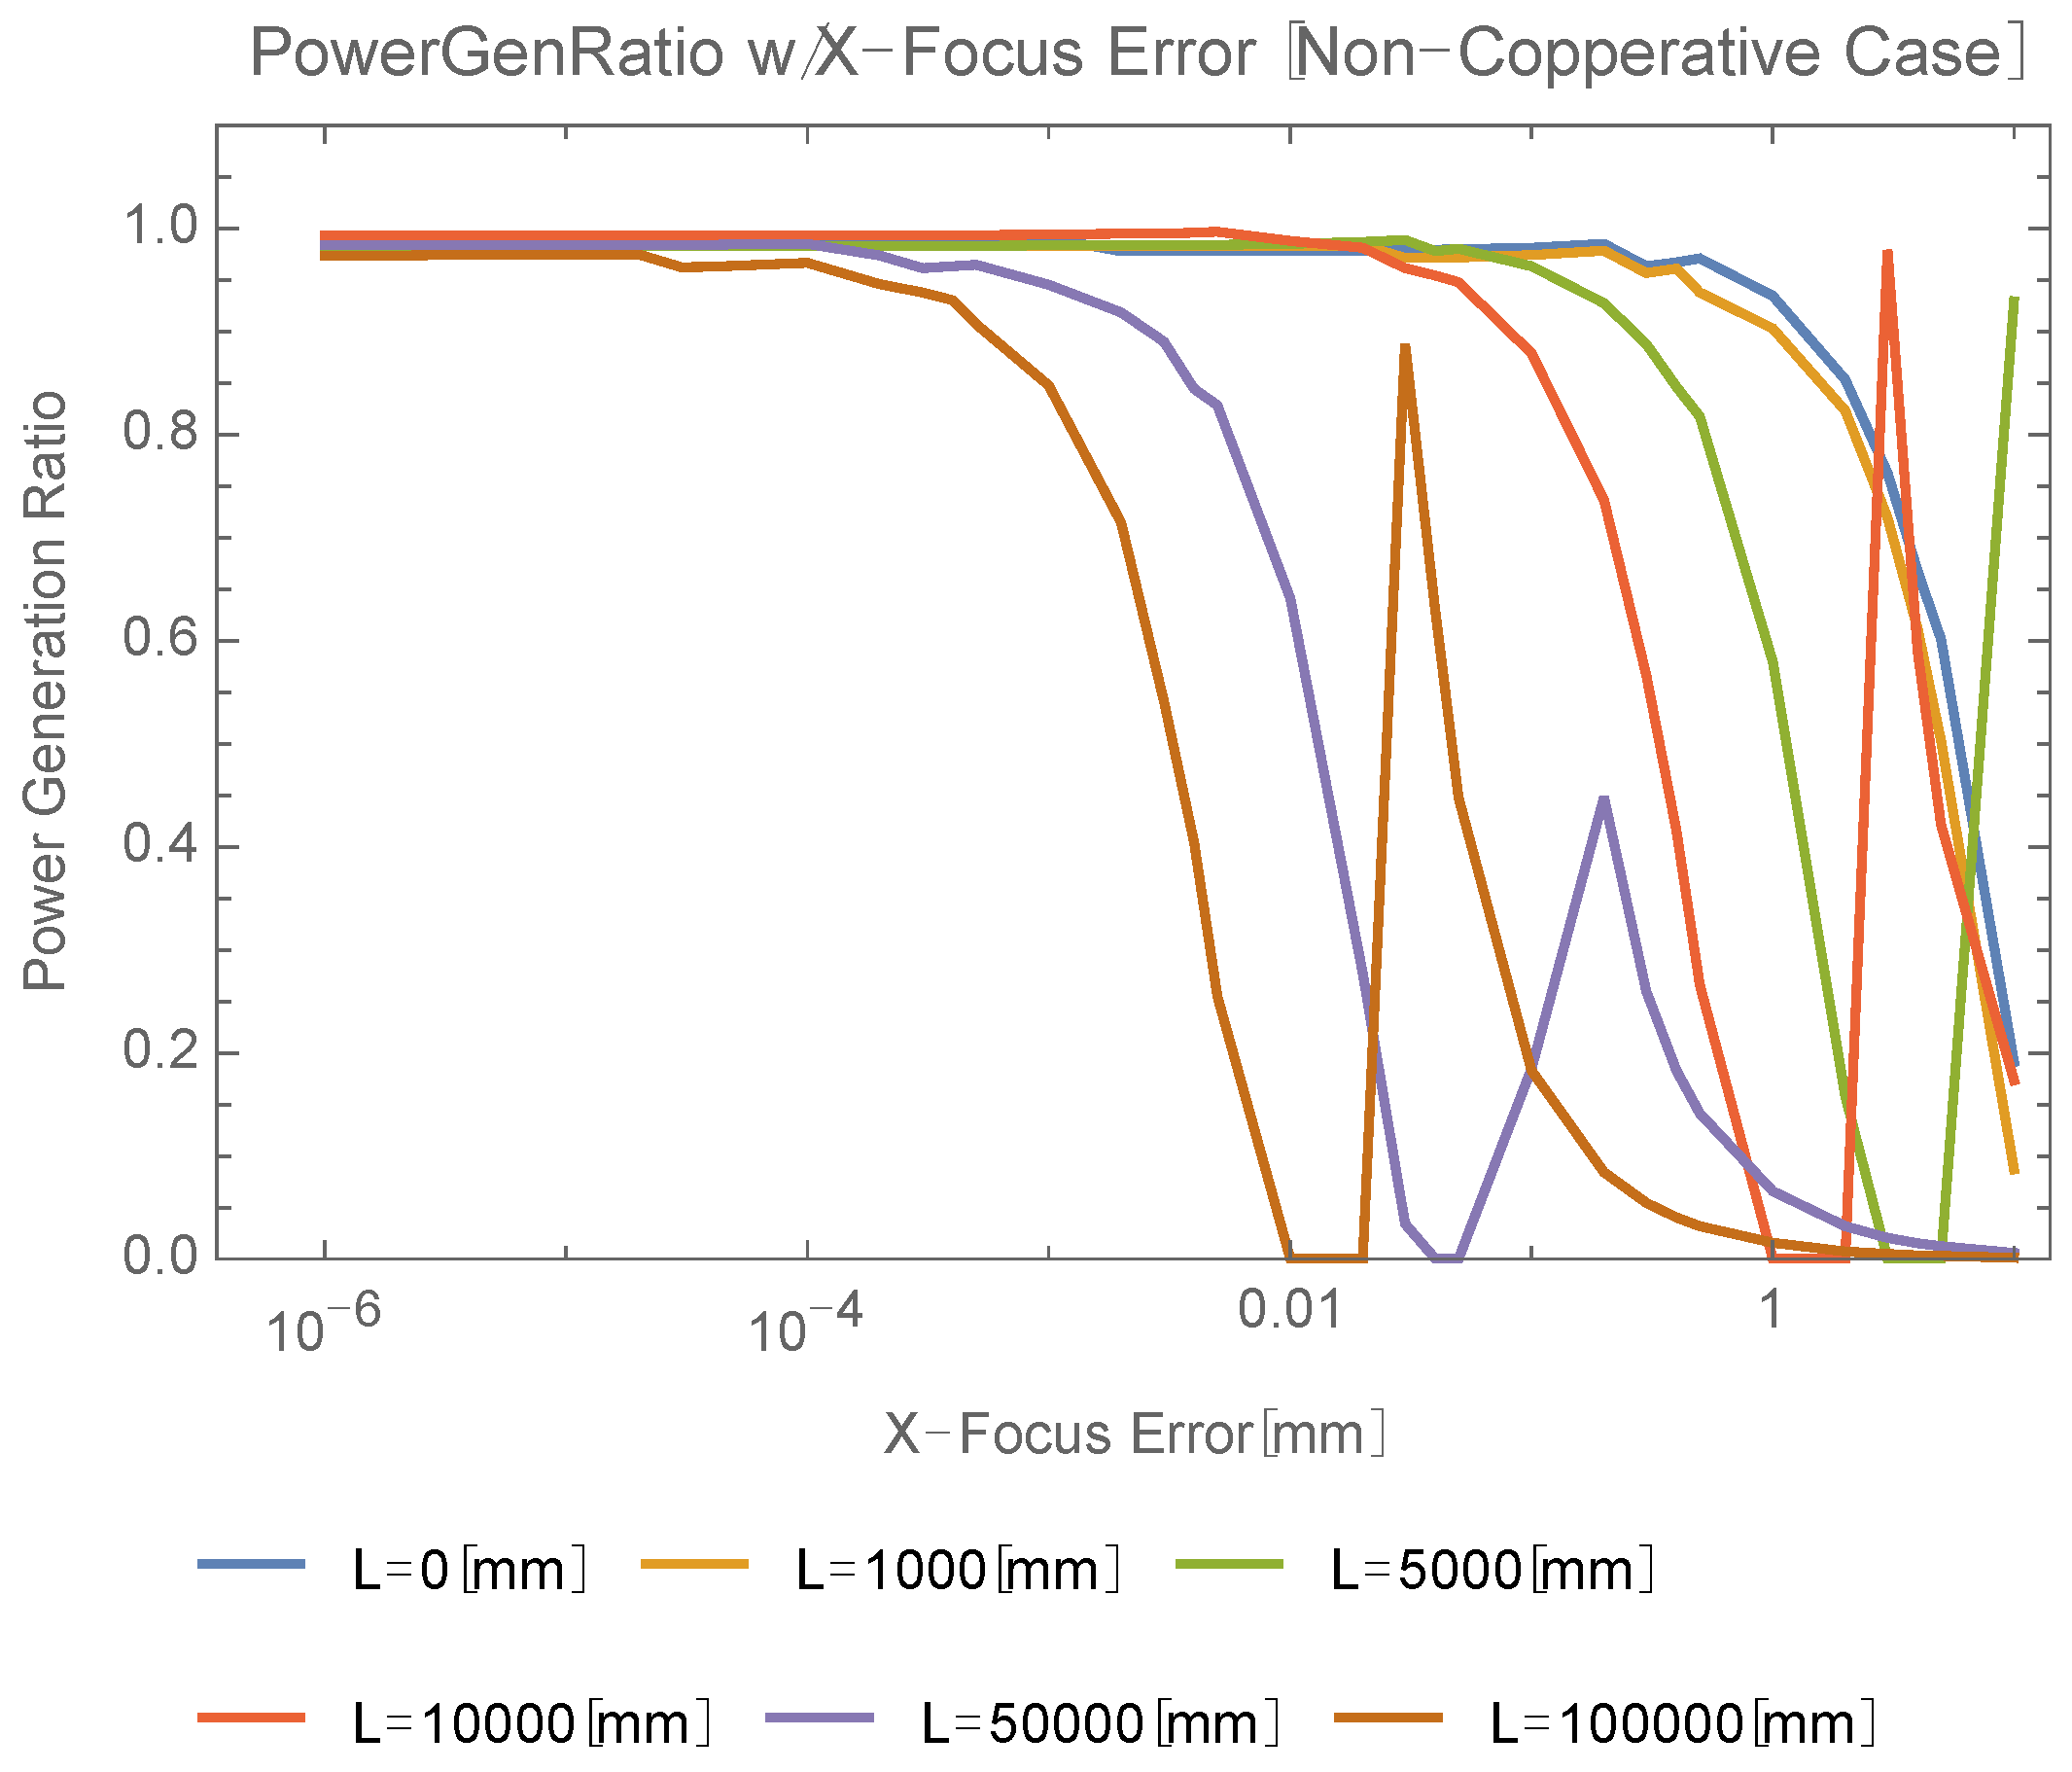
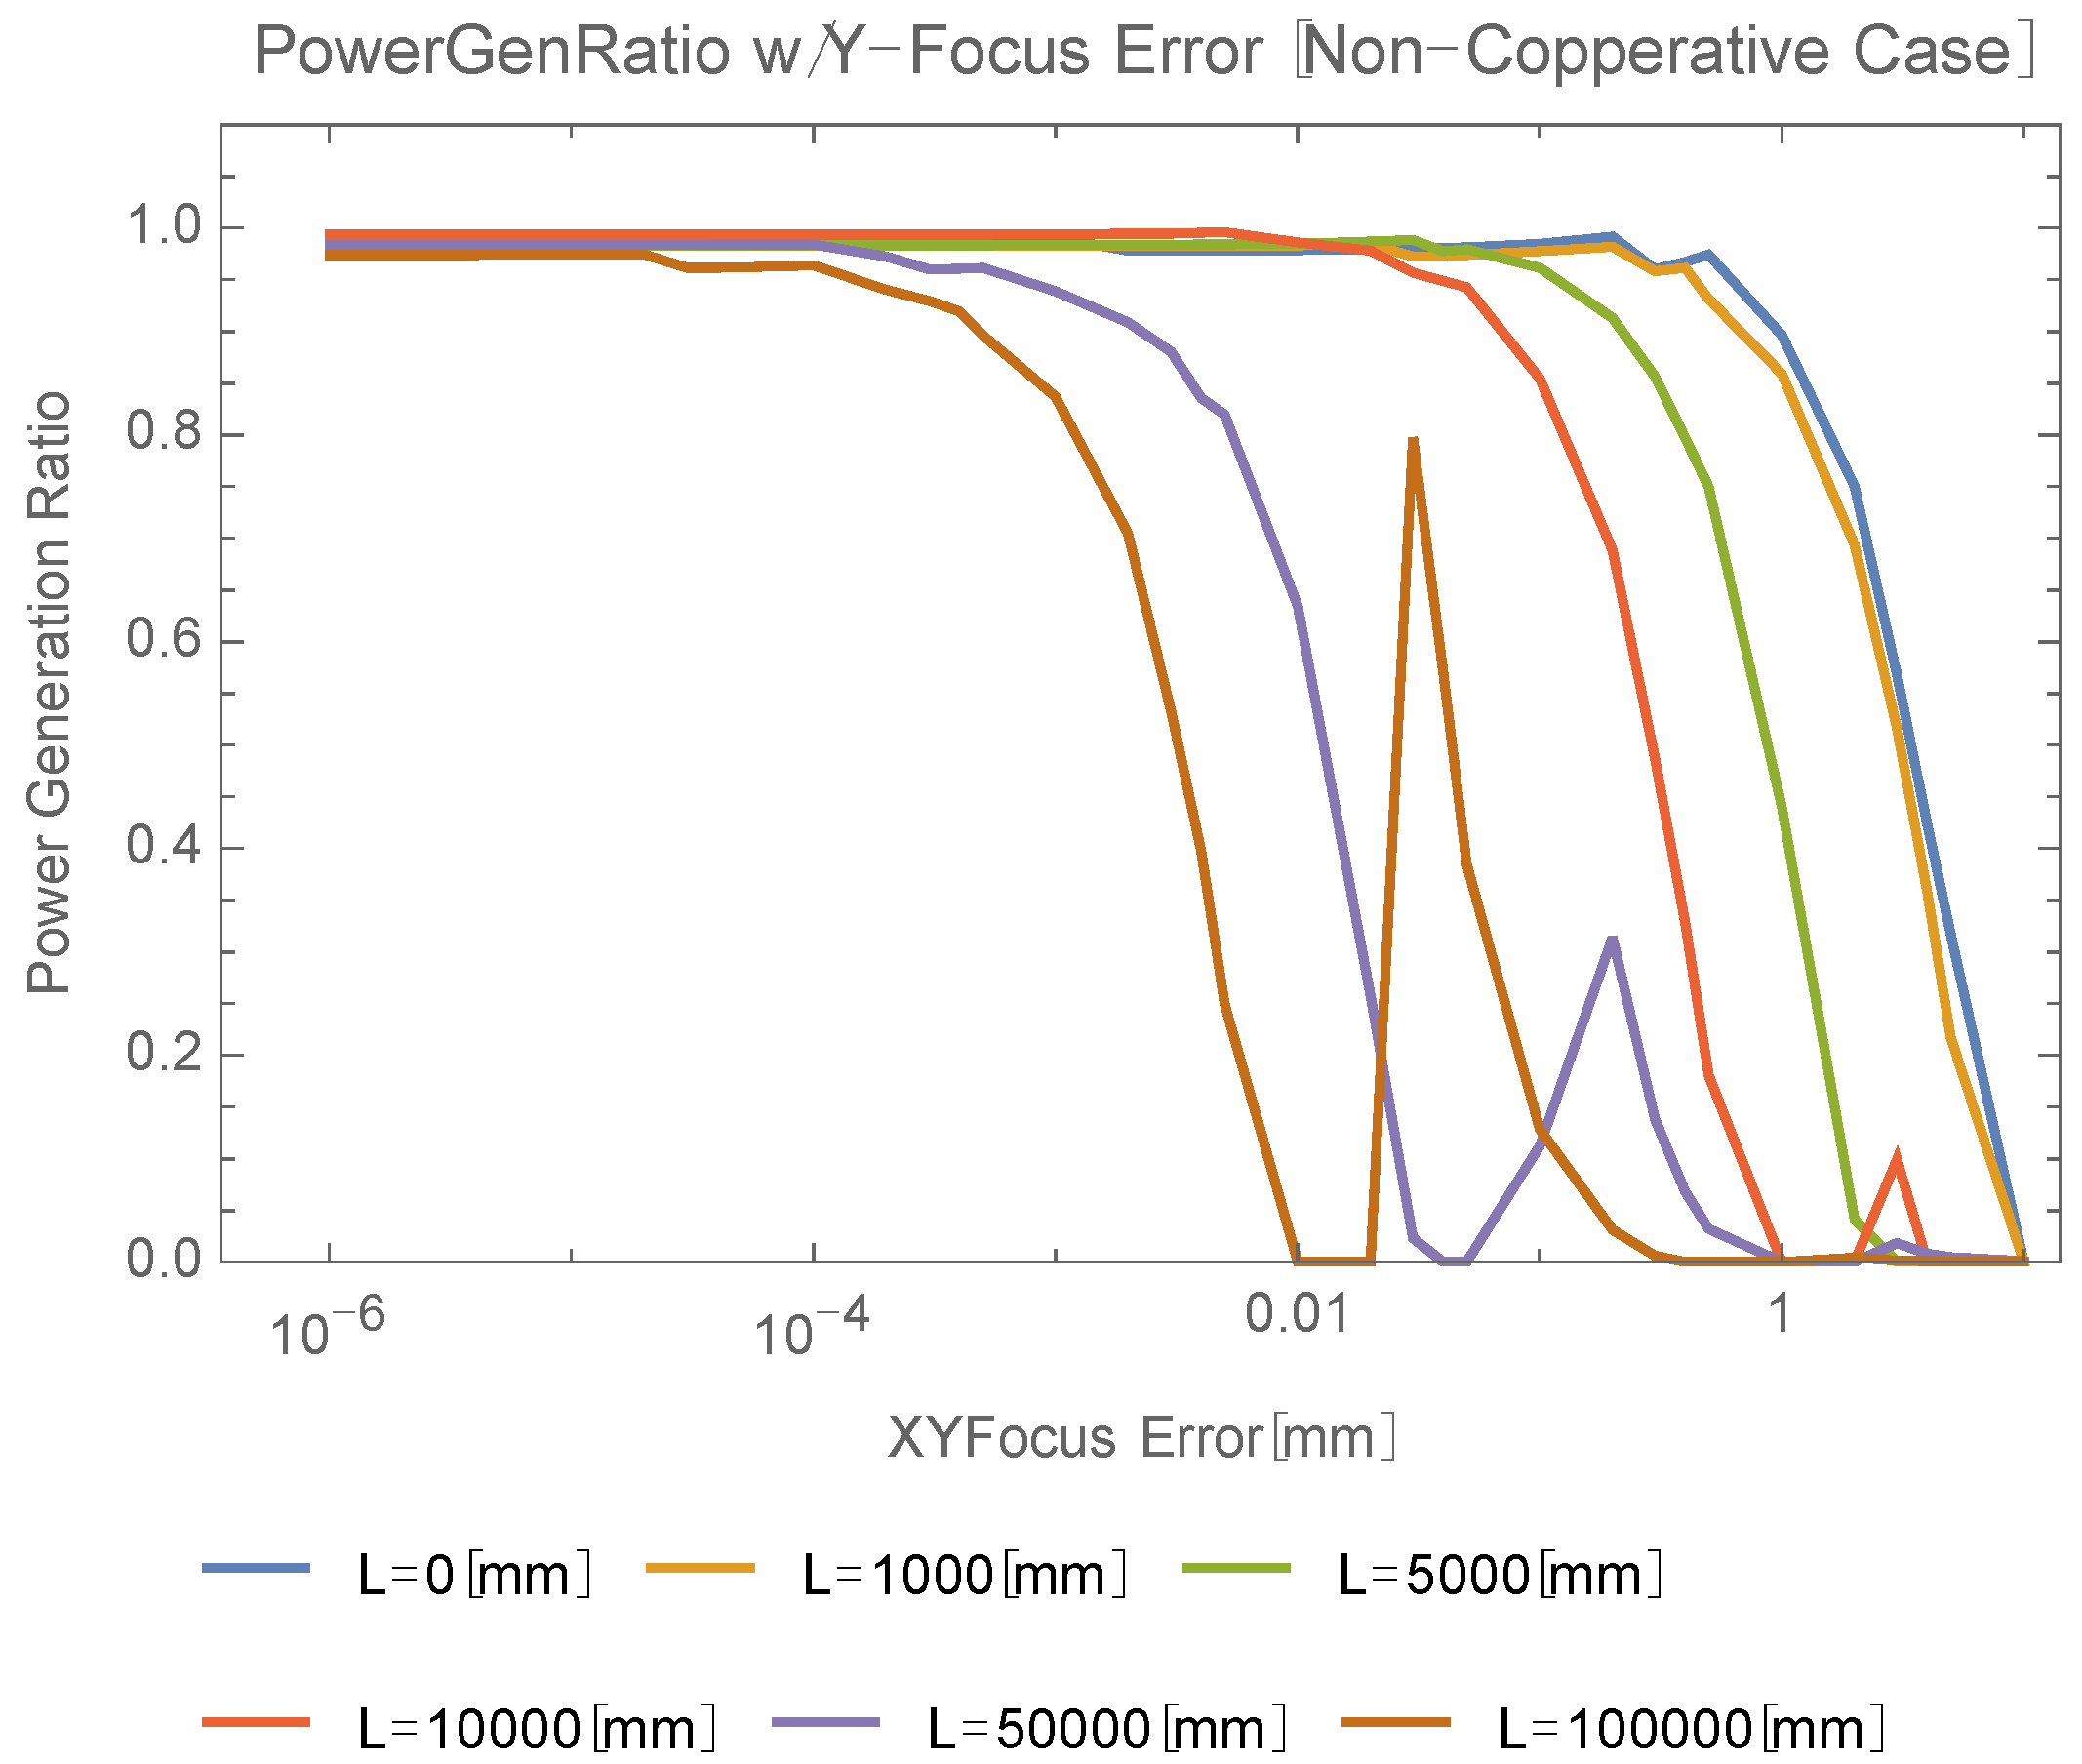
To control the beam size to accommodate the solar cell array module size, (de)focusing control of the beam expander is necessary. Its accuracy requirement would strongly affect the feasibility and cost of system. In this section, X and Y direction focus adjustment accuracy requirements are investigated based on the power generation ratio. Figure 4 shows the sensitivity analysis of the power generation ratio for focus adjustment errors with various positions (L) of the array. Assume the power generation ratio to be more than 80%; the requirement for focus adjustment depends on L, e.g., less than 2.3 mm (L = 1 m), 76 μm (L = 10 m), or 1.2 μm (L = 100 m). When the X-focus error is increased from zero in each plot, the size of the incident beam in the X direction decreases, and then the beam becomes focused. The beam size increases again after the focus point with additional increments of the error. With an increase of beam size, the power generation ratio increases again and has its second peak. Such peaks are seen in each plot in Figure 4. Details of the power generation ratio simulation including focus perturbation are summarized in Appendix C.
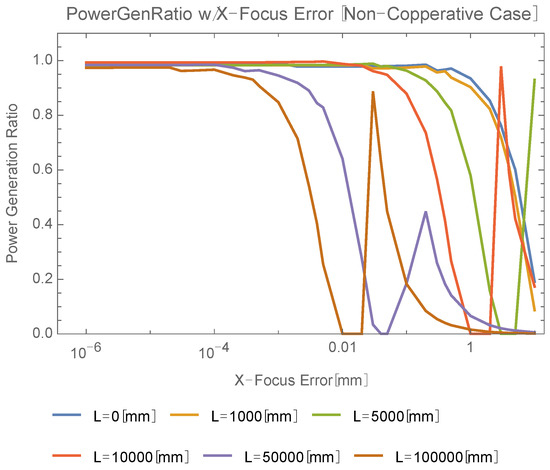
Figure 4.
X direction focus adjustment dependence of power generation ratio.
Similar requirements were obtained for the Y direction (Figure 5). Similar peaks in the power generation ratio were observed to those in Figure 4. Determined at an 80% power generation ratio, the requirements for focus adjustment are, e.g., less than 1.32 mm (L = 1 m), 132 μm (L = 10 m), or 1.2 μm (L = 100 m).
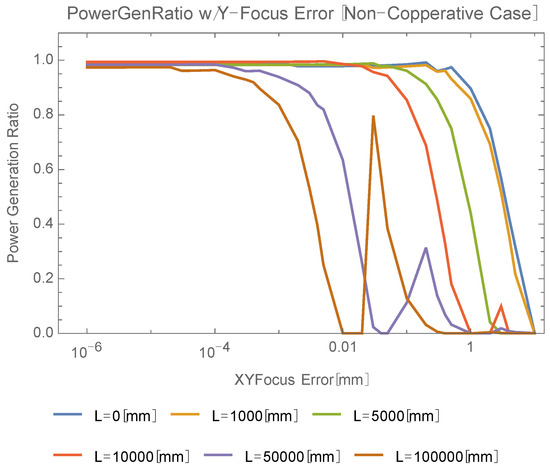
Figure 5.
Y direction focus adjustment dependence of power generation ratio.
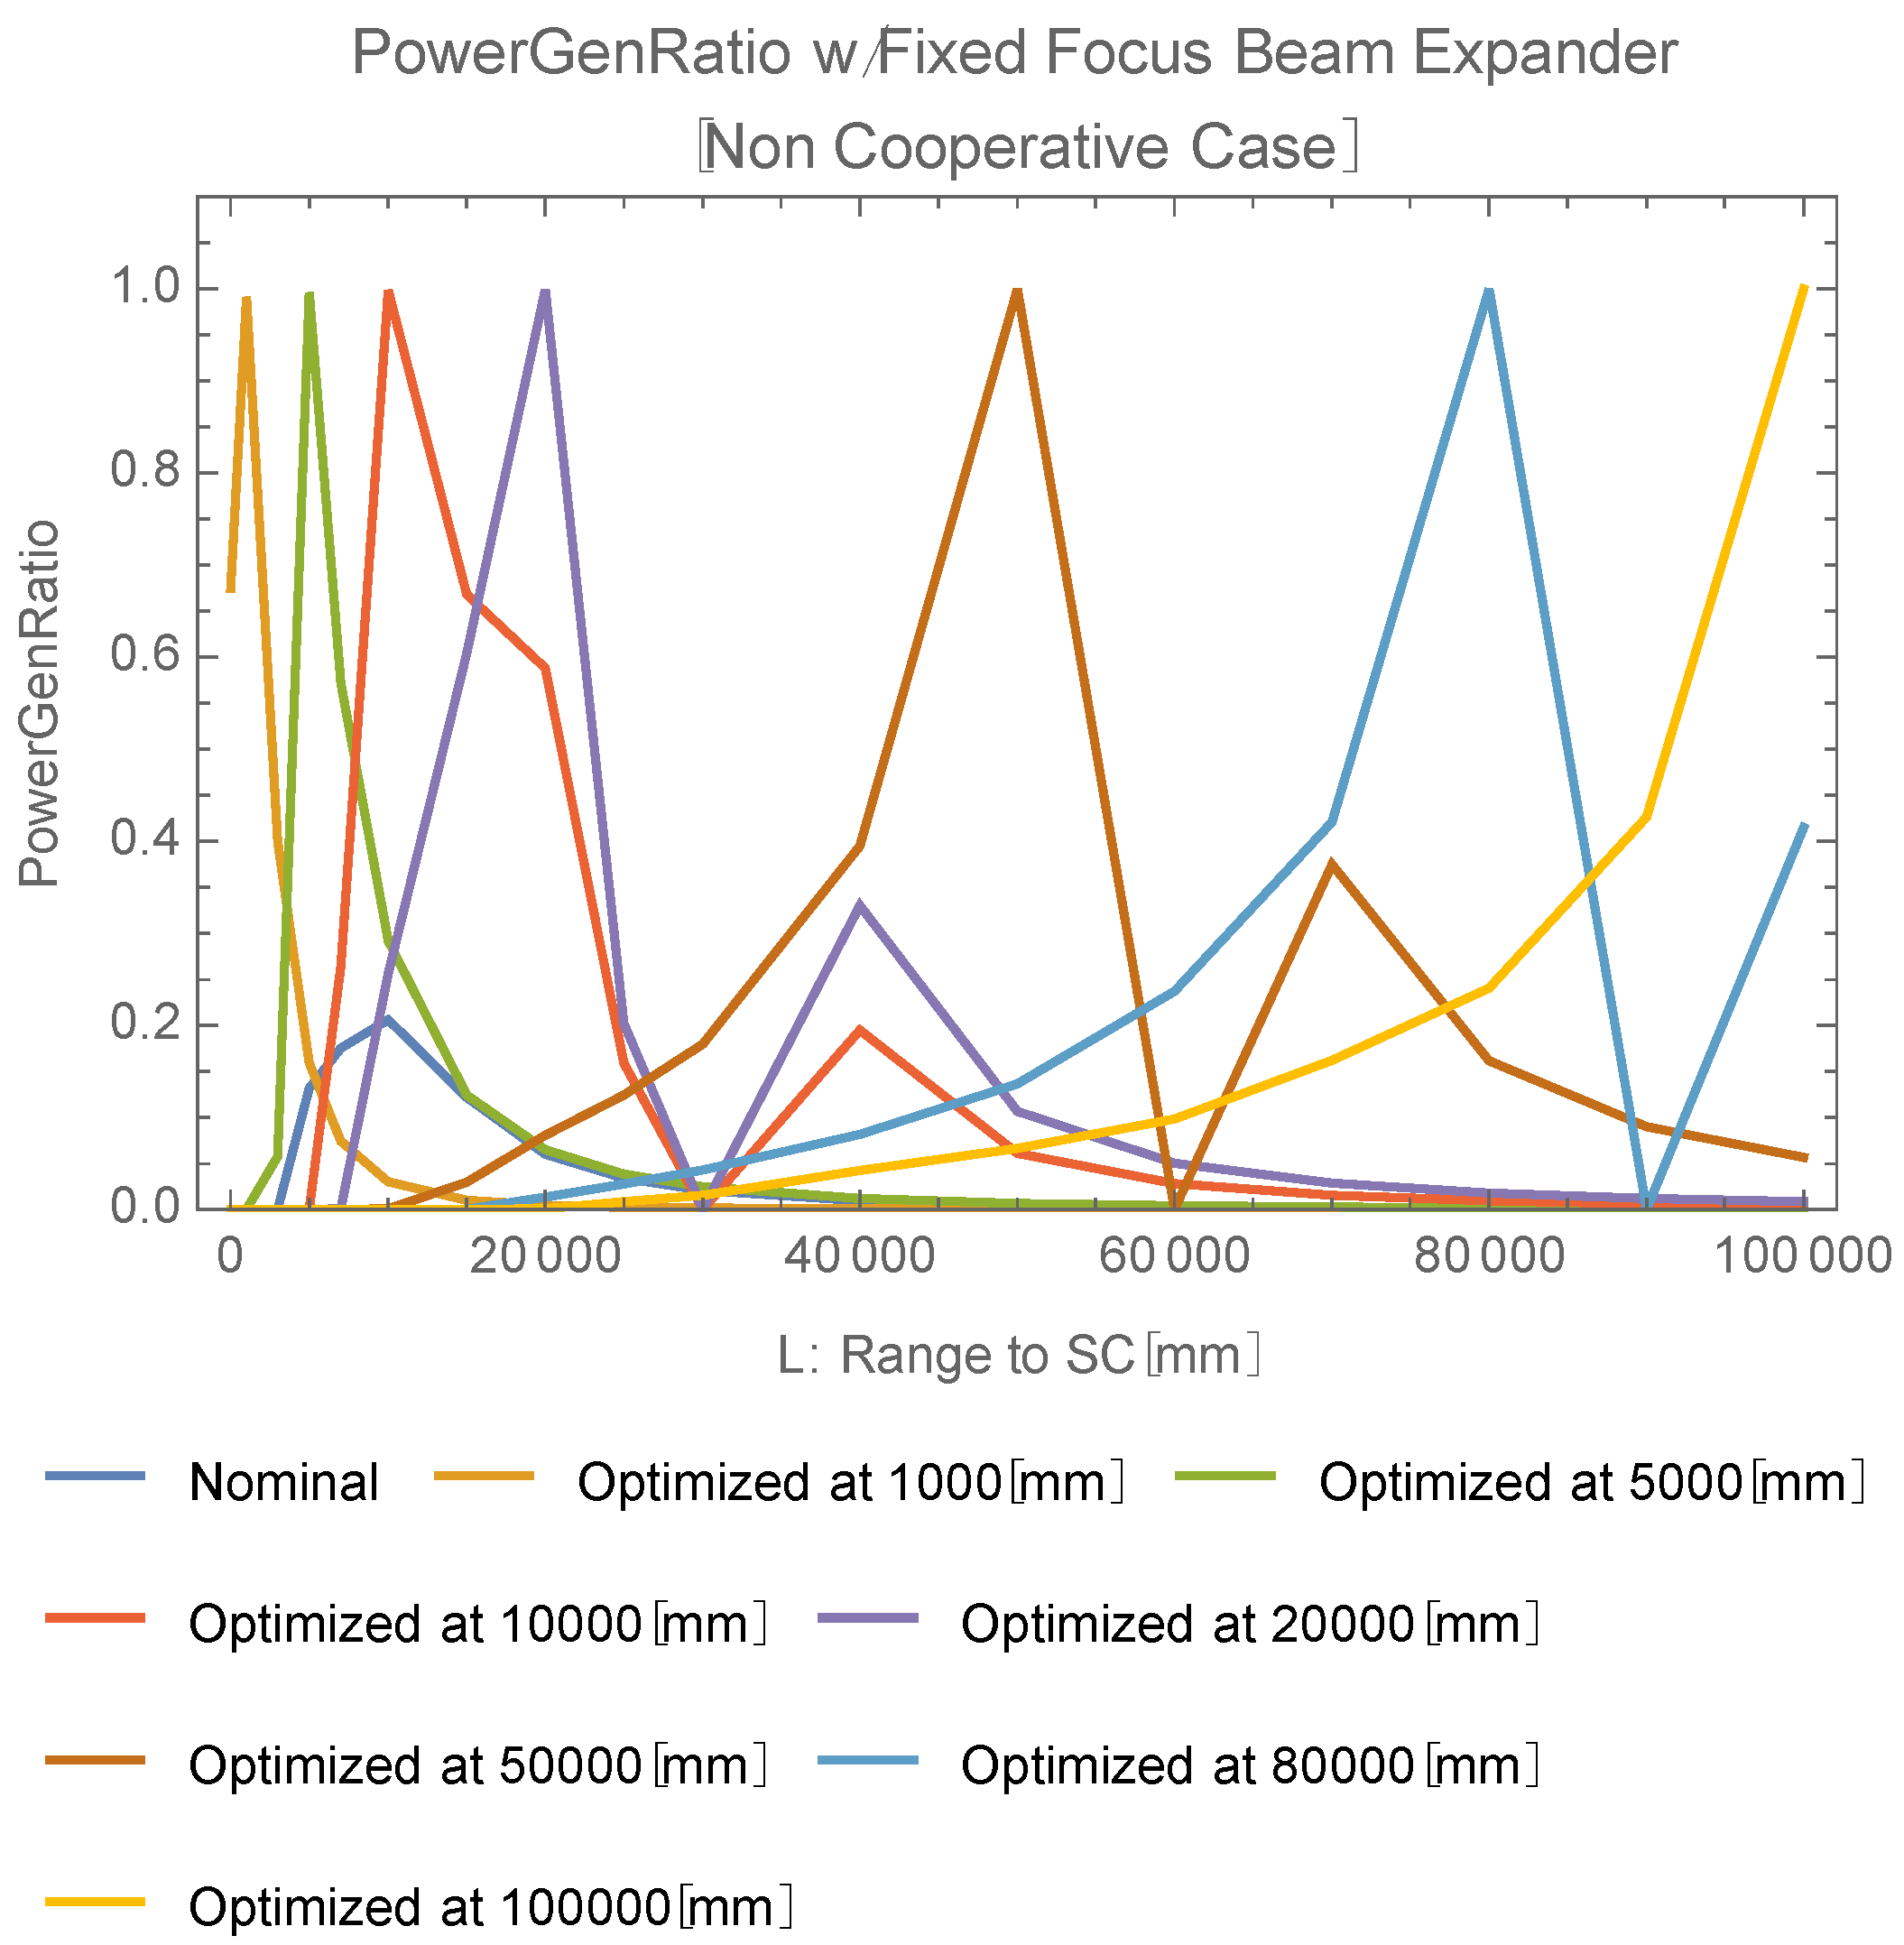
To optimize the power generation ratio, focus adjustment is always required for each L. For a moving array, this requires real-time focus control based on range information. To relax this requirement for focus control, the feasibility of a simpler system was investigated. Assume that focus is optimized not continuously for each target range (L) but optimized at a fixed range such as 0 m, 1 m, 5 m, 10 m, 20 m, 50 m, 80 m, or 100 m. This leads to several power generation ratio plots for such ranges. Figure 6 shows each power generation ratio dependence on the selected L. When both X and Y focuses are optimized and fixed for a particular range, the power generation ratio varies much according to L. This result strongly restricts the operation of this system. Assume one requires the power generation ratio to be greater than 80%. From Figure 6, one can see the operation of this system is limited to less than 10% of the range of optimization, e.g., ±3 m for the ‘Optimized at 50,000 mm’ plot. This substantially does not relax the system requirements, and it is recognized as necessary for the transmitter to track the range (L) to the array and to adjust focus appropriately for each L.
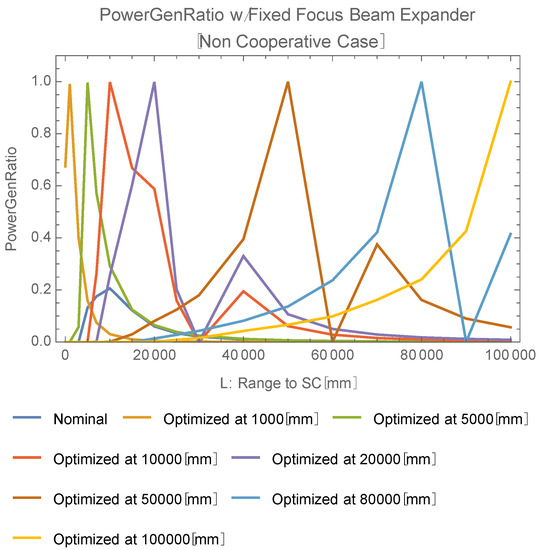
Figure 6.
Range dependence of power generation ratio of fixed focus (non-cooperative OWPT).
4.4. Requirement for Beam Alignment
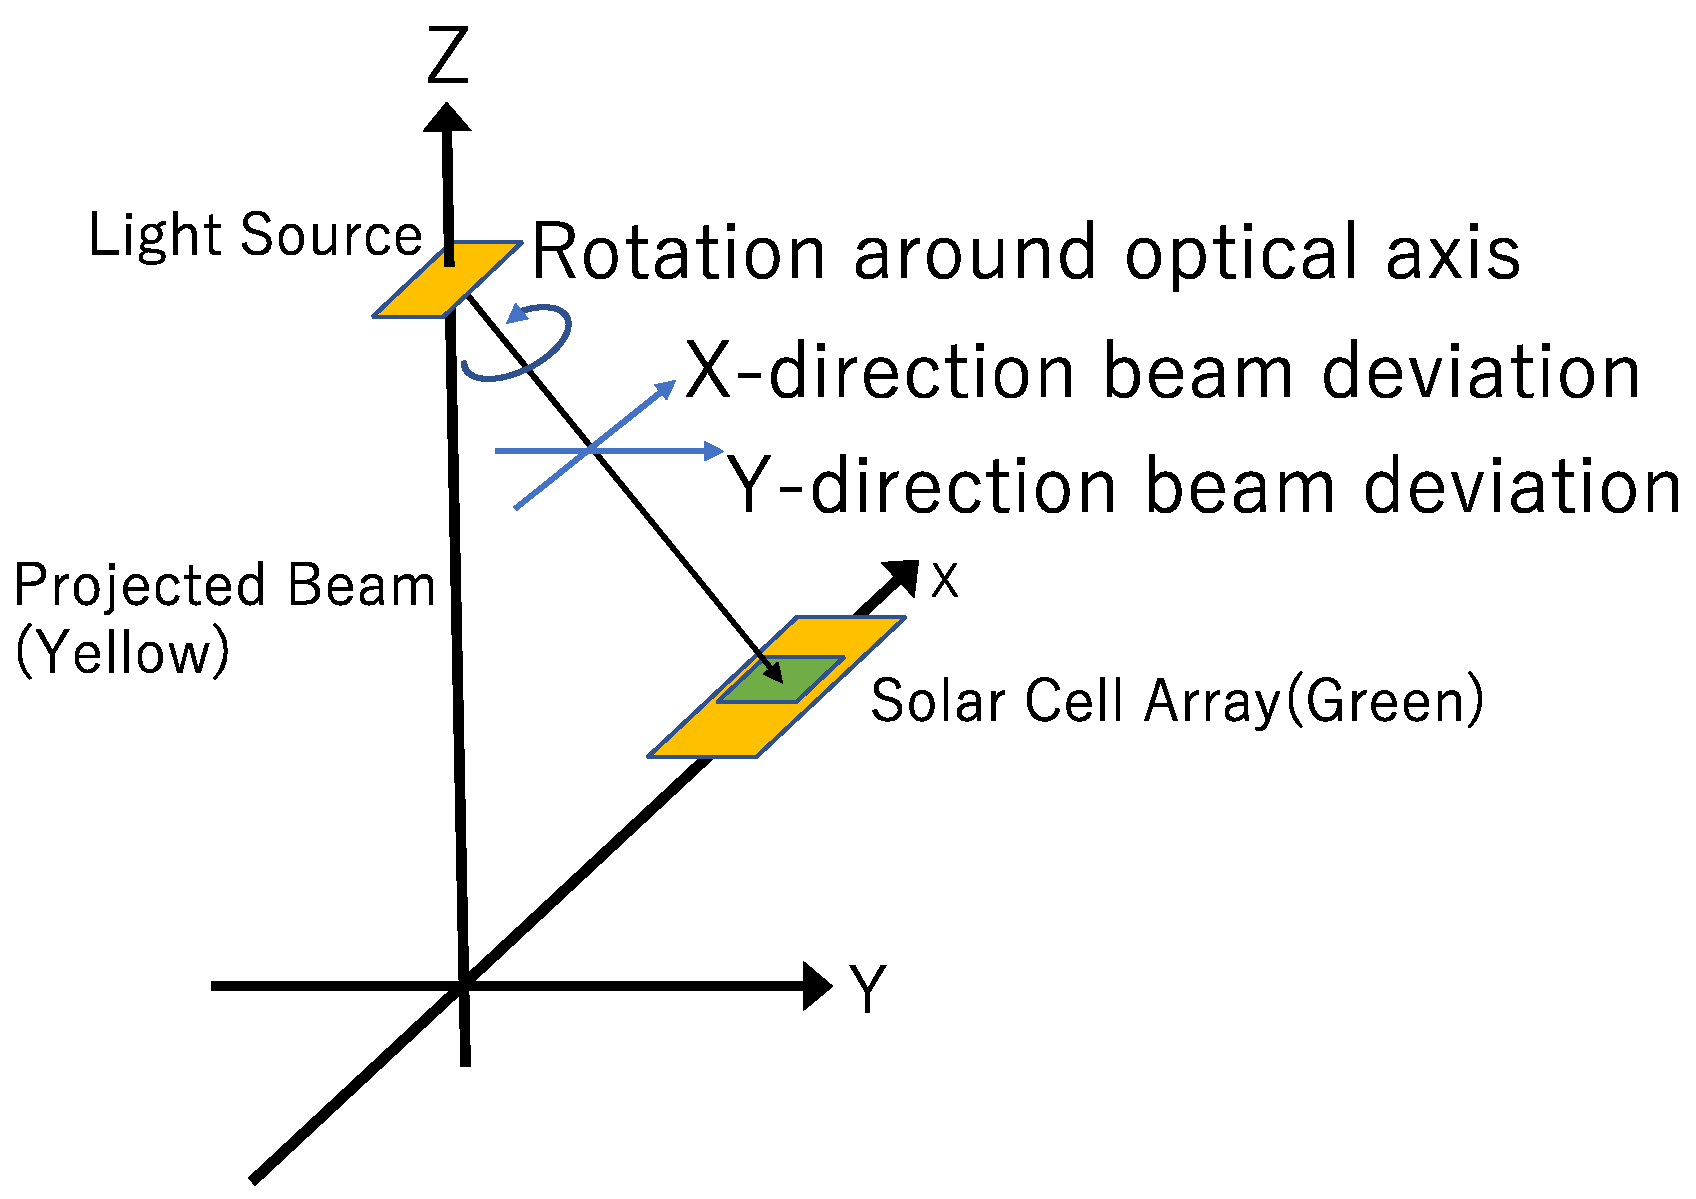
Since the solar cell array is fixed in a non-cooperative OWPT, the necessary DoF for beam alignment is 3, which is the relative attitude between the light source and the array. To determine beam alignment allowance, one needs to calculate the power generation ratio for the Figure 1 configuration with beam deviation along the X direction, Y direction, and rotation around the beam propagation direction (defined as the ‘optical axis’) (Figure 7). Details of the simulation method of the power generation ratio including such rotational perturbation are summarized in Appendix C.
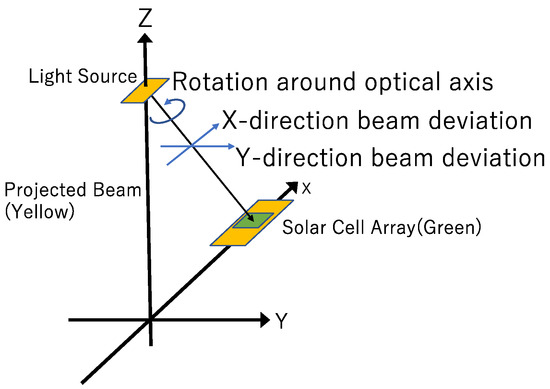
Figure 7.
Beam alignment freedom in the analysis (non-cooperative OWPT).
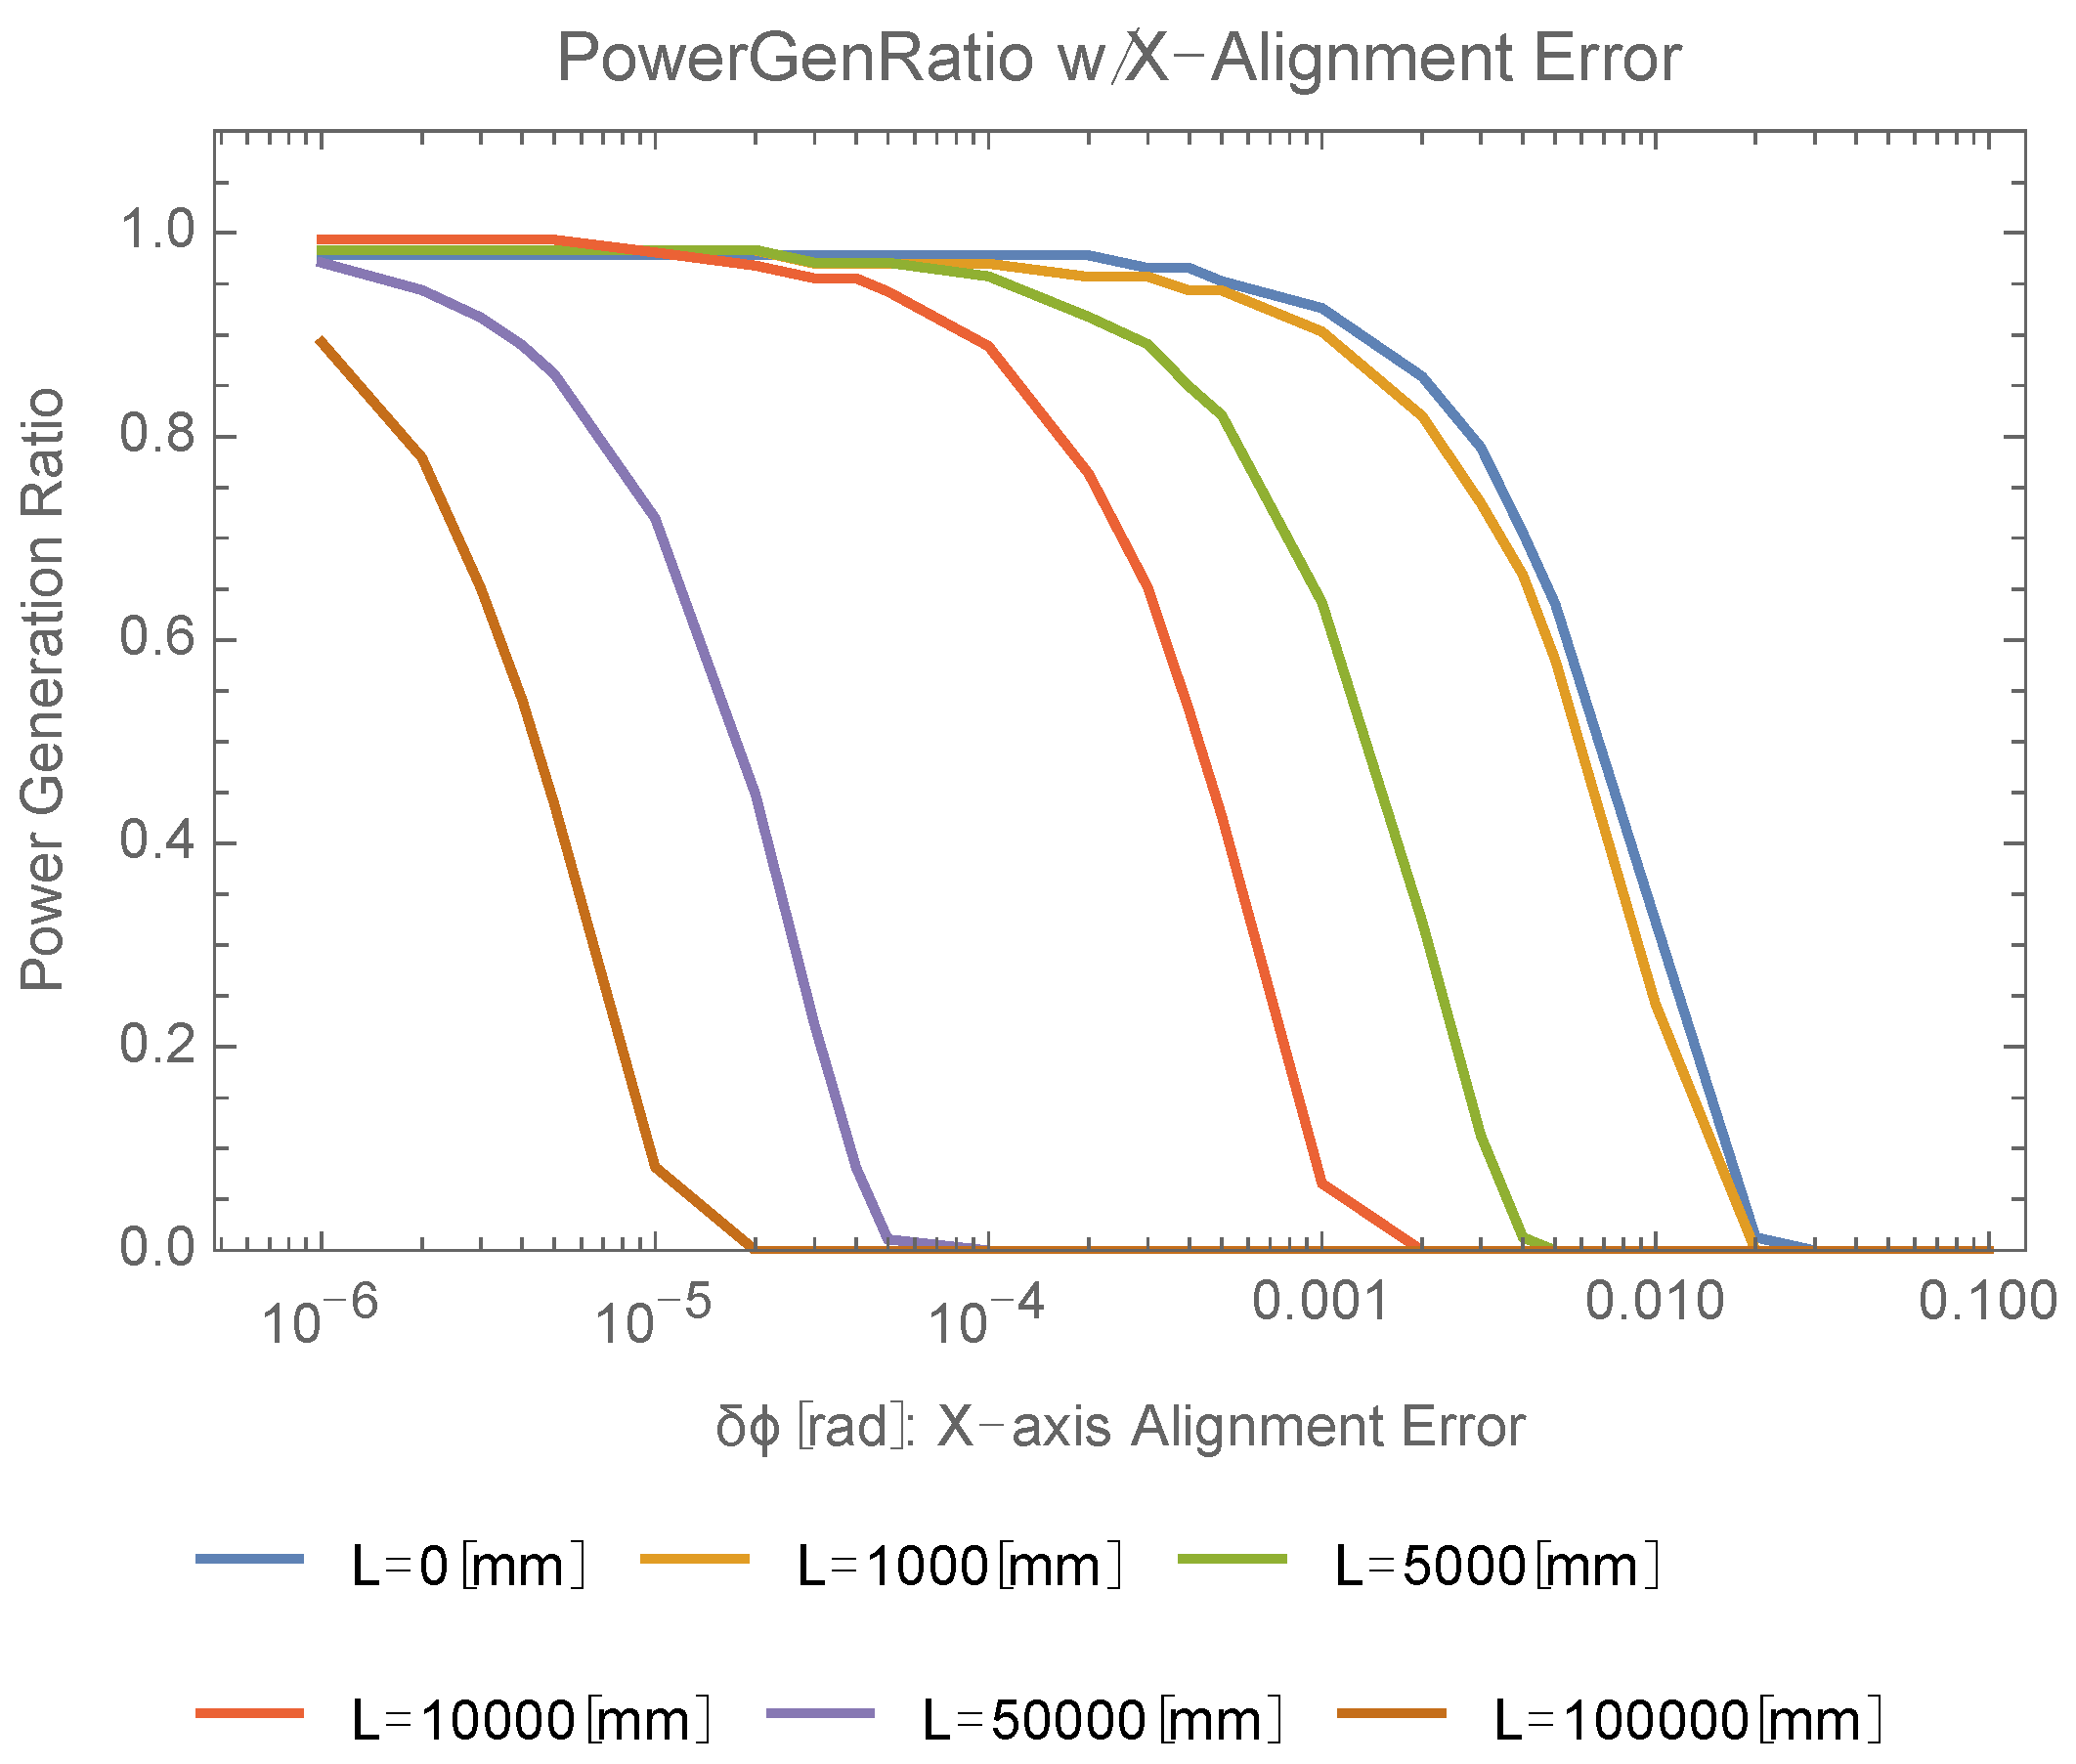
The beam propagates towards the center of the solar cell array, then power generation ratio is calculated with beam deviation along the X direction, which means rotation around the Y-axis (Figure 8). Determined at an 80% power generation ratio, requirements for beam deviation along the X direction are, e.g., less than 2.21 mrad (L = 1 m), 149 μrad (L = 10 m), or 11.7 μrad (L = 100 m).
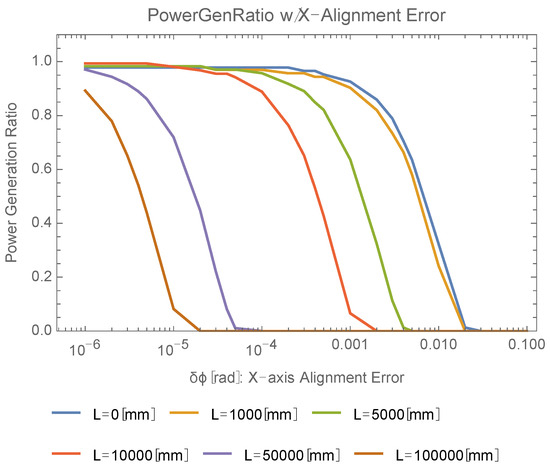
Figure 8.
X direction beam deviation dependence of power generation ratio.
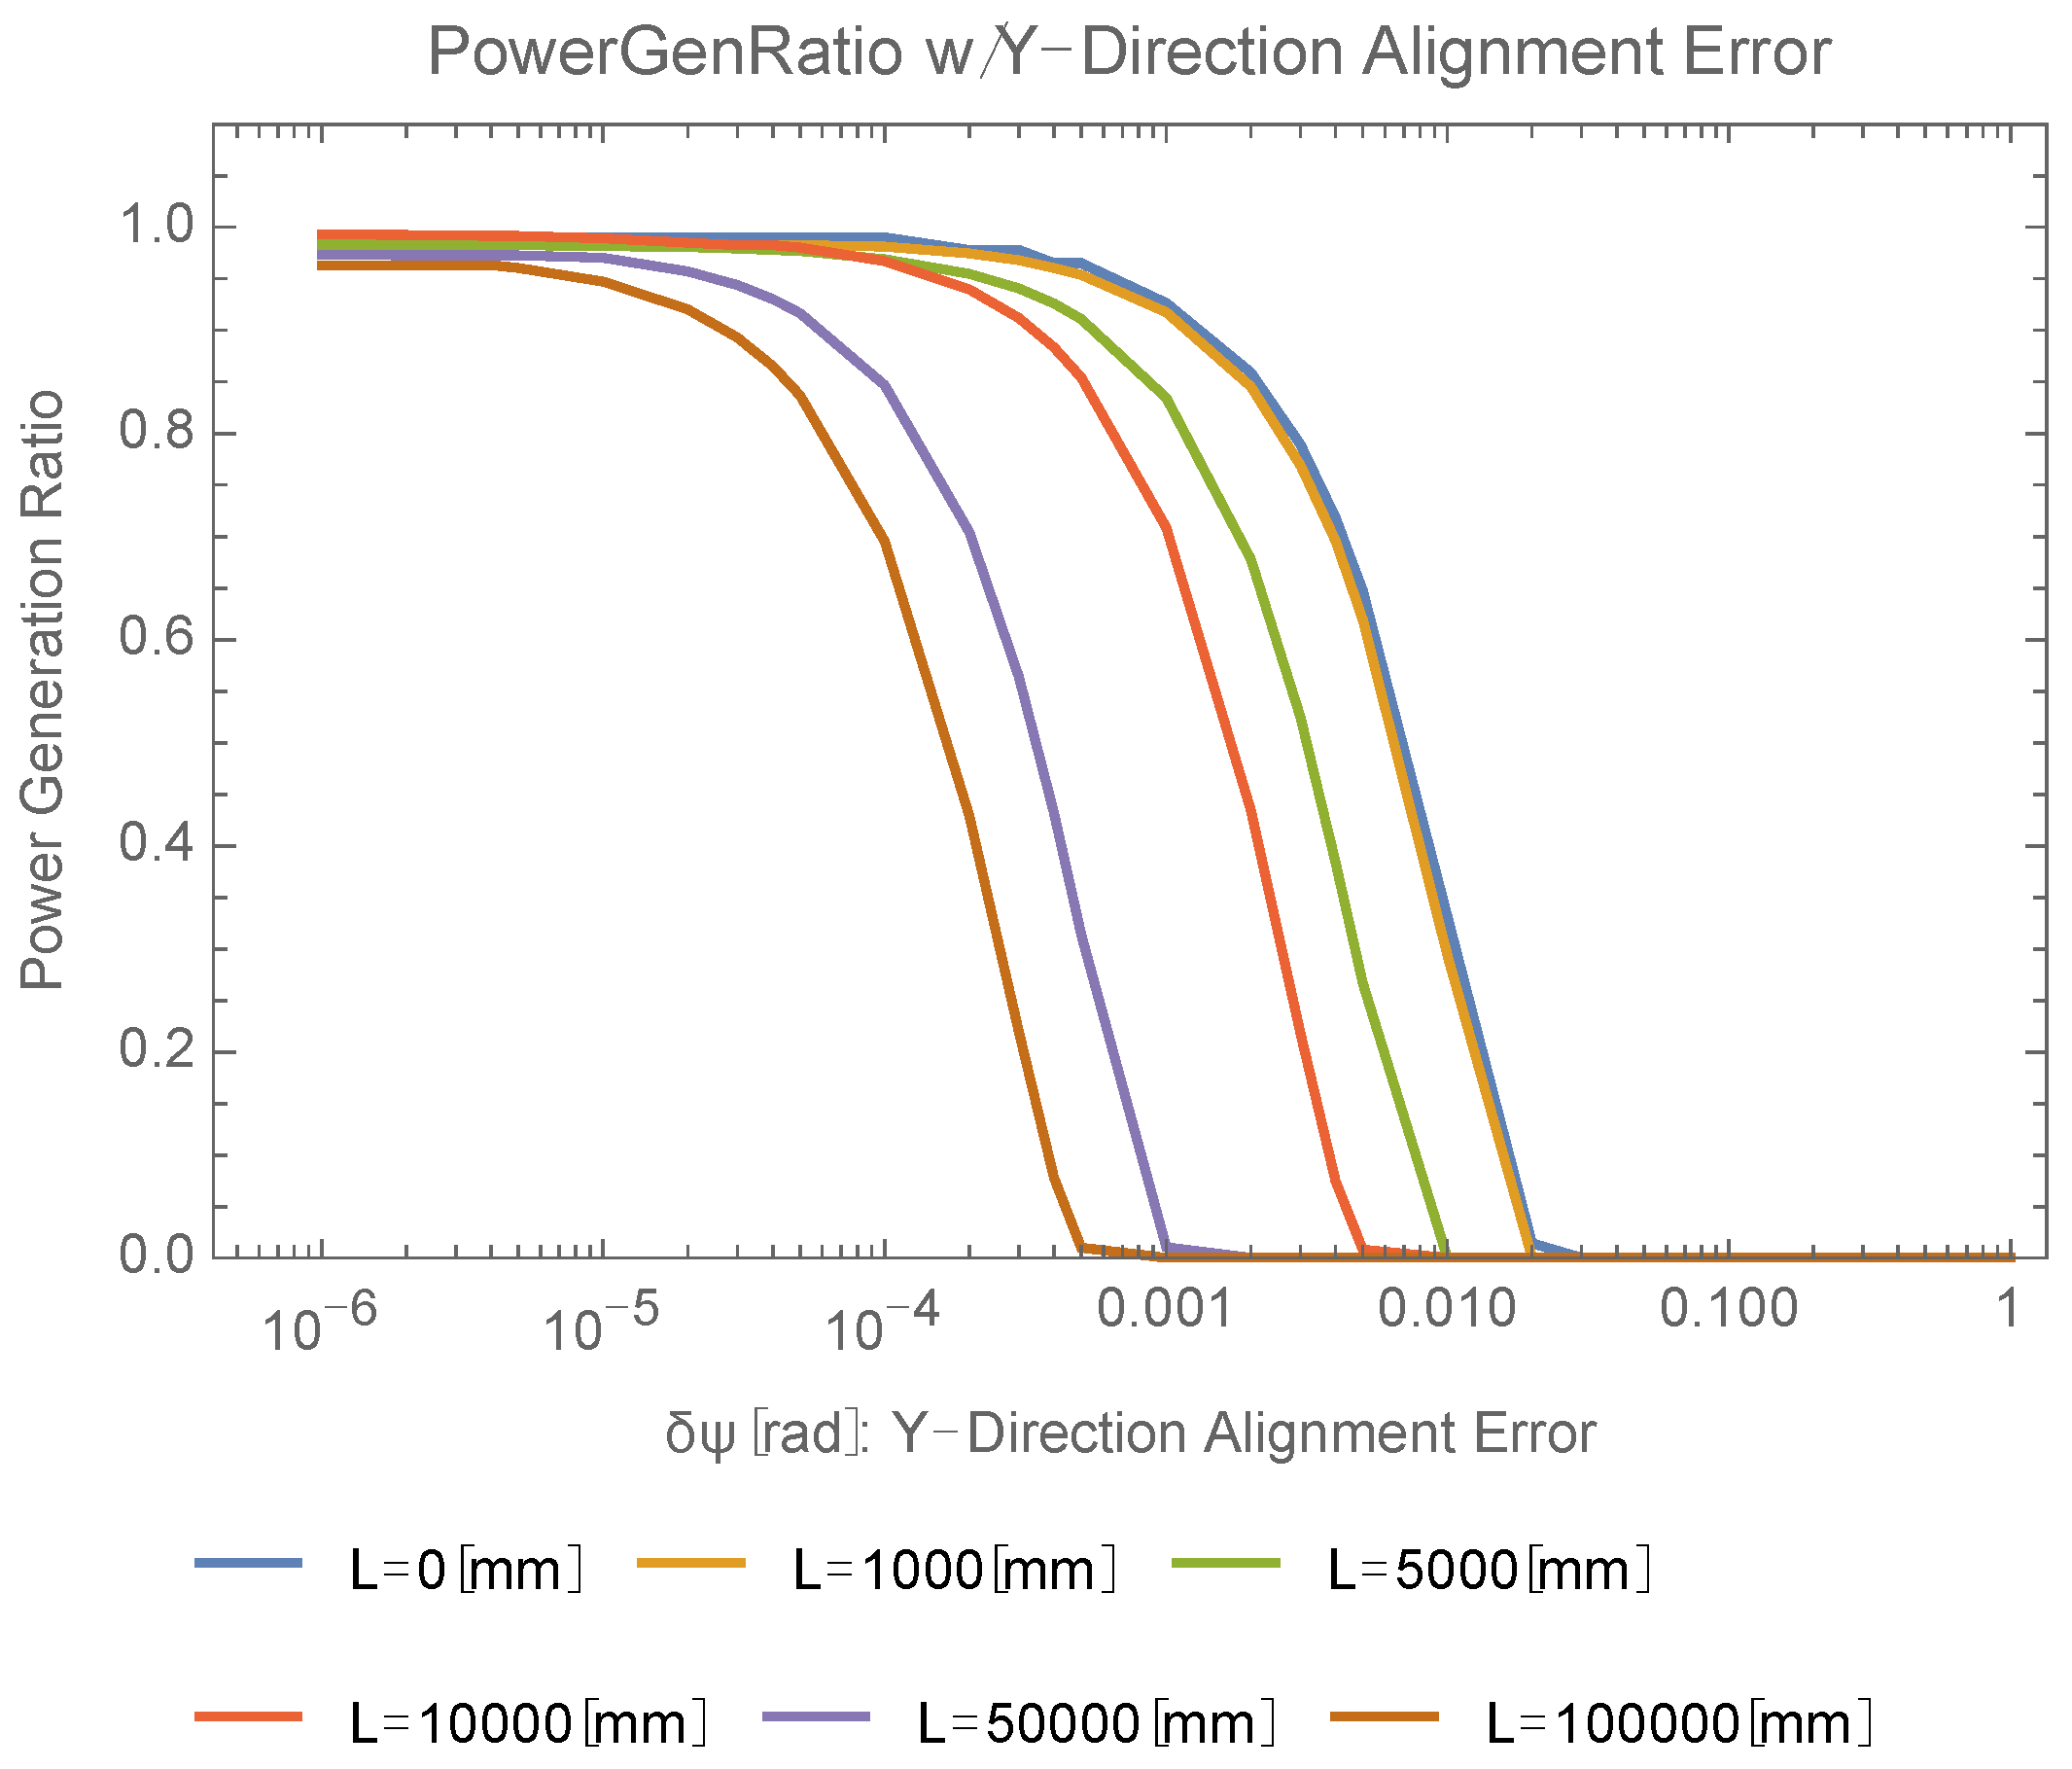
Similarly, the power generation ratio for the Y direction beam deviation, which is rotation around the X-axis, was calculated (Figure 9). Determined at an 80% power generation ratio, requirements for the beam deviation along the Y direction are, e.g., less than 2.51 mrad (L = 1 m), 631 μrad (L = 10 m), or 57.5 μrad (L = 100 m).
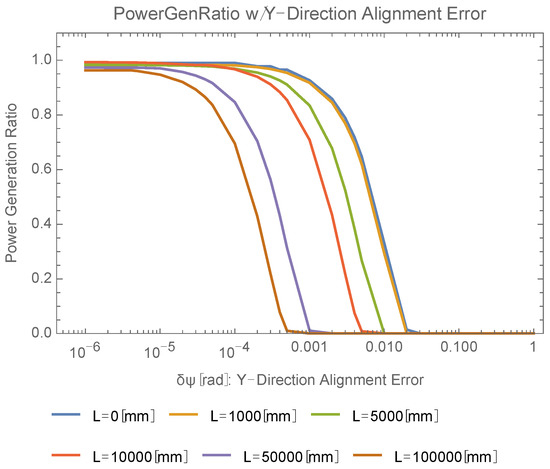
Figure 9.
Y direction beam deviation dependence of power generation ratio.
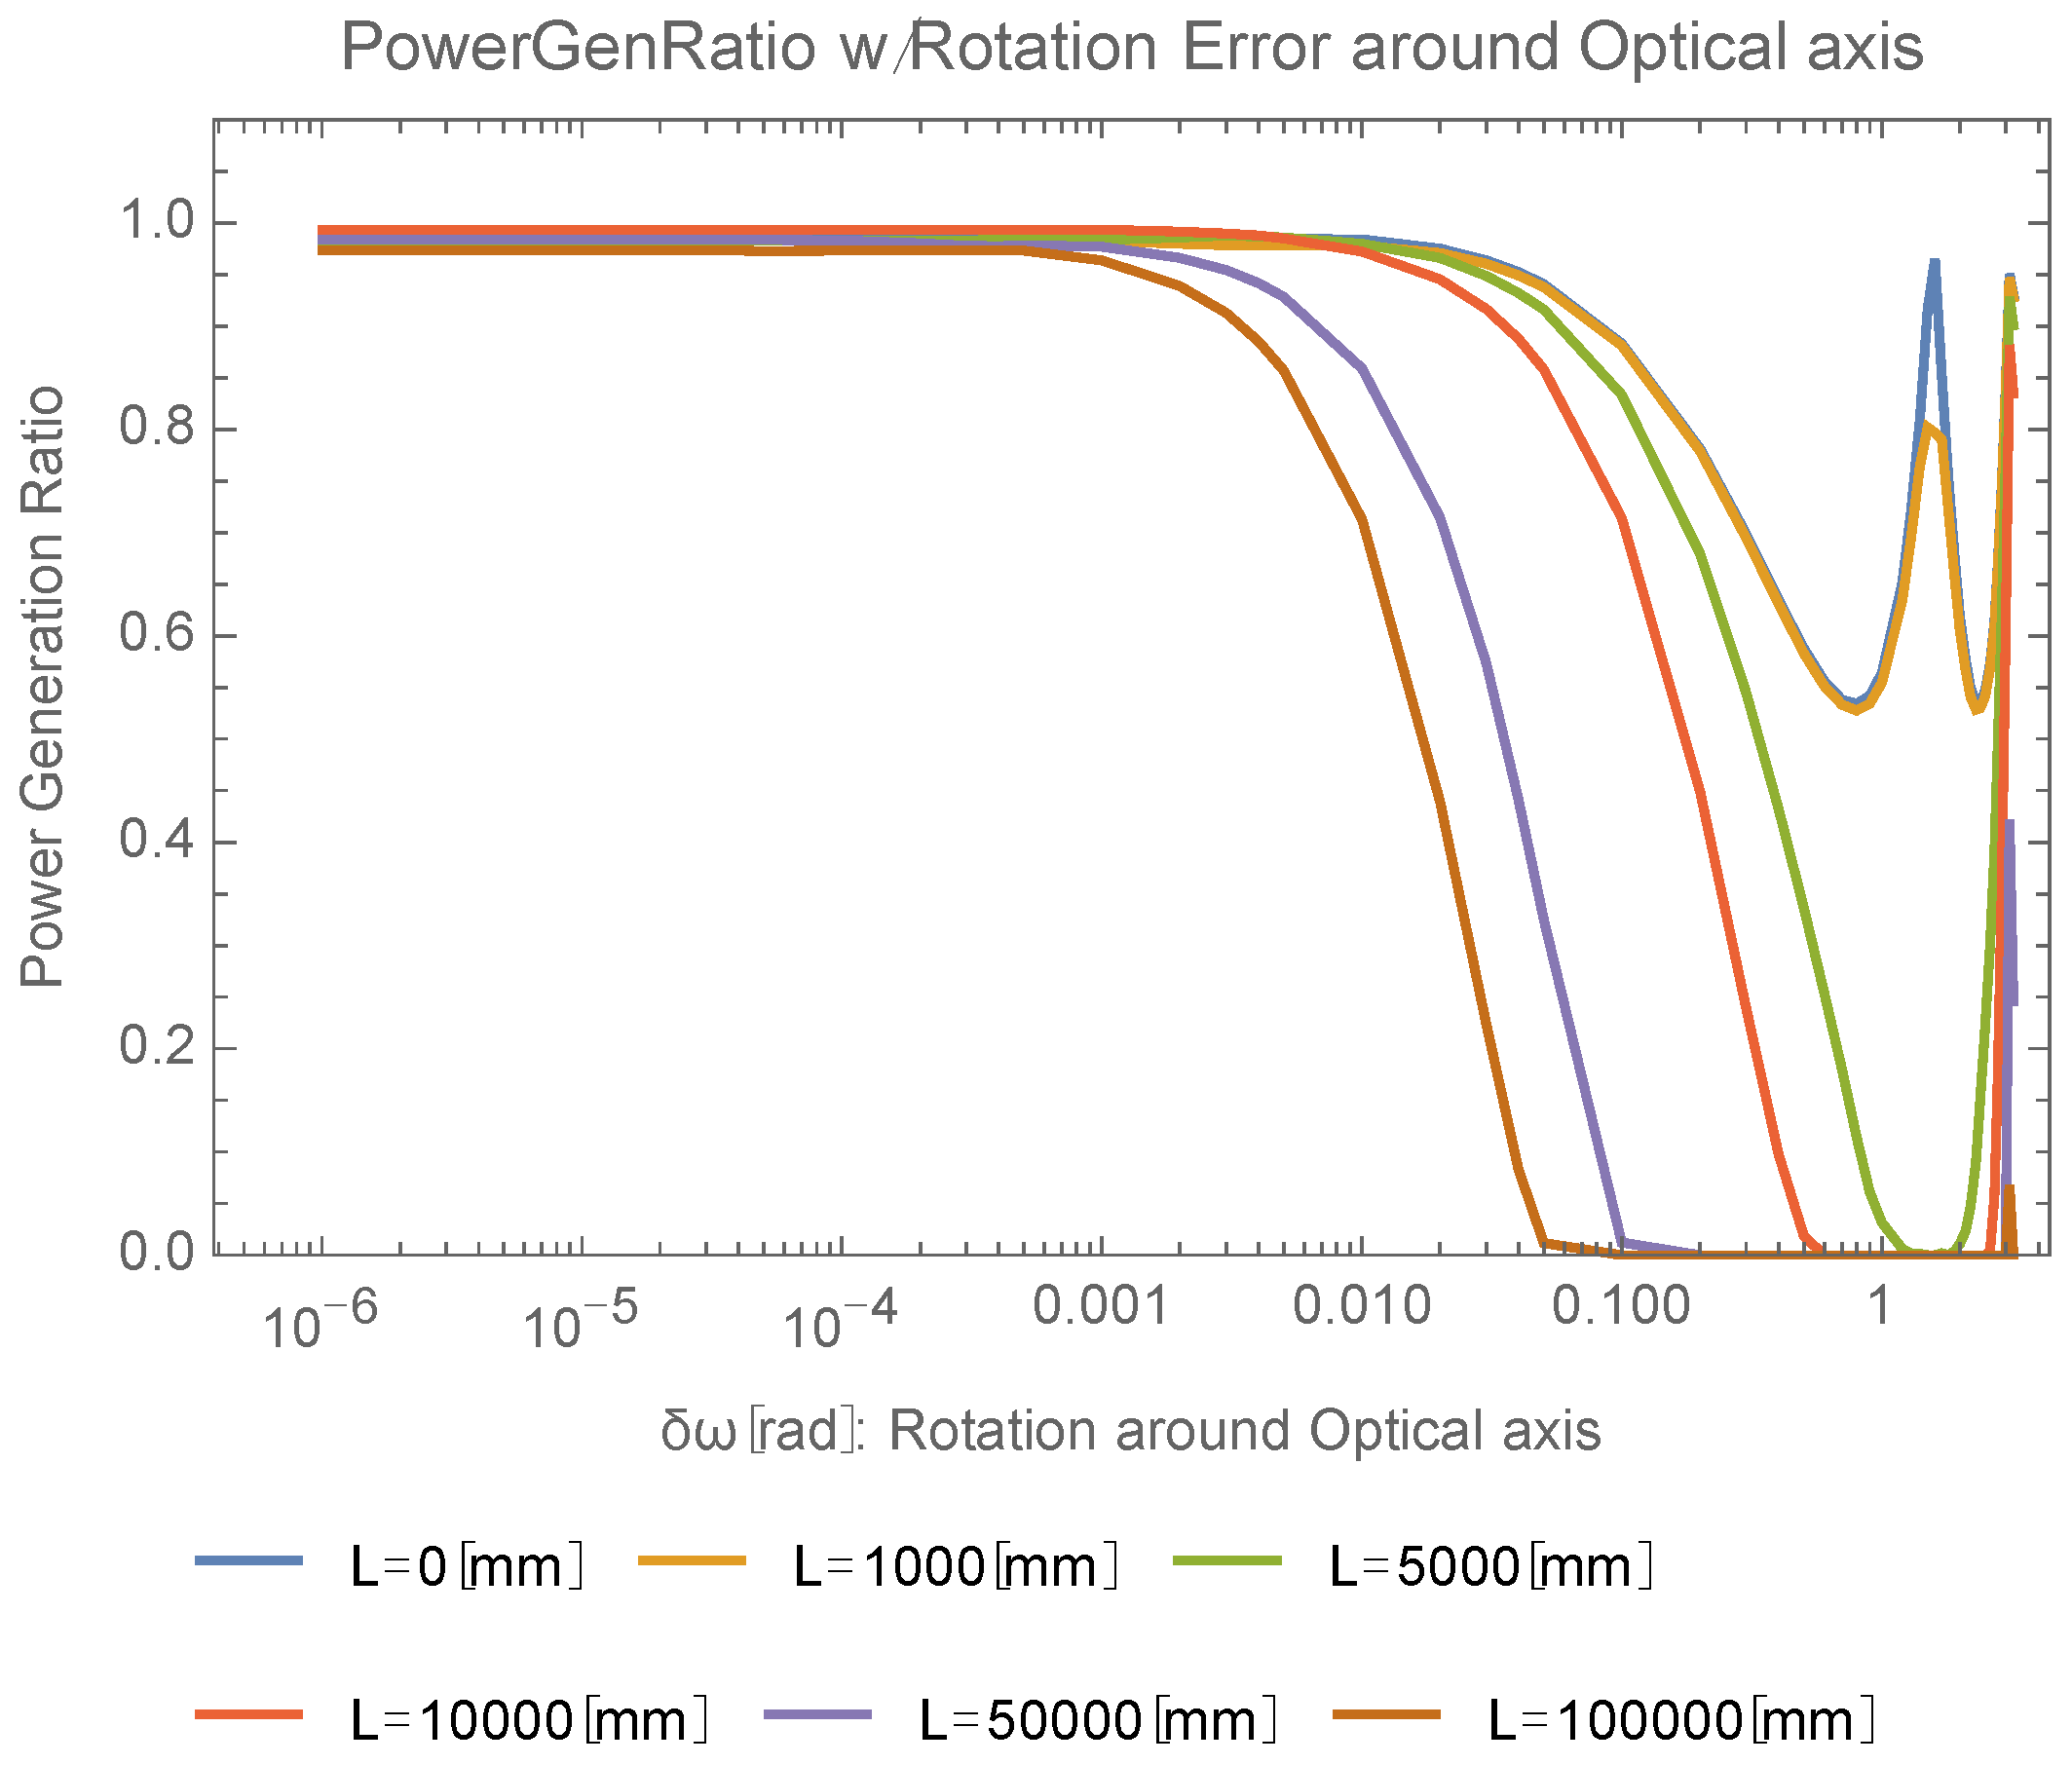
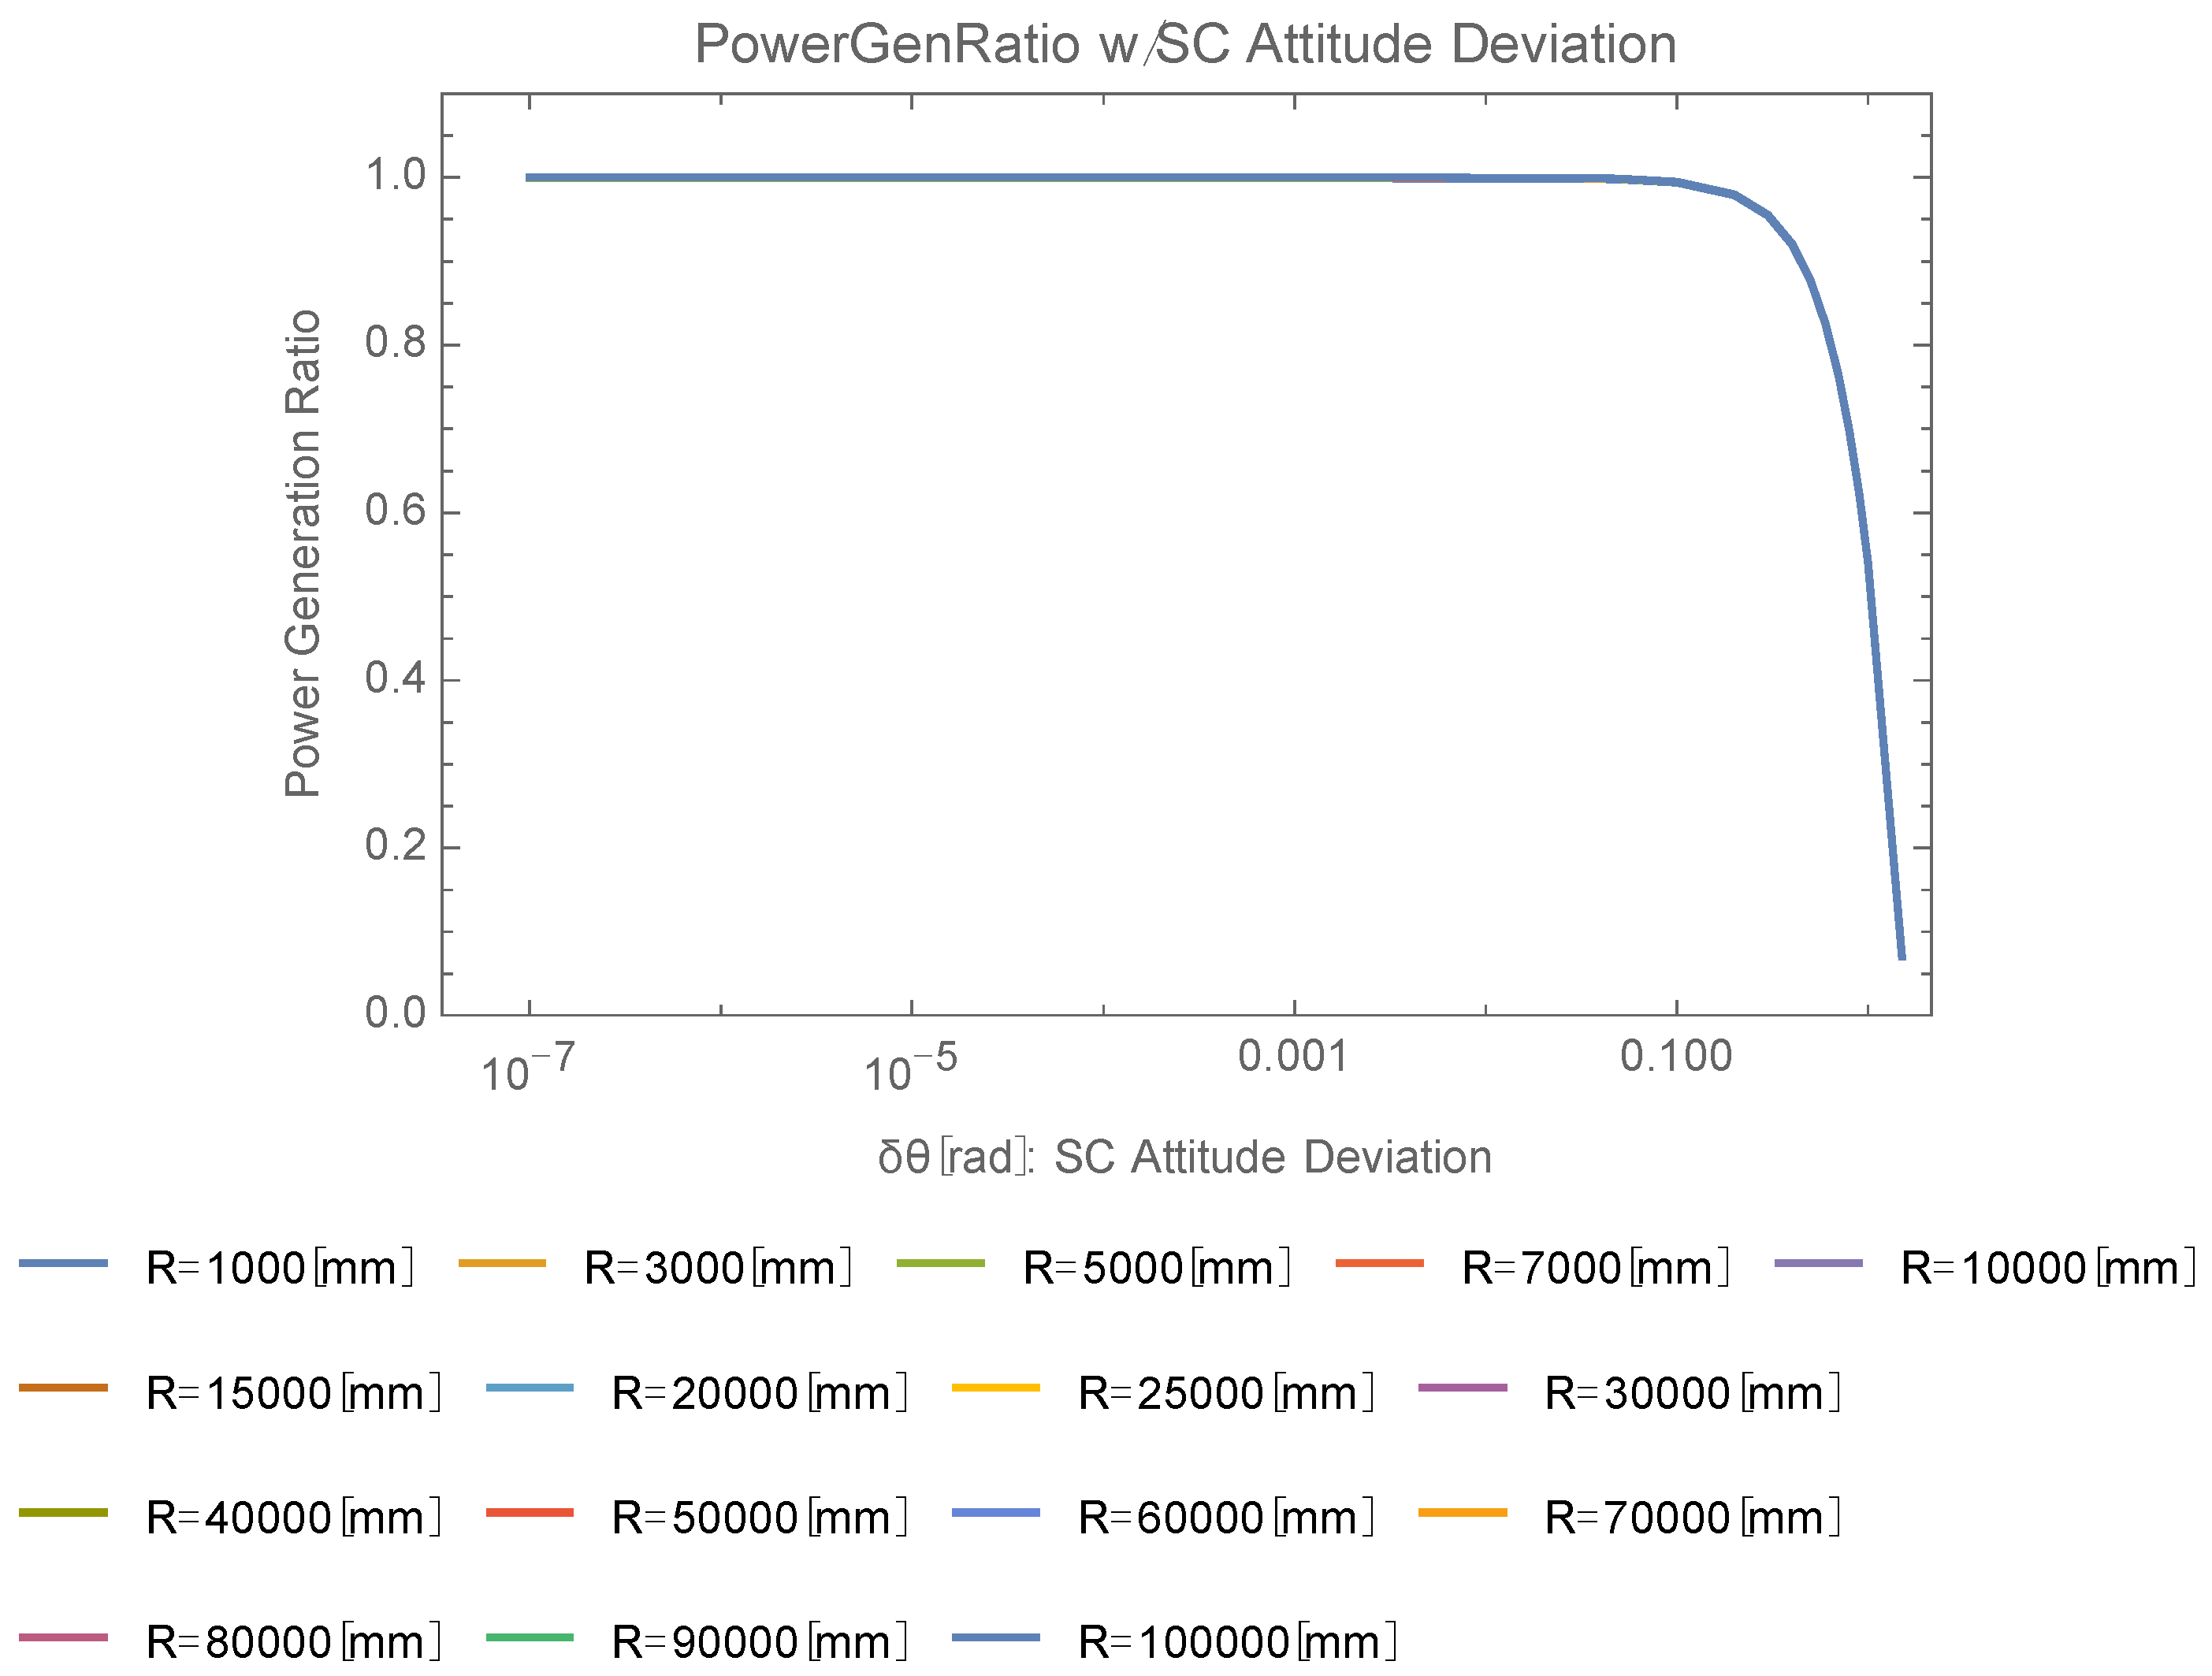
The power generation ratio is calculated when the beam is rotated around its optical axis (Figure 10). When the beam shape is rotated around the optical axis, it produces multiple peaks of the power generation ratio every 180-degree (π rad) rotation angle because of mirror symmetry of the beam shape about the X-axis. For plots for small L, the projected beam shape is square-like. When such a beam is rotated, it produces additional sub-peaks at 90-degree (π/2 rad) rotation angles because of its approximate π/2-rotational symmetry around the optical axis. Those peaks of power generation ratio are observed in Figure 10. Determined at an 80% power generation ratio, requirements for beam rotation around optical axis are, e.g., less than 182 mrad (L = 1 m), 74.1 mrad (L = 10 m), or 6.7 mrad (L = 100 m).
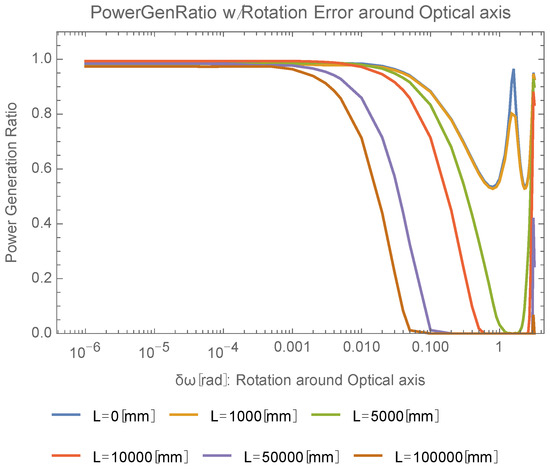
Figure 10.
Rotation angle dependence of power generation ratio around optical axis.
Requirements for X and Y direction deviation are quite strong. Assume their maximum angular control range is ±π/2 radian. The necessary resolution would be 2000–5000 in L < 10 m, 8000–80,000 in L < 30 m, and 2 × 10⁵–8 × 10⁵ in 40 < L < 100 m. A resolution of 2000 to 5000 in L < 10 m would be feasible by a single mechanism. However, there needs to be a quite accurate single mechanism or a complex combination of various single mechanisms for L > 10 m.
5. Beam Shaping and Beam Alignment Requirement in Cooperative OWPT
5.1. Geometrical Configuration and Optics
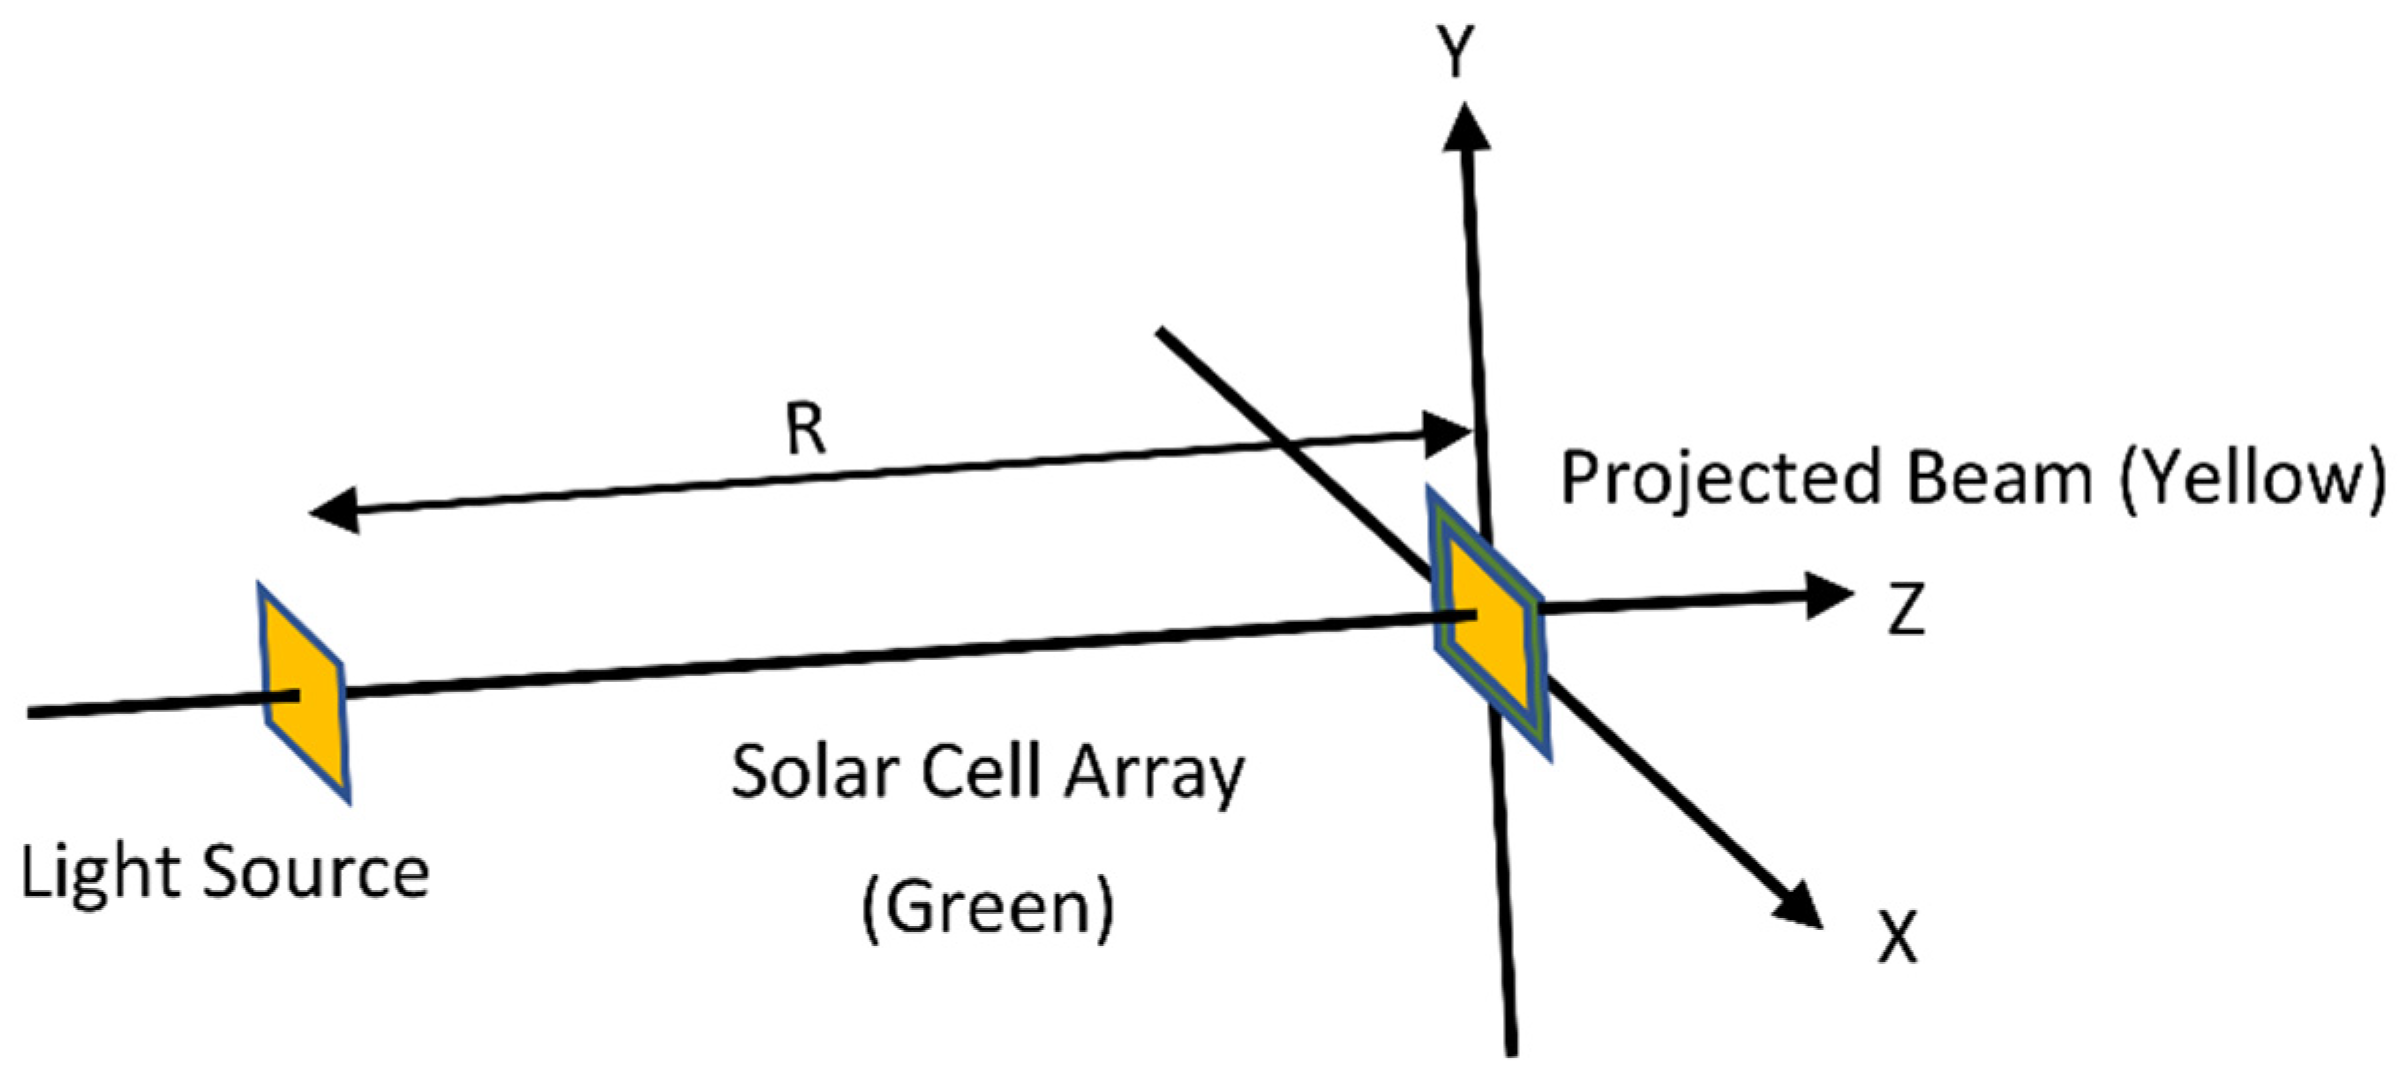
Assume a solar cell array module’s attitude is dynamically controlled and it always faces the transmitter (cooperative OWPT) (Figure 11). In this case, the transmitter optics does not need to independently control the X and Y directions and it is a single XY symmetrical beam expander, and its focus is adjusted using the relative range information between the module and the transmitter. Same as the condition in Section 3, the two lenses of the expander are of 150 mm and −30 mm focal length and their nominal separation is 120 mm. The simulation method for the cooperative OWPT is the same as the non-cooperative one and the necessary equations to calculate the power generation ratio including its range-dependent optimization for the cooperative OWPT model are given by setting ϕ = 0 (L = 0) in A1, A2, A3, and A4.
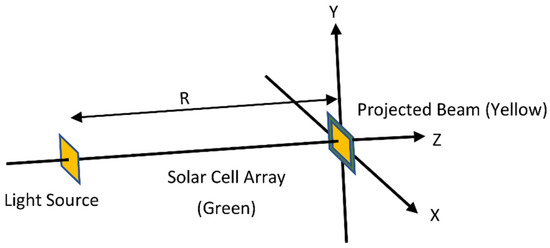
Figure 11.
Configuration of cooperative OWPT.
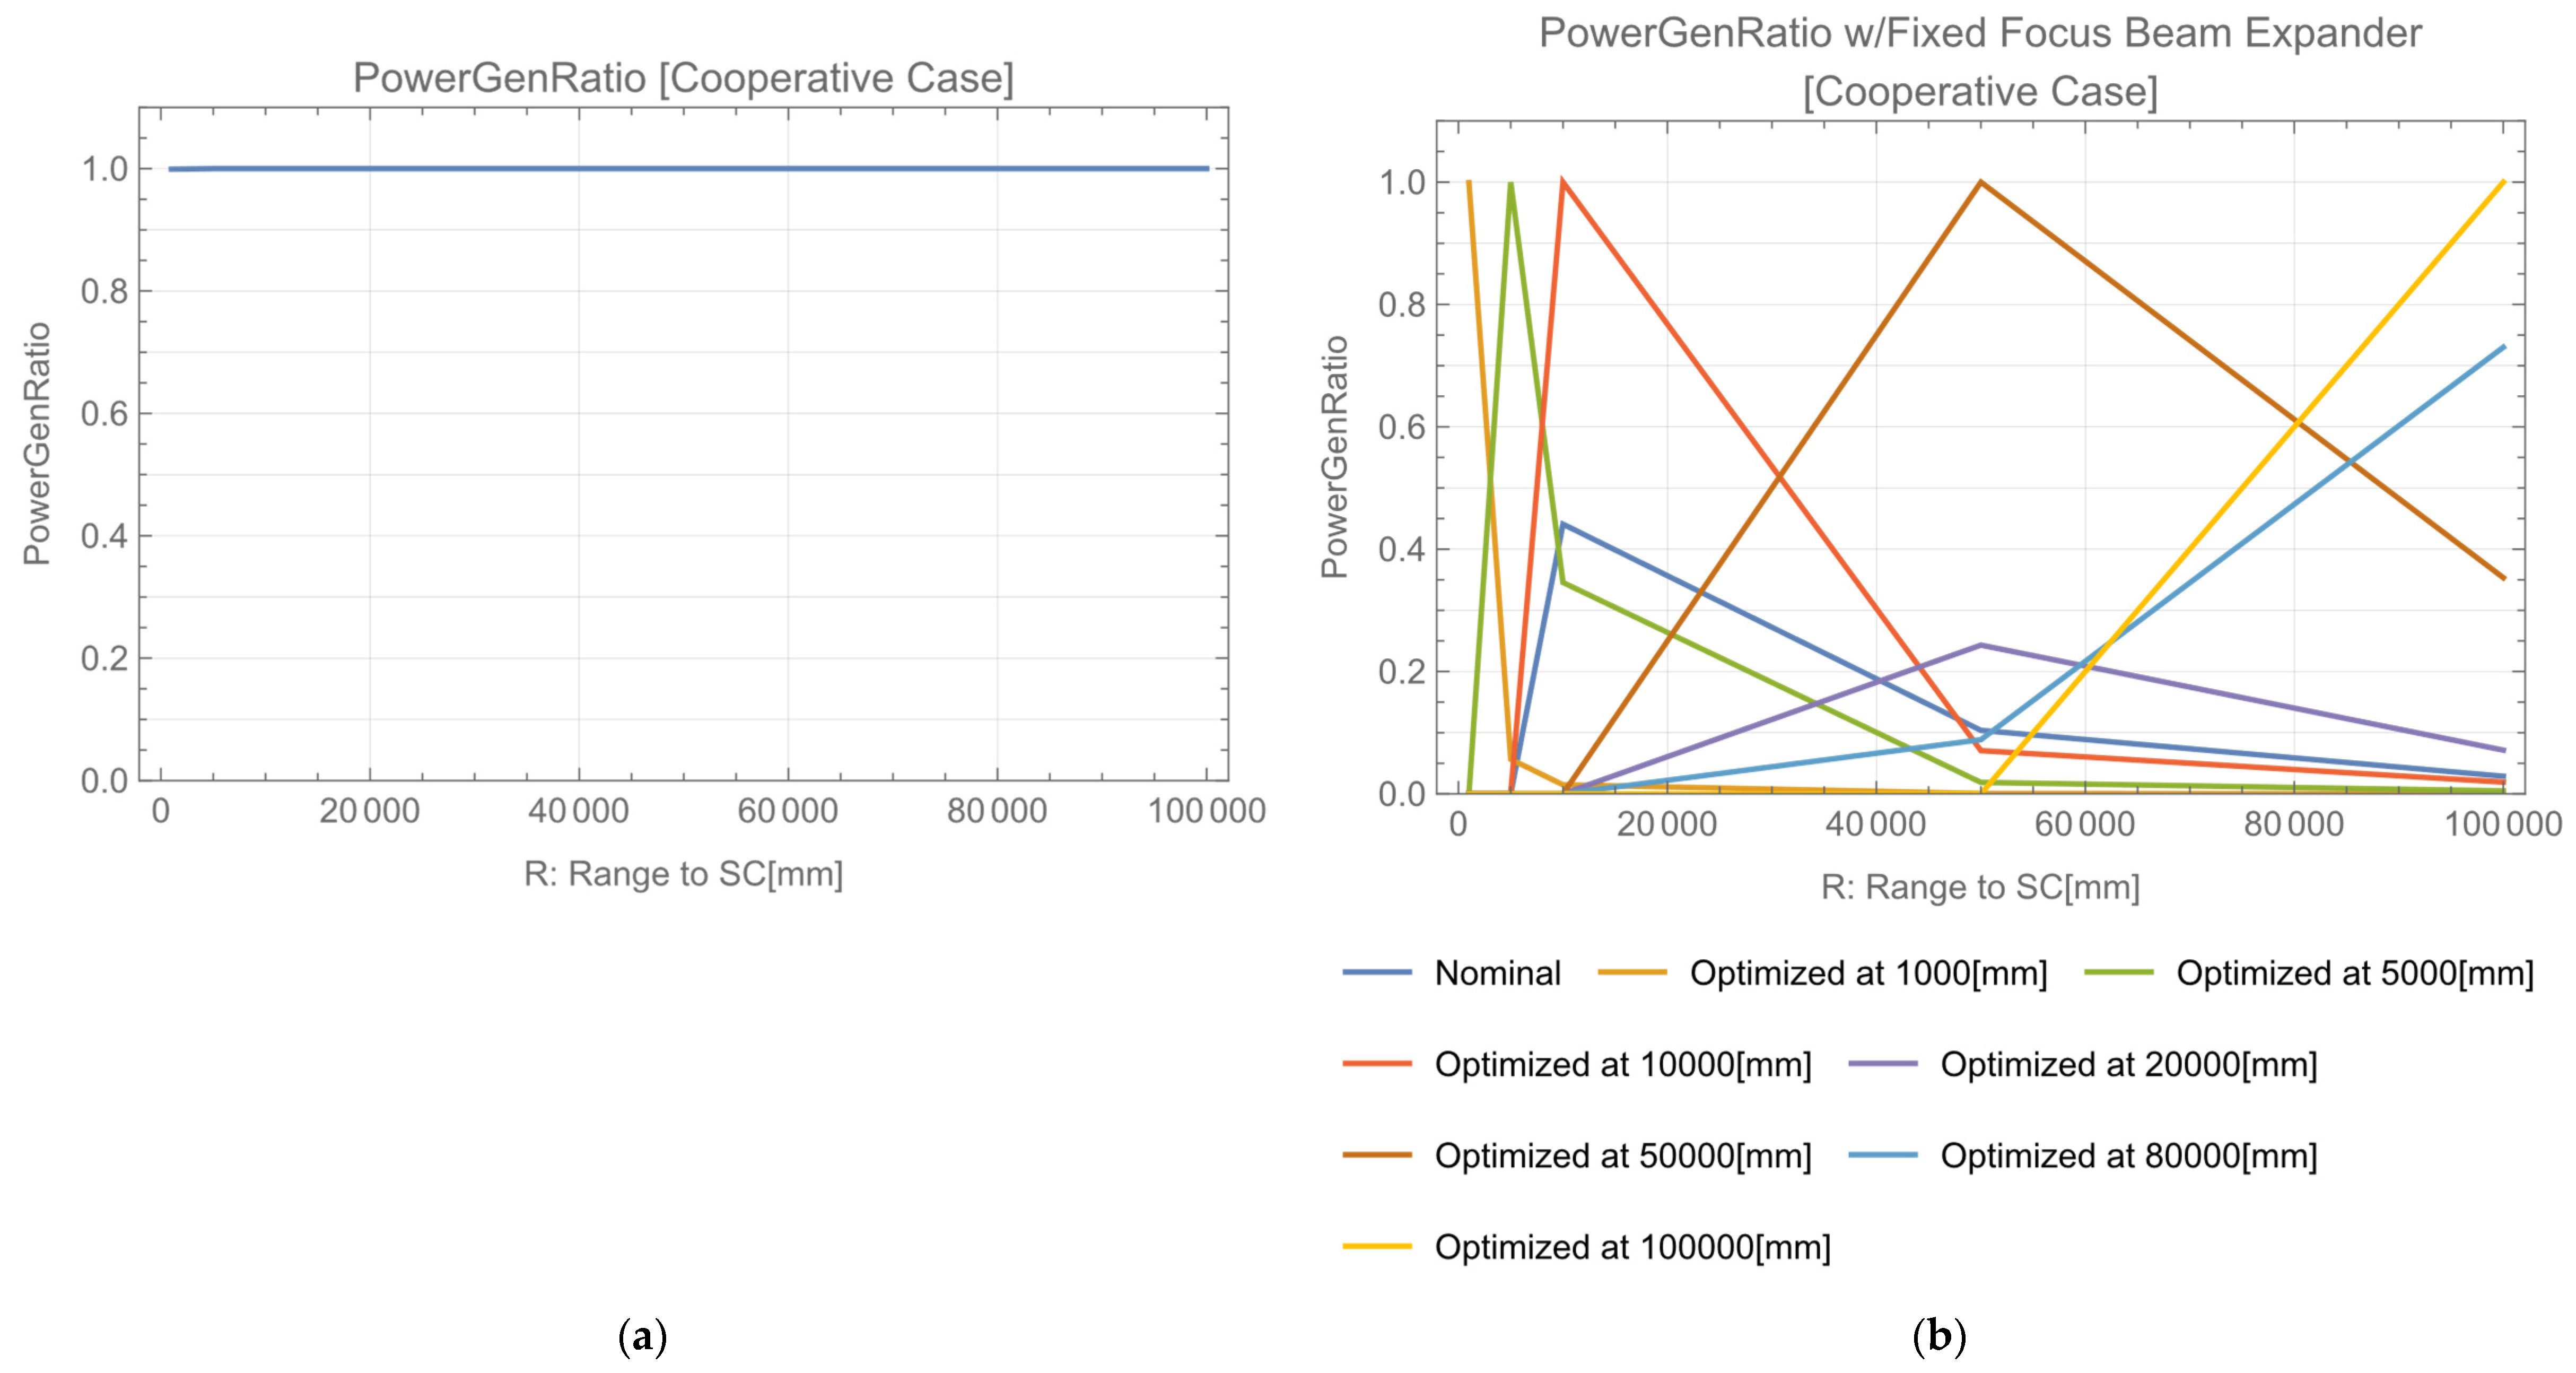
In the case that the focus is adjusted for each R, the power generation ratio is stably maintained at 100% (Figure 12a). However, there is large variation in the power generation ratio for a range from 0 m to 100 m in the case that focus is optimized and fixed at a specific range (Figure 12b); like in a non-cooperative OWPT (Figure 6), a range-dependent focus adjustment is necessary to maintain a high power generation ratio. Comparing Figure 12b with Figure 6, it should be noted that the operatable range in the cooperative case at a particular range of optimization is larger than the non-cooperative case in Figure 6. Assume one requires the power generation ratio to be more than 80%, then one can see that the operatable range is ±6.5 m for the ‘Optimized at 50,000 mm’ plot from Figure 1b, and ±3 m from Figure 6.
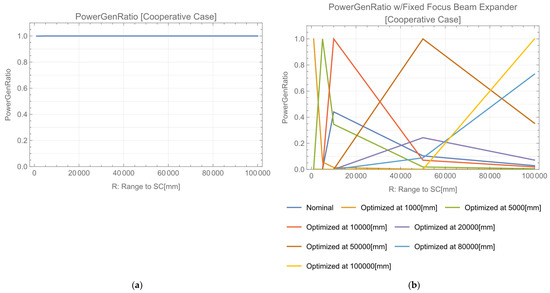
Figure 12.
Range dependence of power generation ratio (Cooperative OWPT). (a) When the focus is adjusted for each R, the power generation ratio is stably maintained at 100%; (b) There is a large variation in the power generation ratio for the range from 0 m to 100 m in case where the focus is optimized and fixed at specific range.
5.2. Requirement for Focus Adjustment
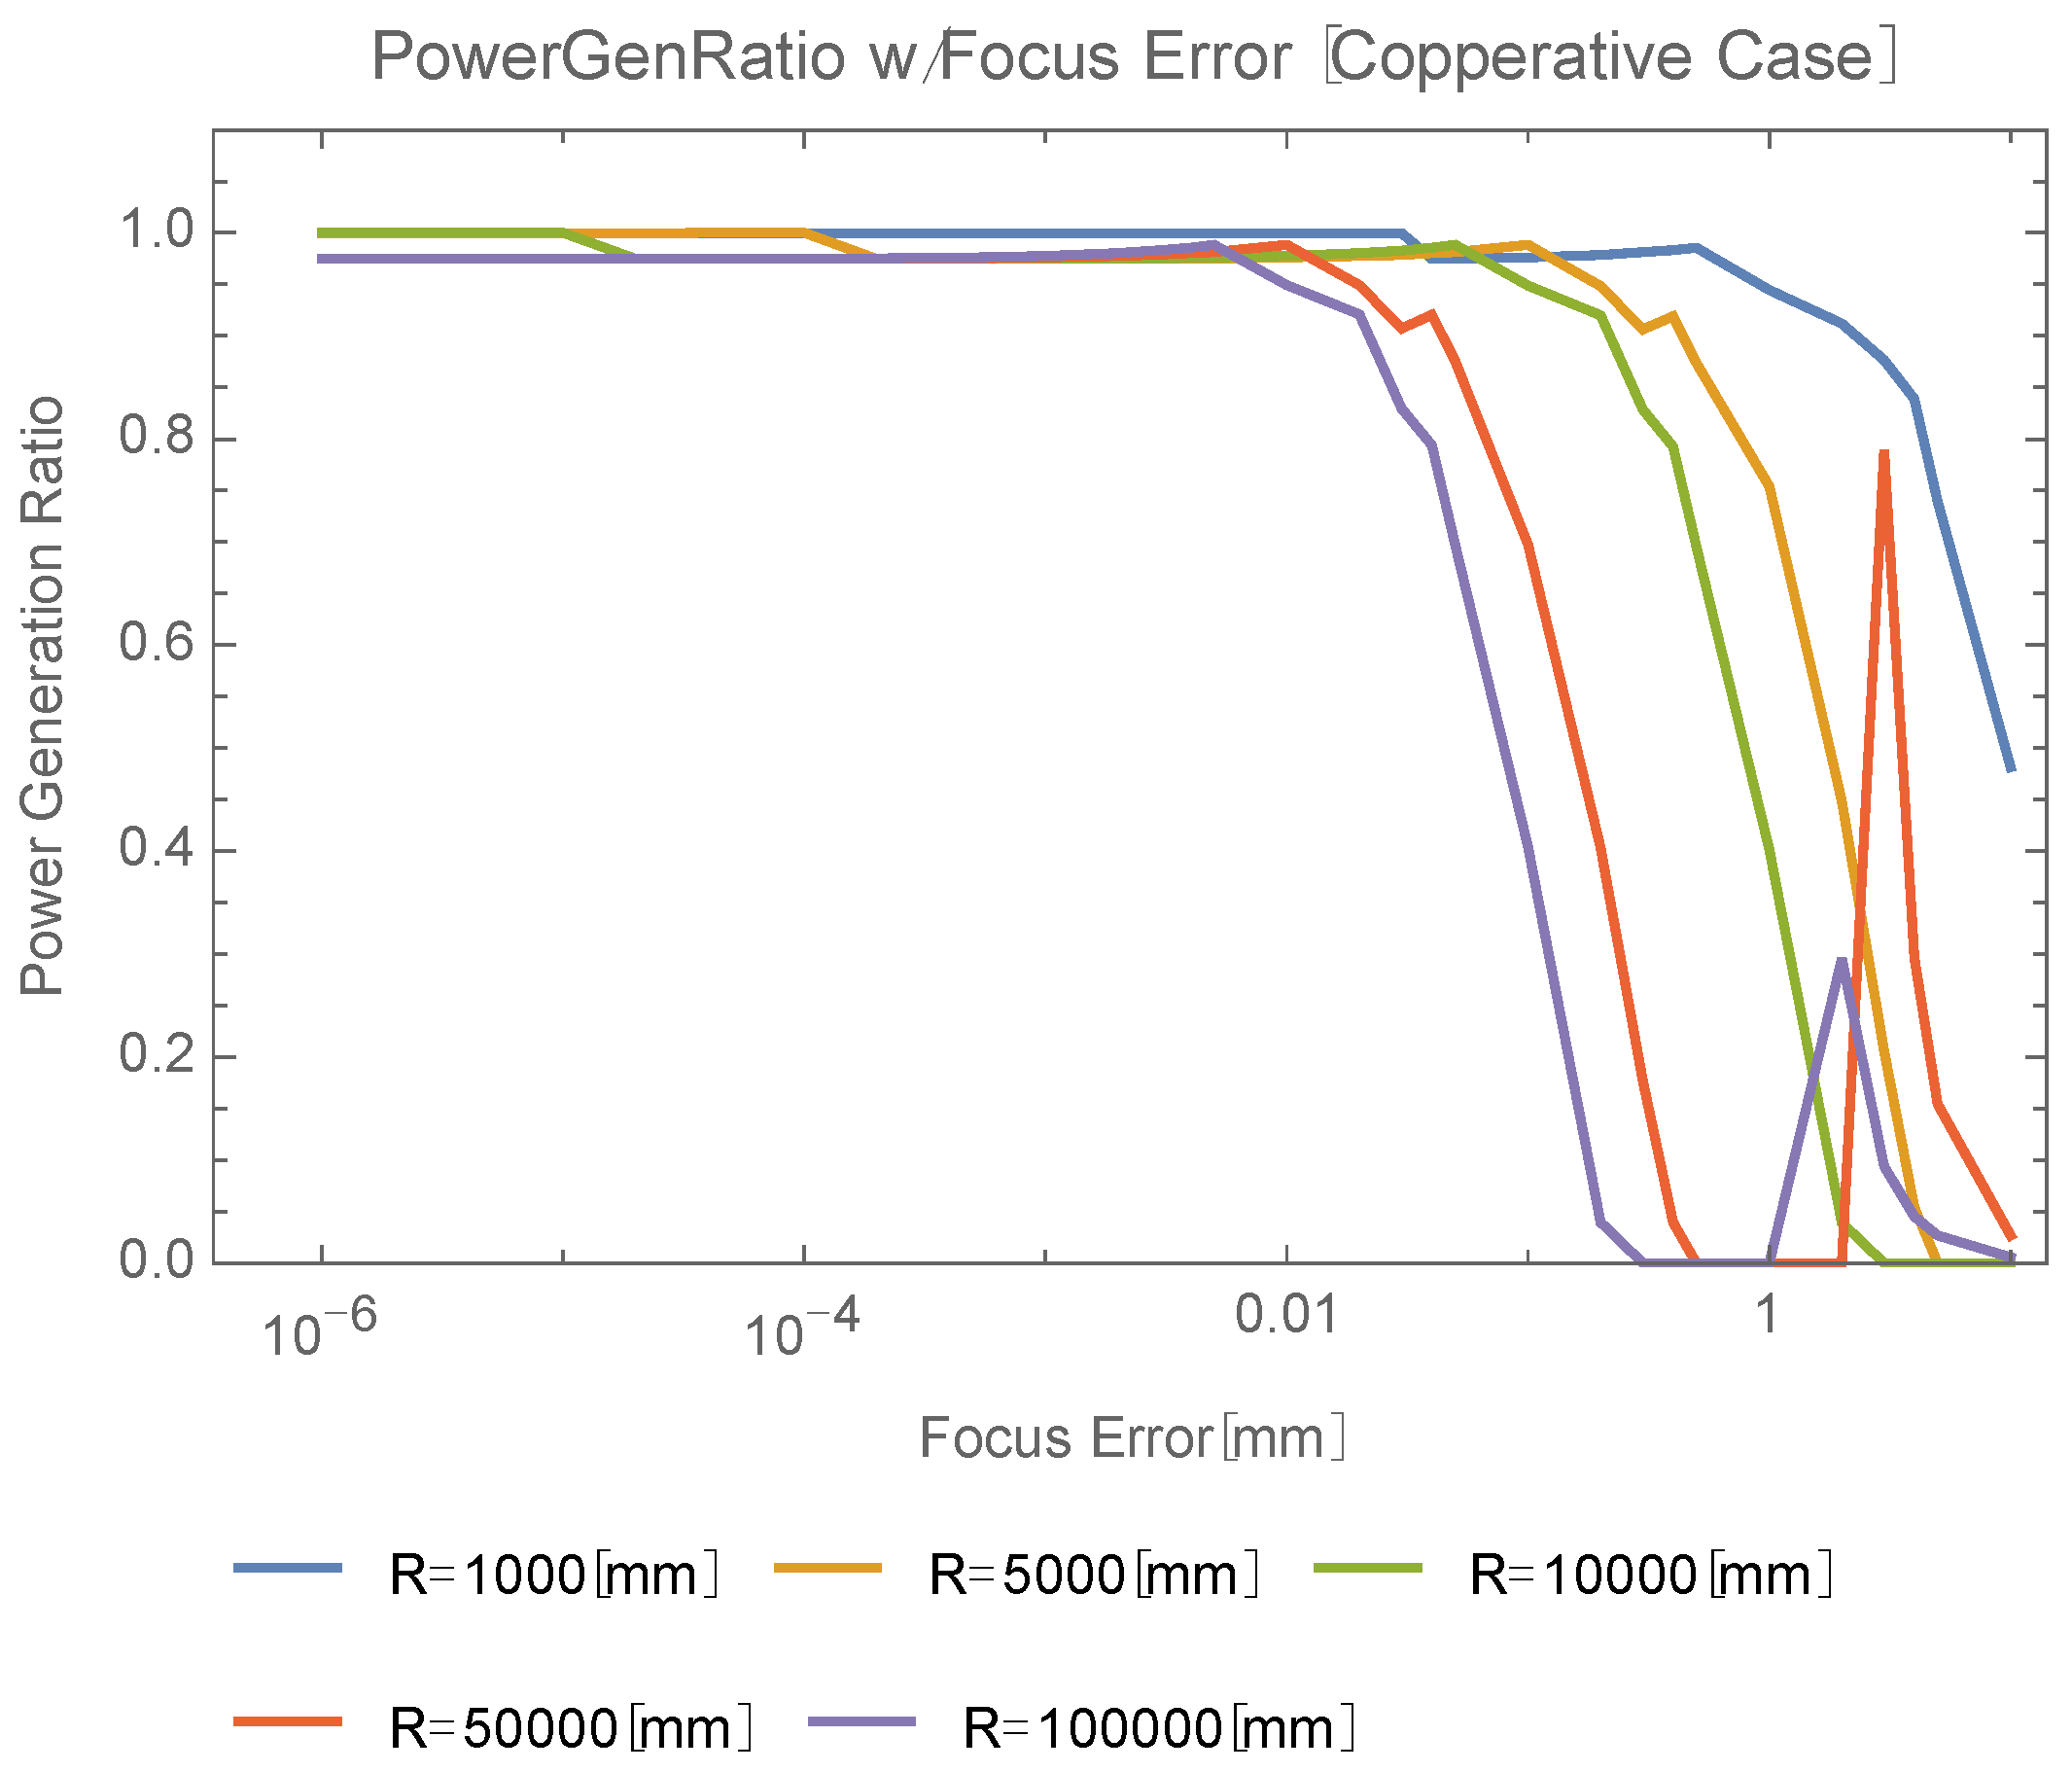
The requirement for range-dependent focus control accuracy was investigated (Figure 13). Requirements for beam rotation around the optical axis are, e.g., less than 3.5 mm (R = 1 m), 350 μm (R = 10 m), or 39 μm (R = 100 m).
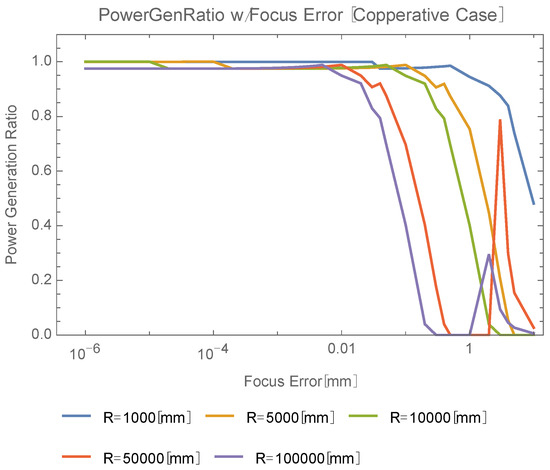
Figure 13.
Focus dependence of power generation ratio (cooperative OWPT).
5.3. Requirement for Beam Alignment
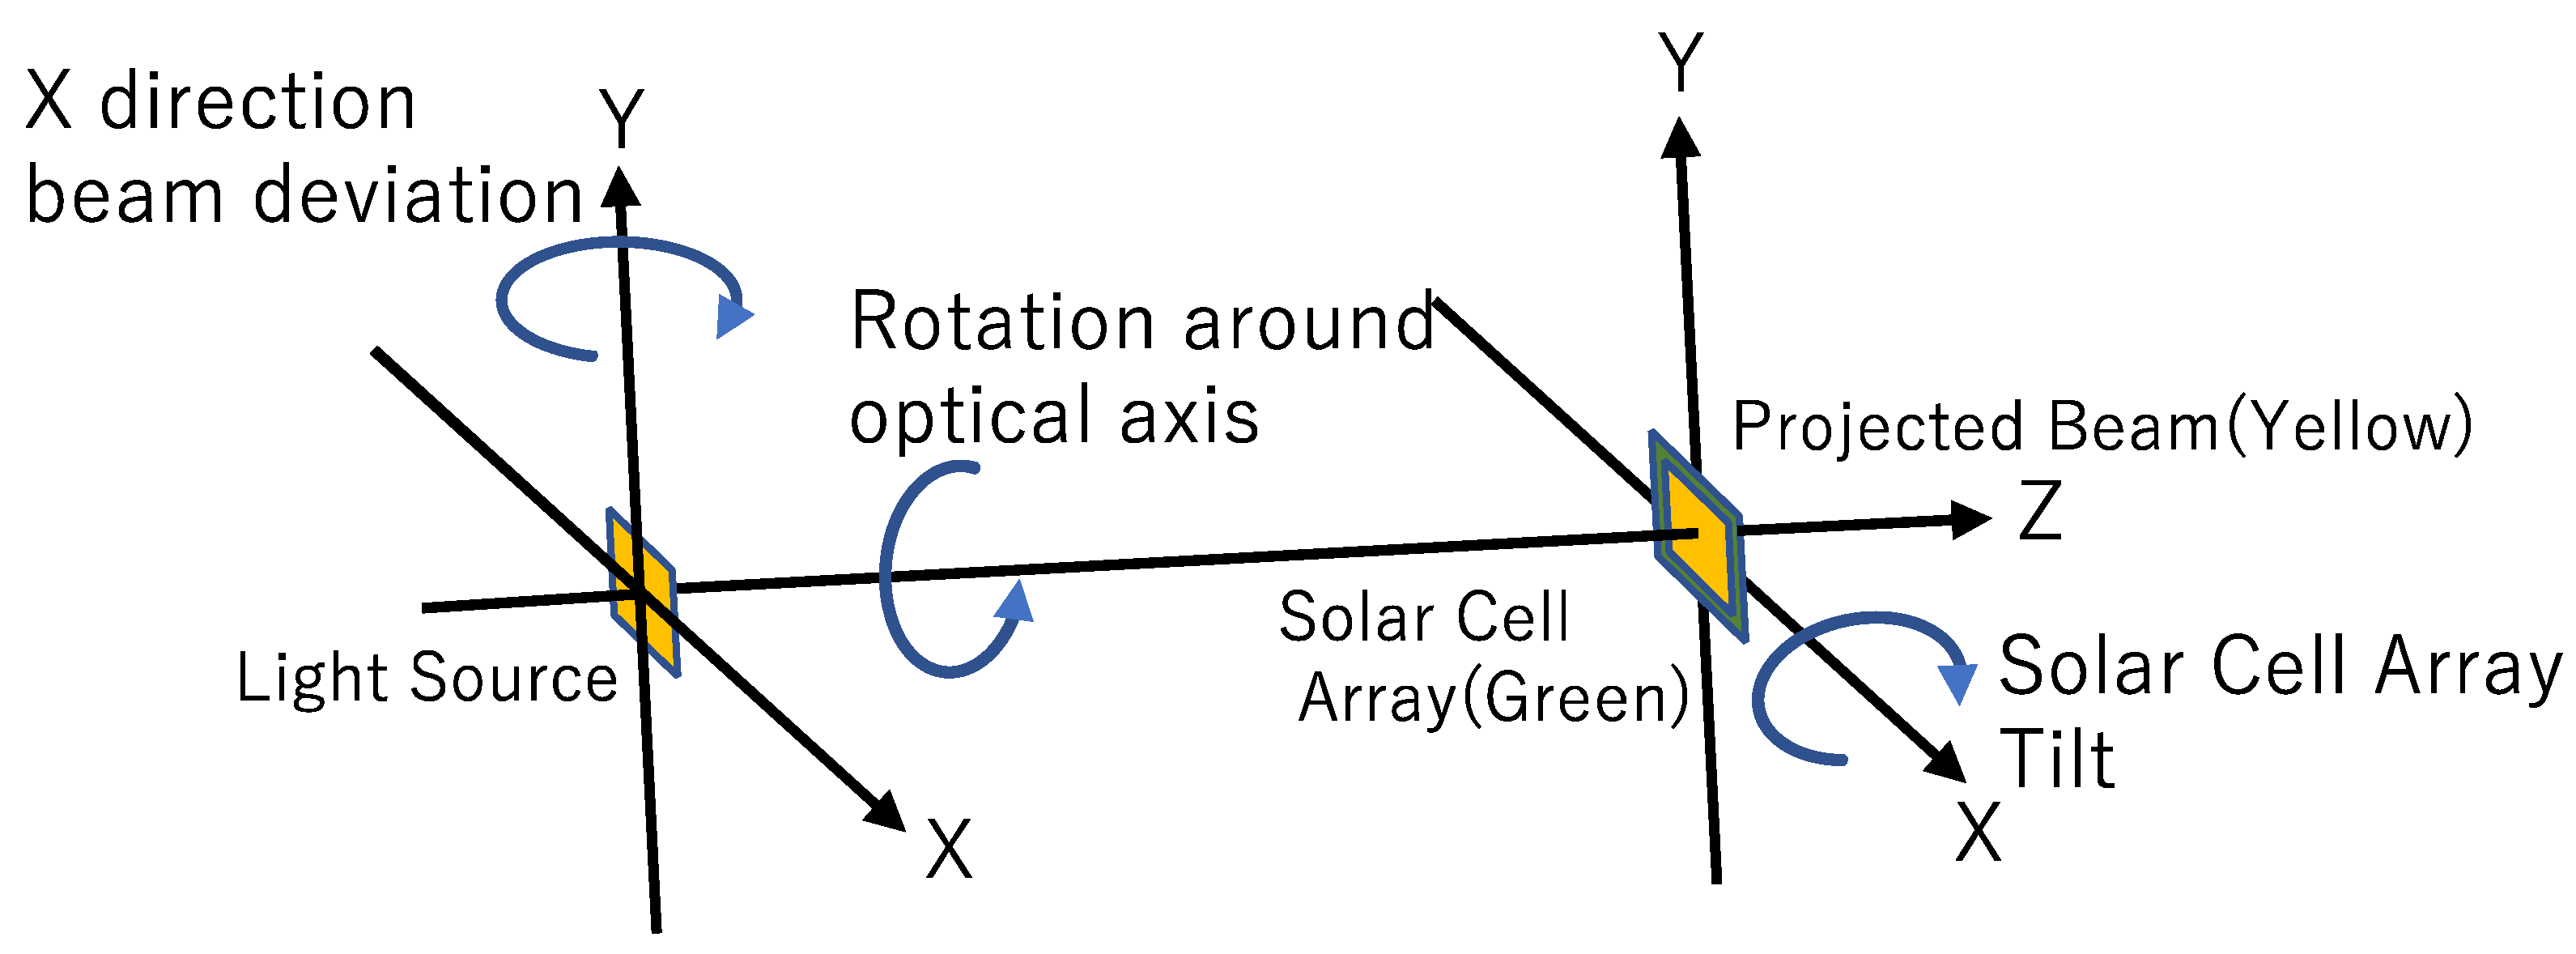
For beam alignment in a cooperative OWPT, one needs to adjust the relative position and attitude of both the transmitter and solar cell array module independently. The DoF in the beam alignment is 2 for beam deviation in the X and Y directions, 2 for the solar array rotation around the X- and Y-axes, and 1 for rotation around the optical axis (beam direction). Since the X and Y directions are identical, the necessary number of DoF to be analyzed is reduced to 3. Those are 1 for beam deviation in the X direction, 1 for beam rotation around the optical axis and 1 for tilt of the array in the X direction (Figure 14).
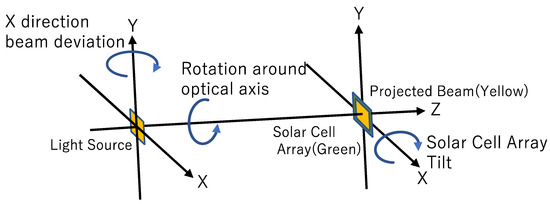
Figure 14.
Beam alignment freedom in the analysis (cooperative OWPT).
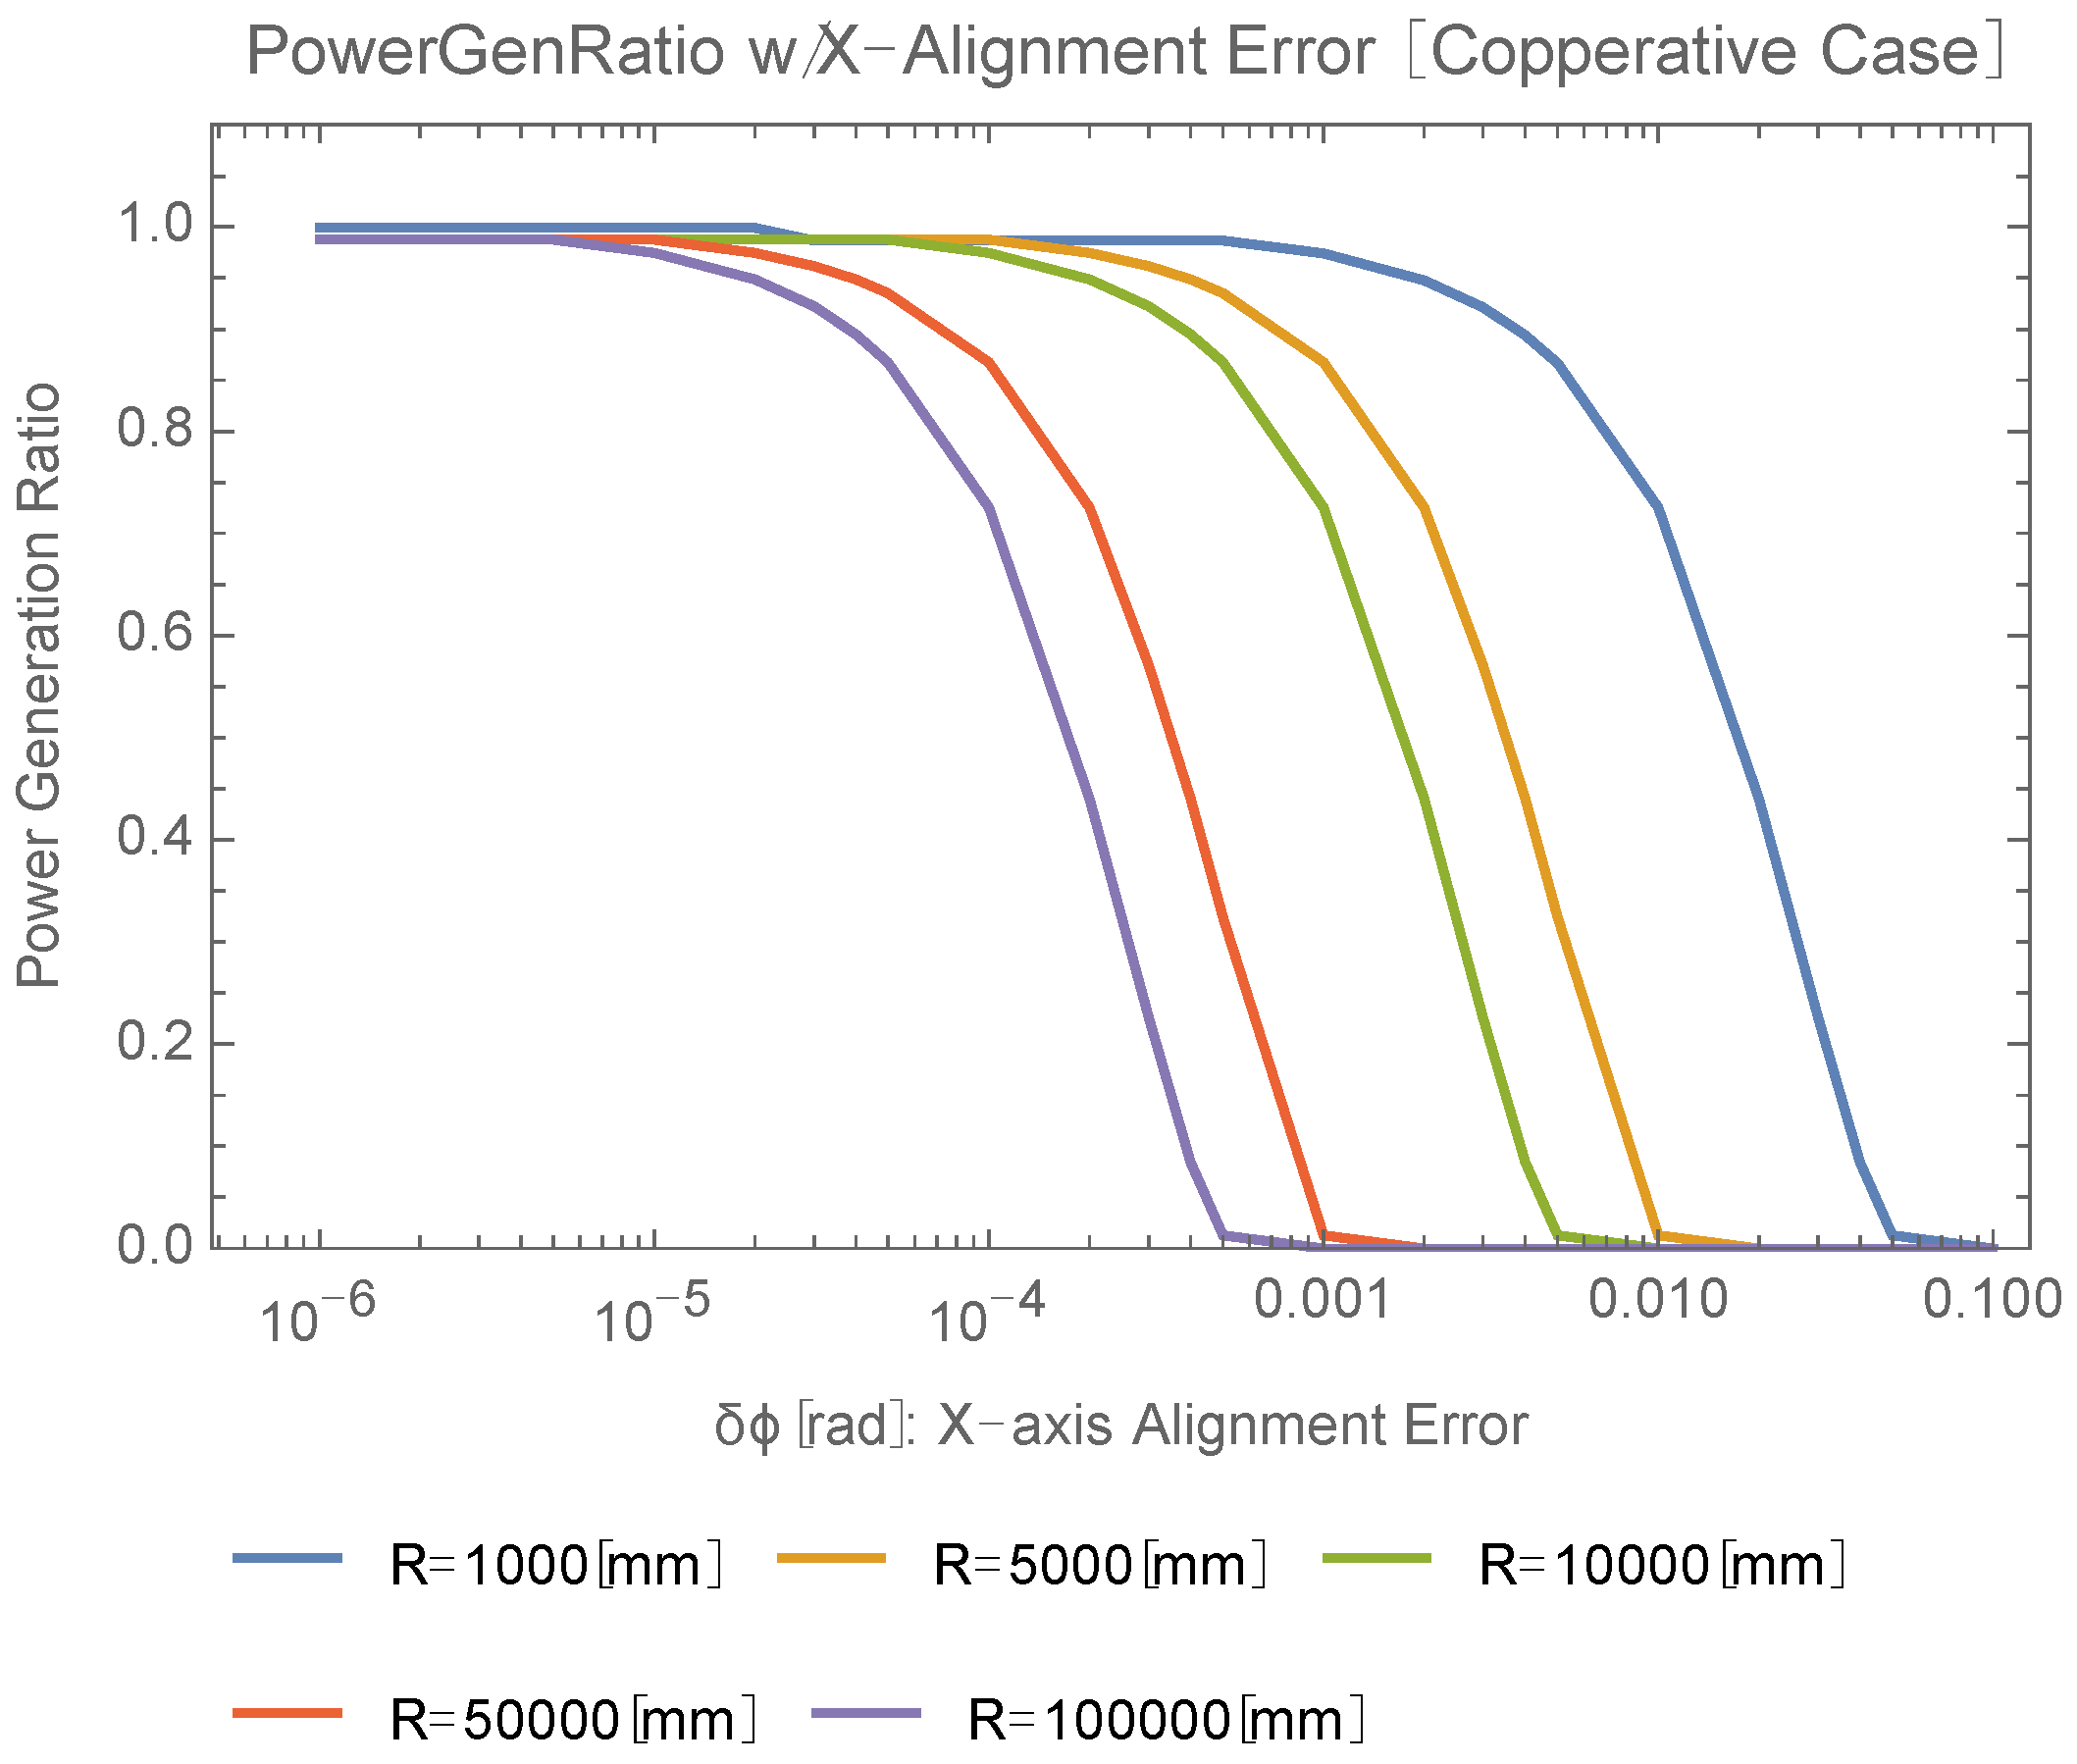
Figure 15 shows the power generation ratio calculation with the X direction alignment error (beam deviation). Requirements for the beam deviation in the X direction are, e.g., less than 6.9 mrad (R = 1 m), 0.8 mrad (R = 10 m), or 69 μrad (R = 100 m).
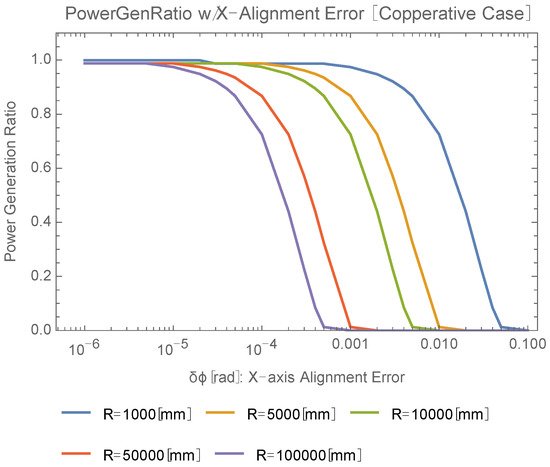
Figure 15.
Beam deviation dependence of power generation ratio in the X(Y) direction.
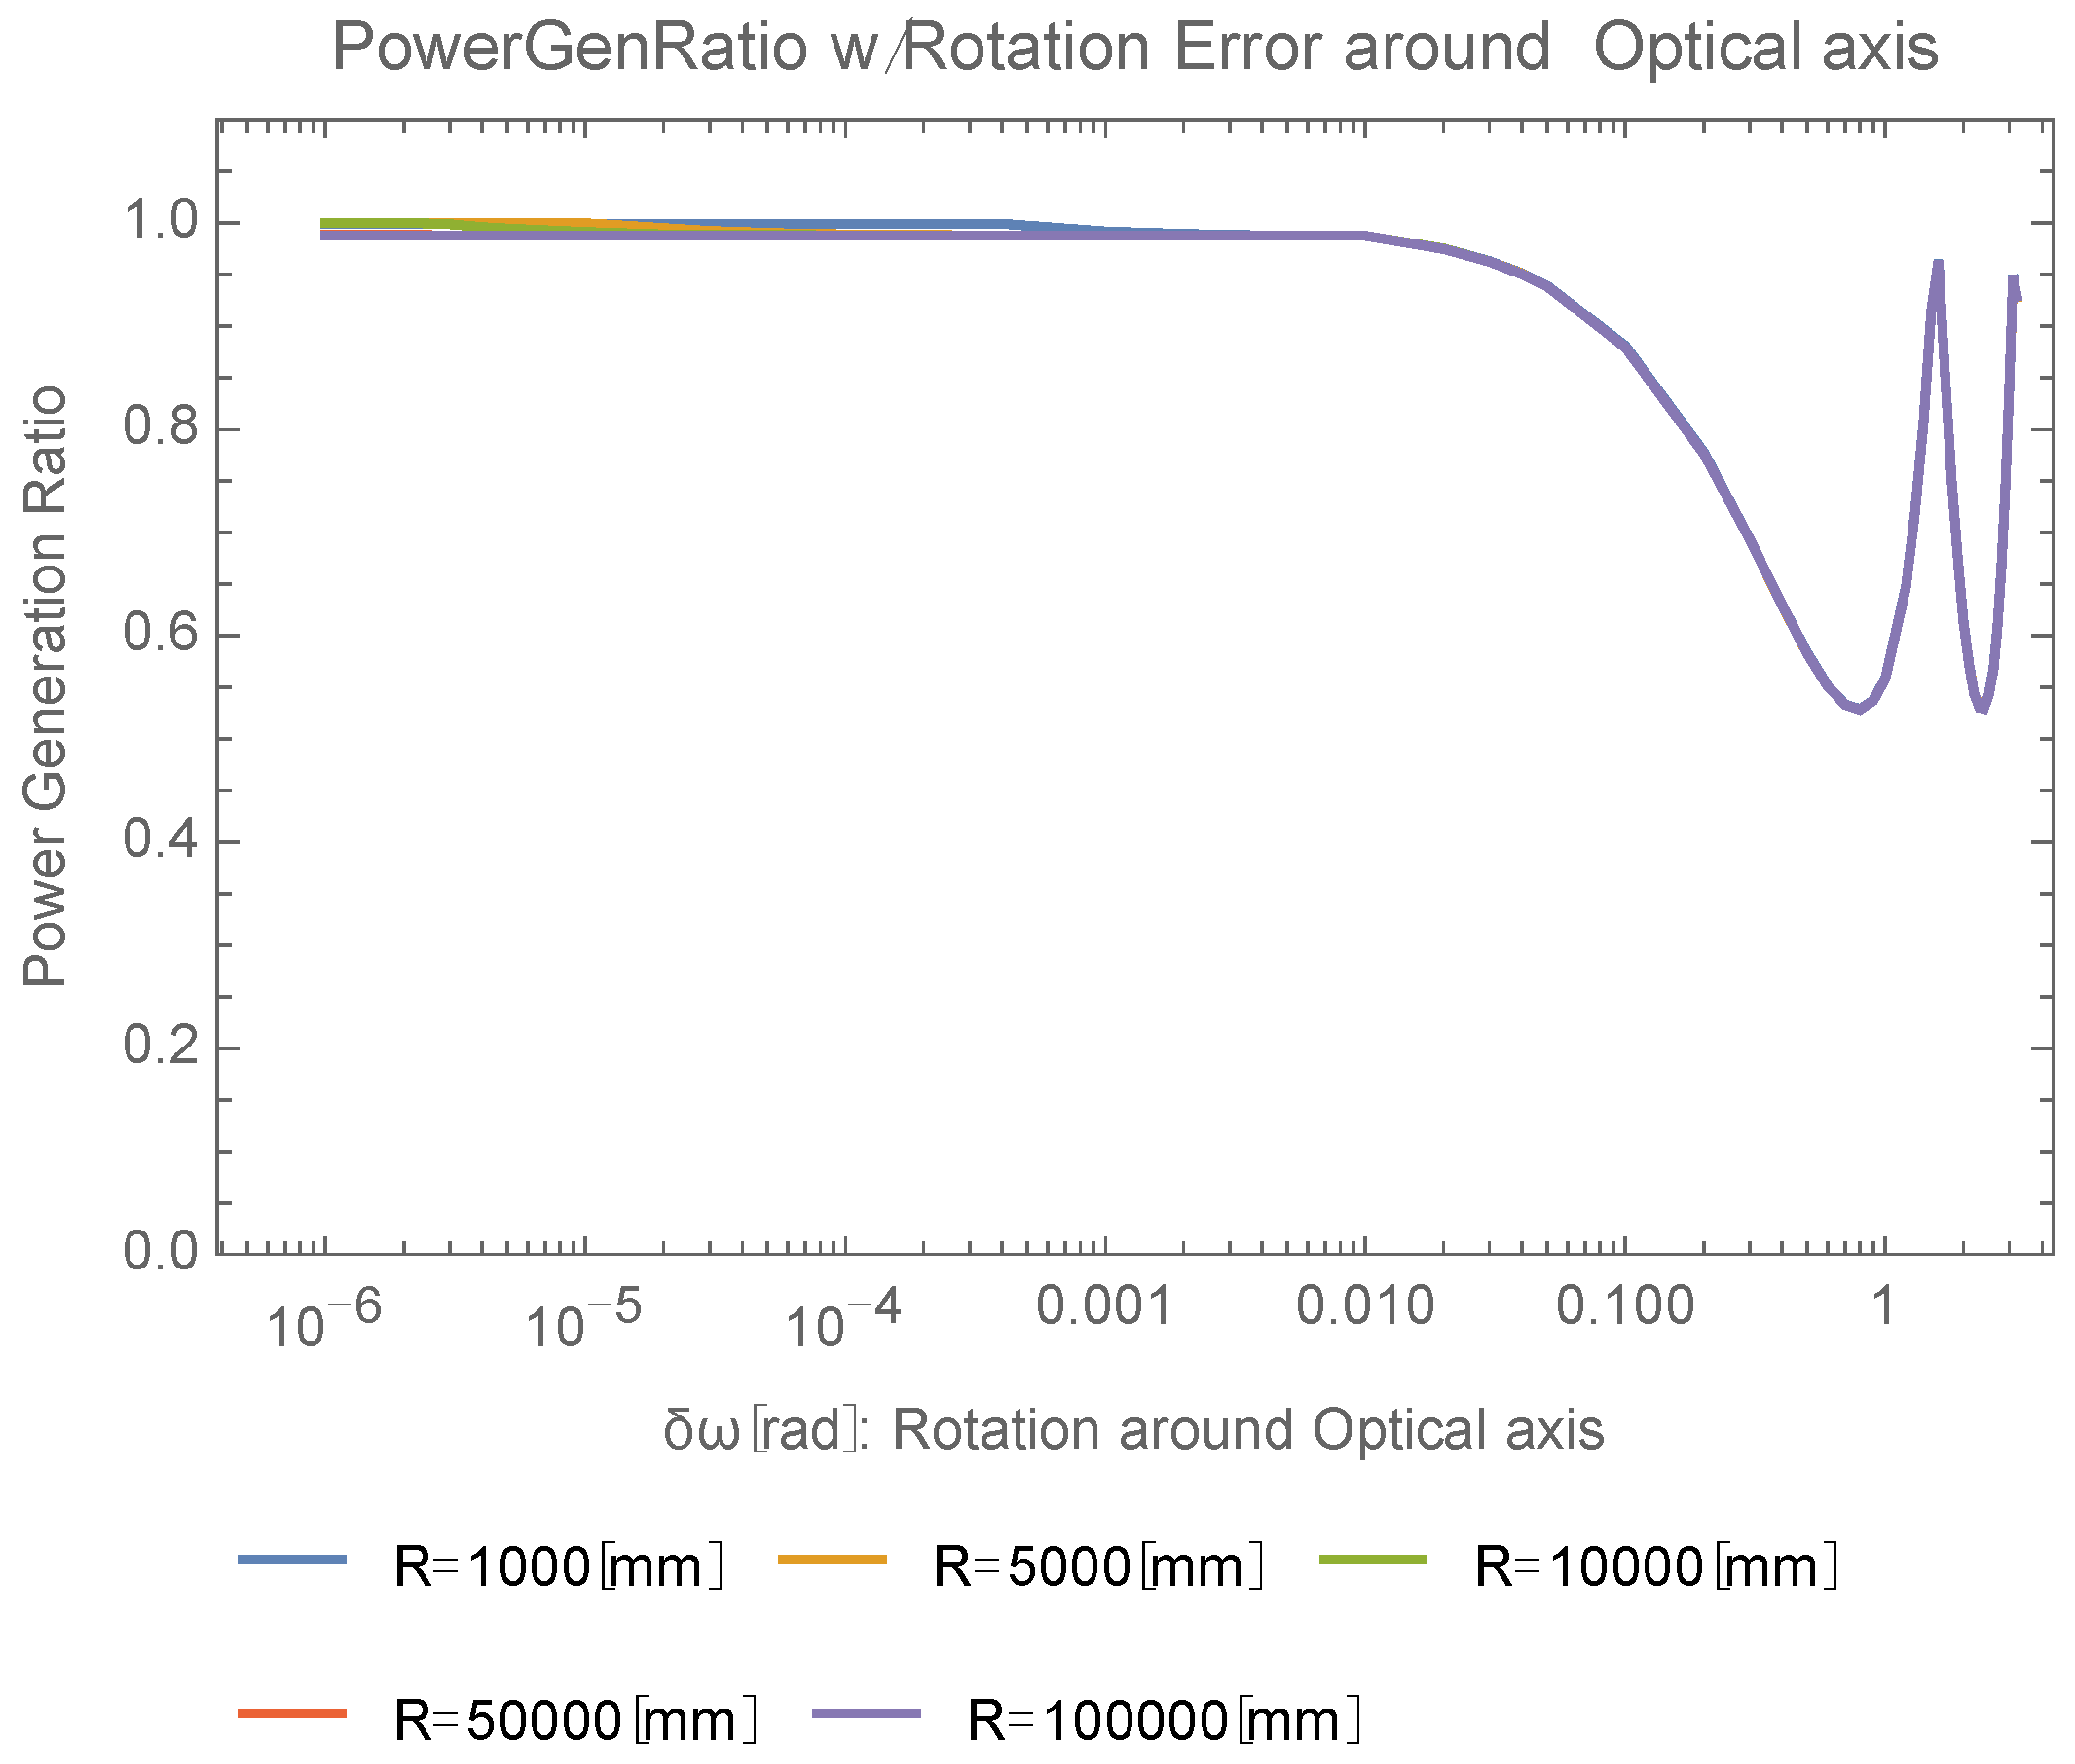
Consider the rotation around the optical axis and the relative tilt between the incident beam and the array geometrically, and assume there are no other misalignments than these rotation and tilt. In the cooperative case, both the size and shape of the incident beam at the entrance of the array coincide with those of the array (100 mm × 100 mm, square) at any R. When one rotates the beam around the optical axis, the square beam shape is rotated around the optical axis. There will be multiple power generation ratio peaks due to the rotational symmetry of the square shapes at every 90° of rotation angle. This condition is the same for any R.
Regarding relative tilt, the apparent area of the incident beam increases like , where S is the area of the beam at zero degrees, which is calculated by the method in Appendix A and Appendix B, and θ is the relative tilt angle between the beam and the array. Such an apparently deformed beam is received with the square shape array of the same area S. This causes degradation of the power generation ratio. This relationship is independent from L. Regarding the effect of the solar cell’s attitude deviation , it is necessary to consider this apparent size increase of the incident beam. To estimate the attitude deviation effect of the array, instead of is used in the calculation of the power generation ratio, where Sprj is calculated by the method summarized in Appendix A and Appendix B. Setting and replacing the area of the array with , these result in Figure 17.
The above analysis suggests that the power generation ratio regarding both rotation and tilt are independent of R. The calculations in Figure 16 and Figure 17 confirm the above expectations.
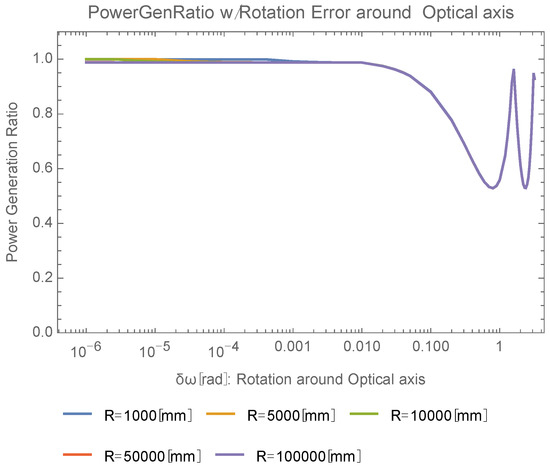
Figure 16.
Power generation ratio dependence on beam rotation around optical axis.
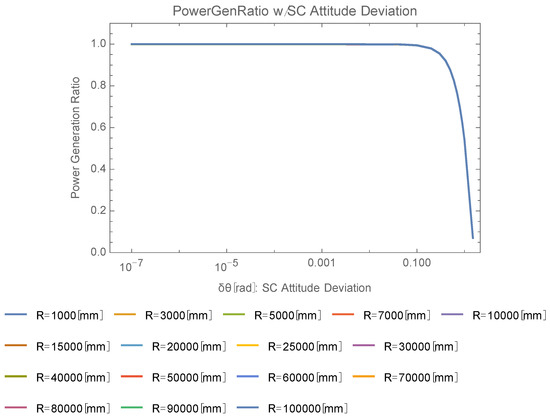
Figure 17.
Power generation ratio dependence on solar cell array’s tilt angle.
Rotation around optical axis is independent of range (R), and requirements for beam rotation around the optical axis are, e.g., less than 180 mrad (independent of R).
The requirement for the solar cell array tilt angle is 645 mrad, which is independent of R.
6. Summary of Requirement for Focus Adjustment and Beam Alignment
The following Table 1 includes excerpts from requirement investigation by means of power generation ratio calculation. Each requirement is determined at an 80% power generation ratio.

Table 1.
Requirements for focus adjustment and beam alignment.
The requirement for the non-cooperative OWPT is one to two orders stronger than the cooperative one. On the other hand, the cooperative OWPT requires mutual alignment and interaction between the transmitter and solar cell array, which increases the system complexity. This is a trade-off item in actual operational OWPT system design.
7. Conceptual Discussion of Beam Alignment in Cooperative OWPT
Based on the derived system level requirement, a beam alignment concept for a cooperative OWPT was developed and proposed.
The initial status is that the position and attitude of the solar cell array are unknown to the transmitter. The goal is to align the solar cell array and the transmitter mutually with the necessary accuracy, which is roughly 0.1 mrad in the case of a cooperative OWPT. In addition to this, in the case of a moving target, the target should be tracked. Two phases of alignment are proposed. One is a rough alignment phase, which captures the image of the array and hands it over to an image sensor to be used in the precise alignment phase. The other is the precise alignment phase, which centers the image of the array in the field of view (FOV) of the image sensor with necessary accuracy. During these phases, a wide-angle camera with infrared illumination, image sensor, and laser range finder are introduced as alignment sensors. Of these items, the wide-angle camera is to be used in the initial phase, and the other sensors are to be used in the precise phase. In addition to these sensors, motion control mechanisms are necessary, which support the appropriate accuracy for each phase. Studies in this section are focused on the alignment concept and necessary sensors.
7.1. Rough Alignment Phase
- The objective of this phase is to introduce the image of the solar cell array within the image sensor’s FOV, which is used in a precise alignment phase, and to conduct initial alignment for the mutual relative attitude.
Assume that the coordinates of the center of the beam, which are known parameters, are shared between the array and the transmitter. The initial alignment is conducted using the wide-angle camera with position information from the external system such as a satellite or indoor positioning system.
With such initial position information and using a camera with infrared illumination for nighttime, which is commercially available, the initial image of the array is captured by the camera, and it is centered in its FOV by a motion control mechanism. The positioning system’s error is typically less than 1 m [29,30]. Assuming that the minimum distance to the array is 1 m, the FOV of the camera is required to be more than ±45° (785.4 mrad) to introduce the image of the array to the FOV of the camera using information from the positioning system. The resolution of the camera should be less than the image sensor’s FOV, and this will be automatically satisfied by requiring a few mrad FOV for the camera.
7.2. Precise Alignment Phase
- Using the image sensor, the transmitter aligns the beam direction so that the beam center matches the array’s. Additionally, the image sensor detects the relative tilt angle of the array to the optical axis. The transmitter requests the array to align the array’s normal vector with the optical axis. The last step of the alignment is that the transmitter rotates the beam around its optical axis to match the beam shape (square) with the array’s shape (square) and the transmitter determines the necessary (de)focus adjustment by means of range information to the array. This concludes the alignment and beam shaping process. In the case of a moving target, the transmitter tracks the array using the image sensor and repeats the above procedures.
After initial alignment, an image of the array is already introduced in the FOV of the image sensor, and the outline of the array is recognized by the image sensor. The center coordinates of the array are obtained from this outline. The DoF of alignment between the array and the transmitter is 5. The transmitter adjusts its beam center with the array’s, which corresponds to a DoF of 2. The detection limit of the image sensor is required to be less than 0.1 mrad, which is from the requirement for a cooperative OWPT. Regarding its FOV, the whole image of the array is required to be in the FOV. This is satisfied with ±50 mrad FOV for a 100 mm × 100 mm array at 1 m distance.
The tilt angle of the array against the beam direction is also detectable using the image sensor. The apparent angler size of the array with tilt angle θ at range L is , and here lSC is the size of the array. To detect a decrease of the apparent angler size of the array from θ = 0, it should be larger than the image sensor’s accuracy of 0.1 mrad. This means that . When lSC = 10 cm and L = 100 m, the detection limit is θ = 451 mrad, which is less than the requirement (645 mrad). Even though 451 mrad itself is marginal for the requirement, using a zoom lens improves detection for longer L values. The transmitter requests the array to adjust its attitude, which corresponds to other 2 DoF. Finally, the transmitter rotates the beam around its optical axis to match its square beam shape with the array, which corresponds to the remaining 1 DoF.
Finally, the focus of the transmitter is determined with range information from the laser range finder and adjusted following the range to the array. Requiring 1 m for accuracy of the laser range finder supports the focus error simulation result in Section 4.2.
8. Conclusions
A methodology to consolidate system level requirements for OWPT in terms of the power generation ratio as proposed. Regarding beam shaping and alignment, both non-cooperative and cooperative OWPT system level requirements were analyzed in general configuration using a simple geometrical and optics model. Even though these particular results depend on parameters in the models such as beam divergence angle and size of the solar cell array, another requirement will be generated with other parameters using the same methodology of this study. Such derived requirements can be regarded as fundamental parameters for operational OWPT systems to be developed. Since requirements for non-cooperative OWPTs are generally one or two orders stronger than for cooperative ones, it would be a realistic option for the feasibility and cost of a system to adopt a cooperative OWPT to relax these requirements. On the other hand, a cooperative OWPT needs real-time control of the solar cell array to face to transmitter. This requirement relaxation and such an increase of system complexity are system level trade-off items.
A concept of alignment for cooperative OWPT was proposed. This concept utilizes an infrared illuminated wide-angle camera of ±45° (785.4 mrad) FOV with a few mrad accuracy, an image sensor of ±50 mrad FOV with 0.1 mrad accuracy and a laser range finder of 1 m accuracy and motion control mechanisms corresponding to each phase’s required control accuracy.
The methodology in this study enables to consolidate requirements and to assess the feasibility and scale of a system in a general OWPT configuration, which progresses OWPT towards more realistic operational systems.
Author Contributions
Conceptualization and methodology, K.A. and T.M.; formal analysis, K.A.; writing—original draft preparation, K.A.; writing—review and editing, T.M.; supervision, administration, and funding acquisition, T.M. All authors have read and agreed to the published version of the manuscript.
Funding
This research received no external funding.
Institutional Review Board Statement
Not applicable.
Informed Consent Statement
Not applicable.
Acknowledgments
We thank members in the T. Miyamoto Lab for discussion and assistance.
Conflicts of Interest
The authors declare no conflict of interest.
Appendix A. Ray Transfer Matrices of the Optics Used in this Study
The optics in this study was simulated in the paraxial approximation using a ray transfer matrix (ABCD matrix). There are two such matrices for the X and Y directions. Let lx, θx be the height of the ray and the angle that makes with the optical axis in the X direction at the exit of the optics. ly and θy are defined similarly. The ray transfer matrices of this optics are written as follows:
where d1 = 30 mm, which is the default value and is optimized for the power generation ratio and perturbed by the focus error. The rest are fixed parameters such as d2 = 120 mm, d3 = 20 mm, fcnv = 150 mm, fccv = 30 mm, lsc = 5 mm, and θbeam = 0.8 deg.
Appendix B. Beam Propagation and Power Generation Ratio Calculation
The light source is at . The beam propagating from the four apexes P1, P2, P3, P4 of the square beam are expressed by the following equations using a real parameter, k. The beam is projected onto the XY plane, whose center is deviated length L from the Z-axis. This projection is written in terms of a rotation matrix. Since the origin of the rotation is and the angle of the rotation is , the rotation matrix is written as:
The value of k is determined by setting each Z coordinate of each rotated beam to be zero. Inserting the determined value of k, the coordinates of the apexes projected onto the XY plane (C1, C2, C3, C4) are determined by (A3). The area of the projected beam (Sprj) is determined by the coordinates of C1, C2, C3, C4. Since the position coordinates of the solar cell array are known, the two factors of power generation ratio are calculated as described in Section 3.
The focus adjustment in the X and Y directions (Δx, Δy) are introduced in ray transfer matrices as follows:
These matrices including Δx, Δy are used for calculation and optimization of the power generation ratio. Setting gives the optimum value of , which depends on L. Similarly, setting gives the optimum value of .
Appendix C. Power Generation Ratio Calculation Including Perturbations
Appendix C.1. Focus Perturbation
Assume Δx opt and Δy opt give the optimum of the power generation ratio in the X and Y directions’ focus. Additional focus perturbations Δ′x, Δ′y are introduced to estimate the requirement for focus adjustment with replacements and .
These matrices including perturbations Δ′x, Δ′y are used in calculation of the power generation ratio.
Appendix C.2. Rotational Perturbations
To include perturbation in the rotation angle for the X-, Y-, and Z-axes, respectively, the rotation matrix is extended as follows:
- The X direction deviation error is caused by an alignment error around the Y-axis. To calculate the power generation ratio, and are set to be zero.
- The Y direction deviation error is caused by an alignment error around the X-axis. To calculate the power generation ratio, and are set to be zero.
- To calculate the power generation ratio with the Z-axis rotational alignment error, and are set to be zero.
References
- Frolova, E.; Dobroskok, N.; Morozov, A. Critical Review of Wireless Electromagnetic Power Transmission Methods; Atlantis Press International B.V.: Saint-Petersburg, Russia, 2022. [Google Scholar] [CrossRef]
- The Wireless Power Company. Wi-Charge. Available online: https://www.wi-charge.com (accessed on 9 May 2022).
- Liu, Q.; Xiong, M.; Liu, M.; Jiang, Q.; Fang, W.; Bai, Y. Charging a Smartphone over the Air: The Resonant Beam Charging Method. IEEE Internet Things J. 2022, 1. [Google Scholar] [CrossRef]
- Wang, Z.; Zhang, Y.; He, X.; Luo, B.; Mai, R. Research and Application of Capacitive Power Transfer System: A Review. Electronics 2022, 11, 1158. [Google Scholar] [CrossRef]
- Kim, S.-M. Optical Beamforming for Communication and Power Transmission. SPIE Newsroom, 6 February 2014. [Google Scholar] [CrossRef]
- Baraskar, A.; Yoshimura, Y.; Nagasaki, S.; Hanada, T. Space Solar Power Satellite for the Moon and Mars Mission. J. Space Saf. Eng. 2022, 9, 96–105. [Google Scholar] [CrossRef]
- PowerLight Technologies. Available online: https://powerlighttech.com/ (accessed on 9 May 2022).
- Landis, G.A. Laser Power Beaming for Lunar Polar Exploration. In AIAA Propulsion and Energy 2020 Forum; American Institute of Aeronautics and Astronautics: San Diego, CA, USA, 2020. [Google Scholar] [CrossRef]
- Lee, N.; Blanchard, J.T.; Kawamura, K.; Weldon, B.; Ying, M.; Young, S.A.; Close, S. Supporting Uranus Exploration with Deployable ChipSat Probes. In AIAA SCITECH 2022 Forum; American Institute of Aeronautics and Astronautics: San Diego, CA, USA, 2022. [Google Scholar] [CrossRef]
- Setiawan Putra, A.W.; Tanizawa, M.; Maruyama, T. Optical Wireless Power Transmission Using Si Photovoltaic through Air, Water, and Skin. IEEE Photonics Technol. Lett. 2019, 31, 157–160. [Google Scholar] [CrossRef]
- Rathod, Y.; Hughes, L. Simulating the Charging of Electric Vehicles by Laser. Procedia Comput. Sci. 2019, 155, 527–534. [Google Scholar] [CrossRef]
- Iyer, V.; Bayati, E.; Nandakumar, R.; Majumdar, A.; Gollakota, S. Charging a Smartphone Across a Room Using Lasers. Proc. ACM Interact. Mob. Wearable Ubiquitous Technol. 2018, 1, 143. [Google Scholar] [CrossRef]
- Zhu, K.; Yang, J.; Zhang, Y.; Nie, J.; Lim, W.Y.B.; Zhang, H.; Xiong, Z. Aerial Refueling: Scheduling Wireless Energy Charging for UAV Enabled Data Collection. IEEE Trans. Green Commun. Netw. 2022, 1. [Google Scholar] [CrossRef]
- Nguyen, D.H.; Tumen-Ulzii, G.; Matsushima, T.; Adachi, C. Performance Analysis of a Perovskite-Based Thing-to-Thing Optical Wireless Power Transfer System. IEEE Photonics J. 2022, 14, 6213208. [Google Scholar] [CrossRef]
- Koga, M.; Matsuoka, N.; Shibui, S.; Uchida, S. Investigation of high efficiency laser wireless power transmission using InGaP/InGaAs/Ge 2-junction solar cells. In Proceedings of the 4th Optical Wireless and Fiber Power Transmission Conference (OWPT2022), Hybrid, Yokohama, Japan, 18–21 April 2022; p. OWPT8-03. [Google Scholar]
- Zhou, J.; He, X.; Kato, T.; Yoshikawa, K.; Yamada, H. Power Generation Characteristics of Si PV Cell under Extremely High-Intensity near-Infrared Light Irradiation. IEICE Electron. Express 2022, 19, 20210476. [Google Scholar] [CrossRef]
- Takeda, K.; Kawashima, N. 100 m Laser Energy Transportation Experiment to a Model Rover to Explore the Ice on the Moon. J. Jpn. Soc. Aeronaut. Space Sci. 2003, 51, 393–396. [Google Scholar] [CrossRef]
- Mukherjee, J.; Wulfken, W.; Hartje, H.; Steinsiek, F.; Perren, M.; Sweeney, S.J. Demonstration of Eye-Safe (1550 Nm) Terrestrial Laser Power Beaming at 30 m and Subsequent Conversion into Electrical Power Using Dedicated Photovoltaics. In Proceedings of the 2013 IEEE 39th Photovoltaic Specialists Conference (PVSC), Tampa, FL, USA, 16–21 June 2013; pp. 1074–1076. [Google Scholar] [CrossRef]
- Kawashima, N.; Takeda, K.; Matsuoka, H.; Fujii, Y.; Yamamoto, M. Laser Energy Transmission for a Wireless Energy Supply to Robots. In Proceedings of the 22nd International Symposium on Automation and Robotics in Construction (ISARC), Ferrara, Italy, 11–14 September 2005. [Google Scholar]
- Asaba, K.; Miyamoto, T. Beam Deformation Correction using Orthogonal Cylindrical Beam Expander. In Proceedings of the 4th Optical Wireless and Fiber Power Transmission Conference (OWPT2022), Hybrid, Yokohama, Japan, 18–21 April 2022; p. OWPTp-03. [Google Scholar]
- Imai, H.; Watanabe, N.; Chujo, K.; Hayashi, H.; Yamauchi, A. Beam-Tracking Technology Developed for Free-Space Optical Communication and Its Application to Optical Wireless Power Transfer. In Proceedings of the 4th Optical Wireless and Fiber Power Transmission Conference (OWPT2022), Hybrid, Yokohama, Japan, 18–21 April 2022; p. OWPT5-01. [Google Scholar]
- Xu, W.; Wang, X.; Li, W.; Li, S.; Lu, C. Research on Test and Evaluation Method of Laser Wireless Power Transmission System. EURASIP J. Adv. Signal Process. 2022, 2022, 20. [Google Scholar] [CrossRef]
- Setiawan Putra, A.W.; Kato, H.; Adinanta, H.; Maruyama, T. Optical wireless power transmission to moving object using Galvano mirror. In Proceedings of the Free-Space Laser Communications XXXII, San Francisco, CA, USA, 3–4 February 2020; SPIE: Bellingham, WA, USA, 2020; p. 50. [Google Scholar]
- Tang, J.; Matsunaga, K.; Miyamoto, T. Numerical Analysis of Power Generation Characteristics in Beam Irradiation Control of Indoor OWPT System. Opt. Rev. 2020, 27, 170–176. [Google Scholar] [CrossRef]
- Katsuta, Y.; Miyamoto, T. Design, Simulation and Characterization of Fly-Eye Lens System for Optical Wireless Power Transmission. Jpn. J. Appl. Phys. 2019, 58, SJJE02. [Google Scholar] [CrossRef]
- ANSI Z136.1; Safe Use of Lasers. Laser Inst of America: Orlando, FL, USA, 2014.
- Feng, H.; Hui, H.; Hui, D.; Yang, T.; Zhang, X. Beam Collimation Scheme of Laser Wireless Power Supply System for High Potential Monitoring Node of Power Transmission and Transformation. J. Phys. Conf. Ser. 2021, 1885, 042031. [Google Scholar] [CrossRef]
- Bennett, H.E. Laser Spot Size Control in Space. In AIP Conference Proceedings; AIP: Huntsville, AL, USA, 2003; Volume 664, pp. 571–581. [Google Scholar] [CrossRef]
- GPS.gov: GPS Accuracy. Available online: https://www.gps.gov/systems/gps/performance/accuracy/ (accessed on 9 May 2022).
- Indoor Positioning System. Quuppa. Available online: https://www.quuppa.com/indoor-positioning-system/ (accessed on 9 May 2022).
Publisher’s Note: MDPI stays neutral with regard to jurisdictional claims in published maps and institutional affiliations. |
© 2022 by the authors. Licensee MDPI, Basel, Switzerland. This article is an open access article distributed under the terms and conditions of the Creative Commons Attribution (CC BY) license (https://creativecommons.org/licenses/by/4.0/).

