Review

A Review of Raman-Based Technologies for Bacterial Identification and Antimicrobial Susceptibility Testing

Institute of Medical Photonics, Beijing Advanced Innovation Center for Biomedical Engineering, School of Biological Science and Medical Engineering, Beihang University, Beijing 100191, China
*
Author to whom correspondence should be addressed.
Photonics 2022, 9(3), 133; https://doi.org/10.3390/photonics9030133
Submission received: 5 February 2022 / Revised: 21 February 2022 / Accepted: 22 February 2022 / Published: 25 February 2022

Abstract

:
Antimicrobial resistance (AMR) is a global medical threat that seriously endangers human health. Rapid bacterial identification and antimicrobial susceptibility testing (AST) are key interventions to combat the spread and emergence of AMR. Although current clinical bacterial identification and AST provide comprehensive information, they are labor-intensive, complex, inaccurate, and slow (requiring several days, depending on the growth of pathogenic bacteria). Recently, Raman-based identification and AST technologies have played an increasingly important role in fighting AMR. This review summarizes major Raman-based techniques for bacterial identification and AST, including spontaneous Raman scattering, surface-enhanced Raman scattering (SERS), and coherent Raman scattering (CRS) imaging. Then, we discuss recent developments in rapid identification and AST methods based on Raman technology. Finally, we highlight the major challenges and potential future efforts to improve clinical outcomes through rapid bacterial identification and AST.

1. Introduction

The global rise in antimicrobial resistance (AMR) represents a major public concern that seriously endangers human health [1,2,3,4]. At least 25,000 infected people die each year in the European Union alone due to treatment failures caused by AMR [5]. The biggest problem with current bacterial identification and antimicrobial susceptibility testing (AST) methods is their speed. In most cases, it takes a night of incubation to carry out bacterial identification and an additional 24 to 48 h for AST [4]. Rapid bacterial identification and AST are essential to combat the spread of AMR.
In recent years, matrix-assisted laser desorption ionization–time-of-flight–mass spectrometry (MALDI-TOF-MS) has become the gold standard for the identification of microorganisms in clinical practice [5]. Once the pathogen is identified, an additional 18 to 24 h are needed to perform AST [6]. Traditional AST methods rely on time-consuming culturing methods, including disk diffusion and broth microdilution testing [4]. These methods, based on the differences in bacterial growth at different antimicrobial concentrations, have been standardized and recommended by the Clinical and Laboratory Standards Institute (CLSI) and the European Committee on Antimicrobial Susceptibility Testing (EUCAST) as a gold-standard [5]. However, it takes several days to obtain a pure culture of the pathogen, and at least an additional 16–20 h to obtain the minimal inhibitory concentration (MIC) value, resulting in a turnaround time of 3–5 days [7]. Automated broth microdilution detection instruments, such as VITEK-2, MicroScan WalkAway, and BD phoenix, provide faster AST results and shorten the time to 4.5–18 h [7]. However, these instruments still require bacterial growth, which is still inherently slow. A molecule-based approach is another emerging technique in bacterial identification due to its high specificity and sensitivity [8]. However, this method requires specific antibodies and does not achieve full hybridization, making it difficult to apply to unknown bacteria [9].
Raman technologies, due to their label-free, non-invasive, and single-bacterial sensitivity advantages [10,11,12,13], are playing an increasingly important role in bacterial identification and AST [14,15,16,17,18,19,20,21,22]. Many reviews have focused on different techniques for rapid microbial identification and AST development [23,24,25,26,27]. In this review, we summarize and discuss the latest advances in Raman-based technology in rapid bacterial identification and AST. In particular, we highlight innovative research on three promising technologies, spontaneous Raman, SERS, and CRS, which include stimulated Raman scattering (SRS) and coherent anti-Stokes Raman scattering (CARS) (Figure 1). Moreover, we will discuss their potential for transformation from the laboratory to the clinic.

2. Raman-Based Techniques for Bacterial Identification

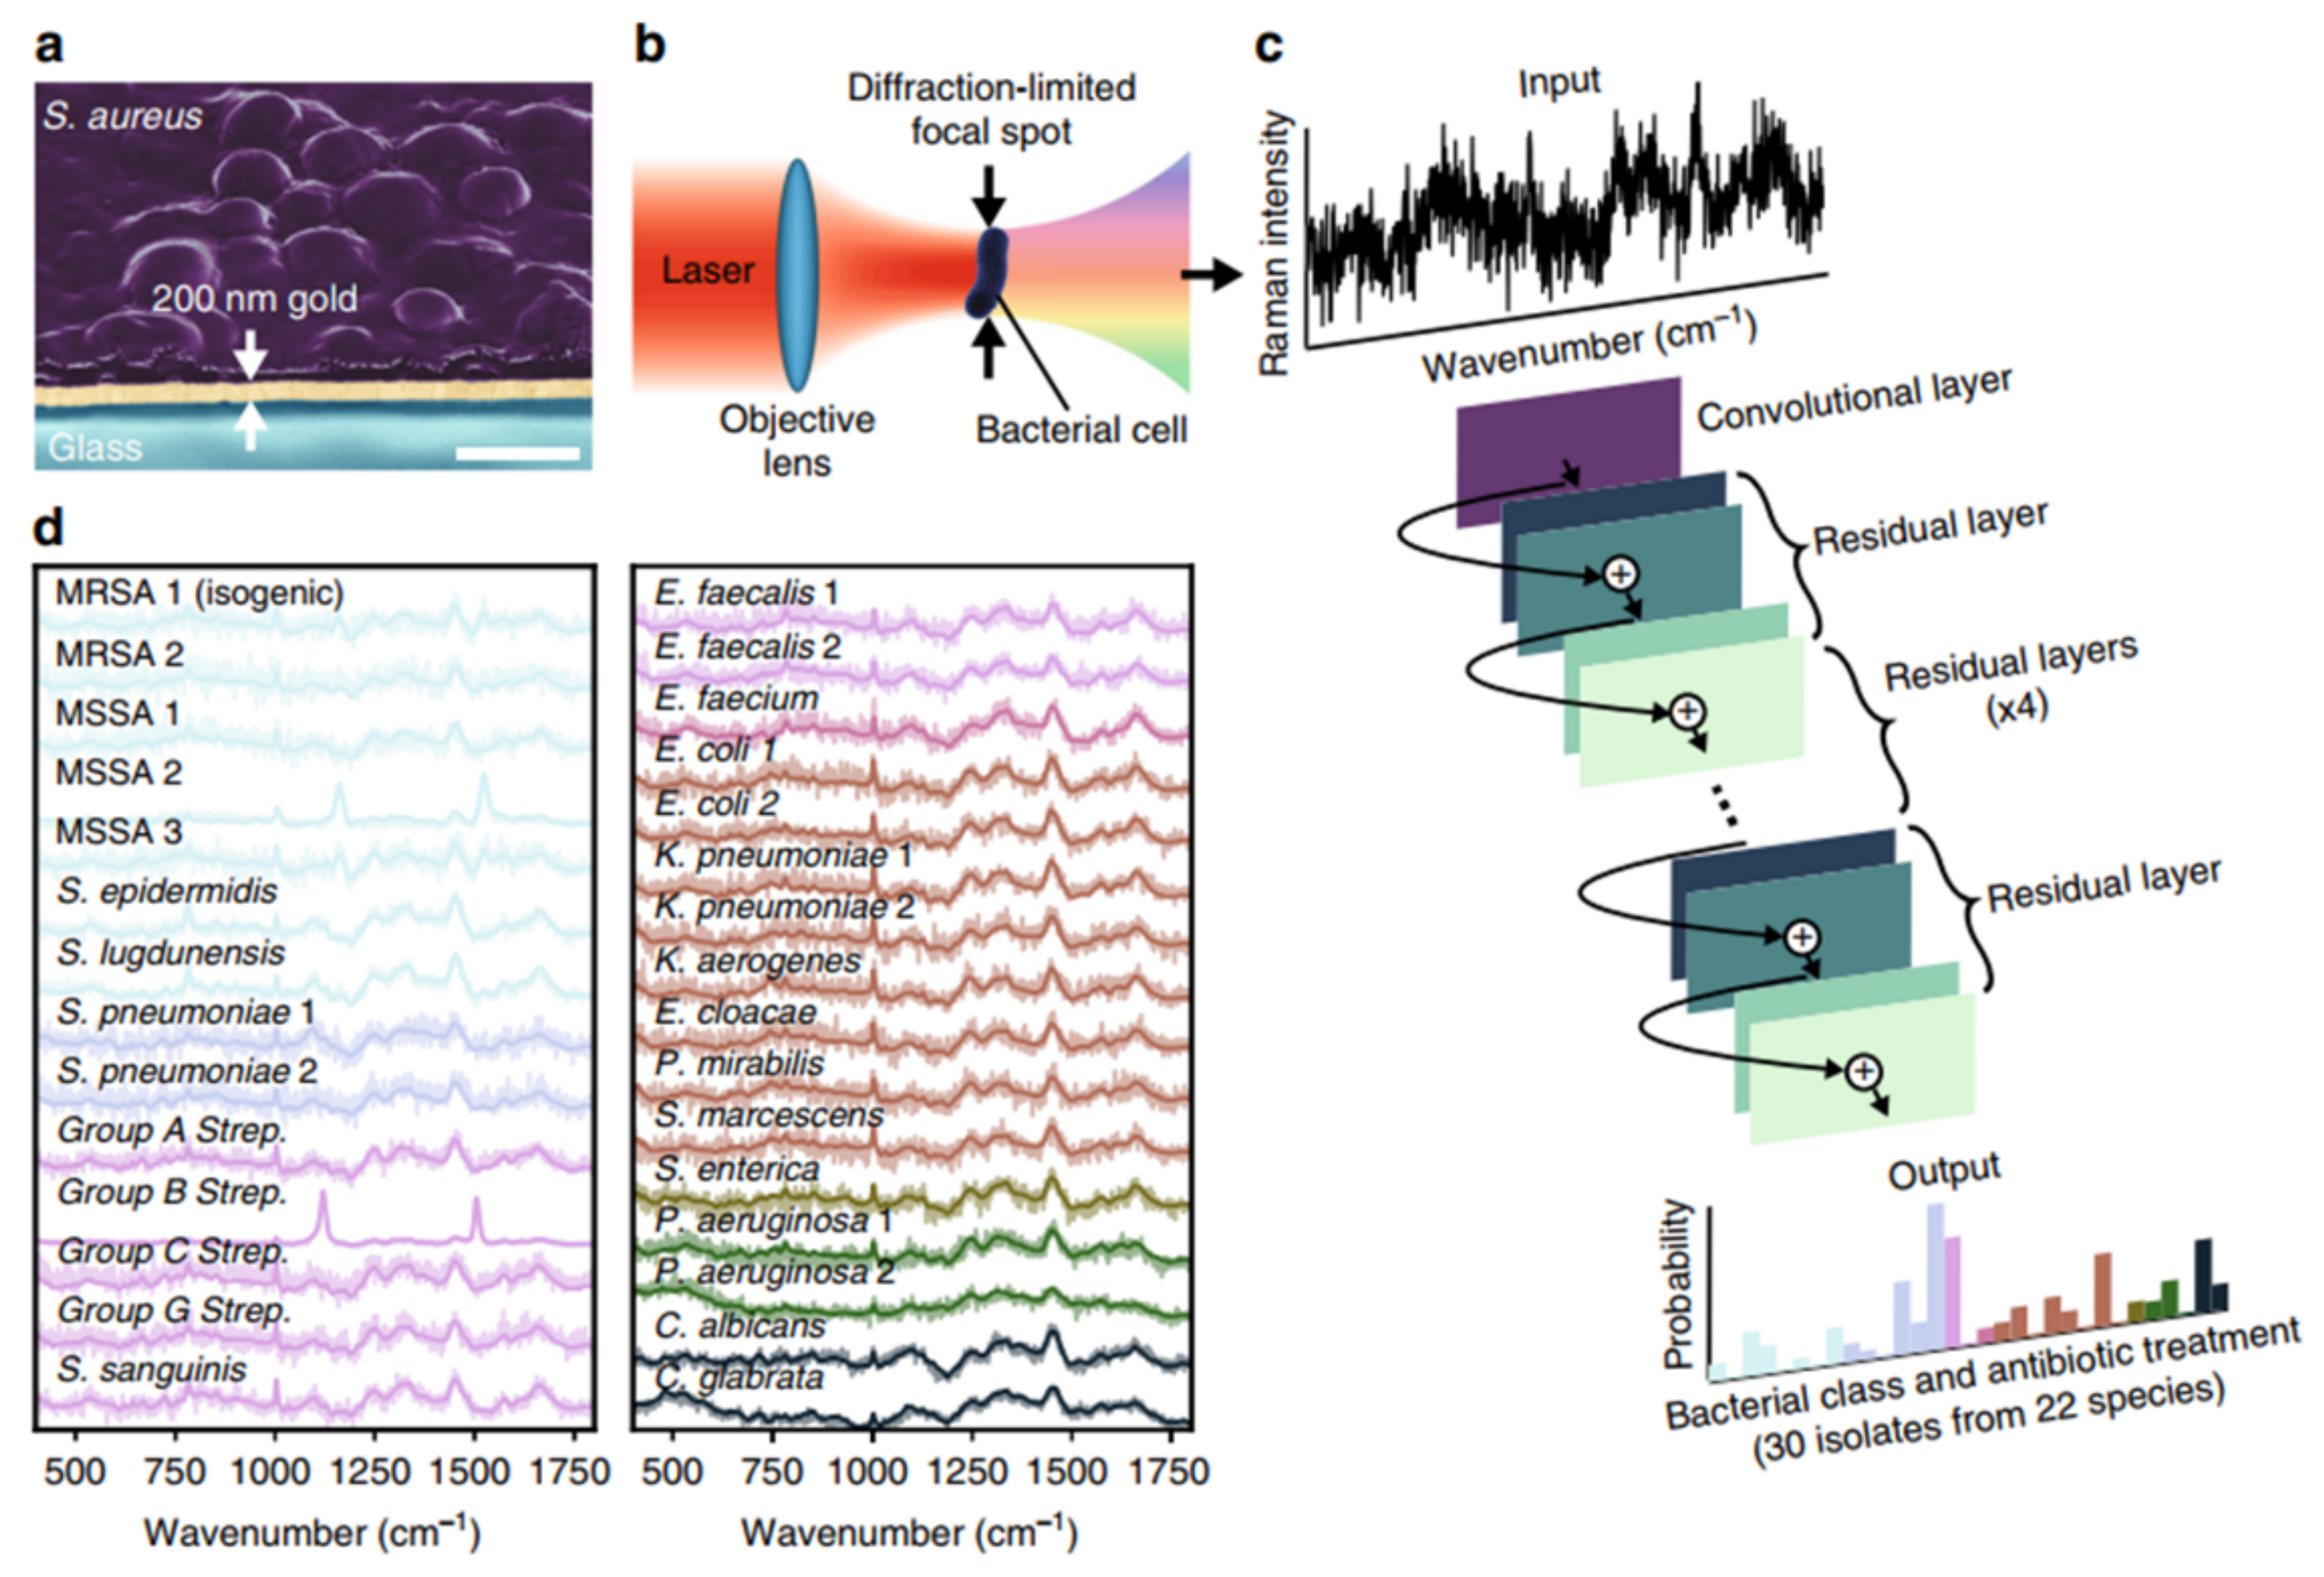
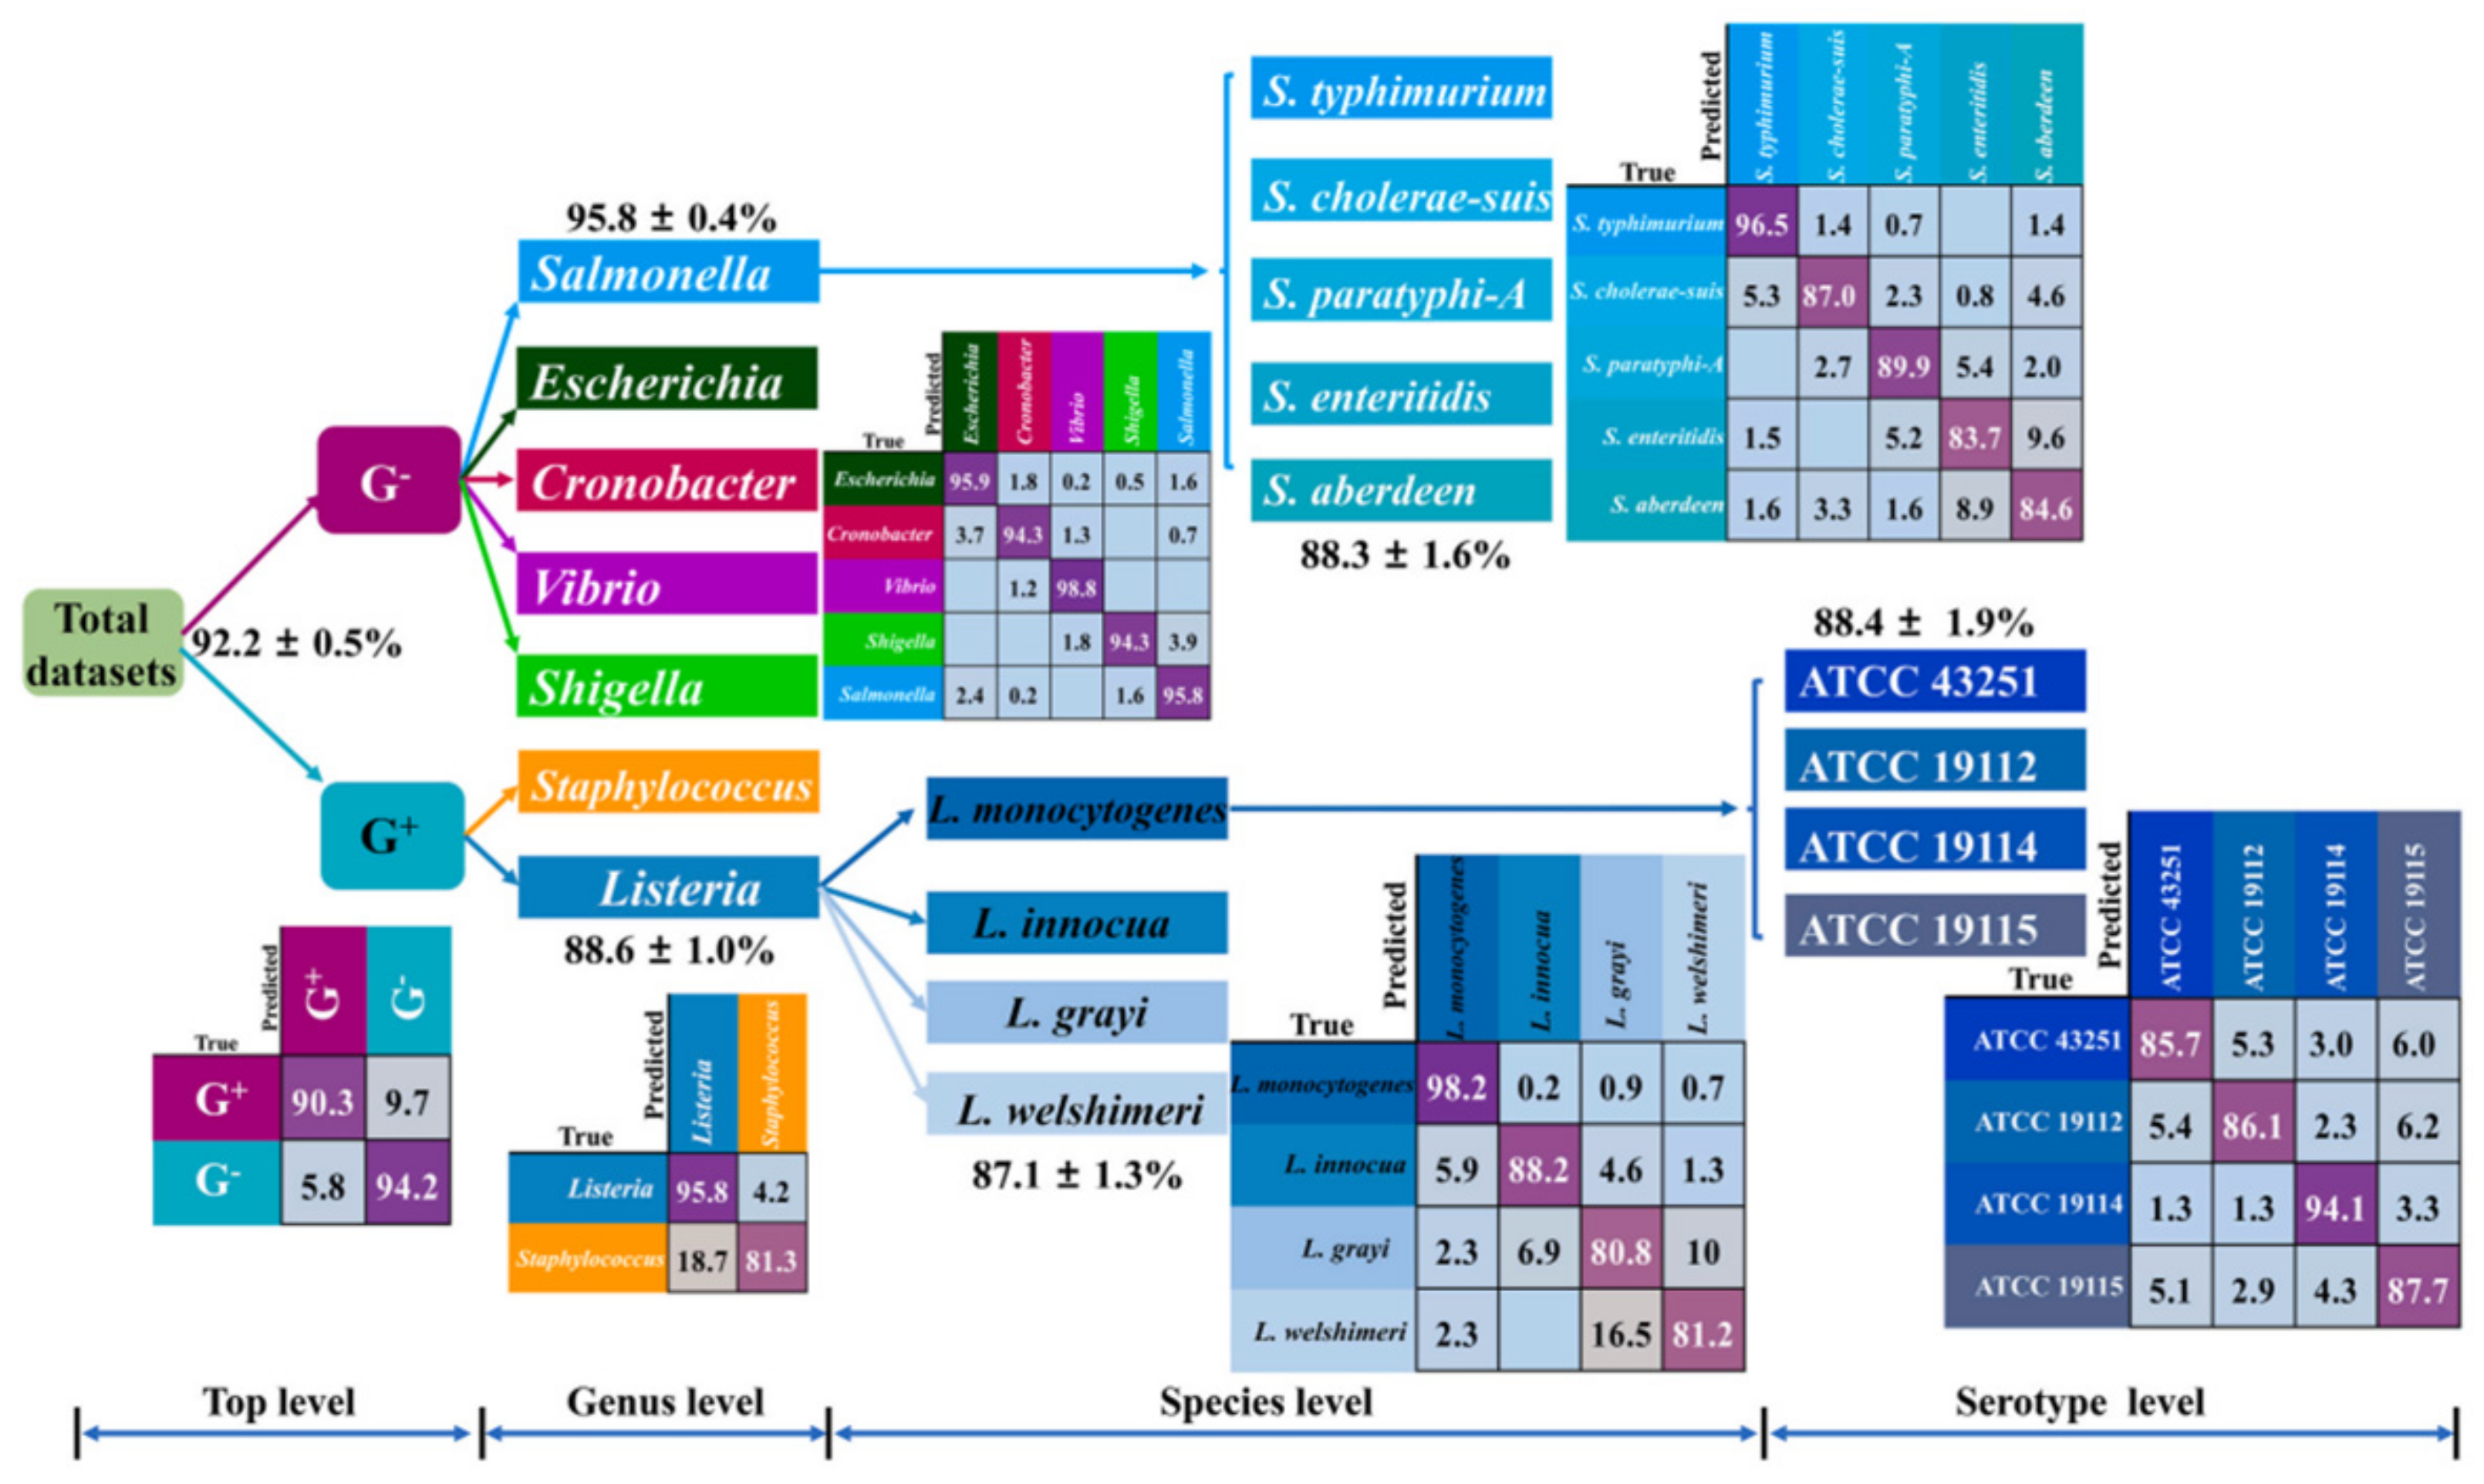
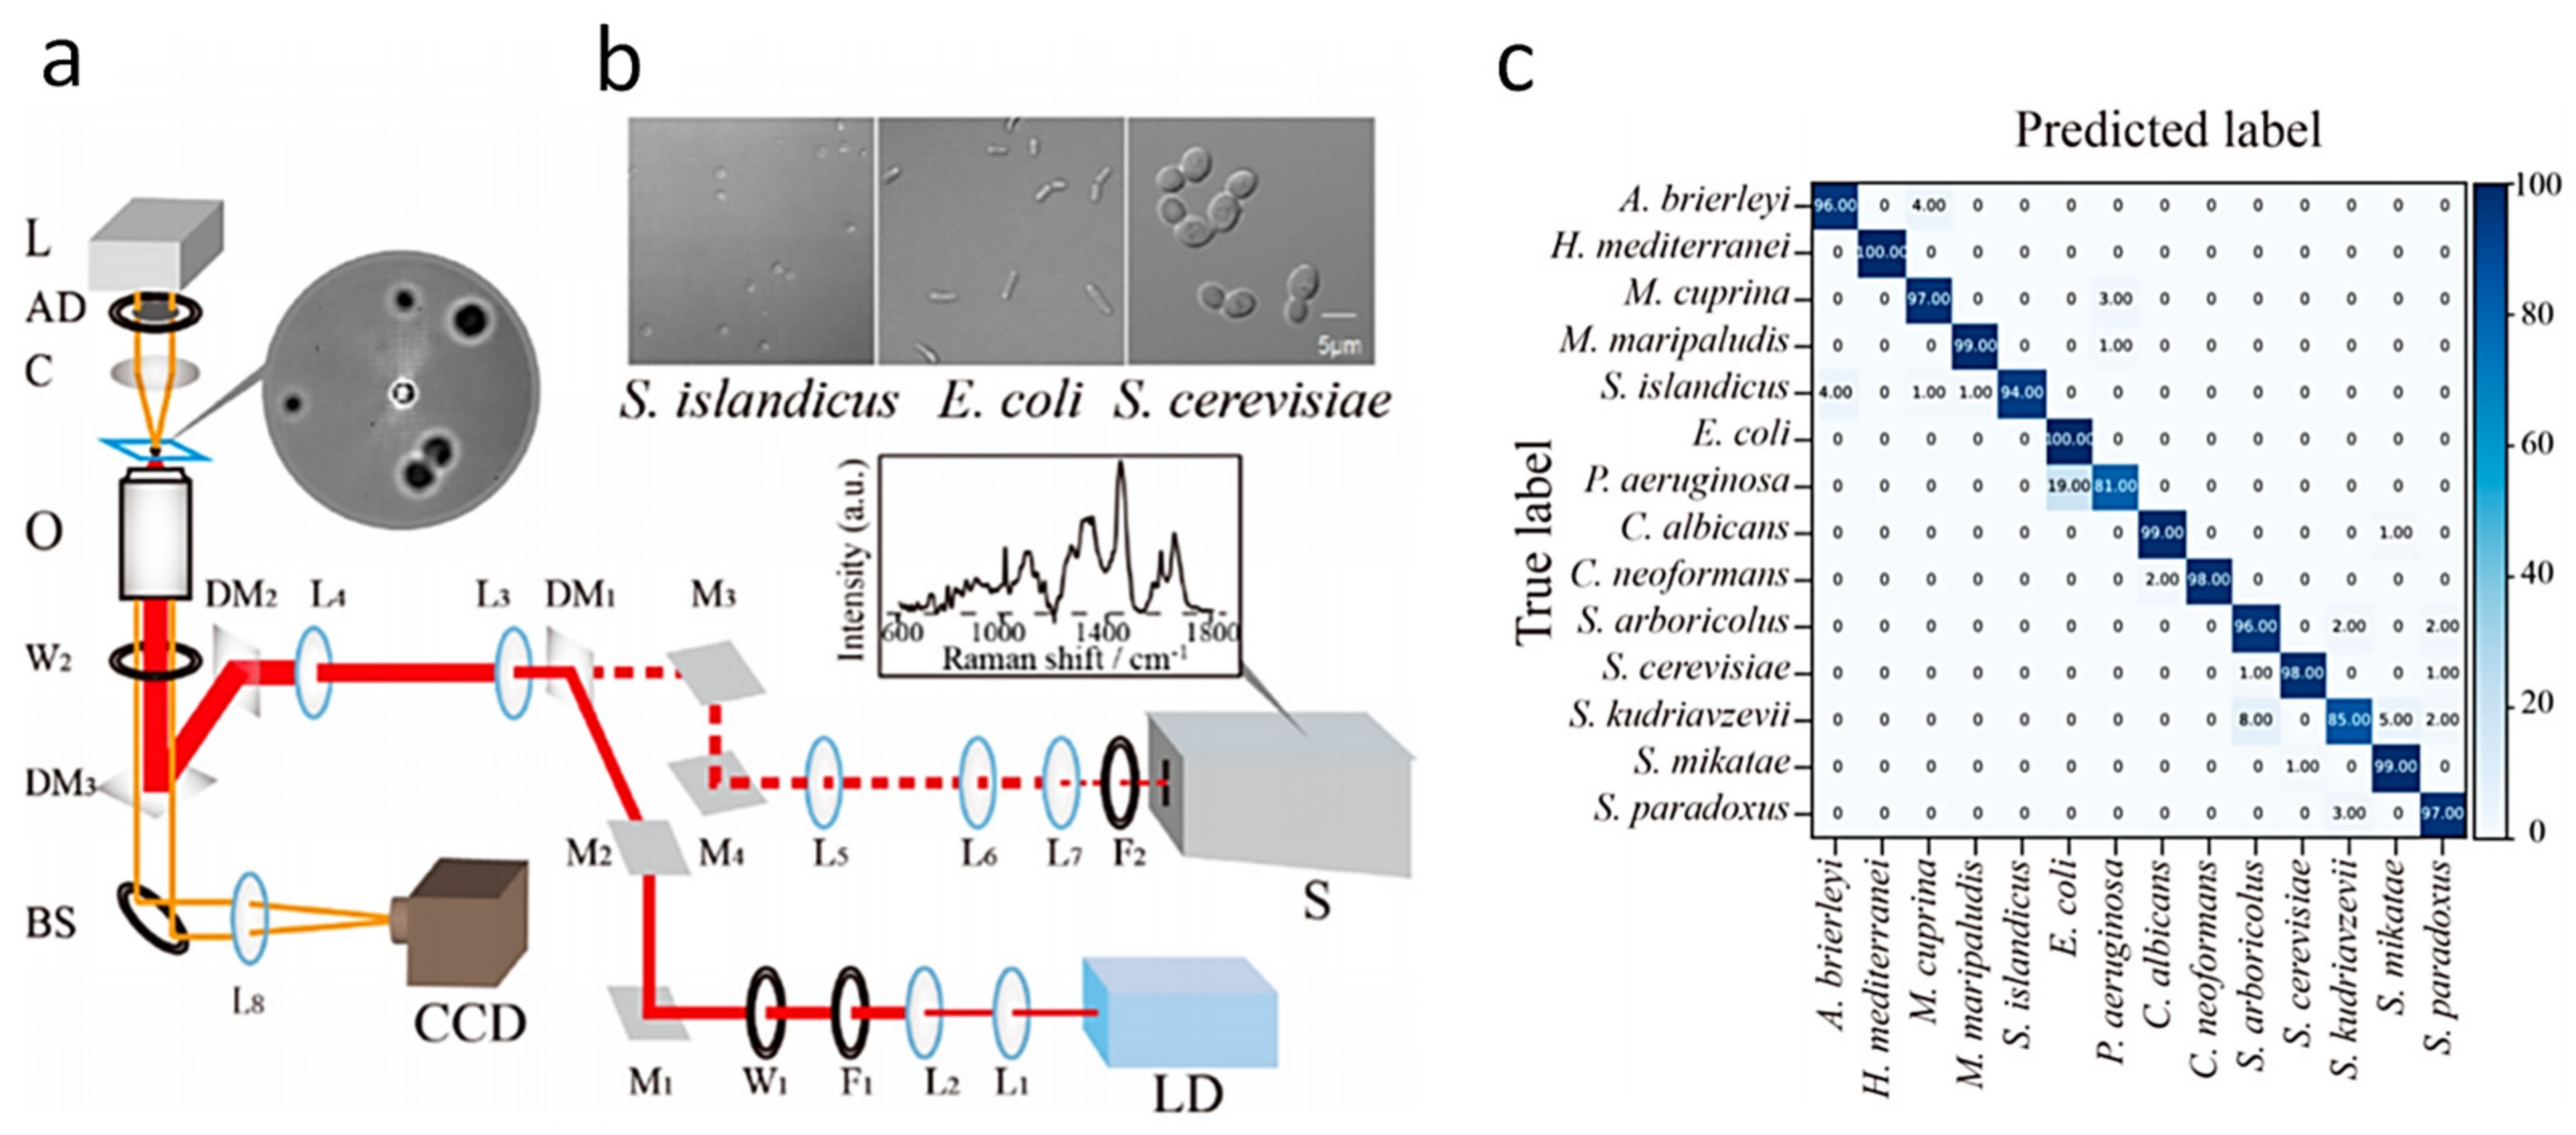
2.1. Artificial Intelligence-Based Raman Spectroscopy for Bacterial Identification

Raman spectroscopy as a vibrational spectroscopy technique has become one of the main tools of biomedicine [10,28,29,30,31]. It differs from other analytical tools since it is simple to use, label-free, and non-invasive. In addition, it has high analytical throughput and provides extensive information about chemical construction, biological structure, and interactions within microbial biomolecules [32].
Many studies utilize Raman spectroscopy for bacteria identification at the species level. For example, Kloß et al. studied urine samples at the single-cell level directly by Raman microscopy for the first time [33]. In this study, a database of 11 important UTI bacterial species grown in sterile-filtered urine was established and classified at a species level to generate a statistical model. Subsequently, this model was demonstrated to identify infected urine samples from ten patients without the need for the traditional cultivation process. Similarly, Rebrošová et al. successfully identified 16 clinically important staphylococcal strains directly from bacterial colonies [34]. They obtained characteristic Raman spectra of 277 Staphylococcus strains with the ideal identification result and demonstrated that Raman spectroscopy could be a reliable tool for clinical bacterial diagnosis.
Because spontaneous Raman signals from bacterial species are inherently weak, achieving clinically rapid and accurate identification remains challenging. Currently, deep learning methods have shown extraordinary potential in processing large amounts of Raman spectroscopic data [14,35]. Ho et al. used Raman spectroscopy and deep learning to classify 30 strains of bacteria and fungi and achieve comparable identification accuracy (Figure 2). This study used a measurement time of 1 s. The corresponding signal-to-noise ratio (SNRs) was one order of magnitude lower than the typical reported bacterial spectrum but still achieved considerable or improved identification accuracy. The advantage of this method is that no culture is required, and the total time for data analysis is greatly reduced. The model used in this study achieved 89.1% accuracy in identifying methicillin-resistant and sensitive S. aureus (MRSA and MSSA) based on detecting subtle spectral differences in antibiotic therapy. Therefore, the limitation of the low signal-to-noise ratio can be overcome through machine learning.
The huge amount of spectroscopic data used in deep learning models usually takes a long time process and requires powerful hardware facilities [36]. Moreover, the classification results from the deep learning model are difficult to link to biological insight [14]. To address these problems, Yan et al. combined Raman spectroscopy with machine learning and proposed a forward-looking strategy for the rapid diagnosis of pathogenic bacteria (Figure 3). The identification accuracy ranged from 87.1% to 95.8%, enabling the efficient prediction of strains at the serotype level [36]. Compared to the deep learning model, using a traditional machine learning method makes chemical bond assignment and data interpretation easier. In addition, traditional machine learning models do not require large amounts of computational power; therefore, it is feasible to integrate them into portable Raman spectrometers, making it easier to expand to the clinic [36].
However, a significant disadvantage of Raman microscopy is the weak signal; the quantum efficiency of the Raman effect is only 10−8–10−6 [11]. Meanwhile, the high power of the laser and long acquisition time in Raman measurements could cause the sample to degrade. Through the interaction of nanoscale roughness materials with biomolecules within a sample, SERS provides orders of magnitude signal enhancement with 108–1014 orders of magnitude [13,37].

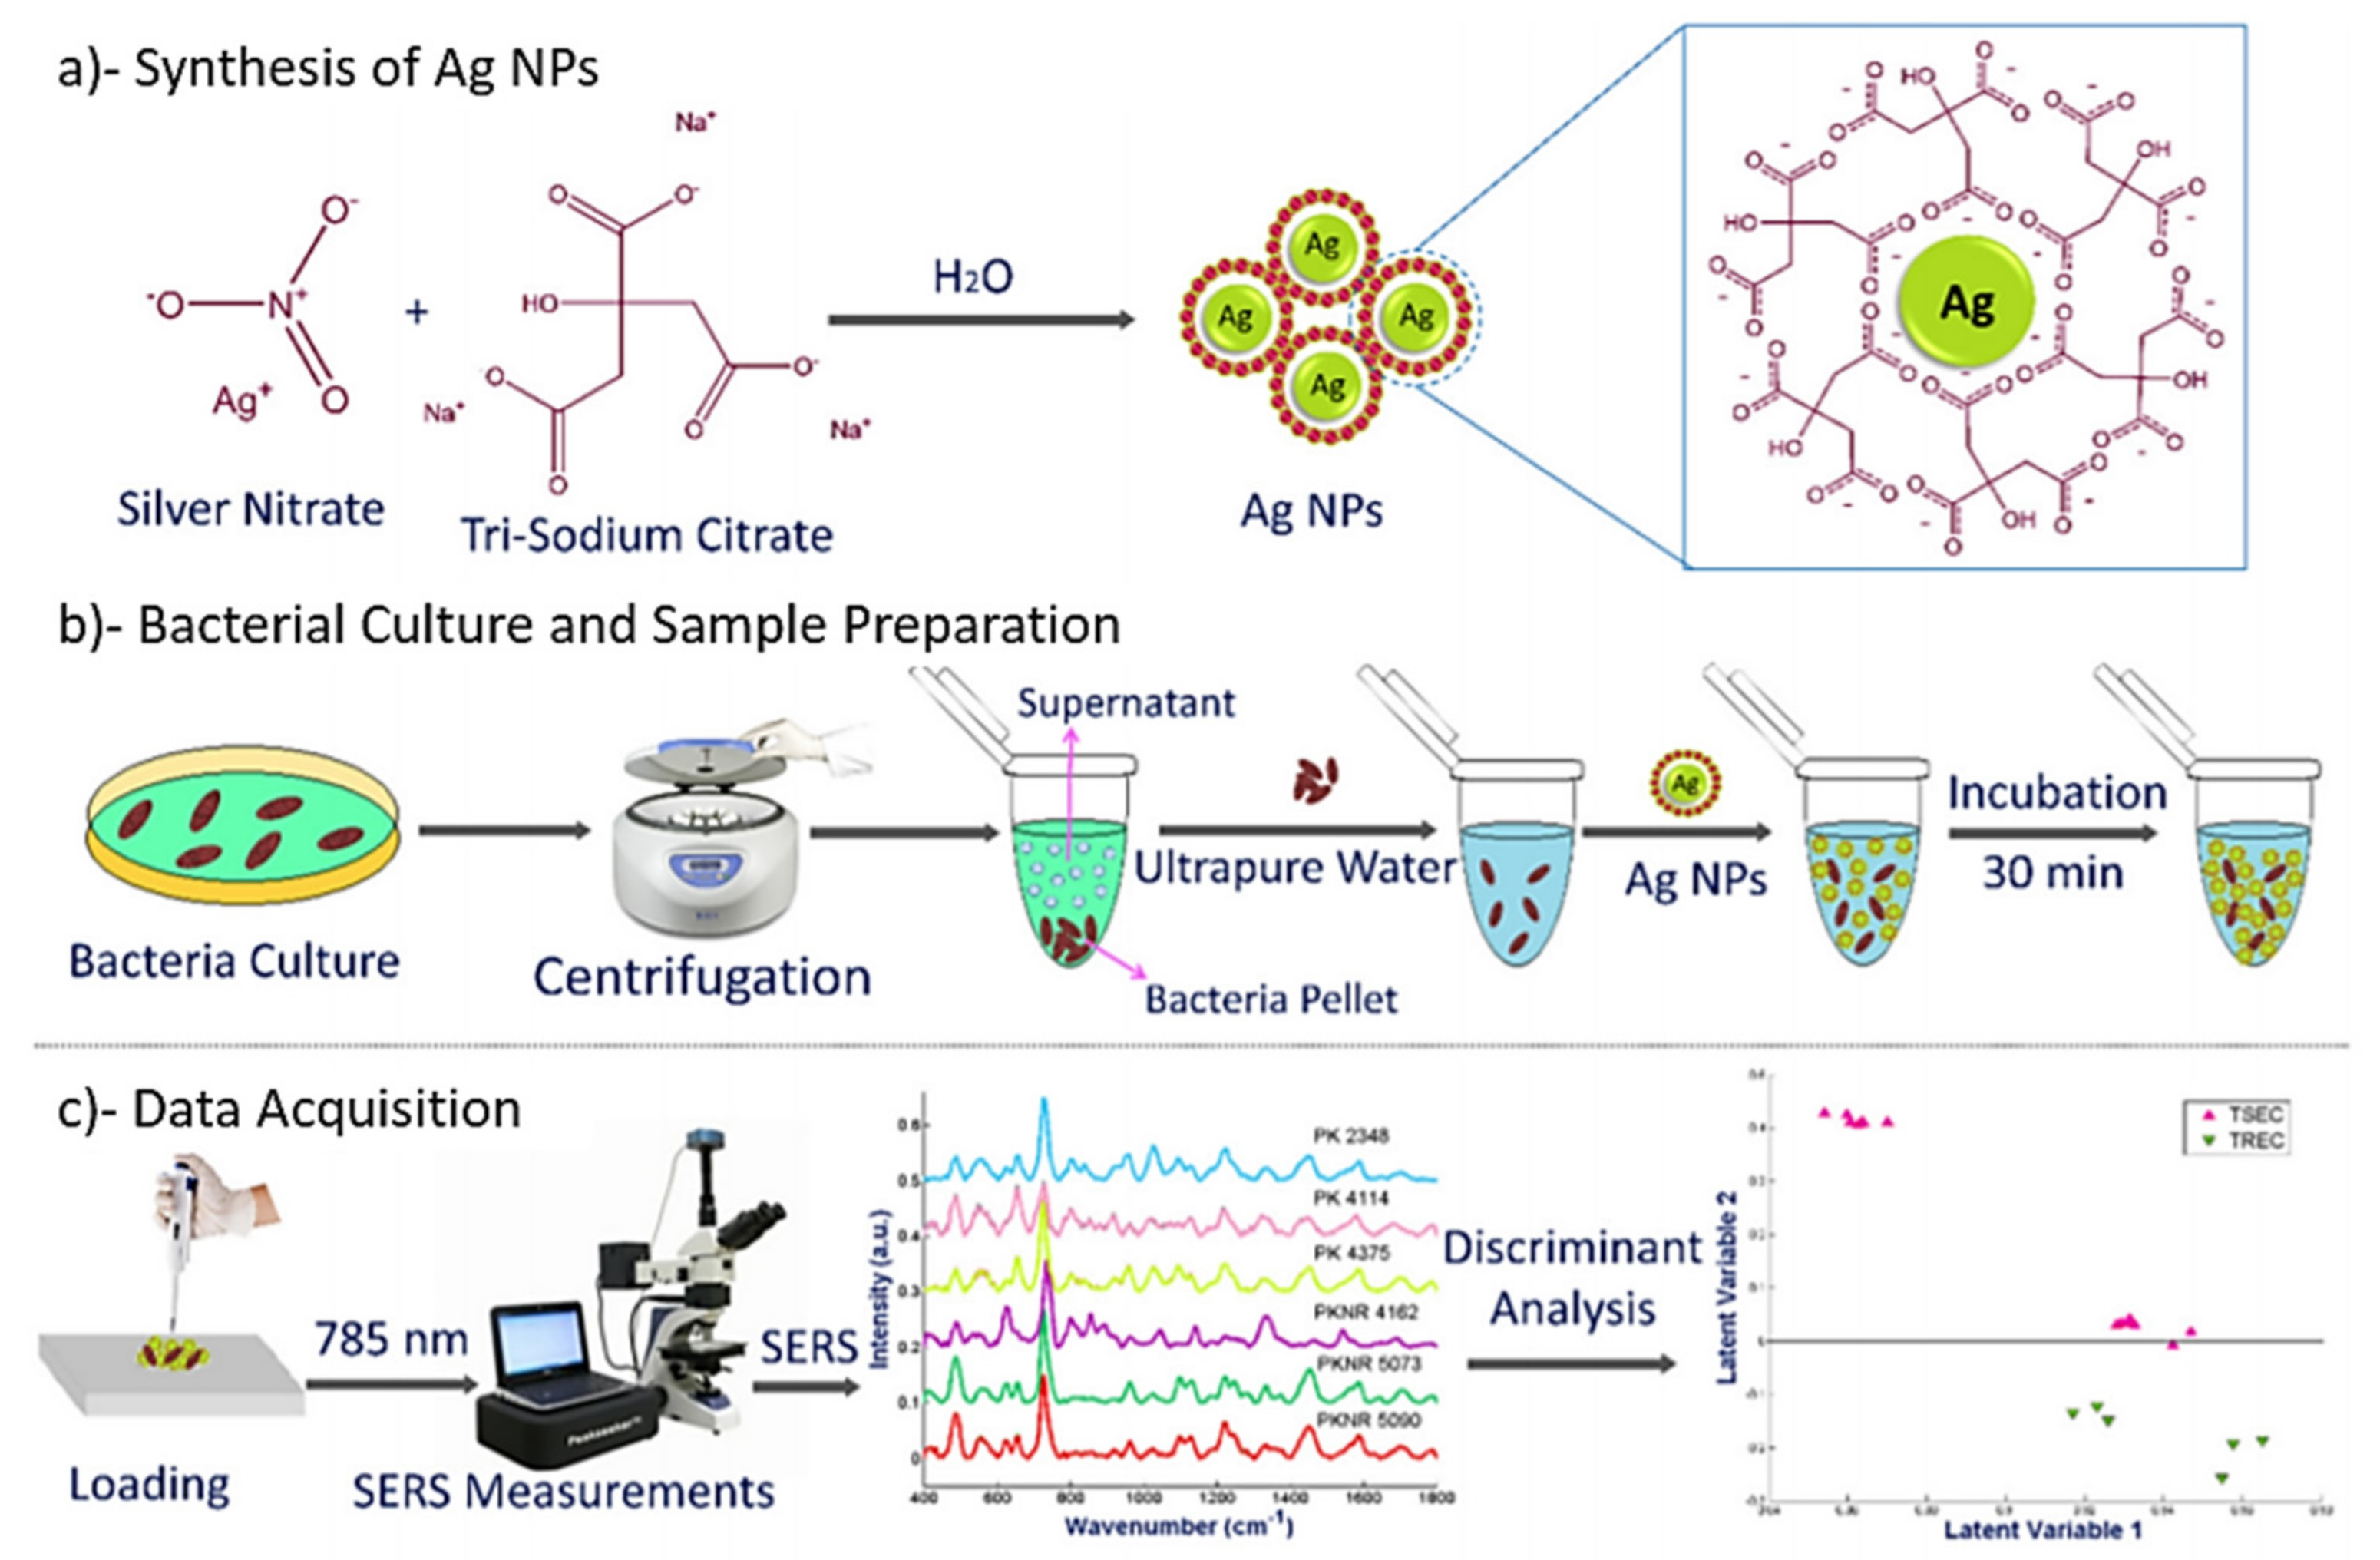
2.2. SERS for Bacterial Identification

SERS improves the sensitivity of Raman techniques, enabling the rapid analysis of different microbial samples. In general, gold and silver nanoparticles are considered ideal SERS substrates [38]. Since classical Raman microscopy is a mature and powerful tool for bacterial identification, SERS has also been used for microbial identification [16,39,40,41].
Bashir et al. [42] achieved tigecycline-resistant E. coli identification by SERS spectroscopy. They used statistical analysis, including principal component analysis (PCA), hierarchical cluster analysis (HCA), and partial least squares discriminant analysis (PLS-DA), to examine the differential diagnostic potential of SERS between tigecycline-resistant and -sensitive E. coli strains (Figure 4). This study showed that using an ideal analytical model combined with SERS spectra, it is possible to distinguish bacterial species. However, when comparing the SERS spectra of different bacteria, there are still some problems. Details can be found below, including standard operating procedures (particularly SERS substrates), reproducibility of SERS spectra, and chemical stability of SERS substrates or media. These factors directly hinder the correct identification of different bacteria. In addition, it is necessary to establish a database consisting of SERS measurement data obtained under different conditions to distinguish clinical bacterial species [13].
Toward clinical translation, Dina et al. developed a SERS-based biosensor for pathogen detection [16]. This biosensor, which can detect both Gram-negative and Gram-positive microorganisms, requires minimal sample preparation, has low cost, high accuracy, and a short analysis time (less than 5 min). Liu et al. also reported a rapid, specific detection of 22 common pathogenic strains with SERS [43]. They used a novel high-quality silver nanorod SERS substrate prepared by a simple interface self-assembly method to obtain the chemical fingerprint information of pathogens. Using a mathematical analysis method, they revealed the unique spectral characteristics of the strain and identified 20 bacterial species with high sensitivity and specificity. Ease of preparation and cost-effectiveness are worth considering for the development of SERS. The above studies provide support for SERS to move to clinical applications.
In addition, when combined with a microfluidic system, the poor repeatability of SERS could be compensated, which enables the identification of microbial contaminants in food [44]. Moreover, the application of SERS in bacterial identification should consider requirements and challenges, such as increasing the understanding of the obtained spectral data, improving the reproducibility of SERS spectra, optimizing the analysis, improving throughput, and further reducing the cost of the substrate [13,37]. With the improvement of the above problems, SERS can quickly provide more information about the analyte and measure the delay in seconds, thus enabling real-time monitoring of the process to meet the clinical needs of rapid microbial identification. However, given the heterogeneity of bacteria and the complexity of clinical samples, microfluidic techniques still have limitations, so a more specific and precise approach is required for bacterial identification.

2.3. Laser Tweezers Raman Spectroscopy (LTRS)
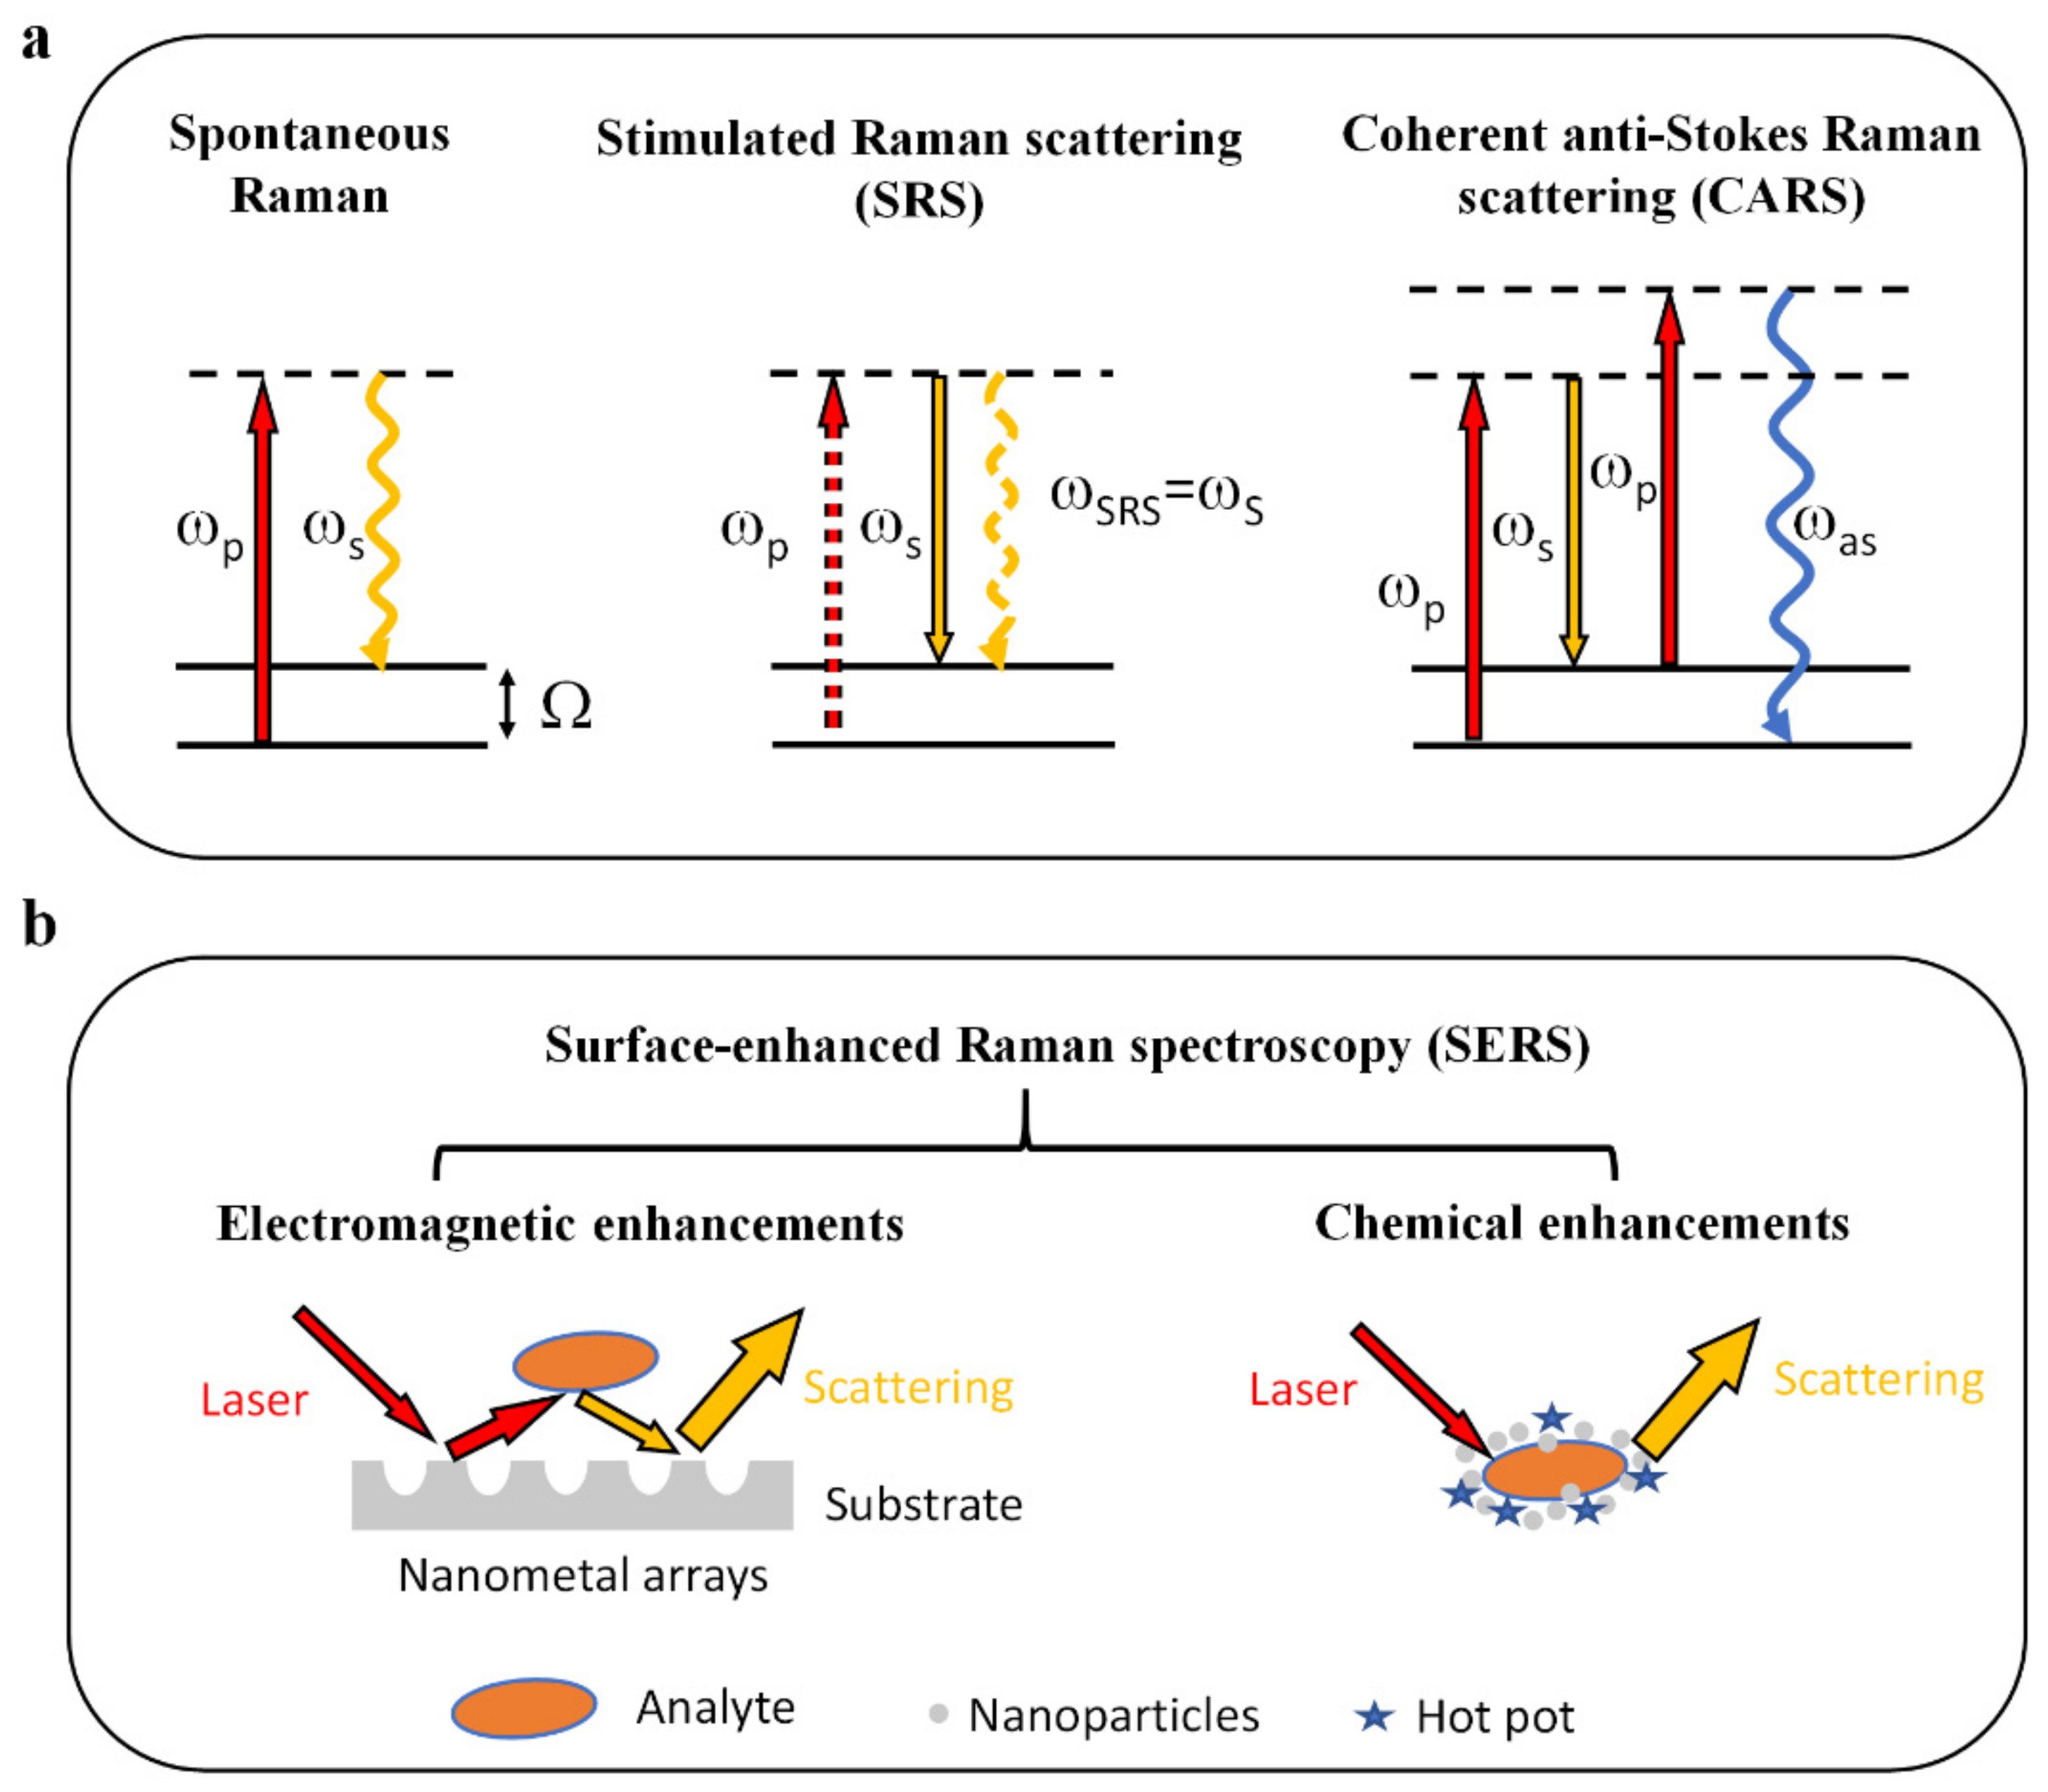
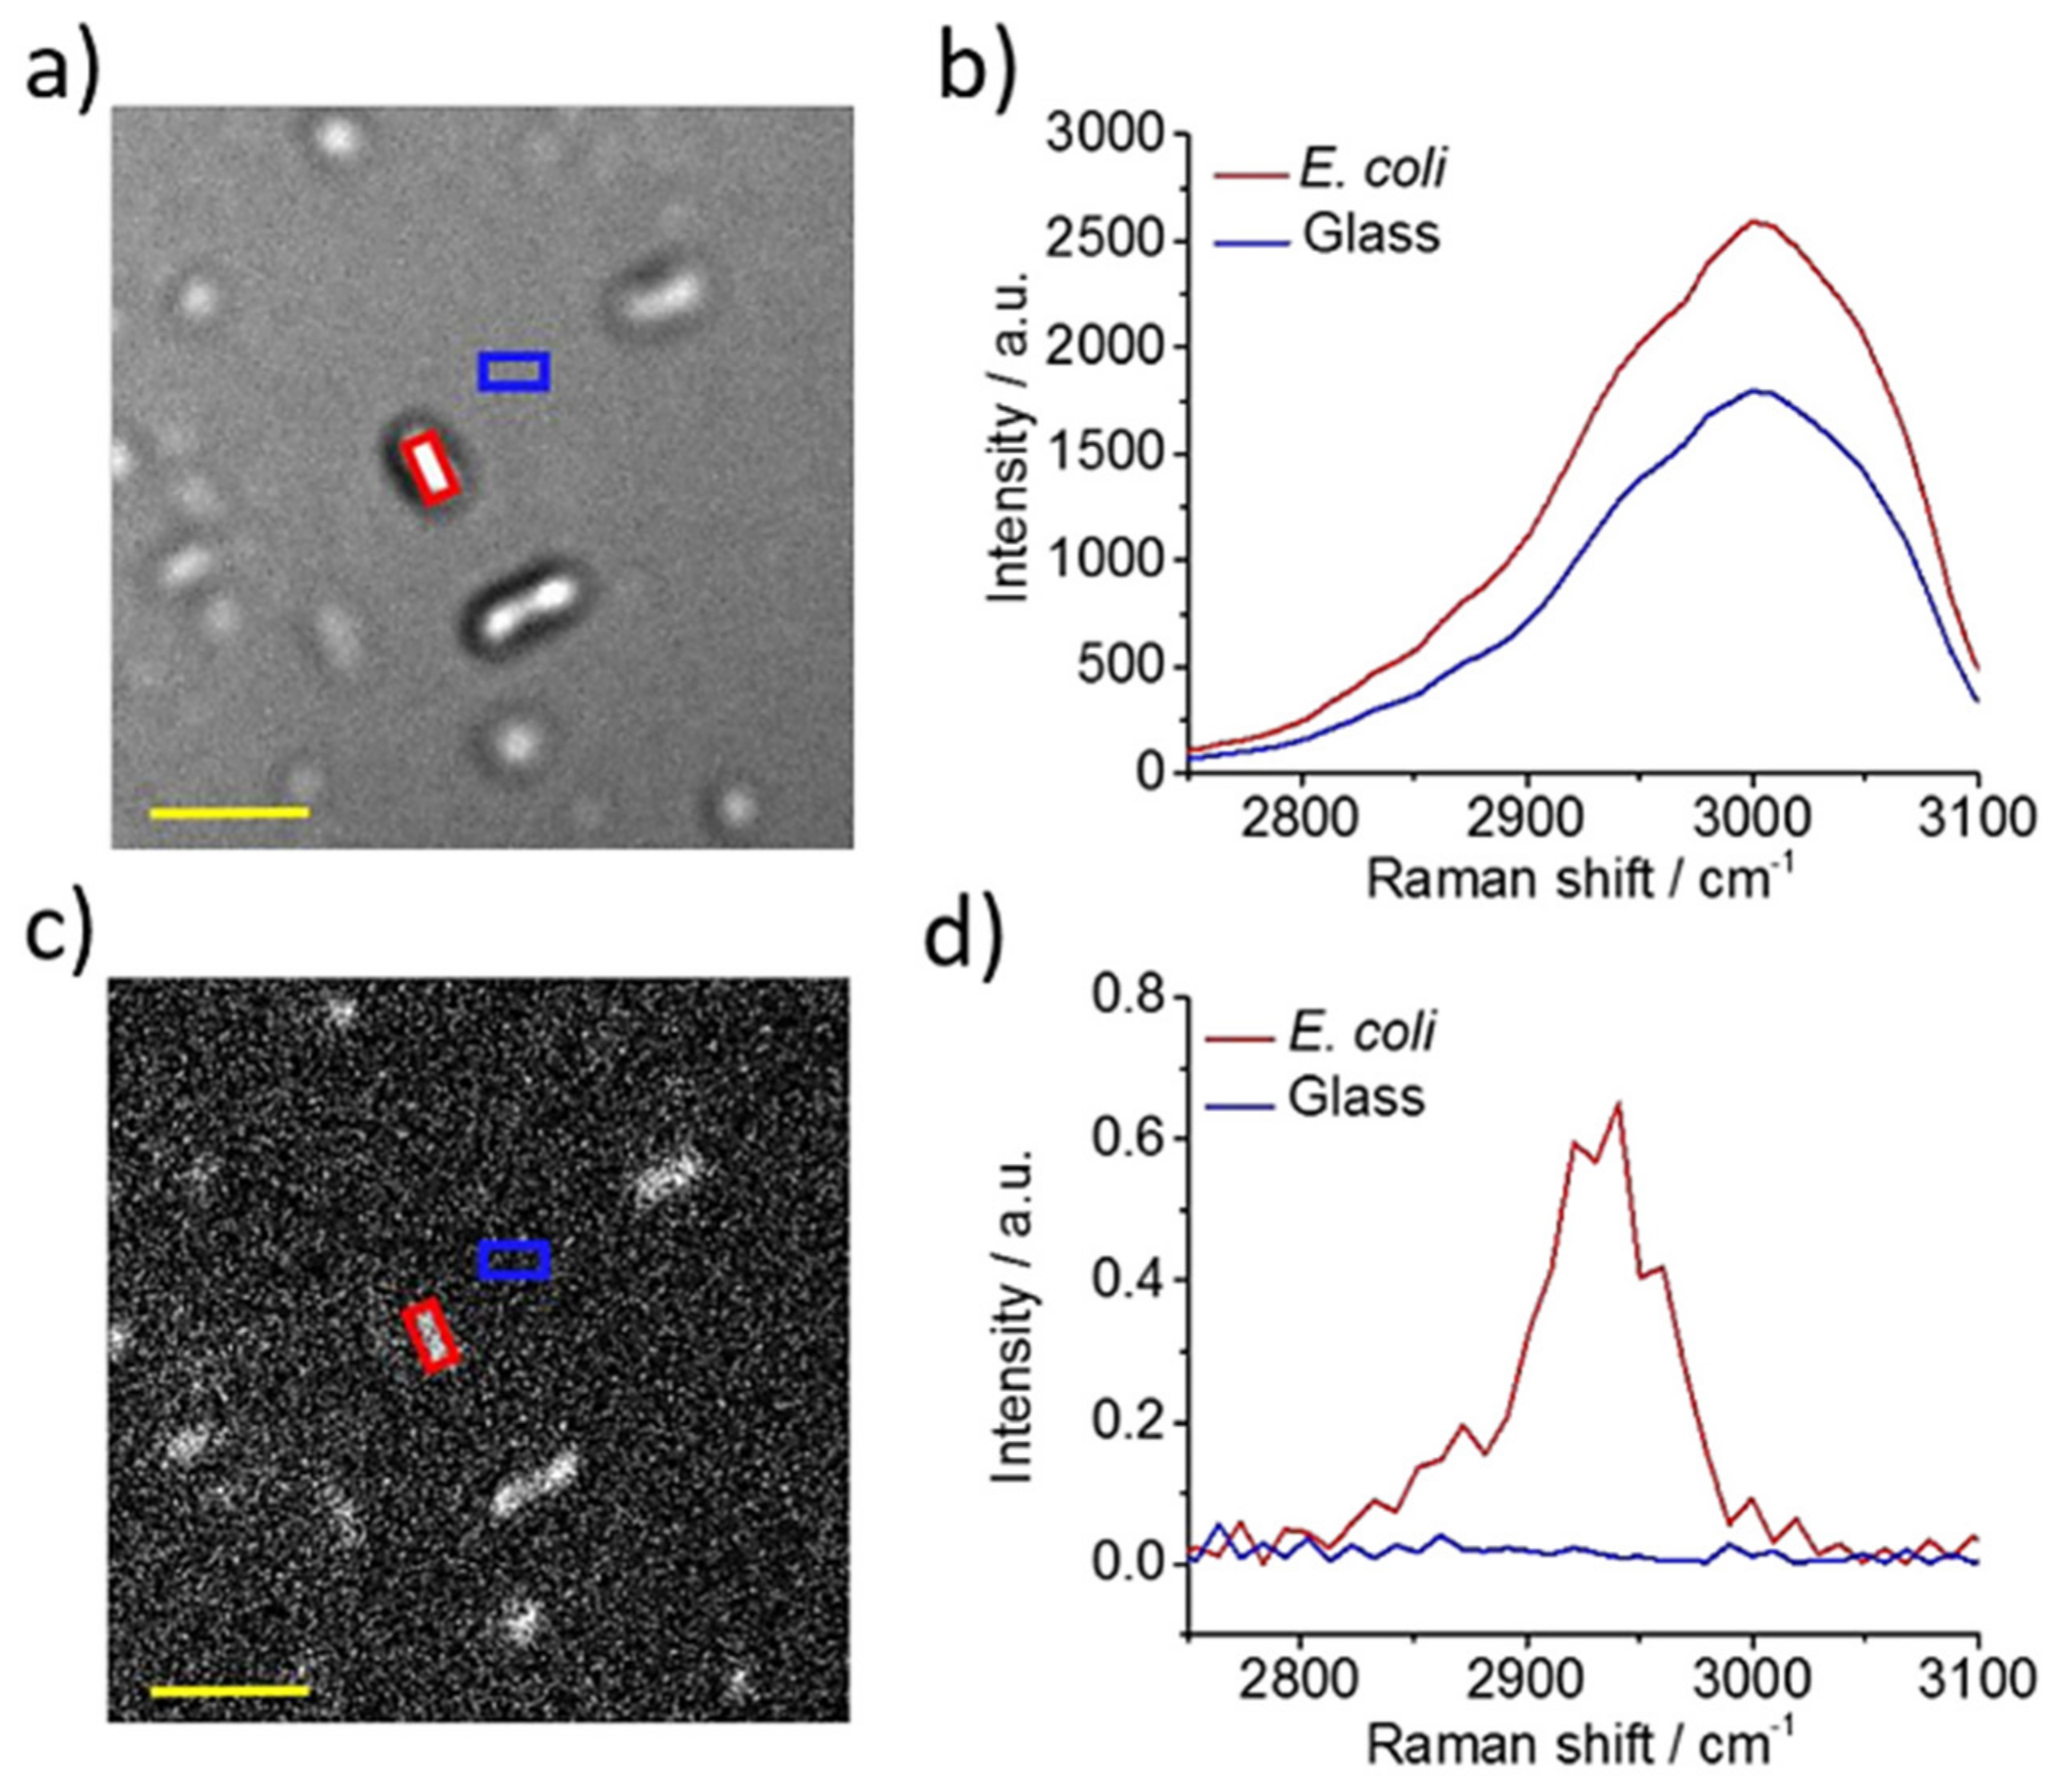
The combination of Raman spectroscopy and optical tweezers allows for contactless manipulation and separation of the biological sample of interest, enabling nondestructive identification and the precise extraction of individual specific cells. High-resolution Raman spectroscopy images allow us to obtain abundant information about cellular-level compounds in biological samples, including RNA/DNA, lipids, proteins, and other metabolites [38,45]. Furthermore, LTRS has many advantages over traditional Raman techniques, e.g., simple sample preparation, facilitating the preservation of biological samples in their original state in an almost physiological environment, detection requires a small amount of sample, and high sensitivity and specificity for spectral analysis of microorganisms [46].
Xie et al. achieved the reagent-free identification of individual bacterial cells in aqueous solutions by LTRS [47]. They used six bacteria to demonstrate the ability of confocal LTRS to identify and distinguish various bacteria under different growth conditions. This study shows that LTRS has the potential to detect and identify microbial cells in different aqueous media rapidly. In another study, to improve the specificity of laser tweezer technology, Huang et al. demonstrated an approach for bacterial identification by combining optical capture, laser tweezers, and stable isotope Raman microscopy [48]. They performed Raman spectroscopy acquisition on artificially mixed 13C-labeled and unlabeled bacteria to explore the isolation of different bacteria. The limitation of this method is that cell dysfunction, cell death, or the physical dislocation of individual cells during the identification process can occur during bacterial culture, and the cell identification rate is low. Still, only a small fraction of cells are successfully identified, mainly due to cell dysfunction, cell death, or the physical misplacing of individual cells during recognition.
In addition, the actual Raman spectroscopic dataset shows considerable variability in the same cell, even in the same species. This method was further improved by Lu et al. to achieve more accurate bacterial identification through deep learning [49]. They used artificial intelligence to analyze the Raman spectra of LTRS to identify microorganisms at the single-cell level [49]. Using a convolutional neural network (ConvNet) framework, they extracted Raman spectral signatures from individual microbial cells. They constructed the best ConvNet model based on the Raman data, achieving an average classification accuracy of 95.64 ± 5.46% (Figure 5). This work proves that the LTRS has the potential to open up a new frontier in research into unculturable microorganisms, especially microbial identification.
In addition, combined with artificial intelligence and a large number of datasets, the technology provides more reliable results for identifying bacterial species than traditional techniques. In addition, the miniaturization and automation of Raman instruments, Raman spectroscopic enrichment of a large number of microorganisms, and fast cloud data services will facilitate the application of this technology in microbial identification.
However, using LTRS to study the usually inconspicuous characteristic information in individual bacteria remains an enormous challenge [49]. At present, it cannot be widely used in clinical medical diagnosis; the main reason is that the signal intensity measured according to the Raman scattering effect is weak, and the spontaneous Raman signal at the single-bacterial level is very weak and difficult to detect. Although SERS significantly enhances Raman signaling, the need to introduce colloidal metal particles into bacterial samples to achieve Raman enhancement results is contrary to the unlabeled and non-invasive benefits. Therefore, to cope with the complexity of clinical samples and the need for rapid bacterial identification, a label-free, high-throughput, and highly chemically specific technique is necessary.

2.4. CARS

CARS microscopy is a label-free technique that significantly improves signal levels while providing ideal high-throughput detection and chemical specificity compared to other Raman techniques [50]. In addition, hyperspectral CARS can acquire chemical information about an image of a spectrum at every pixel [51]. This technology has enabled the nondestructive identification of bacterial endospores in the mail [52].
Bacterial detection is essential for the clinical diagnosis of infectious diseases and food safety [53]. Conventional methods, including brightfield light microscopy, Gram staining, and motility testing, require long bacterial culture time and unique markers, lack accuracy due to limited information, or are insensitive in complex environments [54]. Hong et al. [51] demonstrated the application of a fiber laser-based hyperspectral CARS to detect bacteria at the single-cell level, with a total recording time of several minutes. This study showed the fiber laser-based CARS could detect bacteria in complex environments, including milk and urine, and culture and labeling of bacteria were not required (Figure 6). However, due to the existence of the non-resonant background signal, the CARS spectrum has a distortion relative to the spontaneous Raman spectrum, and the reflected spectral information is not relatively ideal.
In addition, the simple structure and low cost of fiber lasers for CARS may make the CARS microscope a mobile and inexpensive clinical diagnostic platform. However, the problem of suppressing or separating the non-resonant background of distorted Raman spectroscopy is a top priority that CARS urgently needs to optimize [55]. Although the focus of this research is on bacterial detection, it is also feasible to combine deep learning to achieve bacterial identification based on spectral changes in a variety of bacteria. Meanwhile, the metabolic feedback of bacteria under antibiotics can also be further studied by monitoring spectral changes, making CARS microscopy a promising method for identifying bacteria in situ and achieving rapid AST for bacteria.

3. Raman-Based Techniques for Bacterial AST

Compared with the identification information of bacteria, the AST results of bacteria are more critical to clinical infection. Raman-based techniques are also promising tools for AST [56,57,58]. Compared to other techniques, Raman is label-free and non-invasive, providing an analysis method that does not require sample extraction to study biological samples [59,60,61]. Raman spectroscopy and SRS imaging are two major types of techniques currently used to study bacterial AST. Based on the research of Raman spectroscopy in AST, it mainly includes directly observing the changes (such as peak intensity and area) produced by the effect of drugs on Raman peaks and indicating the metabolism of bacteria under antibiotics using isotope labeling [27]. SRS imaging is based on a combination of deuterium labeling techniques to quantify the metabolic level of bacteria to achieve rapid AST [22]. Compared to quantifying the growth of bacteria based on traditional methods, measuring the metabolism of bacteria to antibiotic therapy can obtain AST results more quickly [27].

3.1. Raman Spectroscopy for Bacterial AST

Raman spectroscopy can provide fingerprint information of different biomolecules in bacteria, such as protein, DNA, lipids, carbohydrates, and metabolites [62]. Moreover, the signal intensity of Raman is proportional to the concentration of molecular components [17,63,64,65]. The idea of Raman-based AST is to detect the changes which sensitively reflect the phenotypic and physiological response of bacteria under the action of antibiotics in these biomolecules [21,66,67,68]. Because Raman can detect single bacteria without lengthy culture and enrichment, it is still applicable when the number of bacteria in complex clinical samples is low [69,70,71].
Rousseau et al. achieved the rapid AST of MRSA by single-cell Raman spectroscopy [57]. This study found that the Raman spectral intensities of susceptible and drug-resistant S. aureus strains differed in the presence of different concentrations of cefoxitin, so differences in Raman spectra can be used to predict their resistance/sensitive phenotypes. Indeed, they also found higher cell-to-cell response denaturation and the important effect of culture conditions on phenotypic resistance of a given strain based on Raman spectra (Figure 7a). This study demonstrates single-cell Raman spectroscopy can rapidly obtain Raman spectra in large cell populations and provide a fine vision of spectral variability that would help address challenging bacterial susceptibility/resistance diagnoses. Moritz et al. [66] combined single-cell Raman with optical tweezers to study the phenotypic response of E. coli to penicillin and cefazolin. This study found several Raman peaks at 729, 1245, and 1660 cm−1, showing significant time-dependent differences in bacteria treated with antibiotics and untreated bacteria, indicating that this method can study the interaction between bacteria and antibiotics to develop a Raman spectroscopy-based AST method. Gmund et al. reported the utility of Raman spectroscopy in detecting the antibiotic resistance of E. coli [72]. They found that the Raman spectrum peak intensity correlated with the expression of well-known antibiotic resistance genes and demonstrated Raman spectroscopy could identify the type and mode of action of antibiotic resistance in 11 strains in a reproducible manner.
The AST methods mentioned above are based on detecting bacterial spectrum changes, mainly in the fingerprint region, under the action of antibiotics. However, like genotype AST, these methods rely on detecting known resistance mechanisms and may not work for different bacteria or antibiotics and unknown resistance.

3.2. Raman Spectroscopy and Isotope Labeling Technique for Bacterial AST

Raman spectroscopy combined with stable isotope labeling has enabled rapid AST by assessing the level of microbial metabolism. When bacteria ingest D, 13C, and 15N isotopic markers through metabolism, essential components in cells, such as proteins, lipids, cytochromes, and carotenes, have a redshift in their Raman spectrum peaks [17]. Notably, the degree of redshift is proportional to the amount of isotope intake, which is related to cell activity or function [64]. Therefore, combining single-cell Raman and stable isotope labeling is an effective way to study bacterial activity and function [56,73].
Compared with 15N and 13C, deuterium (D) labeling shows a unique C-D peak in the biological silent region of Raman spectra and thus is a sensitive method for studying bacterial activity [73]. This labeling is universal and thus provides an alternative solution for general AST. The use of D2O for Raman stable isotope labeling (Raman-D2O) has attracted great interest as a rapid AST [74,75]. Its applications range from identifying pathogens in medical samples to determining microbial activity in the environment.
Tao et al. [21] showed that the Raman-D2O could detect the effects of bacteria on different drugs. This study used the response in 2040 to 2300 cm−1 band as a universal biomarker to study bacterial metabolic activity. Kai Yang et al. further demonstrated Raman-D2O as an activity-based rapid AST method for clinical urine samples [68]. By quickly transferring (~15 min) bacteria in clinical urine, the total detection time from receiving urine to binary sensitivity/resistance reading was reduced to only 2.5 h. Yi et al. [76] integrated the Gram stain classification of linear discriminant analysis (LDA) models and D2O labeling, and developed a fast Raman-assisted antibiotic susceptibility test (FRAST). Using the FRAST, they demonstrated the Gram classification of bacteria and the detection of bacterial metabolic activity. In addition, the clinical feasibility of FRAST was also explored through the analysis of nine infectious urinary samples and three sepsis samples. It could obtain the AST results of the urine samples within 3 h and sepsis samples within 21 h. Collectively, these works demonstrate that Raman-D2O could be a general method for rapid AST that accelerates microbial analysis in clinical practice and facilitates antibiotic stewardship. However, the limitation of this study was that they only determined the sensitivity of bacteria and not the accurate MIC values.

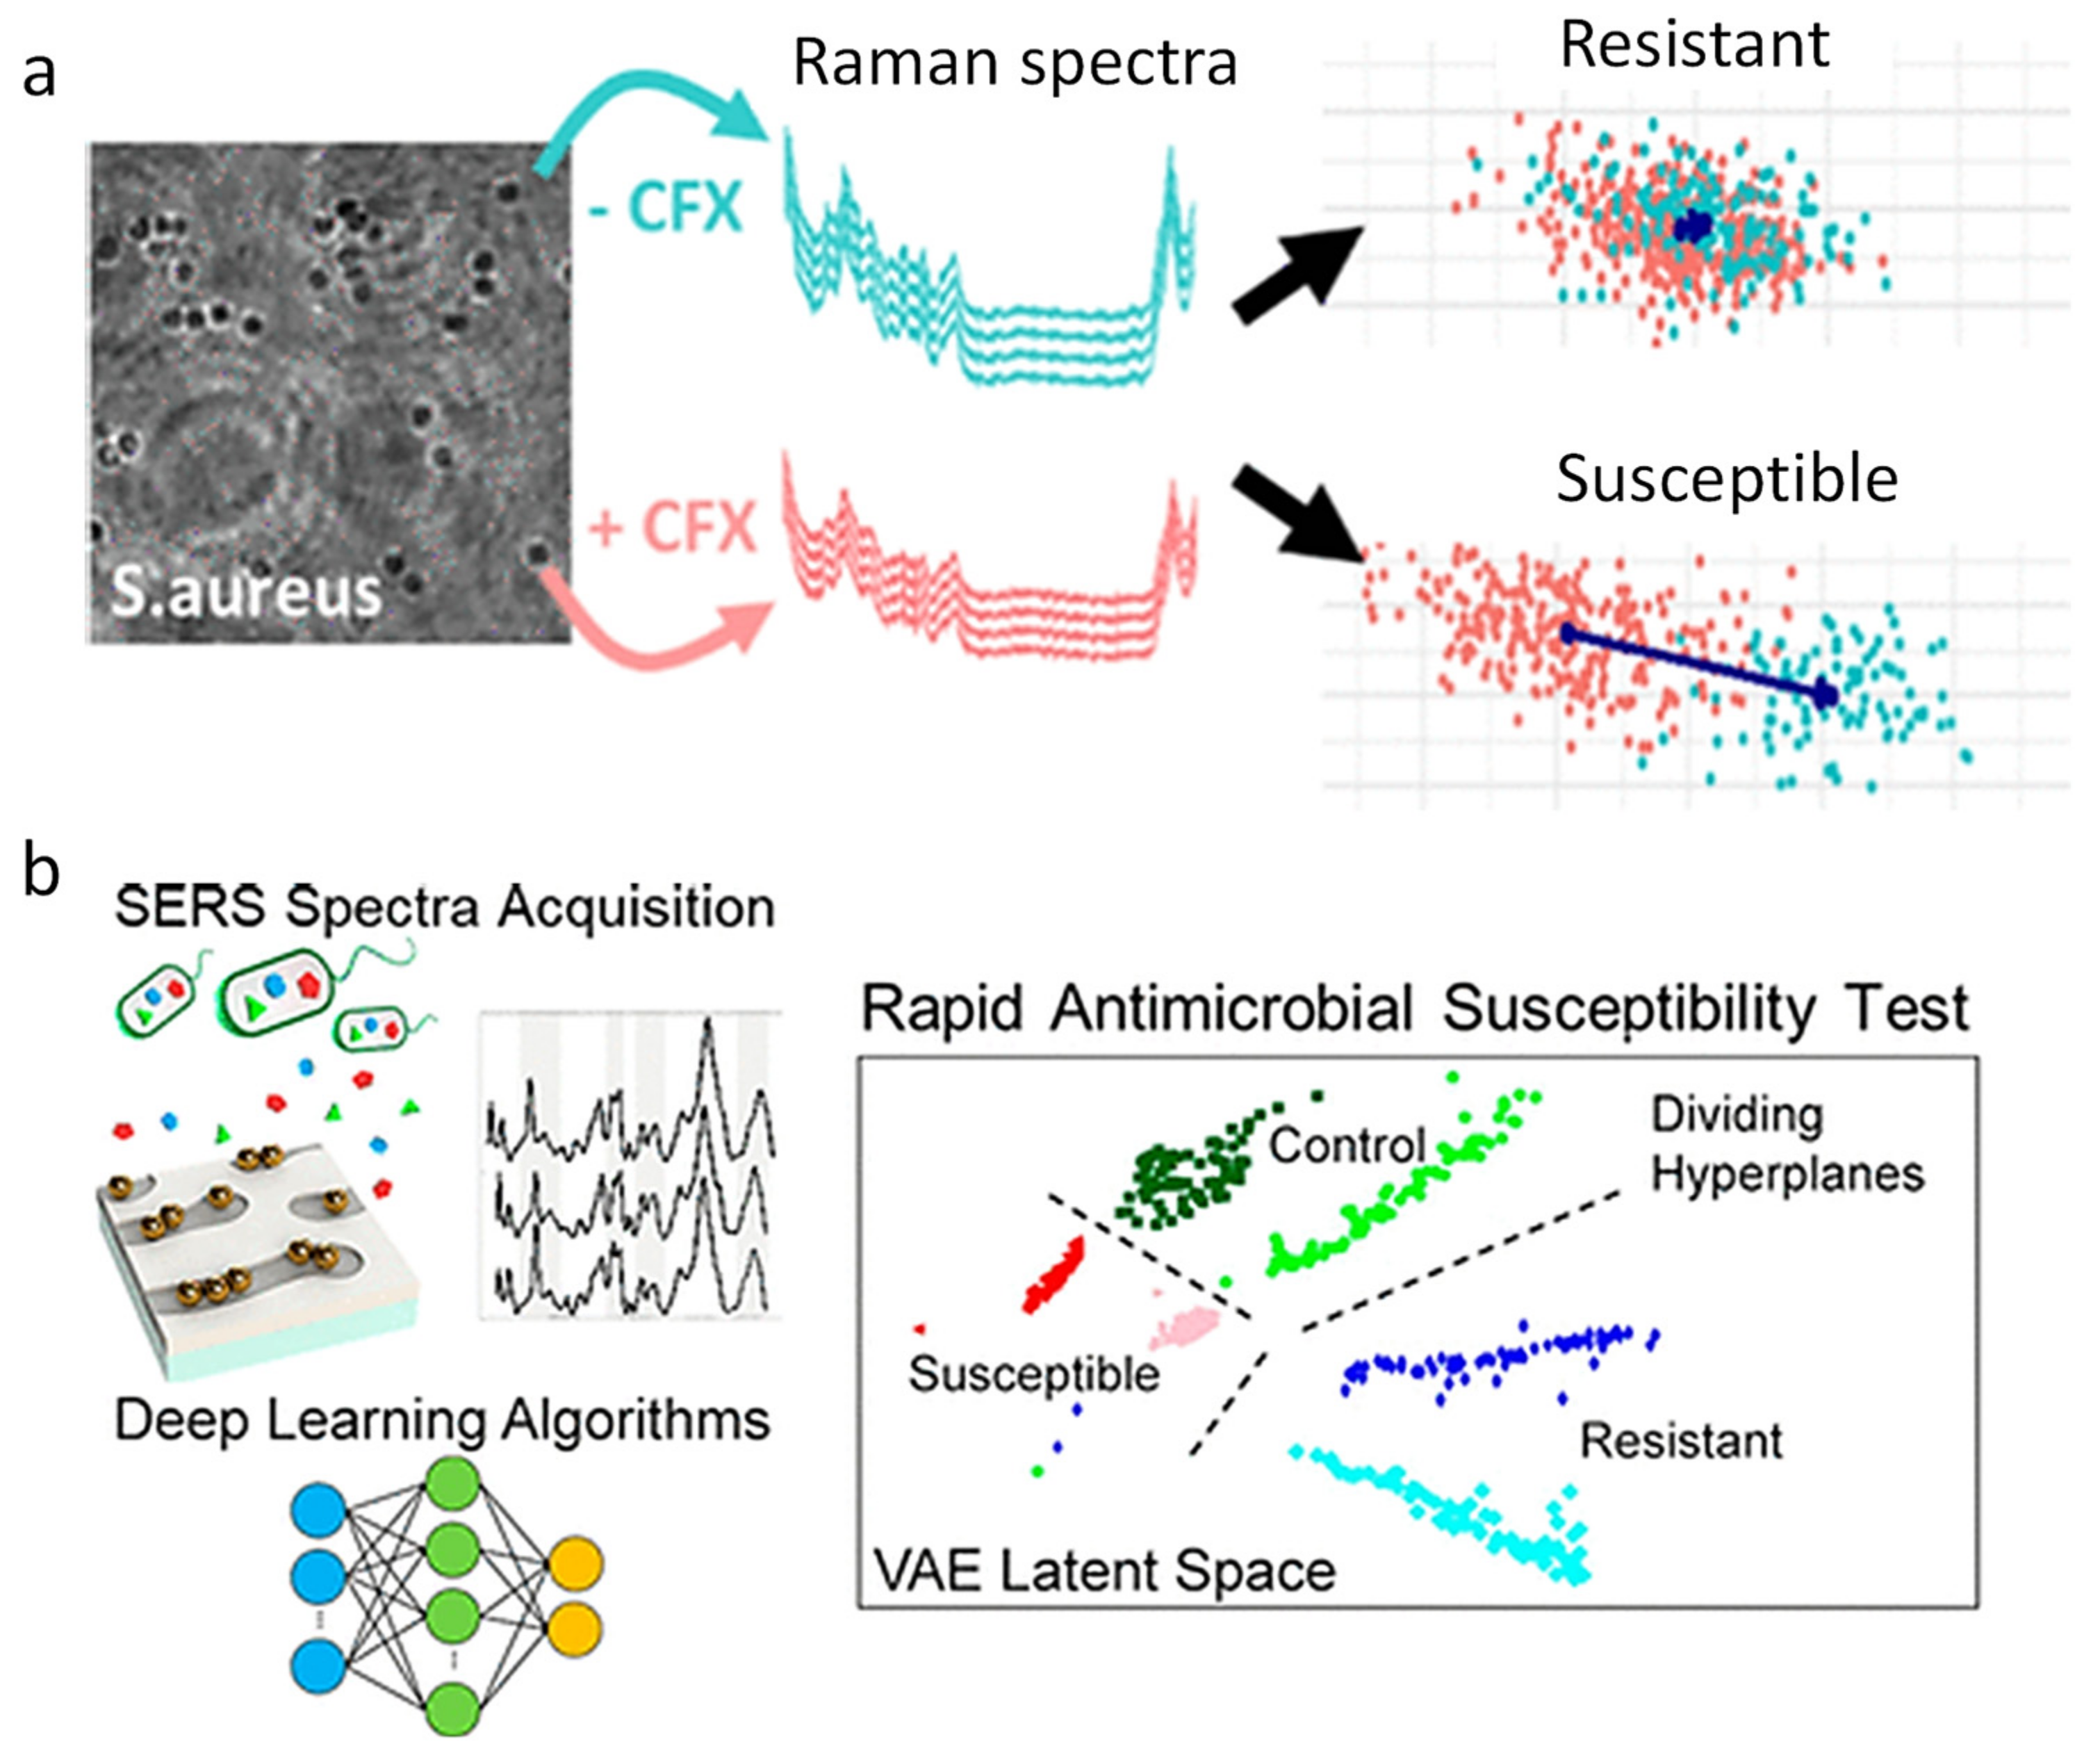
3.3. SERS-Based Sensor for Bacterial AST

SERS-based methods have been applied to the biomedical analysis, including bacterial AST, biomarkers related to cancer and infectious diseases, nucleic acid, and quantitative cell detection [77,78]. The combination of Raman and deep learning shows the promise of AST. Although Raman spectroscopy can benefit from SERS enhancement, a way to address the reproducibility of SERS data is needed [14]. Lots of progress has been made in analyzing the SERS spectrum using complex machine learning models. For SERS-based AST, spectral analysis must be detailed enough to capture the complexity and diversity of bacteria observed in the clinic. Machine learning, especially deep learning, is becoming an important force in healthcare reform, assisting doctors in making more accurate judgments [79]. Therefore, the combination of SERS and deep learning shows the promise of AST.
Fu et al. used Bacteria-aptamer@AgNPs-SERS to detect the Raman intensity of E. coli and S. aureus in the presence of different concentrations of antibiotics [80]. They found that the bacterial Raman signal reached a peak at 735 cm−1, based on which the MIC value could be determined within 1 h. Similarly, Ragan et al. used a sensor platform consisting of SERS sensors, controlled nano-gap chemistry, and machine learning algorithms to analyze complex spectral data (Figure 7b) and revealed that bacterial metabolic status after antibiotic exposure correlated with AST [81]. They showed that this platform could distinguish between the reactions of E. coli and P. aeruginosa with over 99% accuracy in untreated cells within 10 min of exposure to antibiotics. In addition, this study extended the deep learning to the study of P. aeruginosa treated with antibiotics of different efficacies. The generation characteristics of the variational autoencoder were used to identify the vibration regions in the AST dataset that collectively exhibited the greatest variation between antibiotic-resistant, sensitive, and untreated SERS spectra. This work showed that deep learning analyzes SERS data to provide a rapid approach to clinical AST.
SERS is an important analytical tool capable of fingerprinting molecules in a fast, ultra-sensitive manner. However, it is still difficult to meet the requirements of actual sample analysis. Microfluidics technology is an ideal adjunctive technique that can effectively enhance the performance of SERS in complex sample analysis, including reproducibility, selectivity, and sensitivity [82].

3.4. SERS and Microfluidic-Based for Bacterial AST

Microfluidics control the movement of fluids and integrate sample preparation, reaction, separation, and detection in small portable devices [83]. The device can integrate various functions to achieve high-throughput and fast analysis of low-volume fluid samples in the microliter range, especially when combined with SERS and other spectroscopic techniques. Devices that combine microfluidics with SERS analysis have gained a lot of attention in the field of pathogen identification due to the advantages of improved sample automation, integrated sample preparation, mixing and restriction, and increased portability. The combination strategy has great potential to be transformed into a rapid diagnostic application for bacterial AST.
Chang et al. developed a microfluidic system that integrates membrane filtration and SERS active substrates (MF-SERS) for on-chip bacterial enrichment, metabolite collection, and in situ SERS measurements for AST [84]. The MF-SERS system has a detection limit of 103 CFU/mL, which is four orders of magnitude lower than the bacterial concentrations in the centrifugation purification procedure, thereby greatly reducing the bacterial culture time. Bacteria and secreted metabolites are sealed off during bacterial capture, metabolite filtration, and SERS detection, minimizing possible contamination and human error. This study showed that the MF-SERS system has a miniature size and a limited microenvironment that can integrate multiple bacterial processes for bacterial enrichment, culture, and AST assays.
However, microfluidics still have limitations for clinical samples. For example, clinical samples often have lots of impurities that cause clogging, so a complex pretreatment process is required. In addition, the single-use of microfluidic chips cannot give full play to the advantages of the microfluidic analysis platform that can be used multiple times, resulting in higher detection costs. Therefore, it is necessary to develop a high-throughput technique that can be used directly in clinical samples.

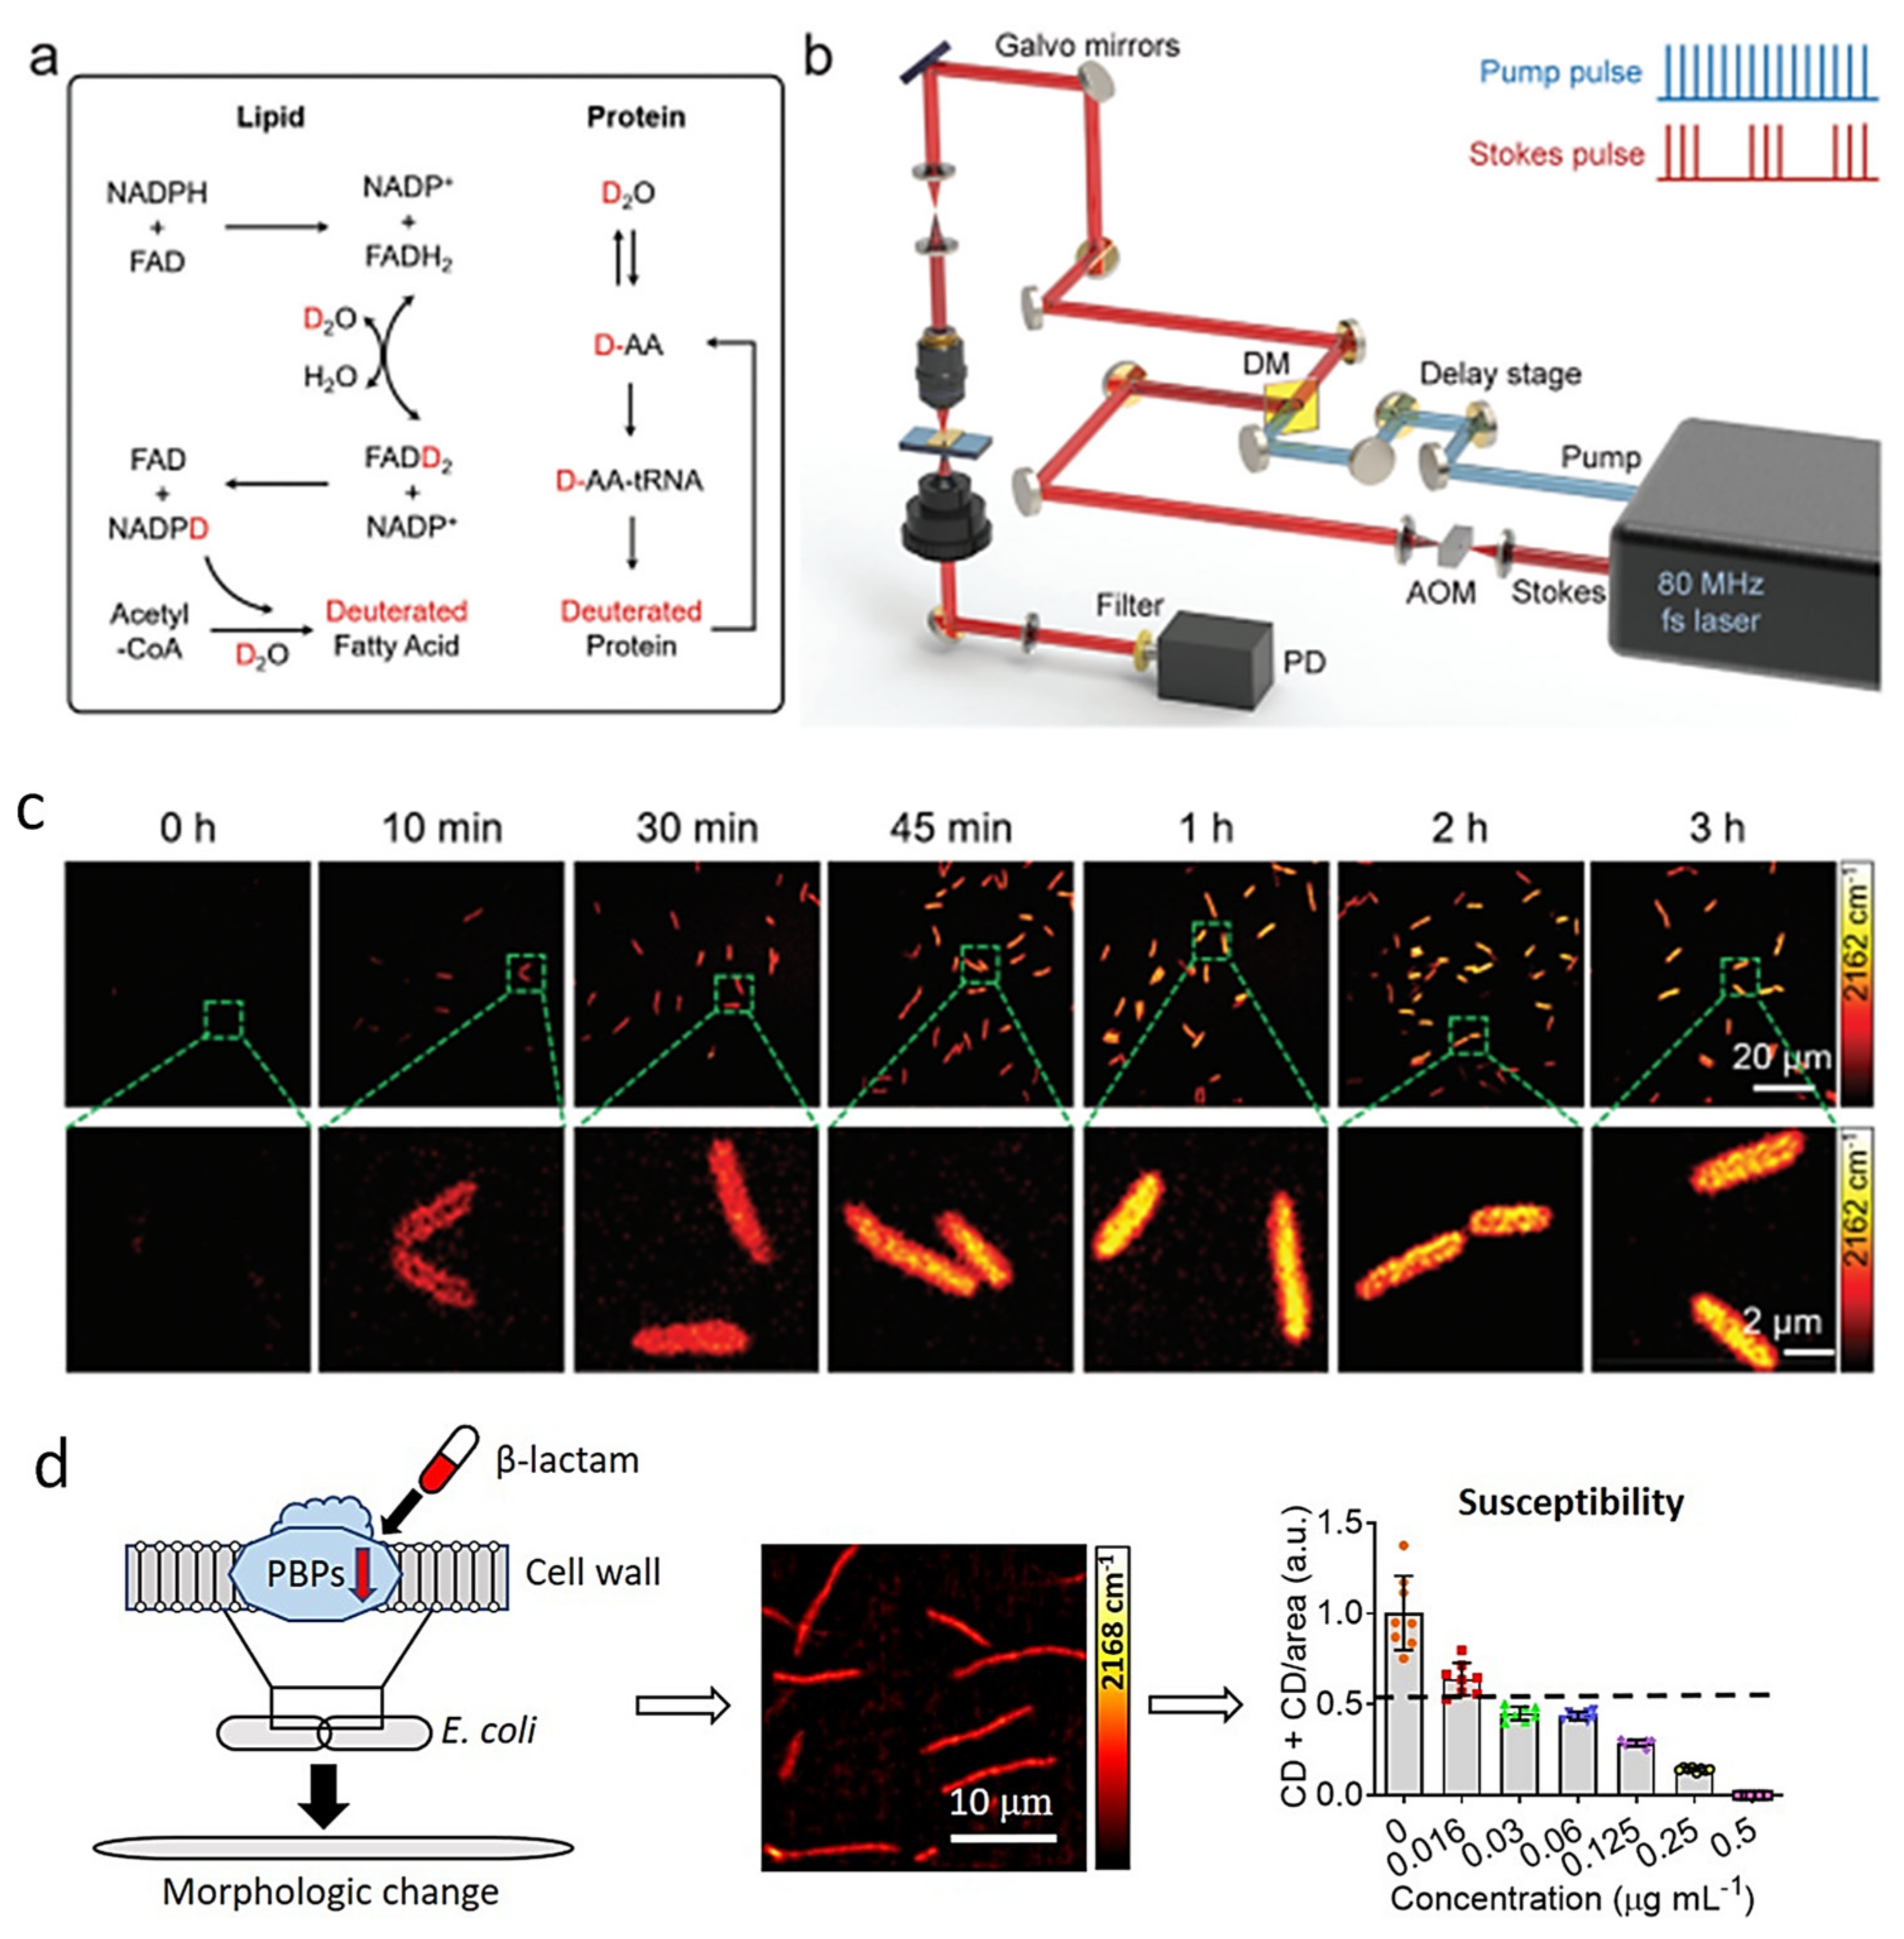
3.5. SRS and Deuterium Labeling Technique

CRS microscopy, including CARS and SRS microscopy, is an emerging molecular imaging technique with significant signal improvements over spontaneous Raman [85]. CRS microscopy has wide applications in biomedicine, including label-free imaging, drug molecular tracking, tumor detection, lipid quantitative analysis, molecular metabolism, and the mechanism of action of biological enzymes [85]. Compared with CARS, SRS does not have a non-resonance background. With the capabilities of high-speed chemical imaging and sub-micron resolution [86,87], SRS is also suitable for studying bacterial metabolism at the single-bacteria level.
SRS was first introduced in rapid AST by quantitatively measuring deuterated glucose metabolism in bacteria [20]. Glucose is the most common carbon source for most bacteria [88]; therefore, glucose metabolism can provide general information about the metabolic activities in bacteria. SRS can detect and quantify the formation of the C-D bond in bacteria after incubation with deuterated glucose. Importantly, this metabolic imaging method can determine the MIC of various bacteria, such as E. coli, K. pneumoniae, and S. aureus, as well as antibiotics with different antibacterial mechanisms [20]. In addition, this method was further demonstrated in a variety of bacteria–antibiotic combinations by tracing the incorporation of heavy water (D2O), even in clinically relevant environments (urine and blood). It was shown that SRS could detect the metabolic response of bacteria toward antibiotic treatment in a short incubation time (10 min) (Figure 8). Based on this, the single-cell metabolic inactivation concentration (SC-MIC), a parameter equivalent to the MIC in traditional broth microdilution, was obtained in 2.5 h. In a total of 37 sets of samples, including 8 major bacterial species and 14 different antibiotics, this method achieved a 94.6% categorical agreement [22].
In subsequent work, the SRS-D2O method was further demonstrated in 103 E. coli strains toward one antibiotic, cefotaxime. Since β-lactam antibiotics, to which cefotaxime belongs, cause the deformation of Gram-negative bacteria, a new AST evaluation index based on metabolism and morphology was established to improve the accuracy (Figure 8) [89]. With the two quantifiable markers, the new method achieved a 93.2% categorical agreement and a 93.2% essential agreement with the standard reference method.
Toward clinical translation, the SRS-based AST has been further demonstrated in urine and blood environments. Urine samples with E. coli and blood samples with P. aeruginosa were used for proof-of-concept demonstrations. The total detection time of bacterial AST in urine and blood was reduced to less than 3.5 h, in line with the need for rapid clinical testing [22]. Subsequently, a platform that combines MALDI-TOF MS and SRS demonstrated a rapid process for bacterial identification and AST directly from positive blood culture bottles (PBCB) [90]. This platform reduced bacterial identification and AST process to only 3.5 h, and it is the fastest to obtain identification and AST from PBCB.
In addition to being fast, the main advantages of SRS-based AST are universal and can be measured directly on clinical samples, including blood, urine, and sputum. In addition, compared to spontaneous Raman spectroscopy, SRS microscope can synchronously measure all bacteria within a field of view, thus having the prospect of high-throughput measurements. However, SRS instruments are more complex and expensive and therefore challenging to industrialize. In the future, cheaper and smaller fiber laser CARS could be an alternative to rapid AST. However, the non-resonant background signals in CARS are the main limitation that needs to be addressed with various technologies for the development of CARS.

4. Conclusions and Outlook

Rapid bacterial identification and AST are key components for the management of antibiotics, reducing the emergence of AMR, and finally saving the lives of infected patients. Many reviews have summarized various techniques for rapid microbial identification and AST development [23,24,25,26,27]. These technologies have contributed to the development of rapid microbial diagnosis to some extent. To better integrate rapid bacterial identification and AST into workflows, modifications must take into account, including turnaround time, ease of implementation, cost-effectiveness, and personnel availability. In addition, clinical needs, antibiotic management, experienced clinicians, and local AMR epidemiology should also be considered [91].
Many efforts have been dedicated to the development of bacterial identification and AST related to Raman spectroscopy, SERS, CRS, and Raman techniques based on the combination of stable isotopes and microfluidics. In addition, through multivariate data analysis models, more information can be extracted from complex Raman spectra. Since many types of Raman spectrometers have baseline shifts, the obtained spectrum usually contains the desired signal as well as unwanted elements, such as background noise. We have also summarized recent research on Raman spectroscopic data processing [38,92,93].
In order to optimize these technologies in the future, the following requirements and challenges must be considered: (1) increased understanding of the obtained Raman spectra de; (2) improved reproducibility of spectral data (such as SERS); (3) optimization of sample preparation processes and improved high-throughput detection; (4) miniaturization and automation of equipment, and reduced cost (such as pulsed lasers required by SRS); (5) new tolerance of microorganisms to isotopes (such as deuterium).
In this review, we introduced the application of Raman-based techniques in microbial identification and AST, including spontaneous Raman, SERS, and CRS. We then discussed recent developments in rapid identification and AST methods combined with Raman technology, as shown in Table 1 and Table 2. These Raman-based methods take shorter turnaround times than the culture-based methods and can play a key role in early clinical decision-making to treat microbial infections. Moreover, the application of Raman technologies can be further expanded in microbial identification and susceptibility detection by combining them with other technologies, such as fluorescence, microfluidics, and isotope labeling. Meanwhile, automated sample preparation and data acquisition will further facilitate the application of Raman-based techniques in microbial identification and AST.

Author Contributions

Conceptualization, W.Z., W.H. and P.W.; writing—original draft preparation, W.Z. and S.H.; writing—review and editing, W.Z., W.H. and P.W.; supervision, W.H. and P.W. All authors have read and agreed to the published version of the manuscript.

Funding

This research received no external funding.

Institutional Review Board Statement

Not applicable.

Informed Consent Statement

Not applicable.

Data Availability Statement

Not applicable.

Conflicts of Interest

The authors declare no conflict of interest.

References

  1. Abbasi, J. Rapid Test for Antibiotic Susceptibility. JAMA 2017, 318, 1314. [Google Scholar] [CrossRef]
  2. Behera, B.; Anil Vishnu, G.K.; Chatterjee, S.; Sitaramgupta, V.V.S.N.; Sreekumar, N.; Nagabhushan, A.; Rajendran, N.; Prathik, B.H.; Pandya, H.J. Emerging technologies for antibiotic susceptibility testing. Biosens. Bioelectron. 2019, 142, 111552. [Google Scholar] [CrossRef]
  3. Florio, W.; Morici, P.; Ghelardi, E.; Barnini, S.; Lupetti, A. Recent advances in the microbiological diagnosis of bloodstream infections. Crit. Rev. Microbiol. 2018, 44, 351–370. [Google Scholar] [CrossRef]
  4. van Belkum, A.; Burnham, C.-A.D.; Rossen, J.W.A.; Mallard, F.; Rochas, O.; Dunne, W.M. Innovative and rapid antimicrobial susceptibility testing systems. Nat. Rev. Microbiol. 2020, 18, 299–311. [Google Scholar] [CrossRef]
  5. Van Belkum, A.; Bachmann, T.T.; Lüdke, G.; Lisby, J.G.; Kahlmeter, G.; Mohess, A.; Becker, K.; Hays, J.P.; Woodford, N.; Mitsakakis, K.; et al. Developmental roadmap for antimicrobial susceptibility testing systems. Nat. Rev. Microbiol. 2019, 17, 51–62. [Google Scholar] [CrossRef] [Green Version]
  6. Dietvorst, J.; Vilaplana, L.; Uria, N.; Marco, M.-P.; Muñoz-Berbel, X. Current and near-future technologies for antibiotic susceptibility testing and resistant bacteria detection. TrAC Trends Anal. Chem. 2020, 127, 115891. [Google Scholar] [CrossRef]
  7. Syal, K.; Mo, M.; Yu, H.; Iriya, R.; Jing, W.; Guodong, S.; Wang, S.; Grys, T.E.; Haydel, S.E.; Tao, N. Current and emerging techniques for antibiotic susceptibility tests. Theranostics 2017, 7, 1795–1805. [Google Scholar] [CrossRef]
  8. Li, Y.; Yang, X.; Zhao, W. Emerging Microtechnologies and Automated Systems for Rapid Bacterial Identification and Antibiotic Susceptibility Testing. Transl. Life Sci. Innov. 2017, 22, 585–608. [Google Scholar] [CrossRef] [Green Version]
  9. Schimak, M.P.; Kleiner, M.; Wetzel, S.; Liebeke, M.; Dubilier, N.; Fuchs, B.M.; Liu, S.J. MiL-FISH: Multilabeled Oligonucleotides for FluorescenceIn SituHybridization Improve Visualization of Bacterial Cells. Appl. Environ. Microbiol. 2016, 82, 62–70. [Google Scholar] [CrossRef] [Green Version]
  10. Jayan, H.; Pu, H.; Sun, D.-W. Recent developments in Raman spectral analysis of microbial single cells: Techniques and applications. Crit. Rev. Food Sci. Nutr. 2021, 61, 2623–2639. [Google Scholar] [CrossRef]
  11. Lee, K.S.; Landry, Z.; Pereira, F.C.; Wagner, M.; Berry, D.; Huang, W.E.; Taylor, G.T.; Kneipp, J.; Popp, J.; Zhang, M.; et al. Raman microspectroscopy for microbiology. Nat. Rev. Methods Primers 2021, 1, 80. [Google Scholar] [CrossRef]
  12. Cui, S.; Zhang, S.; Yue, S. Raman Spectroscopy and Imaging for Cancer Diagnosis. J. Healthc. Eng. 2018, 2018, 8619342. [Google Scholar] [CrossRef] [PubMed]
  13. Ivleva, N.P.; Kubryk, P.; Niessner, R. Raman microspectroscopy, surface-enhanced Raman scattering microspectroscopy, and stable-isotope Raman microspectroscopy for biofilm characterization. Anal. Bioanal. Chem. 2017, 409, 4353–4375. [Google Scholar] [CrossRef] [PubMed]
  14. Ho, C.-S.; Jean, N.; Hogan, C.A.; Blackmon, L.; Jeffrey, S.S.; Holodniy, M.; Banaei, N.; Saleh, A.A.E.; Ermon, S.; Dionne, J. Rapid identification of pathogenic bacteria using Raman spectroscopy and deep learning. Nat. Commun. 2019, 10, 4927. [Google Scholar] [CrossRef]
  15. Li, J.; Wang, C.; Shi, L.; Shao, L.; Fu, P.; Wang, K.; Xiao, R.; Wang, S.; Gu, B. Rapid identification and antibiotic susceptibility test of pathogens in blood based on magnetic separation and surface-enhanced Raman scattering. Microchim. Acta 2019, 186, 475. [Google Scholar] [CrossRef]
  16. Dina, N.E.; Zhou, H.; Colniţă, A.; Leopold, N.; Szoke-Nagy, T.; Coman, C.; Haisch, C. Rapid single-cell detection and identification of pathogens by using surface-enhanced Raman spectroscopy. Analyst 2017, 142, 1782–1789. [Google Scholar] [CrossRef]
  17. Wang, Y.; Huang, W.E.; Cui, L.; Wagner, M. Single cell stable isotope probing in microbiology using Raman microspectroscopy. Curr. Opin. Biotechnol. 2016, 41, 34–42. [Google Scholar] [CrossRef] [Green Version]
  18. Tien, N.; Lin, T.-H.; Hung, Z.-C.; Lin, H.-S.; Wang, I.K.; Chen, H.-C.; Chang, C.-T. Diagnosis of Bacterial Pathogens in the Urine of Urinary-Tract-Infection Patients Using Surface-Enhanced Raman Spectroscopy. Molecules 2018, 23, 3374. [Google Scholar] [CrossRef] [Green Version]
  19. Liu, Y.; Xu, J.; Tao, Y.; Fang, T.; Du, W.; Ye, A. Rapid and accurate identification of marine microbes with single-cell Raman spectroscopy. Analyst 2020, 145, 3297–3305. [Google Scholar] [CrossRef]
  20. Hong, W.; Karanja, C.W.; Abutaleb, N.S.; Younis, W.; Zhang, X.; Seleem, M.N.; Cheng, J.-X. Antibiotic Susceptibility Determination within One Cell Cycle at Single-Bacterium Level by Stimulated Raman Metabolic Imaging. Anal. Chem. 2018, 90, 3737–3743. [Google Scholar] [CrossRef]
  21. Tao, Y.; Wang, Y.; Huang, S.; Zhu, P.; Huang, W.E.; Ling, J.; Xu, J. Metabolic-Activity-Based Assessment of Antimicrobial Effects by D2O-Labeled Single-Cell Raman Microspectroscopy. Anal. Chem. 2017, 89, 4108–4115. [Google Scholar] [CrossRef] [PubMed]
  22. Zhang, M.; Hong, W.; Abutaleb, N.S.; Li, J.; Dong, P.-T.; Zong, C.; Wang, P.; Seleem, M.N.; Cheng, J.-X. Rapid Determination of Antimicrobial Susceptibility by Stimulated Raman Scattering Imaging of D2O Metabolic Incorporation in a Single Bacterium. Adv. Sci. 2020, 7, 2001452. [Google Scholar] [CrossRef] [PubMed]
  23. Campbell, J.; McBeth, C.; Kalashnikov, M.; Boardman, A.K.; Sharon, A.; Sauer-Budge, A.F. Microfluidic advances in phenotypic antibiotic susceptibility testing. Biomed. Microdevices 2016, 18, 103. [Google Scholar] [CrossRef] [PubMed] [Green Version]
  24. Michael, R.J.; Jordan, D.C.; Daniel, D.R. Recent advances in rapid antimicrobial susceptibility testing systems. Expert Rev. Mol. Diagn. 2021, 21, 563–578. [Google Scholar] [CrossRef]
  25. Weis, C.V.; Jutzeler, C.R.; Borgwardt, K. Machine learning for microbial identification and antimicrobial susceptibility testing on MALDI-TOF mass spectra: A systematic review. Clin. Microbiol. Infect. 2020, 26, 1310–1317. [Google Scholar] [CrossRef]
  26. Kasas, S.; Malovichko, A.; Villalba, M.I.; Vela, M.E.; Yantorno, O.; Willaert, R.G. Nanomotion Detection-Based Rapid Antibiotic Susceptibility Testing. Antibiotics 2021, 10, 287. [Google Scholar] [CrossRef]
  27. Chen, C.; Hong, W. Recent Development of Rapid Antimicrobial Susceptibility Testing Methods through Metabolic Profiling of Bacteria. Antibiotics 2021, 10, 311. [Google Scholar] [CrossRef]
  28. Nguyen, H.T.M.; Zhang, Y.; Moy, A.J.; Feng, X.; Sebastian, K.R.; Reichenberg, J.S.; Fox, M.C.; Markey, M.K.; Tunnell, J.W. Characterization of Ex Vivo Nonmelanoma Skin Tissue Using Raman Spectroscopy. Photonics 2021, 8, 282. [Google Scholar] [CrossRef]
  29. Awad, F.; Wichmann, C.; Rösch, P.; Popp, J. Raman spectroscopy for the characterization of antimicrobial photodynamic therapy against Staphylococcus epidermidis. J. Raman Spectrosc. 2018, 49, 1907–1910. [Google Scholar] [CrossRef]
  30. Wang, J.; Lin, K.; Hu, H.; Qie, X.; Huang, W.E.; Cui, Z.; Gong, Y.; Song, Y. In Vitro Anticancer Drug Sensitivity Sensing through Single-Cell Raman Spectroscopy. Biosensors 2021, 11, 286. [Google Scholar] [CrossRef]
  31. Rebrošová, K.; Bernatová, S.; Šiler, M.; Uhlirova, M.; Samek, O.; Ježek, J.; Holá, V.; Růžička, F.; Zemanek, P. Raman spectroscopy—A tool for rapid differentiation among microbes causing urinary tract infections. Anal. Chim. Acta 2021, 1191, 339292. [Google Scholar] [CrossRef] [PubMed]
  32. Weng, S.; Hu, X.; Wang, J.; Tang, L.; Li, P.; Zheng, S.; Zheng, L.; Huang, L.; Xin, Z. Advanced Application of Raman Spectroscopy and Surface-Enhanced Raman Spectroscopy in Plant Disease Diagnostics: A Review. J. Agric. Food Chem. 2021, 69, 2950–2964. [Google Scholar] [CrossRef]
  33. Kloß, S.; Kampe, B.; Sachse, S.; Rösch, P.; Straube, E.; Pfister, W.; Kiehntopf, M.; Popp, J. Culture Independent Raman Spectroscopic Identification of Urinary Tract Infection Pathogens: A Proof of Principle Study. Anal. Chem. 2013, 85, 9610–9616. [Google Scholar] [CrossRef]
  34. Rebrošová, K.; Šiler, M.; Samek, O.; Růžička, F.; Bernatová, S.; Holá, V.; Ježek, J.; Zemánek, P.; Sokolová, J.; Petráš, P. Rapid identification of staphylococci by Raman spectroscopy. Sci. Rep. 2017, 7, 14846. [Google Scholar] [CrossRef] [Green Version]
  35. Yu, S.; Li, X.; Lu, W.; Li, H.; Fu, Y.V.; Liu, F. Analysis of Raman Spectra by Using Deep Learning Methods in the Identification of Marine Pathogens. Anal. Chem. 2021, 93, 11089–11098. [Google Scholar] [CrossRef]
  36. Yan, S.; Wang, S.; Qiu, J.; Li, M.; Li, D.; Xu, D.; Li, D.; Liu, Q. Raman spectroscopy combined with machine learning for rapid detection of food-borne pathogens at the single-cell level. Talanta 2021, 226, 122195. [Google Scholar] [CrossRef]
  37. Galvan, D.D.; Yu, Q. Surface-Enhanced Raman Scattering for Rapid Detection and Characterization of Antibiotic-Resistant Bacteria. Adv. Healthc. Mater. 2018, 7, 1701335. [Google Scholar] [CrossRef]
  38. Butler, H.J.; Ashton, L.; Bird, B.; Cinque, G.; Curtis, K.; Dorney, J.; Esmonde-White, K.; Fullwood, N.J.; Gardner, B.; Martin-Hirsch, P.L.; et al. Using Raman spectroscopy to characterize biological materials. Nat. Protoc. 2016, 11, 664–687. [Google Scholar] [CrossRef] [Green Version]
  39. Zhao, X.; Li, M.; Xu, Z. Detection of Foodborne Pathogens by Surface Enhanced Raman Spectroscopy. Front. Microbiol. 2018, 9, 1236. [Google Scholar] [CrossRef]
  40. Zhang, D.; Pu, H.; Huang, L.; Sun, D.-W. Advances in flexible surface-enhanced Raman scattering (SERS) substrates for nondestructive food detection: Fundamentals and recent applications. Trends Food Sci. Technol. 2021, 109, 690–701. [Google Scholar] [CrossRef]
  41. Jin, L.; Wang, S.; Shao, Q.; Cheng, Y. A rapid and facile analytical approach to detecting Salmonella Enteritidis with aptamer-based surface-enhanced Raman spectroscopy. Spectrochim. Acta Part A Mol. Biomol. Spectrosc. 2022, 267, 120625. [Google Scholar] [CrossRef] [PubMed]
  42. Bashir, S.; Nawaz, H.; Irfan Majeed, M.; Mohsin, M.; Nawaz, A.; Rashid, N.; Batool, F.; Akbar, S.; Abubakar, M.; Ahmad, S.; et al. Surface-enhanced Raman spectroscopy for the identification of tigecycline-resistant E. coli strains. Spectrochim. Acta Part A Mol. Biomol. Spectrosc. 2021, 258, 119831. [Google Scholar] [CrossRef] [PubMed]
  43. Liu, S.; Hu, Q.; Li, C.; Zhang, F.; Gu, H.; Wang, X.; Li, S.; Xue, L.; Madl, T.; Zhang, Y.; et al. Wide-Range, Rapid, and Specific Identification of Pathogenic Bacteria by Surface-Enhanced Raman Spectroscopy. ACS Sensors 2021, 6, 2911–2919. [Google Scholar] [CrossRef] [PubMed]
  44. Pu, H.; Xiao, W.; Sun, D.-W. SERS-microfluidic systems: A potential platform for rapid analysis of food contaminants. Trends Food Sci. Technol. 2017, 70, 114–126. [Google Scholar] [CrossRef]
  45. Fang, T.; Shang, W.; Liu, C.; Xu, J.; Zhao, D.; Liu, Y.; Ye, A. Nondestructive Identification and Accurate Isolation of Single Cells through a Chip with Raman Optical Tweezers. Anal. Chem. 2019, 91, 9932–9939. [Google Scholar] [CrossRef]
  46. Lee, K.S.; Palatinszky, M.; Pereira, F.C.; Nguyen, J.; Fernandez, V.I.; Mueller, A.J.; Menolascina, F.; Daims, H.; Berry, D.; Wagner, M.; et al. An automated Raman-based platform for the sorting of live cells by functional properties. Nat. Microbiol. 2019, 4, 1035–1048. [Google Scholar] [CrossRef] [Green Version]
  47. Xie, C.; Mace, J.; Dinno, M.A.; Li, Y.Q.; Tang, W.; Newton, R.J.; Gemperline, P.J. Identification of Single Bacterial Cells in Aqueous Solution Using Confocal Laser Tweezers Raman Spectroscopy. Anal. Chem. 2005, 77, 4390–4397. [Google Scholar] [CrossRef]
  48. Huang, W.E.; Ward, A.D.; Whiteley, A.S. Raman tweezers sorting of single microbial cells. Environ. Microbiol. Rep. 2009, 1, 44–49. [Google Scholar] [CrossRef]
  49. Lu, W.; Chen, X.; Wang, L.; Li, H.; Fu, Y.V. Combination of an Artificial Intelligence Approach and Laser Tweezers Raman Spectroscopy for Microbial Identification. Anal. Chem. 2020, 92, 6288–6296. [Google Scholar] [CrossRef]
  50. Zhang, C.; Zhang, D.; Cheng, J.X. Coherent Raman Scattering Microscopy in Biology and Medicine. Annu. Rev. Biomed. Eng. 2015, 17, 415–445. [Google Scholar] [CrossRef] [Green Version]
  51. Hong, W.; Liao, C.-S.; Zhao, H.; Younis, W.; Zhang, Y.; Seleem, M.N.; Cheng, J.-X. In situ Detection of a Single Bacterium in Complex Environment by Hyperspectral CARS Imaging. ChemistrySelect 2016, 1, 513–517. [Google Scholar] [CrossRef]
  52. Arora, R.; Petrov, G.I.; Yakovlev, V.V.; Scully, M.O. Detecting anthrax in the mail by coherent Raman microspectroscopy. Proc. Natl. Acad. Sci. USA 2012, 109, 1151. [Google Scholar] [CrossRef] [PubMed] [Green Version]
  53. Wu, M.Y.-C.; Hsu, M.-Y.; Chen, S.-J.; Hwang, D.-K.; Yen, T.-H.; Cheng, C.-M. Point-of-Care Detection Devices for Food Safety Monitoring: Proactive Disease Prevention. Trends Biotechnol. 2017, 35, 288–300. [Google Scholar] [CrossRef] [PubMed]
  54. Maquelin, K.; Choo-Smith, L.-P.i.; van Vreeswijk, T.; Endtz, H.P.; Smith, B.; Bennett, R.; Bruining, H.A.; Puppels, G.J. Raman Spectroscopic Method for Identification of Clinically Relevant Microorganisms Growing on Solid Culture Medium. Anal. Chem. 2000, 72, 12–19. [Google Scholar] [CrossRef]
  55. Zhang, C.; Aldana-Mendoza, J.A. Coherent Raman scattering microscopy for chemical imaging of biological systems. J. Phys. Photonics 2021, 3, 032002. [Google Scholar] [CrossRef]
  56. Azemtsop Matanfack, G.; Pistiki, A.; Rösch, P.; Popp, J. Raman Stable Isotope Probing of Bacteria in Visible and Deep UV-Ranges. Life 2021, 11, 1003. [Google Scholar] [CrossRef]
  57. Rousseau, A.N.; Faure, N.; Rol, F.; Sedaghat, Z.; Le Galudec, J.; Mallard, F.; Josso, Q. Fast Antibiotic Susceptibility Testing via Raman Microspectrometry on Single Bacteria: An MRSA Case Study. ACS Omega 2021, 6, 16273–16279. [Google Scholar] [CrossRef]
  58. Bauer, D.; Wieland, K.; Qiu, L.; Neumann-Cip, A.C.; Magistro, G.; Stief, C.; Wieser, A.; Haisch, C. Heteroresistant Bacteria Detected by an Extended Raman-Based Antibiotic Susceptibility Test. Anal. Chem. 2020, 92, 8722–8731. [Google Scholar] [CrossRef]
  59. Du, Y.; Han, D.; Liu, S.; Sun, X.; Ning, B.; Han, T.; Wang, J.; Gao, Z. Raman spectroscopy-based adversarial network combined with SVM for detection of foodborne pathogenic bacteria. Talanta 2022, 237, 122901. [Google Scholar] [CrossRef]
  60. Tahir, M.; Majeed, M.I.; Nawaz, H.; Ali, S.; Rashid, N.; Kashif, M.; Ashfaq, I.; Ahmad, W.; Ghauri, K.; Sattar, F.; et al. Raman spectroscopy for the analysis of different exo-polysaccharides produced by bacteria. Spectrochim. Acta Part A Mol. Biomol. Spectrosc. 2020, 237, 118408. [Google Scholar] [CrossRef]
  61. Kriem, L.S.; Wright, K.; Ccahuana-Vasquez, R.A.; Rupp, S. Confocal Raman microscopy to identify bacteria in oral subgingival biofilm models. PLoS ONE 2020, 15, e0232912. [Google Scholar] [CrossRef] [PubMed]
  62. Cheng, S.; Tu, Z.; Zheng, S.; Cheng, X.; Han, H.; Wang, C.; Xiao, R.; Gu, B. An efficient SERS platform for the ultrasensitive detection of Staphylococcus aureus and Listeria monocytogenes via wheat germ agglutinin-modified magnetic SERS substrate and streptavidin/aptamer co-functionalized SERS tags. Anal. Chim. Acta 2021, 1187, 339155. [Google Scholar] [CrossRef] [PubMed]
  63. Huang, W.E.; Griffiths, R.I.; Thompson, I.P.; Bailey, M.J.; Whiteley, A.S. Raman Microscopic Analysis of Single Microbial Cells. Anal. Chem. 2004, 76, 4452–4458. [Google Scholar] [CrossRef] [PubMed]
  64. Cui, L.; Yang, K.; Li, H.-Z.; Zhang, H.; Su, J.-Q.; Paraskevaidi, M.; Martin, F.L.; Ren, B.; Zhu, Y.-G. Functional Single-Cell Approach to Probing Nitrogen-Fixing Bacteria in Soil Communities by Resonance Raman Spectroscopy with 15N2 Labeling. Anal. Chem. 2018, 90, 5082–5089. [Google Scholar] [CrossRef]
  65. Karanja, C.W.; Hong, W.; Younis, W.; Eldesouky, H.E.; Seleem, M.N.; Cheng, J.-X. Stimulated Raman Imaging Reveals Aberrant Lipogenesis as a Metabolic Marker for Azole-Resistant Candida albicans. Anal. Chem. 2017, 89, 9822–9829. [Google Scholar] [CrossRef]
  66. Moritz, T.J.; Polage, C.R.; Taylor, D.S.; Krol, D.M.; Lane, S.M.; Chan, J.W. Evaluation of Escherichia coli cell response to antibiotic treatment by use of Raman spectroscopy with laser tweezers. J. Clin. Microbiol. 2010, 48, 4287–4290. [Google Scholar] [CrossRef] [Green Version]
  67. Teng, L.; Wang, X.; Wang, X.; Gou, H.; Ren, L.; Wang, T.; Wang, Y.; Ji, Y.; Huang, W.E.; Xu, J. Label-free, rapid and quantitative phenotyping of stress response in E. coli via ramanome. Sci. Rep. 2016, 6, 34359. [Google Scholar] [CrossRef] [Green Version]
  68. Yang, K.; Li, H.-Z.; Zhu, X.; Su, J.-Q.; Ren, B.; Zhu, Y.-G.; Cui, L. Rapid Antibiotic Susceptibility Testing of Pathogenic Bacteria Using Heavy-Water-Labeled Single-Cell Raman Spectroscopy in Clinical Samples. Anal. Chem. 2019, 91, 6296–6303. [Google Scholar] [CrossRef]
  69. Han, Y.-Y.; Lin, Y.-C.; Cheng, W.-C.; Lin, Y.-T.; Teng, L.-J.; Wang, J.-K.; Wang, Y.-L. Rapid antibiotic susceptibility testing of bacteria from patients’ blood via assaying bacterial metabolic response with surface-enhanced Raman spectroscopy. Sci. Rep. 2020, 10, 12538. [Google Scholar] [CrossRef]
  70. Mathey, R.; Dupoy, M.; Espagnon, I.; Leroux, D.; Mallard, F.; Novelli-Rousseau, A. Viability of 3h grown bacterial micro-colonies after direct Raman identification. J. Microbiol. Methods 2015, 109, 67–73. [Google Scholar] [CrossRef]
  71. Novelli-Rousseau, A.; Espagnon, I.; Filiputti, D.; Gal, O.; Douet, A.; Mallard, F.; Josso, Q. Culture-free Antibiotic-susceptibility Determination From Single-bacterium Raman Spectra. Sci. Rep. 2018, 8, 3957. [Google Scholar] [CrossRef] [PubMed] [Green Version]
  72. Germond, A.; Ichimura, T.; Horinouchi, T.; Fujita, H.; Furusawa, C.; Watanabe, T.M. Raman spectral signature reflects transcriptomic features of antibiotic resistance in Escherichia coli. Commun. Biol. 2018, 1, 85. [Google Scholar] [CrossRef] [PubMed]
  73. Wang, Y.; Xu, J.; Kong, L.; Liu, T.; Yi, L.; Wang, H.; Huang, W.E.; Zheng, C. Raman-deuterium isotope probing to study metabolic activities of single bacterial cells in human intestinal microbiota. Microb. Biotechnol. 2020, 13, 572–583. [Google Scholar] [CrossRef] [PubMed] [Green Version]
  74. Azemtsop Matanfack, G.; Taubert, M.; Guo, S.; Bocklitz, T.; Küsel, K.; Rösch, P.; Popp, J. Monitoring Deuterium Uptake in Single Bacterial Cells via Two-Dimensional Raman Correlation Spectroscopy. Anal. Chem. 2021, 93, 7714–7723. [Google Scholar] [CrossRef] [PubMed]
  75. Zhang, S.; Guo, L.; Yang, K.; Zhang, Y.; Ye, C.; Chen, S.; Yu, X.; Huang, W.E.; Cui, L. Induction of Escherichia coli Into a VBNC State by Continuous-Flow UVC and Subsequent Changes in Metabolic Activity at the Single-Cell Level. Front. Microbiol. 2018, 9, 2243. [Google Scholar] [CrossRef]
  76. Yi, X.; Song, Y.; Xu, X.; Peng, D.; Wang, J.; Qie, X.; Lin, K.; Yu, M.; Ge, M.; Wang, Y.; et al. Development of a Fast Raman-Assisted Antibiotic Susceptibility Test (FRAST) for the Antibiotic Resistance Analysis of Clinical Urine and Blood Samples. Anal. Chem. 2021, 93, 5098–5106. [Google Scholar] [CrossRef]
  77. Wang, P.; Sun, Y.; Li, X.; Wang, L.; Xu, Y.; He, L.; Li, G. Recent advances in dual recognition based surface enhanced Raman scattering for pathogenic bacteria detection: A review. Anal. Chim. Acta 2021, 1157, 338279. [Google Scholar] [CrossRef]
  78. Zhou, X.; Hu, Z.; Yang, D.; Xie, S.; Jiang, Z.; Niessner, R.; Haisch, C.; Zhou, H.; Sun, P. Bacteria Detection: From Powerful SERS to Its Advanced Compatible Techniques. Adv. Sci. 2020, 7, 2001739. [Google Scholar] [CrossRef]
  79. Kim, H.; Kim, Y.; Han, B.; Jang, J.-Y.; Kim, Y. Clinically Applicable Deep Learning Algorithm Using Quantitative Proteomic Data. J. Proteome Res. 2019, 18, 3195–3202. [Google Scholar] [CrossRef]
  80. Fu, S.; Wang, X.; Wang, T.; Li, Z.; Han, D.; Yu, C.; Yang, C.; Qu, H.; Chi, H.; Wang, Y.; et al. A sensitive and rapid bacterial antibiotic susceptibility test method by surface enhanced Raman spectroscopy. Braz. J. Microbiol. 2020, 51, 875–881. [Google Scholar] [CrossRef]
  81. Thrift, W.J.; Ronaghi, S.; Samad, M.; Wei, H.; Nguyen, D.G.; Cabuslay, A.S.; Groome, C.E.; Santiago, P.J.; Baldi, P.; Hochbaum, A.I.; et al. Deep Learning Analysis of Vibrational Spectra of Bacterial Lysate for Rapid Antimicrobial Susceptibility Testing. ACS Nano 2020, 14, 15336–15348. [Google Scholar] [CrossRef] [PubMed]
  82. Xia, L.; Li, G. Recent progress of microfluidics in surface-enhanced Raman spectroscopic analysis. J. Sep. Sci. 2021, 44, 1752–1768. [Google Scholar] [CrossRef] [PubMed]
  83. Yan, S.; Qiu, J.; Guo, L.; Li, D.; Xu, D.; Liu, Q. Development overview of Raman-activated cell sorting devoted to bacterial detection at single-cell level. Appl. Microbiol. Biotechnol. 2021, 105, 1315–1331. [Google Scholar] [CrossRef] [PubMed]
  84. Chang, K.-W.; Cheng, H.-W.; Shiue, J.; Wang, J.-K.; Wang, Y.-L.; Huang, N.-T. Antibiotic Susceptibility Test with Surface-Enhanced Raman Scattering in a Microfluidic System. Anal. Chem. 2019, 91, 10988–10995. [Google Scholar] [CrossRef] [PubMed]
  85. Cheng, J.X.; Xie, X.S. Vibrational spectroscopic imaging of living systems: An emerging platform for biology and medicine. Science 2015, 350, aaa8870. [Google Scholar] [CrossRef] [PubMed]
  86. Wang, P.; Liu, B.; Zhang, D.; Belew, M.Y.; Tissenbaum, H.A.; Cheng, J.X. Imaging lipid metabolism in live Caenorhabditis elegans using fingerprint vibrations. Angew. Chem. 2014, 126, 11981–11986. [Google Scholar] [CrossRef] [Green Version]
  87. Yue, S.; Li, J.; Lee, S.Y.; Lee, H.J.; Shao, T.; Song, B.; Cheng, L.; Masterson, T.A.; Liu, X.; Ratliff, T.L.; et al. Cholesteryl ester accumulation induced by PTEN loss and PI3K/AKT activation underlies human prostate cancer aggressiveness. Cell Metab. 2014, 19, 393–406. [Google Scholar] [CrossRef] [Green Version]
  88. Athamanolap, P.; Hsieh, K.; O’Keefe, C.M.; Zhang, Y.; Yang, S.; Wang, T.-H. Nanoarray Digital Polymerase Chain Reaction with High-Resolution Melt for Enabling Broad Bacteria Identification and Pheno–Molecular Antimicrobial Susceptibility Test. Anal. Chem. 2019, 91, 12784–12792. [Google Scholar] [CrossRef]
  89. Zhang, W.; Li, Y.; Yao, L.; Wu, F.; Chen, C.; Zhou, L.; Zheng, B.; Wang, P.; Hong, W. Rapid antimicrobial susceptibility testing by stimulated Raman scattering metabolic imaging and morphological deformation of bacteria. Anal. Chim. Acta 2021, 1168, 338622. [Google Scholar] [CrossRef]
  90. Sun, B.; Kang, X.; Yue, S.; Lan, L.; Li, R.; Chen, C.; Zhang, W.; He, S.; Zhang, C.; Fan, Y.; et al. A rapid procedure for bacterial identification and antimicrobial susceptibility testing directly from positive blood cultures. Analyst 2022, 147, 147–154. [Google Scholar] [CrossRef]
  91. Dubourg, G.; Lamy, B.; Ruimy, R. Rapid phenotypic methods to improve the diagnosis of bacterial bloodstream infections: Meeting the challenge to reduce the time to result. Clin. Microbiol. Infect. 2018, 24, 935–943. [Google Scholar] [CrossRef] [PubMed] [Green Version]
  92. He, S.; Zhang, W.; Liu, L.; Huang, Y.; He, J.; Xie, W.; Wu, P.; Du, C. Baseline correction for Raman spectra using an improved asymmetric least squares method. Anal. Methods 2014, 6, 4402–4407. [Google Scholar] [CrossRef]
  93. Korepanov, V.I. Asymmetric least-squares baseline algorithm with peak screening for automatic processing of the Raman spectra. J. Raman Spectrosc. 2020, 51, 2061–2065. [Google Scholar] [CrossRef]
Figure 1. Physical principles of Raman-based techniques. (a) Energy level diagrams representing the generation of emission signals. For spontaneous Raman scattering, the molecule is excited to a virtual energy state. It then returns to a lower energy level, accompanied by light scattering, which usually relies on Stokes Raman scattering. CRS, including SRS and CARS, is a nonlinear optical process based on the interaction between pump and Stokes lasers. (b) Mechanisms for SERS. SERS relies on electromagnetic and chemical enhancements, increasing Raman signal intensities by up to 108–1014 orders of magnitude. Ωp, pump beam; ωs, Stokes beam; ωas, anti-Stokes beam; Ω, Raman-active molecular vibration (adapted and reproduced from reference [11,13]).
Photonics 09 00133 g001
Figure 2. Rapid identification of bacteria by Raman spectroscopy and deep learning. (a) Bacteria deposited onto 200 nm gold-coated silica substrates for Raman spectroscopy. Scale bar: 1 μm. (b) Conceptual measurement schematic: by focusing the excitation laser source to diffraction-limited spot size, Raman signal from single cells was acquired. (c) A one-dimensional residual network with 25 convolution layers was used to classify bacteria from low-signal Raman spectra. (d) The mean values of 2000 Raman spectra from 30 isolates are shown in bold and superimposed on a representative single spectrum of noise for each isolate. Reprinted from reference [14] with permission.
Photonics 09 00133 g002
Figure 3. Rapid identification of bacteria by Raman spectroscopy and machine learning. Prediction results of independent test sets through 4-level KPCA-DT classification model. KPCA-DT Kernel principal component analysis decision tree. Reprinted from reference [36] with permission.
Photonics 09 00133 g003
Figure 4. SERS for the identification of tigecycline-resistant E. coli strains. Schematic illustration of SERS combined with discriminant analysis technique showing: (a) synthesis of AgNPs; (b) bacteria culture and sample preparation; (c) date acquisition with a 785 nm laser as an excitation source. Reprinted from reference [42] with permission.
Photonics 09 00133 g004
Figure 5. Combination of an Artificial Intelligence Approach and LTRS for Microbial Identification. (a) Schematic Scheme of the single-cell LTRS setup. (b) The microbial cells were imaged by the confocal microscope in the LTRS. (c) Results of prediction of 14 microbial species achieved by the ConvNet taxonomic model. Reprinted from reference [49] with permission.
Photonics 09 00133 g005
Figure 6. In situ detection of single bacteria in complex environments by hyperspectral CARS imaging. (a) Hyperspectral CARS image of concentrated E. coli culture liquid dropped on glass. (b) Corresponding hyperspectral CARS profiles of E. coli and glass background. (c) CARS image after phase retrieval. (d) Corresponding phase-retrieved CARS spectra of E. coli and glass background. Scale bar: 5 µm. Reprinted from reference [51] with permission.
Photonics 09 00133 g006
Figure 7. Rapid AST by Raman spectroscopy and SERS. (a) Rapid AST of MRSA by Raman spectroscopy with LDA. (b) Deep learning and SERS spectra of bacterial lysate for rapid AST. MRSA, methicillin-resistant Staphylococcus aureus; LDA, linear discriminant analysis. Reprinted from reference [57,81] with permission.
Photonics 09 00133 g007
Figure 8. SRS imaging of D2O metabolic incorporation for rapid AST. (a) Scheme for D2O labeling of lipid and protein. (b) SRS imaging setup. (c) Time-lapse SRS imaging of P. aeruginosa after culture in D2O-containing medium. (d) A new evaluation method by SRS metabolic imaging and morphological deformation of E. coli that treated with a β-lactam antibiotic for rapid AST. Penicillin-binding proteins (PBPs). Reprinted from reference [22,89] with permission.
Photonics 09 00133 g008
Table 1. Comparison of Raman-based bacterial identification methods.
Identification TechniqueMechanismTime of Sample PreparationTime for TestMeasurements SpecificationDirect on Clinical SampleSensitivityReference
Raman spectroscopy and machine learningSpectral difference15 min for centrifugation6 and 30 s for single cellCW laser; 532 nm for exciation (7 mW)Yes/UrineSingle cell[33]
24 h for preculture15 s for a colonyCW laser; 785 nm for exciationNoColony[34]
12 h for preculture and 1 h for dry1 s for single cellCW laser; 633 nm for exciation (13.17 mW)NoSingle cell[14]
several hours to growth phases6 and 10 s for single cellCW laser; 532 nm for exaction (5 mW)NoSingle cell[36]
Laser tweezers Raman spectroscopySpectral differenceOvernight30 s for single cellCW laser; 514.5 nm for exciation (9 mW) and 1064 nm for trap (5 mW)NoSingle cell[48]
About several hours60–90 sCW laser; 785 nm (16 mW/μm2)NoSingle cell[49]
SERSSpectral difference24 h for culture and 20 min for inculation20 s for sampleCW laser; 785 nm (120 mW)NoSeveral bacteria[42]
Overnight and 30 min for centrifugation10 s for single bacteriaCW laser; 532 nm (0.2 mW) or 633 nm (0.17 mW) for exciationNoSeveral bacteria[16]
12 h for culture and 50 min for inculation5 s for single bacteriaCW laser; 633 nm for exciation (0.5 mW)NoSeveral bacteria[43]
CARSHyperspectral imageabout 15 min1–2 minPulse laser; 780 nm (~80 mW) as the pump beam and 1030 nm (~250 mW) as the Stokes beamYes/urineSingle cell[51]
Table 2. Comparison of Raman-based AST methods.
AST
Technology
MechanismTime of Sample PreparationTime to ResultDirect on Clinical SamplesSensitivityReal MICReference
Raman spectroscopyChange of Raman spectra2 h for culture4 hNoSingle cellNo[57]
24 h for culture4–15 hNoSingle colonyNo[66]
Raman spectroscopy and deuterium labelingQuantify deuterium incorporationOvernight-culture in D2OAt least 40 minNoSingle cellNo[21]
15 min for filtration2.5 h from urineYes/urineSingle cellNo[68]
2.5 h for culture3 h from urine and 21 h from bloodYes/urine and bloodSingle cellNo[76]
SERS-basedChange of spectra10 h for culture2 h antibiotic treatmentNoSeveral bacteriaYes[80]
24 h incubate and 18 h for culture30 min antibiotic exposure and 1 h for testNoSeveral bacteriaYes[81]
16–18 h incubate and 2 h for cultureAbout 2.5 hNoSeveral bacteriaYes[84]
SRS and deuterium labelingQuantify deuterium incorporation2 h for precultureAt least 0.5 h from cultures in log phaseNoSingle cellYes[20]
15 min for centrifugation and filtration2.5 h from isolates, urine, or bloodYes/urine and bloodSingle cellYes[22]
2–3 h to log phase3 h from isolatesNoSingle cellYes[89]
Overnight3 h from isolatesYes/ bloodSingle cellYes[90]
Publisher’s Note: MDPI stays neutral with regard to jurisdictional claims in published maps and institutional affiliations.

