Fast Estimation of the Spectral Optical Properties of Rabbit Pancreas and Pigment Content Analysis


 and
and 
Abstract
1. Introduction
2. Materials and Methods
2.1. Tissue Collection and Preparation
2.2. Spectral Measurements
2.3. Calculations
- (a)
- (b)
- (c)
- (d)
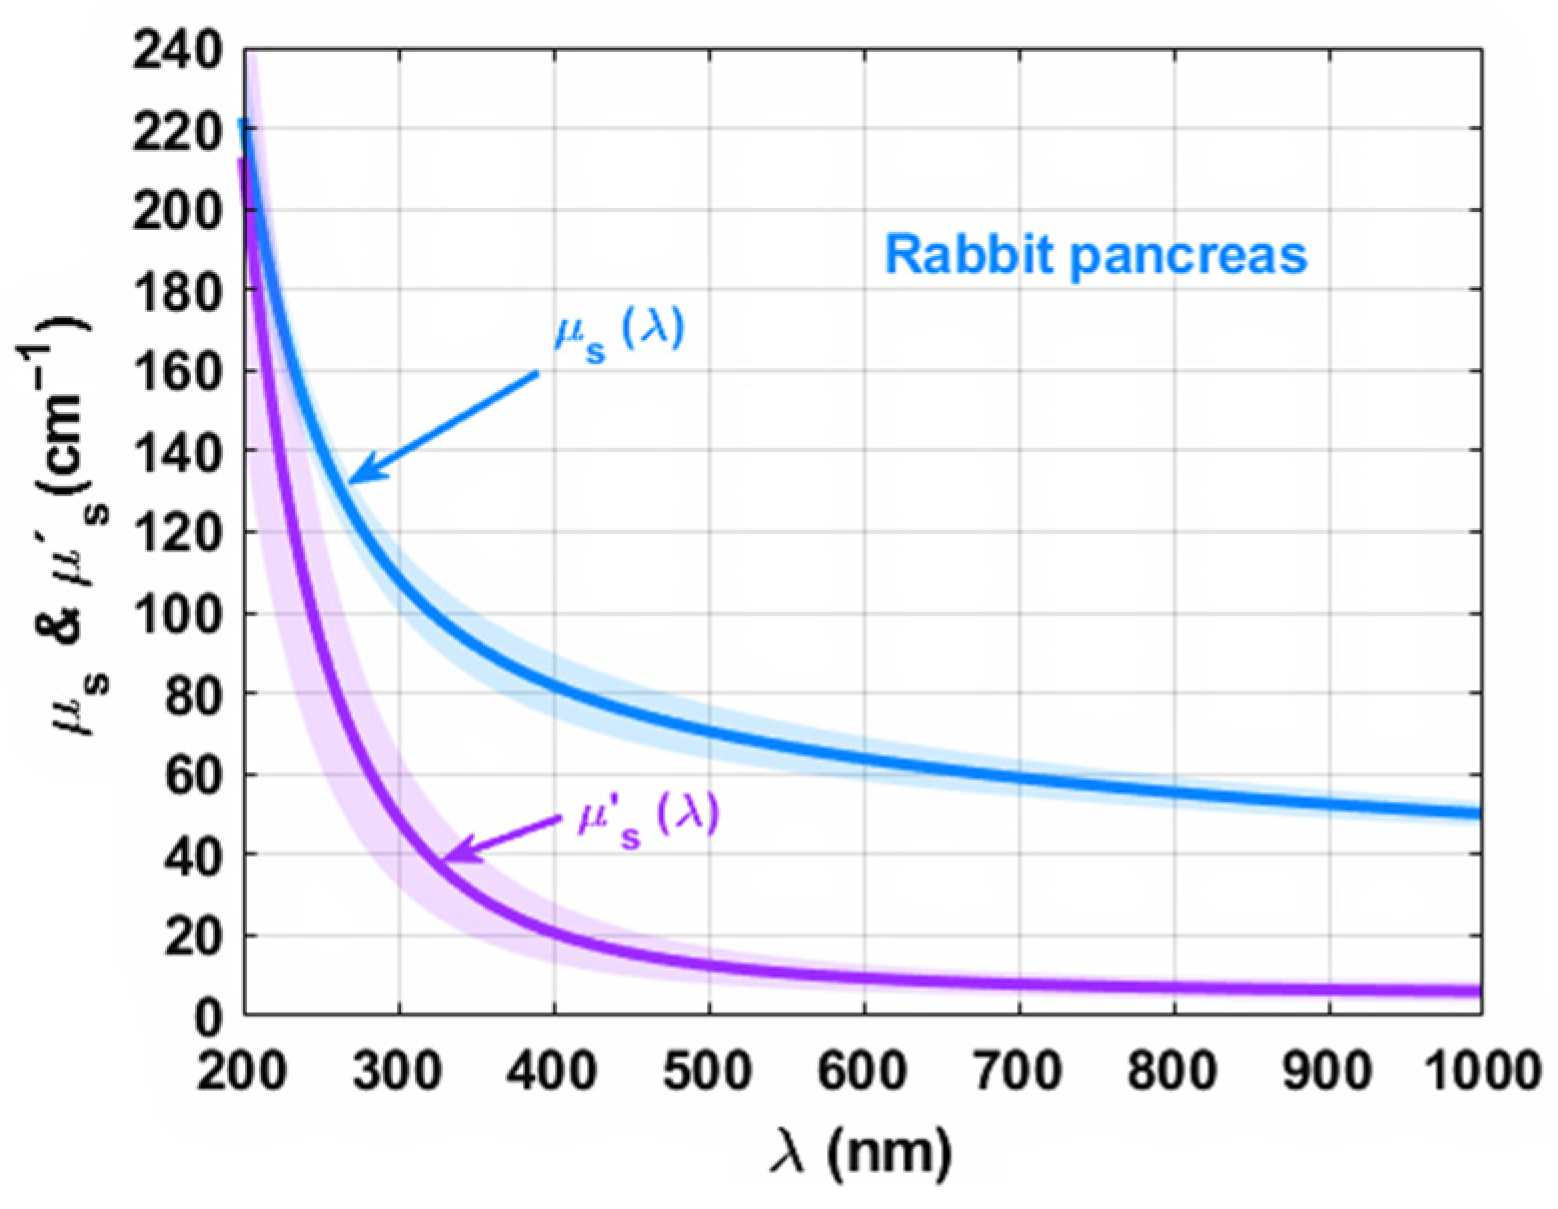
- Regarding μ′s there is no mathematical relation to calculate it directly from spectral measurements, but its λ-dependence is well described by a combination of the Rayleigh and Mie scattering regimes, as described by Equation (5) [32]. This way, 10 sets of inverse adding-doubling (AD) [33] simulations were made at every 50 nm between 200 and 1000 nm. Such simulations were performed with the code available at the website of the Oregon Medical Laser Centre [34]. As a result of these simulations, 10 curves described by Equation (5) were calculated to fit the various sets of generated μ′s values. The mean and SD of these curves were calculated;
- (e)
- (f)
3. Results
4. Conclusions
Author Contributions
Funding
Institutional Review Board Statement
Informed Consent Statement
Data Availability Statement
Conflicts of Interest
References
- Voss, A.; Feller, K.-H.; Beckman, D. Instruments in biotechnology and medicine. In Handbook of Biophotonics, 1st ed.; Popp, J., Tuchin, V.V., Chiou, A., Heinemann, S.H., Eds.; Wiley-VCH Verlag GmbH & Co. KGaA: Darmstadt, Germany, 2012; pp. 345–488. [Google Scholar]
- Oliveira, L.M.; Zaytsev, K.I.; Tuchin, V.V. Improved biomedical imaging over a wide spectral range from UV to THz towards multimodality. In Proceedings of the Third International Conference on Biophotonics Riga 2020, Riga, Latvia, 24–25 August 2020; Spigulis, J., Ed.; SPIE: Bellingham, WA, USA, 2020; Volume 11585, p. 11585. [Google Scholar]
- Oliveira, L.M.; Tuchin, V.V. The Optical Clearing Method—A New Tool for Clinical Practice and Biomedical Engineering; Springer: Cham, Switzerland, 2019; pp. 1–106. [Google Scholar]
- Tuchin, V.V. Tissue Optics: Light Scattering Methods and Instruments for Medical Diagnostics, 3rd ed.; SPIE Press: Bellingham, WA, USA, 2015; pp. 245–358. [Google Scholar]
- Mobley, J.; Vo-Dinh, T.; Tuchin, V.V. Optical properties of Tissue. In The Biomedical Photonics Handbook, 2nd ed.; Vo-Dihn, T., Ed.; CRC Press: Boca Raton, FL, USA, 2019; Volume 1, pp. 23–122. [Google Scholar]
- Carvalho, S.; Carneiro, I.; Henrique, R.; Tuchin, V.V.; Oliveira, L. Lipofuscin-type pigment as a marker of colorectal cancer. Electronics 2020, 9, 1805. [Google Scholar] [CrossRef]
- Bashkatov, A.N.; Genina, E.A.; Tuchin, V.V. Optical properties of skin, subcutaneous and muscle tissues: A review. J. Innov. Opt. Health Sci. 2011, 4, 9–38. [Google Scholar] [CrossRef]
- Bashkatov, A.N.; Genina, E.A.; Kochubey, V.I.; Gavrilova, A.A.; Kapralov, S.V.; Grishaev, V.A.; Tuchin, V.V. Optical properties of human stomach mucosa in the spectral range from 400 to 2000 nm: Prognosis for gastroenterology. Med. Laser Appl. 2007, 22, 95–104. [Google Scholar] [CrossRef]
- Yariv, I.; Rahamim, G.; Shlieselberg, E.; Duadi, H.; Lipovsky, A.; Lubart, R.; Fixler, D. Detecting nanoparticles in tissue using optical iterative technique. Biomed. Opt. Express 2014, 5, 3871–3881. [Google Scholar] [CrossRef]
- Bashkatov, A.N.; Genina, E.A.; Kochubey, V.I.; Tuchin, V.V. Optical properties of human sclera in spectral range 370–2500 nm. Opt. Spectrosc. 2010, 109, 197–204. [Google Scholar] [CrossRef]
- Bashkatov, A.N.; Genina, E.A.; Kozintseva, M.D.; Kochubey, V.I.; Gorofkov, S.Y.; Tuchin, V.V. Optical Properties of peritoneal biological tissues in the spectral range 350–2500 nm. Opt. Spectrosc. 2016, 120, 1–8. [Google Scholar] [CrossRef]
- Bashkatov, A.N.; Genina, E.A.; Kochubey, V.I.; Rubtsov, V.S.; Kolesnikova, E.A.; Tuchin, V.V. Optical properties of human colon tissues in the 350–2500 spectral range. Quant. Electron. 2014, 44, 779–784. [Google Scholar] [CrossRef]
- Bashkatov, A.N.; Genina, E.A.; Kochubey, V.I.; Tuchin, V.V. Optical properties of human skin, subcutaneous and mucous tissues in the wavelength range from 400 to 2000 nm. J. Phys. D Appl. Phys. 2005, 38, 2543–2555. [Google Scholar] [CrossRef]
- Martins, I.S.D. Caracterização das Propriedades Óticas do Pâncreas e Estudo da Difusão da Glicerina no seu Interior. Master’s Thesis, Polytechnic of Porto—School of Engineering, Porto, Portugal, 30 June 2021. [Google Scholar]
- Carvalho, S.; Gueiral, N.; Nogueira, E.; Henrique, R.; Oliveira, L.; Tuchin, V.V. Comparative study of colon mucosa and colon precancerous polyps between 400 and 1000 nm. In Proceedings of the BIOS-Photonics West 2017: Dynamics and Fluctuations in Biomedical Photonics, San Francisco, CA, USA, 28 January–2 February 2017; Tuchin, V.V., Larin, K.V., Leahy, M.J., Wang, R.K., Eds.; SPIE: Bellingham, WA, USA, 2017; Volume 10063, p. 100631L. [Google Scholar]
- Yanina, I.Y.; Lazareva, E.N.; Tuchin, V.V. Refractive index of adipose and lipid droplet measured in wide spectral and temperature ranges. Appl. Opt. 2018, 57, 4839. [Google Scholar] [CrossRef]
- Bashkatov, A.N.; Genina, E.A.; Kochubey, V.I.; Tuchin, V.V. Optical properties of human cranial bone in the spectral range from 800 to 2000 nm. In Proceedings of the Saratov Fall Meeting 2005: Optical Technologies in Biophysics and Medicine VII, Saratov, Russia, 27–30 September 2005; Volume 6163, p. 616310. [Google Scholar]
- Fernandes, L.; Carvalho, S.; Henrique, R.; Tuchin, V.V.; Oliveira, H.; Oliveira, L.M. Diffuse reflectance and machine learning techniques to differentiate colorectal cancer ex vivo. Chaos 2021, 31, 053118. [Google Scholar] [CrossRef]
- Carneiro, I.; Carvalho, S.; Henrique, R.; Oliveira, L.M.; Tuchin, V.V. Optical properties of colorectal muscle in visible/NIR range. In Proceedings of the Photonics Europe: Photonic Solutions for Better Health Care VI 2018, Strasbourg, France, 22–26 April 2018; Popp, J., Tuchin, V.V., Pavone, F.S., Eds.; SPIE: Bellingham, WA, USA, 2018; Volume 10685, p. 106853D. [Google Scholar]
- Carneiro, I.; Carvalho, S.; Henrique, R.; Oliveira, L.; Tuchin, V.V. Measuring optical properties of human liver between 400 and 1000 nm, Quant. Electron. 2019, 49, 13–19. [Google Scholar]
- Carneiro, I.; Carvalho, S.; Henrique, R.; Oliveira, L.; Tuchin, V.V. Measurement of optical properties of normal and pathological human liver tissue from deep-UV to NIR. In Proceedings of the Photonics Europe: Tissue Optics and Photonics, Online Conference, 2 April 2020; Tuchin, V.V., Blondel, W., Zalevsky, Z., Eds.; SPIE: Bellingham, WA, USA, 2020; Volume 11363, p. 113630G. [Google Scholar]
- Lewis, B.; Mao, J. Development of the pancreas and related structures. In The Pancreas: An Integrated Textbook of Basic Science, Medicine and Surgery; Berger, H.G., Warshaw, A.L., Hruban, R.H., Büchler, M.W., Lerch, M.M., Neoptolemos, J.P., Shimosegawa, T., Whitcomb, D.C., Groβ, C., Eds.; John Wiley & Sons Ltd.: Chichester, UK, 2018; pp. 3–9. [Google Scholar]
- Klein, A.P. Pancreatic cancer: A growing burden. Lancet Gastroenterol. Hepatol. 2019, 4, 895–896. [Google Scholar] [CrossRef]
- Mohammed, S.; van Buren, G.; Fisher, W.E. Pancreatic cancer: Advances in treatment. World J. Gastroenterol. 2014, 20, 9354–9360. [Google Scholar] [PubMed]
- Ryan, D.P.; Hong, T.S.; Bardeesy, N. Pancreatic adenocarcinoma. N. Engl. J. Med. 2014, 371, 1039–1049. [Google Scholar] [CrossRef] [PubMed]
- Bosman, F.T.; Carneiro, F.; Hruban, R.H.; Theise, N.D. WHO classification of tumours of the digestive system; World Health Organization Press: Geneva, Switzerland, 2010; pp. 279–403. [Google Scholar]
- Timoshina, P.A.; Bucharskaya, A.B.; Alexandrov, D.A.; Tuchin, V.V. Study of blood microcirculation of pancreas in rats with alloxan diabetes. J. Biomed. Phot. Eng. 2017, 3, 020301. [Google Scholar] [CrossRef]
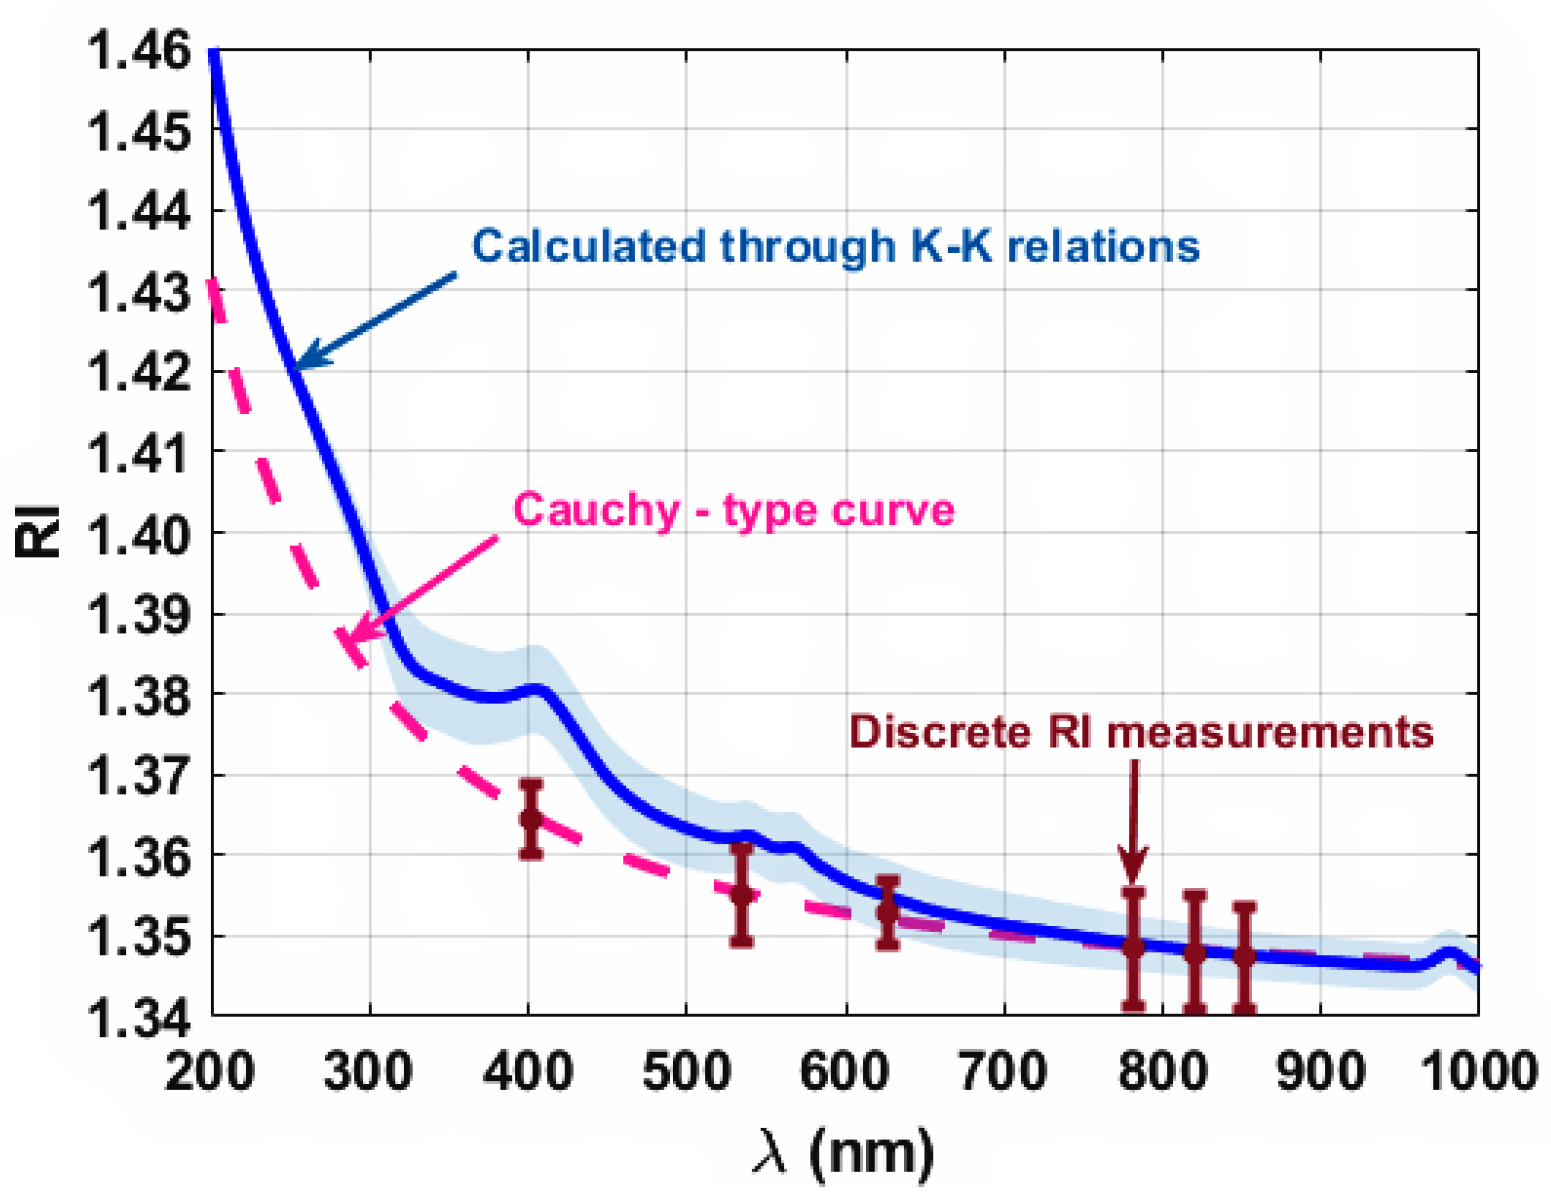
- Martins, I.; Silva, H.; Tuchin, V.V.; Oliveira, L. Estimation of rabbit pancreas dispersion between 400 and 1000 nm. J. Biomed. Phot. Eng. 2021, 7, 020303. [Google Scholar] [CrossRef]
- Gonçalves, T.M.; Martins, I.S.; Silva, H.F.; Tuchin, V.V.; Oliveira, L.M. Spectral optical properties of rabbit brain cortex between 200 and 1000 nm. Photochem 2021, 1, 190–208. [Google Scholar] [CrossRef]
- Sydoruk, O.; Zhernovaya, O.; Tuchin, V.V.; Douplik, A. Refractive index of solutions of human hemoglobin from the near-infrared to the ultraviolet range: Kramers-Kronig analysis. J. Biomed. Opt. 2012, 17, 115002. [Google Scholar] [CrossRef]
- Gienger, J.; Groβ, H.; Newkammer, J.; Bär, M. Determining the refractive index of human hemoglobin solutions by Kramers-Kronig relations with an improved absorption model. Appl. Opt. 2016, 55, 8951–8961. [Google Scholar] [CrossRef]
- Jacques, S.L. Optical properties of biological tissues: A review. Phys. Med. Biol. 2013, 58, R37–R61. [Google Scholar] [CrossRef]
- Prahl, S.A.; van Gemert, M.J.C.; Welch, A.J. Determining the optical properties of turbid media by using the adding-doubling method. Appl. Opt. 1993, 32, 559–568. [Google Scholar] [CrossRef] [PubMed]
- Optics Software—Oregon Medical Laser Centre. Available online: https://omlc.org/software/ (accessed on 11 January 2022).
- Fasman, G.D. Ultraviolet spectra of derivatives of cysteine, cysteine, histidine, phenylalanine, tyrosine, and tryptophan. In Handbook of Biochemistry and Molecular Biology, 3rd ed.; Fasman, G.D., Ed.; CRC Press: Boca Raton, FL, USA, 2018; pp. 192–199. [Google Scholar]
- Wetlaufer, D.B. Ultraviolet spectra of proteins and amino acids. In Advances in Protein Chemistry; Afinsen, C.B., Jr., Anson, M.L., Bailey, K., Edsall, J.T., Eds.; Academic Press: London, UK, 1962; pp. 303–390. [Google Scholar]
- Zhou, Y.; Yao, J.; Wang, L.V. Tutorial on photoacoustic tomography. J. Biomed. Opt. 2016, 21, 061007. [Google Scholar] [CrossRef] [PubMed]
- Oliveira, L.; Tuchin, V.V. Optical clearing for cancer diagnostics and monitoring. In Handbook of Tissue Clearing: New Prospects in Optical Imaging; Tuchin, V.V., Zhu, D., Genina, E.A., Eds.; CRC Press: London, UK, 2022; pp. 597–606. [Google Scholar]
- Tuchin, V.V. Optical Clearing of Tissues and Blood; SPIE Press: Bellingham, WA, USA, 2005. [Google Scholar]
- Carneiro, I.; Carvalho, S.; Henrique, R.; Selifonov, A.; Oliveira, L.; Tuchin, V.V. Enhanced ultraviolet spectroscopy by optical clearing for biomedical applications. IEEE J. Sel. Top. Quant. Elect. 2021, 27, 7200108. [Google Scholar] [CrossRef]
- Genina, E.A.; Oliveira, L.M.C.; Bashkatov, A.N.; Tuchin, V.V. Optical clearing of biological tissues: Prospects of application for multimodal malignancy diagnostics. In Multimodal Optical Diagnostics of Cancer; Tuchin, V.V., Popp, J., Zakharov, V., Eds.; Springer Nature: Cham, Switzerland, 2020; pp. 107–131. [Google Scholar]
- Gomes, N.M.; Tuchin, V.V.; Oliveira, L.M. Refractive index matching efficiency in colorectal mucosa treated with glycerol. IEEE J. Sel. Top. Quant. Elect. 2021, 27, 7200808. [Google Scholar] [CrossRef]
- Oliveira, L.; Lage, A.; Pais Clemente, M.; Tuchin, V.V. Concentration dependence of the optical clearing effect created in muscle immersed in glycerol and ethylene glycol. In Proceedings of the Saratov Fall Meeting 2006: Optical Technologies in Biophysics and Medicine VIII, Saratov, Russian, 26–29 September; Tuchin, V.V., Ed.; SPIE: Bellingham, WA, USA, 2006; Volume 6535, p. 653511. [Google Scholar]
- Gomes, N.; Tuchin, V.V.; Oliveira, L. UV-NIR efficiency of the refractive index matching mechanism on colorectal muscle during treatment with different glycerol osmolarities. J. Biomed. Phot. Eng. 2020, 6, 020307. [Google Scholar] [CrossRef]
- Tuchin, V.V.; Oliveira, L. Recent progress in tissue enhanced spectroscopy for cancer detection. Asian J. Phys. 2021, 30, 427–444. [Google Scholar]
- Hunter, J.J.; Moran, J.I.W.; Merigan, W.H.; Sliney, D.H.; Sparrow, J.R.; Williams, D.R. The susceptibility of the retina to photochemical damage from visible light. Progr. Retinal Eye Res. 2012, 31, 28–42. [Google Scholar] [CrossRef]
- Gosnell, M.E.; Anwer, A.G.; Cassano, J.C.; Sue, C.M.; Goldys, E.M. Functional hyperspectral imaging captures subtle details of cell metabolism in olfactory neurosphere cells, disease-specific models of neurodegenerative disorders. Biochim. Biophys. Acta Mol. Cell Res. 2016, 1863, 56–63. [Google Scholar] [CrossRef]
- Freeney-Burns, L.; Hilderbrand, E.S.; Eldridge, S. Aging human RPE: Morphometric analysis of macular, equatorial, and peripheral cells. Investig. Ophtalmol. Vis. Sci. 1984, 25, 195–200. [Google Scholar]
- Zonios, G.; Dimou, A.; Bassukas, I.; Galaris, D.; Tsolakidis, A.; Kaxiras, E. Melanin absorption spectroscopy: New method for noninvasive skin investigation and melanoma detection. J. Biomed. Opt. 2008, 13, 014017. [Google Scholar] [CrossRef]
- Różanowska, M.B.; Pawlak, A.; Różanowski, B. Products of docosahexaenoate oxidation as contributors to photosensitizing properties of retinal lipofuscin. Int. J. Mol. Sci. 2021, 22, 3525. [Google Scholar] [CrossRef] [PubMed]
- Pissios, P.; Ozcan, U.; Kokkotou, E.; Okada, T.; Liew, C.W.; Peters, J.N.; Dahlgren, G.; Karamchandani, J.; Kuvda, Y.C.; Kurpad, A.J.; et al. Melanin concentration hormone is a novel regulator of islet function and growth. Diabetes 2007, 56, 311–319. [Google Scholar] [CrossRef] [PubMed]
- Chen, C.; Jing, W.; Gulati, P.; Vargas, H.; French, S.W. Melanocytic differentiation in a solid pseudipapillary tumor of the pancreas. J. Gastroenterol. 2004, 39, 579–583. [Google Scholar] [CrossRef] [PubMed]
- Wahal, S.P.; Mohindroo, N.; Mohindroo, S. Black pancreatic neuro-endocrine tumor: A rare finding. Med. J. Dr. D. Y. Patil Vidyapeeth 2015, 8, 653–655. [Google Scholar] [CrossRef]
- Rorsman, P.; Ashcroft, F.M. Pancreatic β-cell electrical activity and insulin secretion: Of mice and men. Physiol. Rev. 2018, 98, 117–214. [Google Scholar] [CrossRef]
- Di Guardo, G. Cell autofluorescence and lipofuscin. Front. Med. 2015, 2, 6. [Google Scholar] [CrossRef]
- Koenig, J.; Press, M.; Grune, T.; Hoen, A. 56-β-cells accumulate the age-related protein aggregate lipofuscin—impact on functionality. Free Radical Biol. And Med. 2017, 112, 52. [Google Scholar] [CrossRef]


Publisher’s Note: MDPI stays neutral with regard to jurisdictional claims in published maps and institutional affiliations. |
© 2022 by the authors. Licensee MDPI, Basel, Switzerland. This article is an open access article distributed under the terms and conditions of the Creative Commons Attribution (CC BY) license (https://creativecommons.org/licenses/by/4.0/).
Share and Cite
Martins, I.S.; Silva, H.F.; Tuchin, V.V.; Oliveira, L.M. Fast Estimation of the Spectral Optical Properties of Rabbit Pancreas and Pigment Content Analysis. Photonics 2022, 9, 122. https://doi.org/10.3390/photonics9020122
Martins IS, Silva HF, Tuchin VV, Oliveira LM. Fast Estimation of the Spectral Optical Properties of Rabbit Pancreas and Pigment Content Analysis. Photonics. 2022; 9(2):122. https://doi.org/10.3390/photonics9020122
Chicago/Turabian StyleMartins, Inês Soraia, Hugo Filipe Silva, Valery Victorovich Tuchin, and Luís Manuel Oliveira. 2022. "Fast Estimation of the Spectral Optical Properties of Rabbit Pancreas and Pigment Content Analysis" Photonics 9, no. 2: 122. https://doi.org/10.3390/photonics9020122
APA StyleMartins, I. S., Silva, H. F., Tuchin, V. V., & Oliveira, L. M. (2022). Fast Estimation of the Spectral Optical Properties of Rabbit Pancreas and Pigment Content Analysis. Photonics, 9(2), 122. https://doi.org/10.3390/photonics9020122