Abstract
By analyzing the effect of the degree of polarization (DoP) of the partially coherent Gaussian Schell-model (GSM) beam on a heterodyne system of an uplink path and a downlink path, we developed an innovative and noteworthy theory according to which σsy (signal beam waist radius in the y direction component) and δSyy (coherence length of the signal beam in the yy direction component) had a more significant impact on heterodyne efficiency and DoP than the turbulence term on uplink and downlink paths. Namely, the DoP and heterodyne efficiency of an uplink path are higher than that of a downlink path when σsy > 0.02 m or δSyy ≥ 0.03 m. This innovative rule provides an efficient way for increasing the heterodyne efficiency of a signal beam propagating along an uplink or a downlink path channel in satellite-ground communication links in free-space optical heterodyne detection communication.
1. Introduction
It is well known that optical heterodyne (coherent) detection technology is widely used in free-space optical communications (FSOCs), broadcasting, radar systems and other fields since the reception sensitivity of this technology is nearly 20 dB higher than that of intensity modulation/direct detection methods [1,2,3,4,5]. Heterodyne detection has been widely used in satellite–satellite [6], satellite–ground [7,8] and ground–ground [9] communication links in recent decades. The most significant effect on the performance of FSOC systems in the latter two applications is atmospheric turbulence [10], since the stochastic motion of the turbulent medium affects laser beam propagation. This propagation distortion causes a mismatch in the amplitude, phase, polarization and other characteristics of the signal beam and LO beam, reducing spatial coherence and the performance of the coherent optical communication system [11].
As a result, the polarization state and distorted wavefront of the signal beam should be corrected before heterodyne detection can be performed. Polarization state is a vector characteristic of electromagnetic light fields that is commonly employed in polarization control, free-space optical communications, particle capture and target detection and identification. The degree of polarization (DoP) is a physical quantity that describes the polarization state of a vector partly coherent beam.
The signal beam propagating in the satellite–ground field (i.e., Figure 1) is less affected by atmospheric turbulence than the ground–ground communication links. The signal beam propagates through the atmosphere through an uplink or downlink path to reach the receiving terminal, as shown in Figure 1. The distance from the ground to the lower terminal and the vertical height of the receiving terminal, as illustrated in Figure 1, are h0 and H, respectively. θ is the path zenith angle. The uplink and downlink transmission paths of the signal beam distorted by turbulent atmosphere are indicated by the red solid and dotted lines, respectively.
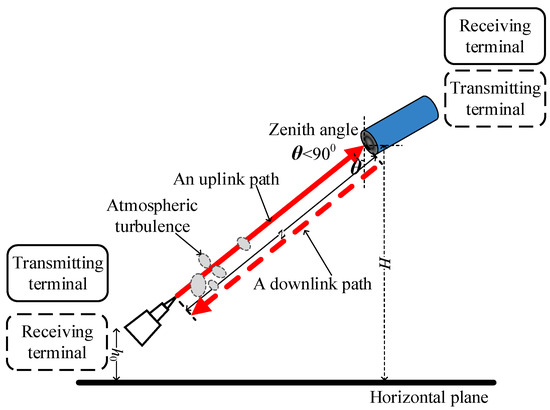
Figure 1.
Diagram of laser beam propagation at an uplink or downlink transmission path.
There has been an increased interest in the effect of atmospheric turbulence on the performance of heterodyne detection in recent years. Using the cross-spectral function of a GSM beam propagating through atmospheric turbulence, for example, Y.X. Ren et al. [12] derived a closed-form expression of heterodyne efficiency. C.Q. Li et al. [5] developed a mathematical model for a heterodyne detection system for partially coherent Gaussian Schell beams under the Tatarskii turbulence spectrum in 2015. Furthermore, some of the authors of this paper investigated the effect of signal beam propagation in atmospheric turbulence on heterodyne detection, e.g., angle-of-arrival fluctuation [3], beam mode of the partially coherent Gaussian Schell-model beam [1,2], irradiance and phase fluctuations [13] and wavefront correction [10]. However, these works were based on the vector theory of partially coherent light fields or Gaussian beam. In electromagnetic fields, partial polarization is a well-known phenomenon [5]. X. Z. Ke et al. investigated the polarization characteristics of the GSM beam [14] and electromagnetic Gaussian Schell-model vortex (EGSMV) beam in atmospheric turbulence [15]. In 2017, Y. F. Yang et al. [16] analyzed the effects of polarization aberrations on the output polarizations states. The signal-to-noise ratio (SNR) and the heterodyne efficiency for the partly polarized and coherent beam in free space were both expressed using the beam coherence-polarization (BCP) matrix, which was developed by Mohamed S. et al. [17,18]. Juan Pérez-Téllez et al. analyzed the polarization properties of the mixing of statistically independent optical fields in a coherent optical field mixing scheme [19]. Y. Wang et al. [20] investigated the impact of beam polarization on the effectiveness of the heterodyne detecting system.
However, the effects of the DoP of the GSM beams propagating along an uplink path and a downlink path in atmospheric turbulence on heterodyne detection have yet to be described. Therefore, the effects of the DoP of a partially coherent Gaussian Schell-model beam on a heterodyne detection system are investigated in this study as the signal beam propagating along an uplink or downlink path in atmospheric turbulence. Several analytical expressions for signal beam and LO beam as polarized and partially coherent GSM beam of the DoP and heterodyne efficiency are derived in our work based on a model of heterodyne detection for a partially coherent beam under the modified Hill spectrum of the refractive index fluctuations.
2. Mathematical Model of Heterodyne Detection with Partially Polarized GSM Beam Propagating along an Uplink Path and a Downlink Path in Turbulence
We suppose the signal beam and LO beam are partially polarized and partially coherent, although the LO beam is commonly polarized and coherent, to obtain a general heterodyne efficiency expression for a heterodyne detection system that includes the coherence and polarization characteristics of the light source. Let us consider that the signal beams and the LO beams are parallel to the optical axis and perpendicular to the detector surface. The instantaneous field of both beams on the detector surface can be expressed, respectively, as [5]:
where ex and ey are unit vectors, ωL and ωs are the central angular frequencies of the fields and ALx, ALy and ASx, ASy are the optical field distribution of the LO beam and the received signal beam in the direction of x and y, respectively. Based on the model of heterodyne detection, the detected intermediate frequency (IF) power can be evaluated according to the character of a square-law device, and the IF power is expressed as [21]:
where Tr denotes the trace, WLij and WSij are the beam coherence polarization (BCP) matrix of the LO beam and signal beam, respectively [15], and ℜ is the detector responsivity, which is assumed to be uniform across the detector surface.
For coherent detection, a measurement of heterodyne performance is the dimensionless heterodyne efficiency ηhet, which measures the loss in coherent power when the received signal and LO fields are not perfectly matched. The heterodyne efficiency for random fields is defined in an analogous manner in the case of deterministic fields, which can be expressed as [21]:
Equation (4) is the basic mathematical model for the partially coherent beam of heterodyne detection. In the following part, we will establish a mathematical model of a heterodyne detection considering the change of the DoP of the signal beam propagating along an uplink path and a downlink path in atmospheric turbulence. The signal beam and the LO beam are partially polarized and partially coherent beams at the source field, of which the BCP matrix can be expressed as [20]:
where r1 and r2 denote any two-point position vector at plane z = 0 (z is the propagation distance of the signal beam). The subscript is α = L (LO beam) or S (signal beam) and (i,j) denote (x,y), respectively. The equation Bij = 1, i = j; | Bij | ≤ 1, I ≠ j; Bij = is satisfied by the parameter Bij. Aαi and Aαj are the amplitude of the light field, and σαi and σαj are the beam waist radius in the x and y axes, respectively. The transverse coherence length of the beam is δαij (z = 0), which meets δij = δji.
Assuming that a signal beam propagates along the z axis, based on the generalized Huygens–Fresnel diffraction principle, each element of the BCP matrix of the partially polarized coherent beam propagated through the atmospheric turbulence can be easily obtained, which can be expressed as [22]:
where ρ1 and ρ2 denote the position vectors of any two points at the receiver plane, λ is the wavelength, k = 2π/λ and φ is the cross-correlation function of the complex phase of the spherical wave, which can be expressed as [23]:
where P = r1− r2, Q = ρ1− ρ2, M1, M2 and M3 are, respectively:
where ξ denotes (h-h0)/(H-h0) in the downlink path and ξ denotes 1 − (h − h0)/(H − h0) in the uplink path. Φn(κ) is the spectrum of the refractive index fluctuations. Here, to overcome the application limitations of the Kolmogorov turbulence spectrum and considering both inner scale and outer scale effects at the same time, the modified Hill spectrum model Φn(κ) was used in this paper [22]. It is expressed as:
where κl = 3.3/l0; κ0 = 2π/L0, l0 is the inner scale and L0 is the outer scale. For a signal beam propagating in a slant path, the Hufnagel–Valley model is widely used to approximate the atmospheric refractive index structure constant (h) [22]:
where νRMS = (
+ 30.69νg + 348.91)1/2 is the speed of wind in the vertical path, νg is the surface wind speed and h is the distance from the ground. Generally, νg = 21 m/s, and the refractive index structure constant C0 is 1.7 ×10⁻¹⁴ m−2∕3.
By substituting Equations (5), (7)–(9) by Equation (6) and a complex integral simplification [24], Wαij(ρ1,ρ2,z) can be simplified as:
By substituting Equation (10) by Equation (3), and converting to the polar coordinates ρ and φ, the power associated with the IF signal photocurrent can be expressed as:
where D is the hard aperture diameter of the detector. To simplify the calculation, we use the Gaussian limiting aperture, or soft aperture, to replace the hard aperture. Using the relationship between the soft aperture w and the hard aperture, D is D2 = 8w2 [25] and ρ1ρ2 = ρ1ρ2cos(φ1-φ2). The complex integration is performed as shown in detail in Appendix A. Then, PIFij can be simplified as:
Based on the results obtained in Appendix A and Equation (12), it is possible to express the heterodyne efficiency of the partly polarized GSM beam in the turbulence of heterodyne detection as:
3. Mathematical Model of DoP with Partially Polarized GSM Beam Propagating along an Uplink Path and a Downlink Path in Turbulence
When the signal beam passes through the receiver in the uplink or downlink slant path, let ρ1 = ρ2 = ρ. Based on Equation (10) and the integral formulation, WSij(ρ,ρ,z) can be expressed as:
The DoP of the received signal beam is described with the generalized Stokes parameter, which can be expressed as [15]:
where S0, S1, S2 and S3 can be expressed with the cross-spectral density matrix (CSDM), namely,
The Stokes parameter of the receiving end (z > 0), which may be expressed using Equations (15) and (16), is
The DoP of the point on the optical axis at the receiving plane can be set by choosing proper parameters according to Equations (13) and (17).
4. Numerical and Discussion
Based on Equations (13) and (17), the effects of the source parameters, turbulence parameters and propagation distance on the DoP and the performance of the partially coherent GSM beam heterodyne detection system are investigated. For convenience and with no special instructions, the simulation parameters were set as Table 1, the correlation length Bij satisfies max{δαxx, δαyy } ≤ δαxy ≤ min{δαxx/|Bxy|0.5, δαyy/|Bxy|0.5}.

Table 1.
Simulation parameter settings.
Figure 2a illustrates the DoP and heterodyne efficiency of on-axis points (ρ = 0) as a function of σsx for uplink and downlink paths. As seen in Figure 2a, the DoP of the signal beam increases and eventually stabilizes as σsx increases, which is similar to the heterodyne efficiency as a function of σsx. Overall, signal beam propagation on a downlink path has a greater Dop and heterodyne efficiency than on an uplink path, which is consistent with Ref [15]. Figure 2b illustrates the DoP of deviation from the axial position for various σsy on the uplink and downlink paths. The heterodyne efficiency as a function of σsy for the uplink and downlink paths is shown in Figure 2c. As shown in Figure 2b, the variation of DoP with the deviation from the axial position on the downlink and uplink paths was decreased with an increase in σsy. As seen in Figure 2c, heterodyne efficiency decreases with increasing σsy; however, there seems to be a key point at σsy= 0.02 m. When σsy≤ 0.02 m, the heterodyne efficiency of the signal beam propagation on a downlink path is higher than on an uplink path; however, when σsy> 0.02 m, the result of heterodyne efficiency on a downlink vs. an uplink path is precisely the opposite. This is attributed to the fact that σsy has a major effect on the DoP of the downlink path, which has a significant impact on heterodyne efficiency.
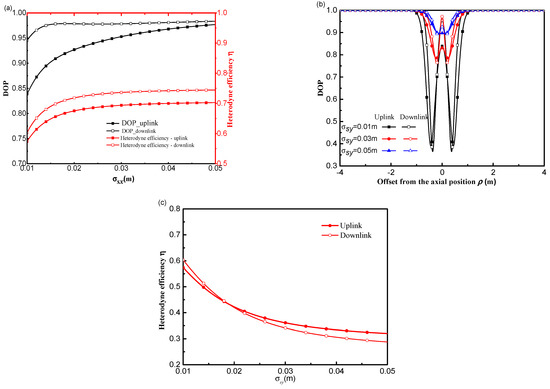
Figure 2.
Effect of waist radius of signal beam on the DoP and heterodyne efficiency of an uplink path and a downlink path in atmospheric turbulence (a) σsx, (b) offset from the axial position ρ and (c) σsy.
Figure 3a,b show the heterodyne efficiency as a function of σlx for various σsx and σsy of the uplink and downlink path, respectively. Figure 3c,d show the heterodyne efficiency as a function of σly for various σsx and σsy of the uplink and downlink path, respectively. In Figure 3a–d, the top and bottom symbols in each box represent the maximum and minimum values, respectively. The mean value is indicated by the number at the top or bottom of each box. Comparing Figure 3a,c, heterodyne efficiency increases with increasing σlx and σly, respectively. Heterodyne efficiency on the downlink path is higher than on the uplink path in Figure 3a,c. Additionally, the waist radius of the LO beam in the x direction component σlx has a relatively strong effect on the heterodyne efficiency. Comparing Figure 3a,b, heterodyne efficiency improves and decreases with increasing σSx and σSy, respectively. Finally, heterodyne efficiency eventually stabilizes. When σsy ≤ 0.02 m, heterodyne efficiency is higher for a downlink path than for an uplink path, as shown in Figure 3b,d. However, when σsy is larger than 0.02 m, the heterodyne efficiency of the downlink path is lower than that of the uplink path. That is because the degree of mismatch between the signal beam and the LO beam increases as σsy increases, which has a greater impact than the effect of the turbulence term on an uplink and downlink path. Comparing Figure 3c,d, heterodyne efficiency improves and decreases with increasing σSx and σSy, respectively, which is consistent with the results presented in Figure 3a,b.
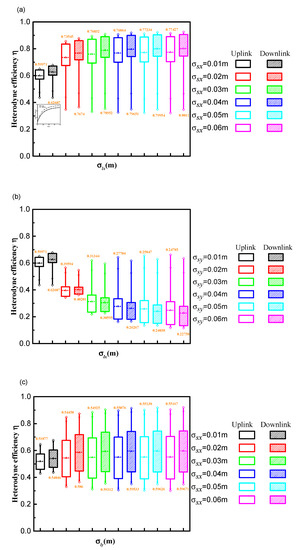
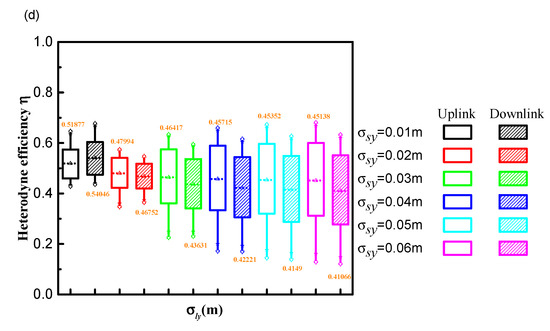
Figure 3.
Effect of waist radius of LO beam on the heterodyne efficiency on an uplink path and a downlink path (a) σlx and σsx, (b) σlx and σsy, (c) σly and σsx, (d) σly and σsy.
Overall, heterodyne efficiency is significantly impacted by the signal beam waist radius in the Y direction component σsy. Meanwhile, σSy plays a significant role in determining the trend of heterodyne efficiency with increasing σlx (or σly) and this change of degree.
Figure 4a–d show heterodyne efficiency and DoP as a function of δSxx, δSyy, δSxy and δSyx of an uplink and downlink path, respectively. As seen in Figure 4a, heterodyne efficiency increases and the DoP of the signal beam on-axis points decreases with an increase in δSxx. The heterodyne efficiency and DoP of the signal beam propagation on a downlink path are higher than on an uplink path. That is because the difference between uplink and downlink affected by atmospheric turbulence is expressed in the turbulence term M3 in Equation (7), i.e., M3 of a downlink transmission is less than that of an uplink transmission. The heterodyne efficiency and DoP on a downlink and uplink path decrease with an increase in δSyy, which is consistent with the results presented in Figure 2c. The heterodyne efficiency of a downlink path is lower than that of an uplink path when δSyy reaches a certain value. Namely, the variation of heterodyne efficiency of a downlink and uplink path is increased with an increase in δSyy. As seen in Figure 4c,d, heterodyne efficiency remains consistent as δSxy and δSyx increase, but the DoP of the on-axis points increases with an increase in δSxy and δSyx. The heterodyne efficiency and DoP of a downlink path are higher than that of an uplink path. This demonstrates that the coherence length of the signal beam in the xy (or yx) direction component has a significant effect on the DoP, but is less sensitive with regard to heterodyne efficiency. Generally, δSyy has the most significant effect on the heterodyne efficiency and DoP of the signal beam propagation on a downlink and uplink path.


Figure 4.
Effect of coherence length of signal beam on the DoP and heterodyne efficiency of an uplink path and a downlink path (a) δSxx, (b) δSyy, (c) δSxy, (d) δSyx.
Figure 5a,b show the heterodyne efficiency as a function of δLxx for various δSxx and δSyy of the uplink and downlink path, respectively. Figure 5c,d show the heterodyne efficiency as a function of δLyy for various δSxx and δSyy of the uplink and downlink path, respectively. In Figure 5a–d, the top and bottom symbols in each box represent the maximum and minimum values, respectively. The mean value is indicated by the number at the top or bottom of each box. With increasing δSxx and δSyy, heterodyne efficiency improves and decreases, respectively, as seen in Figure 5a,b. Finally, the heterodyne efficiency eventually stabilizes. The heterodyne efficiency on the downlink path is also higher than that on the uplink path in Figure 5a. As demonstrated in Figure 5b, the heterodyne efficiency is higher for a downlink path than for an uplink path when δSyy < 0.03 m, and when δSyy ≥ 0.03 m, the heterodyne efficiency for a downlink path is lower than that for an uplink path. Additionally, this change of heterodyne efficiency of the downlink and uplink paths is increased with an increase in δSyy. Comparing Figure 5a,c, the heterodyne efficiency decreases and increases with increasing δLyy and δLxx, respectively. The heterodyne efficiency on the downlink path is also lower than that on the uplink path in Figure 5c, which is an opposite trend to the results presented in Figure 5a. The reason has been explained by analyzing the results of Figure 3. Therefore, compared with the effect of δSxx on the heterodyne efficiency, the coherence length of the signal beam in the yy direction component δSyy has an opposite trend to the heterodyne efficiency for a downlink path and an uplink path. The comparison of the results of Figure 5b,d can also demonstrate the correctness of this conclusion.
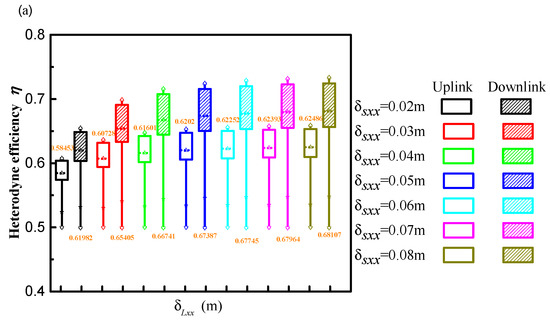
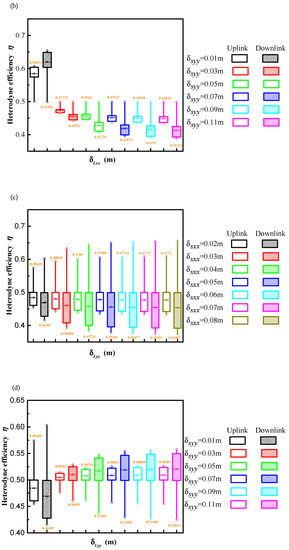
Figure 5.
Effect of coherence length of LO beam on the heterodyne efficiency on an uplink path and a downlink path. (a) δLxx and δSxx, (b) δLyy and δSyy, (c) δLxy and δSxy, (d) δLyx and δSyx.
The heterodyne efficiency and DoP are displayed as functions of the inner scale and outer scale, respectively, in Figure 6a,b. The heterodyne efficiency and DoP are enhanced with the increasing inner scale l0 and decrease with the raising outer scale L0, as shown in Figure 6a,b. The heterodyne efficiency and DoP on the downlink path are also higher than that on the uplink path. The DoP and heterodyne efficiency are significantly affected by the inner scale carried on by atmospheric turbulence, as seen in Figure 6a,b.
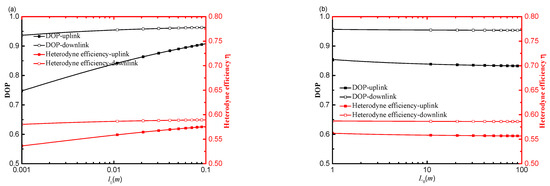
Figure 6.
Effect of inner scale and outer scale on the heterodyne efficiency and DoP on an uplink path and a downlink path in atmospheric turbulence, (a) l0 (b) L0.
Heterodyne efficiency and DoP are shown in Figure 7a–c as a function of transmission distance z for various refractive index structure parameters. As shown in Figure 7a–c, the heterodyne efficiency and DoP of an uplink path and a downlink path are extremely similar within a transmission distance of 100 m. This is because, when the transmission distance is relatively small, the random fluctuation carried upon by the refractive index may be omitted. The maximum DoP and heterodyne efficiency of a downlink propagation path correspond to a transmission distance that is greater than an uplink propagation path, and it decreases with an increasing atmospheric refractive index structure constant 10−16 m−2/3 to 10−12 m−2/3. As the transmission distance increases, the DoP and heterodyne efficiency of a downlink path are significantly impacted by strong atmospheric turbulence, as compared to weak and medium-strong atmospheric turbulence intensities. This is due to the fact that when the number of small-scale gyres increases in the area of considerable atmospheric turbulence, the diffraction of the signal beam is strengthened, which is consistent with the findings in Figure 6.

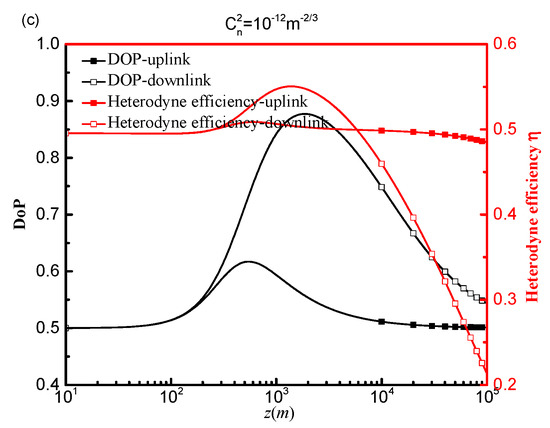
Figure 7.
Effect of atmospheric turbulence intensities on the heterodyne efficiency and DoP on an uplink path and a downlink path (a)
= 10−12 m−2/3 (b) = 10−14 m−2/3 (c) = 10−16 m−2/3.
For various transmission distances, Figure 8 illustrates the heterodyne efficiency as a function of detector aperture D. As shown in Figure 8, the heterodyne efficiency of a downlink path and an uplink path decreases with increasing detector size. The heterodyne efficiency of a downlink path is also higher than that of an uplink path. Additionally, the heterodyne efficiency increases with an increasing transmission distance on a downlink path and an uplink path. This is due to the fact that the zenith angle decreases as the transmission distance increases, the corresponding atmospheric turbulence intensities decrease, spatial coherence deteriorates and the impact of atmospheric turbulence on the beam is reduced.
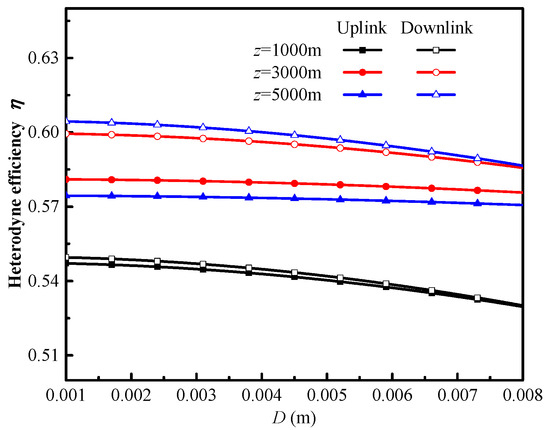
Figure 8.
Effect of detector aperture D on the heterodyne efficiency of an uplink path and a downlink path.
5. Conclusions
In conclusion, the effect of the DoP of the partially coherent Gaussian Schell-model beam on a heterodyne detection system between propagations along an uplink path and a downlink path in atmospheric turbulence has been studied. We found a new result according to which the DoP and heterodyne efficiency of an uplink path are higher than that of a downlink path when σsy > 0.02 m or δSyy ≥ 0.03 m, which indicates that σsy and δSyy had a more significant impact on heterodyne efficiency and DoP than the turbulence term on the uplink and downlink paths. We propose a method to obtain a higher heterodyne efficiency based on real propagation paths based on the above description, and demonstrate that this method is valid for any waist radius, higher and lower coherence cases, any atmospheric turbulence intensity, transmission distance and detector aperture.
Author Contributions
Methodology, Z.T.; formal analysis, Z.T.; investigation, S.L. and P.W.; resources, Y.K. and P.W.; data curation, J.W. and S.L.; writing—original draft preparation, Z.T., J.W. and Y.K.; writing—review and editing, J.W. and S.L.; supervision, Z.T. and J.W.; funding acquisition, Z.T. and J.W. All authors have read and agreed to the published version of the manuscript.
Funding
This paper is supported by the National Natural Science Foundation of China (62001363, 62101313), Key R&D Program of Shaanxi Provincial Department of Science and Technology—General Projects in Industrial Field (2022GY-100). Young Talent Support Project of Shaanxi Association for Science and Technology (20220142).
Institutional Review Board Statement
Not applicable.
Informed Consent Statement
Not applicable.
Data Availability Statement
Not applicable.
Acknowledgments
The authors express their appreciation to the anonymous reviewers for their valuable suggestions.
Conflicts of Interest
The authors declare no conflict of interest.
Appendix A
In this appendix, the analysis process of the BCP matrix of the signal beam is derived first. By substituting Equations (5) and (7) by Equation (6), Wαij(ρ1,ρ2,z) can be simplified as:
We assume that rc = (r1+r2)/2, rd = r1 − r2, p = ρ1-ρ2, q = ρ1 + ρ2, for which, r1 = rc + rd/2, r2 = rc − rd/2. Equation (A1) can be simplified as:
Using the identities written as formulas in Ref. [24]:
With integral simplification of rc, Equation (A2) can be written as:
where
With the integral simplification of rd again, Equation (A4) can be written as Equation (A6):
where
Subsequently, the analytic process of IF power is also derived. Using the relationship ρ1ρ2 = ρ1ρ2cos(φ1-φ2) and rearranging the integration, Equation (A6) can be written as:
where
Using the identities written as formulas in Ref. [24]:
where E = m2 + n2-r2, F = 2mr.
Using Equation (A10), Equation (A8) can be simplified as:
Using Equation (A12):
Performing the integration over ρ2 and rearranging the yield, Equation (A11) can be expressed as:
Using Equation (A14):
Performing the integration over ρ1 and the simplification in Equation (A13), finally, the IF power can be obtained as Equation (12).
Based on Equation (12), the optical power of the signal beam and the LO beam at the source field can be calculated, respectively, as:
References
- Tan, Z.K.; Kong, Y.X.; Lei, S.C.; Yu, J.; Liu, J. Effect of beam mode of partially Gaussian Schell-model beam on a heterodyne detection system in turbulence. Appl. Opt. 2020, 59, 4977–4987. [Google Scholar] [CrossRef] [PubMed]
- Tan, Z.K.; Lei, S.C.; Kong, Y.X.; Yu, J.; Liu, J. Theoretical and experimental investigation on the performance of heterodyne detection system affected by the beam mode of partially coherent beams in atmospheric turbulence. Opt. Commun. 2020, 466, 125638. [Google Scholar] [CrossRef]
- Ke, X.; Tan, Z. Effect of angle-of-arrival fluctuation on heterodyne detection in slant atmospheric turbulence. Appl. Opt. 2018, 57, 1083–1090. [Google Scholar] [CrossRef] [PubMed]
- Cohen, S.C. Heterodyne detection: Phase front alignment, beam spot size, and detector uniformity. Appl. Opt. 1975, 14, 1953–1959. [Google Scholar] [CrossRef] [PubMed]
- Li, C.; Wang, T.; Zhang, H.; Xie, J.; Liu, L.; Zhao, S.; Guo, J. The performance of heterodyne detection system for partially coherent beams in turbulent atmosphere. Opt. Commun. 2015, 356, 620–627. [Google Scholar]
- Vilnrotter, V.; Lau, C.W. Quantum detection and channel capacity for communications applications. In Proceedings of the SPIE 4635, Free-Space Laser Communication Technologies XIV, San Jose, CA, USA, 26 April 2002; p. 464084. [Google Scholar]
- Fields, R.; Kozlowski, D.; Yura, H.; Wong, R.; Wicker, J.; Lunde, C.; Gregory, M.; Wandernoth, B.; Heine, F. 5.625 Gbps bidirectional laser communications measurements between the NFIRE satellite and an optical ground station. In Proceedings of the 2011 IEEE International Conference on Space Optical Systems and Applications, Santa Monica, CA, USA, 11–13 May 2011; p. 44. [Google Scholar]
- Gregory, M.; Heine, F.; Kampfner, H.; Lange, R.; Saucke, K.; Sterr, U.; Meyer, R. Inter-satellite and satellite-ground laser communication links based on homodyne BPSK. In Proceedings of the SPIE 7587, Free-Space Laser Communications XXII, San Francisco, CA, USA, 26 February 2010; p. 75870E. [Google Scholar]
- Lange, R.; Smutny, B.; Wandernoth, B.; Czichy, R.; Giggenbach, D. 142 km, 5.625 Gbps free-space optical link based on homodyne BPSK modulation. In Proceedings of the SPIE 6105, Free-Space Laser Communications XVIII, San Jose, CA, USA, 1 March 2006; p. 61050A. [Google Scholar]
- Tan, Z.K.; Ke, X.; Wang, J. An expriental study of wavefront correction for a heterodyne detection system for optical communication. Indian J. Phys. 2020, 94, 1135–1145. [Google Scholar] [CrossRef]
- Rao, R. Light Propagation in the Turbulent Atmosphere; Anhui Science and Technology: Anhui, China, 2005; Volume 149. [Google Scholar]
- Ren, Y.X.; Dang, A.H.; Liu, L. Heterodyne efficiency of a coherent free-space optical communication model through atmospheric turbulence. Appl. Opt. 2012, 51, 7246–7254. [Google Scholar] [CrossRef] [PubMed]
- Tan, Z.K.; Ke, X. Analysis of a heterodyne detection system affected by irradiance and phase fluctuations in slant atmospheric turbulence. Appl. Opt. 2018, 57, 9596–9603. [Google Scholar] [CrossRef] [PubMed]
- Ke, X.; Wang, J.; Wang, M.J. Evolution of degree of polarization of partially coherent beams propagation in slant and horizontal atmospheric turbulence. Indian J. Phys. 2019, 93, 691–699. [Google Scholar] [CrossRef]
- Wang, J.; Ke, X.; Wang, M.J. Influence of source parameters and atmospheric turbulence on the polarization properties of partially coherent electromagnetic vortex beams. Appl. Opt. 2019, 58, 6486–6494. [Google Scholar] [CrossRef] [PubMed]
- Yang, Y.; Yan, C.; Hu, C.; Wu, C. Modified heterodyne efficiency for coherent laser communication in the presence of polarization aberrations. Opt. Exp. 2017, 25, 7567–7591. [Google Scholar] [CrossRef] [PubMed]
- Salem, M.; Dogariu, A. Optical heterodyne detection of random electromagnetic beam. J. Mod. Opt. 2001, 51, 2305–2313. [Google Scholar] [CrossRef]
- Salem, M.; Rolland, J.P. Effects of coherence and polarization changes on the heterodyne detection of stochastic beams propagating in free space. Opt. Commun. 2008, 281, 5083–5091. [Google Scholar] [CrossRef]
- Pérez-Téllez, J.; Mendieta-Jiménez, F.J.; Arvizu-Mondragón, A. Degree of polarization and heterodyne spectrum in coherent detection of partially polarized wave fields. J. Mod. Opt. 2015, 52, 2511–2522. [Google Scholar] [CrossRef]
- Wang, Y.; Li, C.Q.; Wang, T.F. The effects of polarization changes of stochastic electromagnetic beams on heterodyne detection in turbulence. Laser Phys. Lett. 2016, 13, 116006. [Google Scholar]
- Salem, M.; Rolland, J.P. Heterodyne efficiency of a detection system for partially coherent beams. J. Opt. Soc. Am. A 2010, 27, 1111–1119. [Google Scholar] [CrossRef] [PubMed]
- Andrews, L.C.; Phillips, R.L. 2005 Laser Beam Propagation through Random Media; SPIE: Washington, DC, USA, 2005. [Google Scholar]
- Li, C.; Zhang, H.Y.; Wang, T.F. Investigation on coherence characteristics of Gauss– Schell model beam propagating in atmospheric turbulence. Acta Phys. Sin. 2013, 62, 224203. [Google Scholar]
- Jeffrey, A.; Zwillinger, D. Table of Integrals, Series, and Products; Academic Press: Cambridge, MA, USA, 2007. [Google Scholar]
- Andrews, L.C.; Phillips, R.L.; Young, C.Y. 2001 Laser Beam Scintillation with Applications; SPIE: Washington, DC, USA, 2001. [Google Scholar]
Publisher’s Note: MDPI stays neutral with regard to jurisdictional claims in published maps and institutional affiliations. |
© 2022 by the authors. Licensee MDPI, Basel, Switzerland. This article is an open access article distributed under the terms and conditions of the Creative Commons Attribution (CC BY) license (https://creativecommons.org/licenses/by/4.0/).