Abstract
In this paper, we propose an Extended Kalman Filtering with phase noise reconstruction (EKF-PC) scheme to enhance the carrier recovery capability for probabilistic shaping of coherent optical communication systems with various shaping factors. We first investigate the weights of the shaping factor and the noise rejection window length of EKF-PC for PS-64QAM at a fixed signal-to-noise ratio (SNR). After that, we jointly optimize the shaping factor and the noise rejection window length to obtain the maximum achievable information rate at a variety of SNRs. Then, we numerically analyze the carrier recovery performance of the EKF-PC for different linewidths and SF conditions. Finally, we conduct simulation experiments to compare EKF-PC, PCPE, and other currently available Kalman CPE algorithms with the SFs of 0.02, 0.025, 0.03, and 0.035 under back-to-back (B2B) scenarios. The experimental results show that EKF-PC obtains an average SNR improvement of 0.13–0.5 dB compared to PCPE and an average performance improvement of 0.5–1 dB compared to other Kalman algorithms.
1. Introduction
Probabilistic shaping (PS) has received a great deal of attention in recent years because of the adaptive nature of the channel capacity of probabilistic shaping approaching the Shannon limit on its transmission rate. Compared to conventional constellations, probabilistic shaping constellations can theoretically achieve a shaping gain of 1.53 dB compared to conventional QAM [1]. However, in the actual digital signal processing (DSP) process applied to conventional QAM constellations the additional DSP-induced penalties may diminish this shaping gain. In actual optical transmission, fiber channels are not completely ideal AWGN channels, and probabilistic shaping performance is affected by various nonlinearities. For actual fiber channels, one of the biggest differences compared to an ideal AWGN channel is that they suffers from Non-Linear Phase Noise (NLPN), which is constellation-dependent and reduces the benefit of probabilistic shaping [2]. The effect of nonlinear phase noise cannot be completely eliminated using conventional CPR.The residual phase noise significantly diminishes the profit of shaping. Current carrier phase estimation (CPE) methods for probabilistic shaping are under-investigated.
The carrier recovery schemes that have been implemented and applied can be broadly classified into the following two types: ① modulation-independent DSP based on a large number of pilots, and ② standard blind phase algorithms applied to standard QAM modulation. While the former method has better performance with good flexibility, it inevitably introduces a large amount of overhead (OH) and reduces the spectral efficiency. The latter is a sub-optimal solution for phase recovery while maintaining throughput. Different blind phase recovery algorithms have different advantages and introduce different penalties accordingly. The present blind phase algorithms can be grouped into the following categories: VV-based and its extended algorithms such as QPSK partitioning [3], and low-pass filtering algorithms [4,5], which perform poorly on PS because PS shaping weakens the probability of occurrence of the peripheral constellation points, making the recovery performance of these algorithms inferior. BPS [6,7] is currently recognized as the best blind phase algorithm [8]; its performance is proportional to its complexity, however, experiments have shown that the maximum capacity shaping factor leads to the worst BPS recovery performance [9] and that BPS with other shaping factors penalizes gain. Principal component analysis [10] has received wide attention in the last two years for its simple algorithm structure, transparent modulation format, and better performance. Extended Kalman Filtering (EKF) [11] and unscented Kalman filtering (UKF) [12] have been introduced as carrier phase recovery algorithms; they have a simple structure and strong parallel processing, and as they do not require phase unwrapping recovery operation and the resulting cycle slips (CS), their performance is favorable. However, the UKF algorithm requires periodic pilot insertions, and the parameters of the Kalman filter need to be adjusted frequently with changes in SNR, which is more complex and reduces the information throughput. To best of our knowledge, most of the currently applicable CPE algorithms require pilots to be aided, which unavoidably raises the complexity of the system and decreases the information rate. For this reason, blind CPE algorithms that can recover constellations with different forming factors successfully and adapt to variable SNR conditions are a critical research area to be addressed [13].
In this paper, we present the details of a proposed EKF-PC algorithm and investigate its performance for 32 Gb/s 64 single polarization PS-QAM systems. The EKF-PC algorithm proposed in this paper is a completely blind carrier phase estimation (CPE) algorithm that does not require operations such as inserting pilots, which effectively improves the information throughput rate. At the same time, because EKF-PC has a phase reconstruction and noise rejection module, it has a high capability for noise rejection. First, we investigate the weights between SF and noise rejection windows and identify the optimal window length under different SNR conditions. Subsequently, we numerically investigate the performance of the EKF-PC with different SFs at the optimal window length. The EKF-PC is confirmed to obtain SNR enhancement under the condition where the FEC threshold is satisfied. After that, we investigate the performance of the EKF-PC with various SFs under different linewidth conditions, and the results show that the EKF-PC has a strong linewidth tolerance. Finally, this paper compares the performance of the proposed EKF-PC with several current more dominant CPE algorithms, namely, PCPE, EKF-CPANE, and UKF, which have different forming factors under various SNR conditions. The experimental results show that EKF-PC does not have cycle slips and outperforms PCPE, obtaining an average SNR enhancement of about 0.13–0.5 dB. Compared with the current dominant Kalman methods, it obtains an average SNR enhancement of 0.5–1 dB and has the best performance.
2. Principle
2.1. Probabilistic Shaping and System Model
The probabilistic shaping technique increases the channel capacity by changing the probability of occurrence of the constellation points to the optimal Gaussian distribution under the AWGN channel; by changing the shaping factor , the information rate can be modified to achieve rate adaptation. The Gaussian distribution is usually implemented by the MB distribution; the probability of occurrence of each constellation point under the MB distribution is provided by Equations (1) and (2), where is the shaping factor, M is the size of the constellation point, and is the normalization factor such that the sum of the probabilities of the constellation points in X can be 1. Here, needs to be chosen carefully, as it determines the maximum transmission rate. Based on the signal power, modulation format, and SNR, it is possible to determine an optimal ; this optimal represents the maximum information rate that can be achieved by the PS technique under that condition. The SNR environment for constellation applications differs for different modulation formats, and similarly, the optimal for different SNRs is not the same. In general, the optimal SNR ranges from 12 dB to 22 dB and the optimal value ranges from 0 to 0.05, as shown in Figure 1 when using the PS-64QAM [14]. In particular, when , the PS constellation degrades to a uniformly distributed QAM.
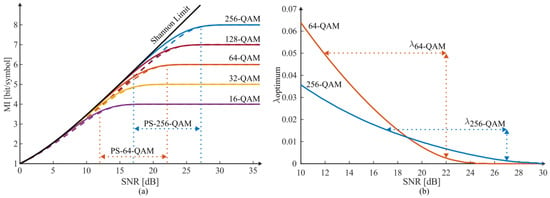
Figure 1.
(a) MI for typical M-QAM formats and (b) optimal values of lambda for PS-64QAM [14].
Here, we proceed to discuss performance metrics for PCS. For PS-QAM, we use MI as the evaluation criterion instead of pre-FEC BER, which is for several reasons. First, the number of symbols applied in each experiment is limited, and after post-FEC, the BER reaches 10–15 magnitudes. This is very detrimental to our experiments, which require a larger number of symbols and a longer testing time. The second reason is that our experiments do not consider any particular FEC implementation; hence, we use the metric that provides the best receiver performance, which is the AWGN-channel MI. we utilize three MI evaluation metrics: MI, GMI [15], and NGMI [16]; these three metrics are represented by Equations (3)–(5):
In the following, we consider a received QAM symbol where the signal is efficient for sample recovery, dispersion compensation, and linear equalization in the DSP; the received symbol (from x-polarization or y-polarization) is provided in Equation (6), where denotes the transmitted symbol, is the combined phase noise of the transmitter laser and local oscillator (LO) at the receiver, and models the collective amplified spontaneous emission (ASE) noise generated from inline amplifiers, which are complex circularly symmetric Gaussian random processes. Laser phase noise is typically modeled as a Wiener process in which the phase difference between two adjacent symbols can be modeled as a zero-mean Gaussian random variable with variance , where is the symbol period and represents the combined linewidths of the transmitter laser and LO, as in Equation (7) below.
According to [15], the joint effect of phase noise and AWGN noise on the transmitted symbols can be rewritten as an equation, which means that the transmitted symbols are influenced by a complex variable, as in Equation (8). The effect on is reflected by the effect on the angle and the effect on the amplitude , as shown in Figure 2. Using the underlying mathematics, can be completely provided by and . The real part of represents the deterioration of the phase of the transmitting symbol, while the imaginary part of represents the noise of the amplitude of the transmitting symbol , as shown in Equations (9) and (10). Using certain methods such as CPANE, the CPE can be performed using joint estimation to estimate , which allows for more accurate estimation of .
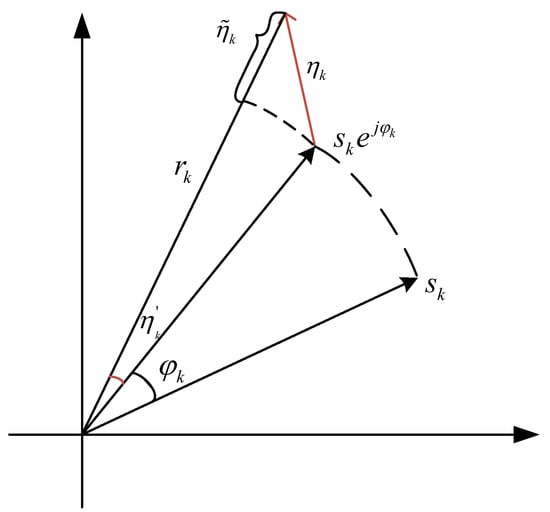
Figure 2.
Input signal model to CPE [17].
2.2. Principle of EKF-PC
The EKF can effectively solve the nonlinear estimation problem, and the EKF-CPANE relying on the EKF has good performance in dealing with the carrier recovery process of the conventional QAM constellation. The observations obtained by the EKF are recursive MMSE estimates based on all observations up to moments in the past. When performing EKF estimation, the phase noise is estimated jointly with AWGN noise, resulting in more accurate estimate of the phase noise. When using the Kalman filter, the system is usually modeled as a state equation, as in Equation (11), and an observation equation, Equation (12). Here, and are denoted as process noise and observation noise, respectively; both are usually modeled as zero-mean Gaussian white noise with covariances and . When performing Kalman filter estimation, it is important to choose the parameters and carefully and cautiously, as an unreasonable and can lead to system instability (as shown in the following) and even significant CS. It is worth noting that the meaning of is different from that in Equation (6) Here, it is not AWGN noise, rather it is a quantity introduced for the uniformity of the Kalman filter form; introducing this quantity instead of directly assigning to zero alone improves the stability of the system.
The Kalman filter has both prediction and filtering functions, using the moment and all previous observations to obtain the predicted value at the moment and the filtered value at the moment using the observations at the moment and the predicted value at the moment, which is the best estimate of the observations at the moment as well. The notation of the Kalman equation in this paper is specified as follows: the subscript denotes the predicted value, which indicates the predicted value obtained by using the previous moment but not the moment observation; the subscript denotes the filtered value, which indicates the k-moment available observation and the filtered or the estimated value obtained by using it.
The individual components of the EKF-PC are shown in Figure 3, which can be divided into four parts: the prediction module (the blue part), the update module (the purple part), the judgment module (the green part), and the phase reconstruction module with noise rejection (the red part). The prediction equation of the EKF-PC is provided by Equation (13), the estimated value at moment is directly replaced by the filtered value at moment , and denotes the error covariance matrix. The error matrix is updated by Equation (14).
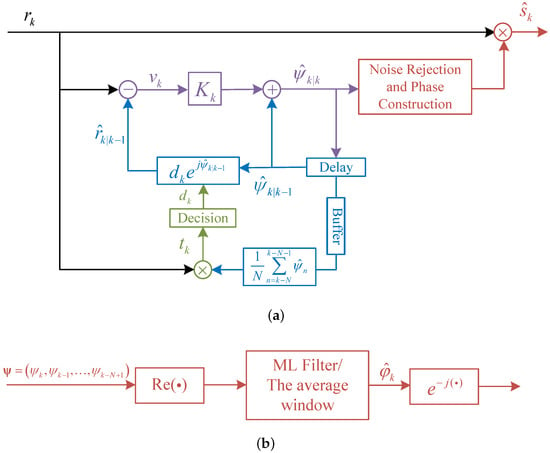
Figure 3.
(a) Block diagram of proposed EKF-PC algorithm and (b) structure diagram of noise rejection and phase reconstruction module.
The update equation of the EKF-PC is provided by Equations (15)–(19). In Equation (15), denotes the bias derivative of the observation matrix with respect to and is the decision value, as mentioned in the later section. The Kalman gain at moment k is calculated in Equation (16) and denotes the weight of the innovation in the estimation at moment k. In Equation (17) is the innovation, and denotes the difference between the observed value and the predicted value at moment k. The estimated value at moment k is calculated by Equation (18), obtained by weighting the predicted value at moment k with the new interest value. The covariance array P of the error is updated by Equation (19).
The EKF-PC is DD, which requires de-rotating in order to compute the update equation. As the phase noise has slow time variance, an approximation can be obtained using the previous estimate of N symbols and de-rotating to obtain an approximation of , as shown in Equation (20). N is called the noise suppression window, which is used to attenuate the effect of AWGN. After this, we enter the judgment module to obtain Equation (21), then proceed to update the equations.
Finally, we present the phase reconstruction procedure proposed in this paper. According to [18], in Equation (6) is not the exact AWGN noise, and is influenced by other factors such as fiber nonlinearity. These are usually contained in AWGN, although their distribution characteristics are completely different from AWGN. In the PS-QAM system, this nonlinearity is more obvious with the increase of SNR. In EKF-CPANE, it can be seen that although we do not consider the effect of fiber nonlinearity here, this factor is included in the actual system modeling.
Our proposed approach focuses on reconstructing this complex as phase noise in order to further avoid the impact of possible erroneous AWGNs in the single results. The corresponding architecture block diagram is shown in Figure 3b.
The single obtained in EKF-CPANE is more affected by AWGN; therefore, we reconstruct the phase noise to improve this method. Compared to EKF-CPANE, EKF-PC reconstructs the phase noise instead of directly using the complex variables to de-rotate . In this way, the results are more effective, and the probability of phase ambiguity can be greatly reduced. From Equation (9), we can see that contains two quantities, the phase noise and the angular error of the AWGN noise ; because of the AWGN, the angular error appears with the same probability on both sides [17]. As we have enough constellation points, we can take the average of these constellation points, which weakens the effect of the AWGN. Then, we can take the obtained real part and pass a noise suppression window of length N, as shown in Equation (22). In this case, the obtained result shows a significant improvement in the effect of AWGN noise. The final estimate obtained in this way is provided by Equation (23).
According to [17], this result can be achieved using Wiener filtering. However, in the actual results we found that this result does not differ very much from that of the averaging window, and introduces additional complexity. For the sake of simplicity, here, we discard the Wiener filter and instead use the averaging window to eliminate the effect of the AWGN.
2.3. Computational Complexity
Computational complexity is a crucial metric for this system, therefore, we compare several recent CPE algorithms that are commonly used and have good recovery effects. We compare the EKF-PC algorithm, Two-stage BPS [19], PCPE, UKF, and MPD-BPS [7]. In terms of computational complexity, they have the following metrics: real additions (ADD), real multiplications (MULT), computation of square root, access look up tables (LUTs), decisions, and comparisons. The results of our comparison are shown in Table 1; we compare the computational complexity required for each block, and N refers to the number of symbols processed by each block.

Table 1.
Computational Complexity of CPR Algorithms.
As can be seen from Table 1, the computational complexity of EKF-PC is only related to the number of symbols processed per block, while the computational complexity of the BPS algorithm additionally depends on the number of test phases . The computational complexity of EKF-PC is comparable to that of the BPS algorithm with ten test phases. However, when the modulation order of PS-QAM modulation rises, the BPS-based algorithm is destined to increase the number of test phases in order to enhance the recovery accuracy, while EKF-PC further sees a further reduction in computational complexity. Meanwhile, the computational complexity of UKF is similar to that of EKF-PC, however, the UKF algorithm has to periodically insert pilots and reduce the information rate. Therefore, for higher-order modulation formats, EKF-PC and UKF provide the same computational complexity. Generally, for higher-order modulation formats, EKF-PC has reduced computational complexity compared to the other methods.
3. Numerical Investigation
3.1. Optimization of Noise Rejection Window N at Fixed SNR
We first numerically investigate the weights of the shaping factor (SF) and noise rejection window to ensure that the maximum AIR is actually obtained. CPEs with long noise rejection windows typically perform well at low signal-to-noise ratios. Although expanding the length of the noise rejection window is profitable for suppressing the effect of AWGN noise, it suppresses the recoverability of the phase noise. At the same time, PS-QAM drastically reduces the probability of peripheral constellation points, which is unfavorable for CPE algorithms that rely on judgments. Peripheral constellation points can improve the accuracy of judgments, making it necessary to find a suitable length for the noise suppression window.
We set up three sets of experiments to find the size of the noise rejection window under different SFs. First, for PS-64QAM, we chose SNRs of 14 dB, 16 dB, and 18 dB for the low, medium, and high SNR scenarios, respectively, and set the transmitter and local oscillator linewidths at 100 kHz. A total of 100 experiments per group were conducted to average the experimental results, using 65,536 symbols per experiment.
The experimental results are presented in Figure 4a,d,g. It can be seen that the recovery effect of EKF-PC is significantly enhanced when increasing the length of the noise rejection windows, and the growth of GMI tends to be flat when the window length reaches about 100. The optimal window length varies for different SNR conditions, with a smaller the SNR requiring a the longer noise rejection window. After the window length reaches the optimal window length at high SNR, the GMI does not improve significantly, and even tends to decrease as the length continues to increase. As shown in Figure 4g, when SNR = 18, the continued increase of the window length after reaching the maximum window length leads to significant degradation of NGMI performance. Similarly, according to Figure 4a,d,g, the optimal noise suppression window lengths for different SFs do not deviate very much, allowing us to determine an approximate optimal window length for different SFs. A reasonable choice of window length improves system performance and reduces computational complexity. For the PS-64QAM, we chose window lengths of 200, 150, and 100, corresponding to 14 dB, 16 dB, and 18 dB, respectively.
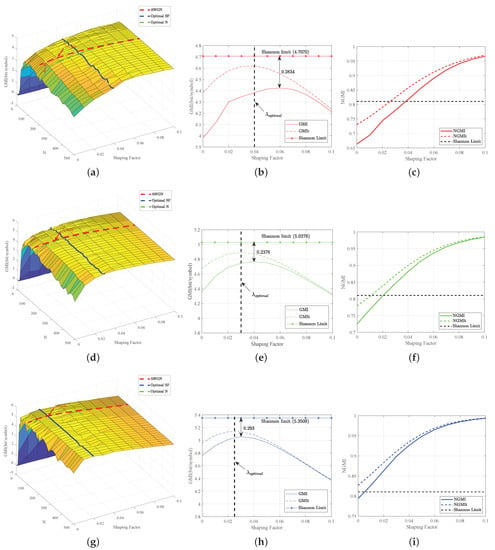
Figure 4.
Optimization results for SNR of 14 dB: (a) GMI performance results as a function of N and SF; (b) GMI performance at optimized N; (c) NGMI performance at optimized N, 16 dB; (d) GMI performance results as a function of N and SF; (e) GMI performance at optimized N; (f) NGMI performance at optimized N, 18 dB; (g) GMI performance results as a function of N and SF; (h) GMI performance at optimized N; (i) NGMI performance at optimized N.
Here, we compare the PS-64QAM CPE performance of EKF-PC for different SFs with SNRs of 14 dB, 16 dB, and 18 dB; the experimental results are shown in Figure 4b,e,h, where the window lengths are chosen following the optimization process in the previous step. It can be seen that the performance of EKF-PC increases with increasing SF, then decreases, and gradually coincides with AWGN after reaching the maximum GMI. In the figure, indicates the SF corresponding to the maximum GMI that can be achieved in the AWGN channel, and indicates the SF corresponding to the maximum GMI that can be achieved by the EKF-PC in a practical situation. The difference between and becomes less with increasing SNR.
From Equation (24), we can find that the achievable information rate is determined by the entropy of the sent symbols, as both the FEC rate and the order of PS-QAM are fixed, denoted as and [20], respectively. Therefore, we can optimize the SF to obtain the maximum entropy under the condition that the NGMI threshold is satisfied, and thus obtain the maximum AIR, which can be improved by the increase of entropy.
The GMI reaches its maximum at an SF of 0.055, and the GMI performance is similarly improved as the noise rejection window becomes longer with SF from 0.01 to 0.05. When the SF increases for the first time, the introduction of PS shaping introduces a large amount of decision error, resulting in degradation of EKF-PC performance. At the same time, in the SF range from 0.01 to 0.05 the noise rejection window is not sufficient to fully offset the penalty due to PS. At this point, increasing the length of the noise rejection window is beneficial and improves GMI performance. When the SF is more than 0.055 the noise rejection ability is greatly enhanced, as the distance between constellation points becomes larger and the decision error is thereby greatly reduced. An excessively long noise rejection window leads to a degradation of EKF-PC performance. Accordingly, the SF that satisfies the NGMI threshold condition becomes smaller when the noise rejection window is in the range of 50 to 200, while the corresponding SF becomes larger when the window length increases to 200 to 300. Similarly, according to Figure 4b,e,h, the SFs that maximize GMI and AIR are different, and theoretically cannot be maximized by probabilistic shaping to make both AIR and GMI at the same time. From Figure 4b,e,h, it can be seen that as the SNR increases the distance between the maximum GMI that can be achieved and the Shannon limit both become wider, while the SF that satisfies the NGMI threshold decreases. As the PS-64QAM gradually reaches its saturation maximum of 6 bits/symbol, the GMI gradually becomes saturated. At this time, the SF gradually tends to 0, the PS constellation tends to a uniform constellation, and the gain of probability shaping is negligible, which indicates that higher-order modulation formats need to be employed. At the same time, it is apparent that at low SNR, such as in Figure 4b,c (SNR = 14), the difference between the SF that reaches the NGMI threshold and that which meets the GMI is small, indicating that the EKF-PC can effectively approach the Shannon limit when the SF is 0.02∼0.035. When the SNR is larger, as in Figure 4e,f,h,i (SNR = 16), the PS-64QAM may produce a significant gap between the AIR and the Shannon limit.
3.2. Comparison of EKF-PC with Variable SFs and Linewidths
As we hope to experimentally obtain the phase recovery capability of the EKF-PC for systems with large phase noise at different SFs, to this end, we investigate the effects of different forming factors, laser linewidths, and decisions on the NGMI for specific SNR conditions. For the PS-64QAM, we vary the NGMI for three scenarios with SNRs of 14, 16, and 18, with shaping factors ranging from 0 to 0.1, and with laser linewidths ranging from 0.5 kHz to 10 kHz. For each experiment, we perform 100 experiments to exclude the influence of accidental results.
The experimental results are shown in Figure 5; the color values in the figure indicate the magnitude of NGMI and the black line in the figure indicates the FEC threshold. It can be observed that increasing the SF increases the linewidth tolerance. As shown in Figure 5a, the EKF-PC is within the NGMI threshold at lower SNR ratios and over a wide range of linewidths by a reasonable choice of SF. Similarly, as shown in Figure 5b,c, the EKF-PC performs well in the medium and high SNR ranges, and both the range of SFs that can be selected and the range of linewidth tolerance increase as the SNR increases. The EKF-PC adapts to a wide range of SNRs and a wide range of SFs, and has a high tolerance for different linewidths.

Figure 5.
NGMI results as a function of SF and laser linewidth at symbol rate 32 GBd, with (a) SNR = 14, (b) SNR = 16, (c) SNR = 18. The black lines show the NGMI threshold.
4. Simulation Setup and Results
Based on VPI Design Suite 11.1, we carried out single polarization 32 Gbaud PS-64QAM under the B2B transmission scenario to verify the correct functioning of the proposed EKF-PC algorithm. We chose the shaping factors of 0.02, 0.03, and 0.035, corresponding to entropies of 5.84, 5.76, and 5.57 bit/symbol, respectively. The experimental setup and the functions of the DSP at the transmitter and receiver ends are shown in Figure 6a. The TX DSP, the function of which is shown in Figure 6b, passes the 65,536 data generated by the PRBS through the CCDM, where the amplitude bits and symbol bits of PS symbols are generated [21]. Subsequently, at the transmitter side, these bits are mapped to PS-64QAM symbols. These symbols are upsampled to two samples per symbol and pass through an RRC filter, where the roll-off factor is chosen to be 0.1. Following this, an ECL laser at 1549.35 nm with a linewidth of 100 kHz is modulated by an electrical signal of 32 Gbaud with an I/Q modulator driven by two arbitrary waveform generators with an output of 92 GSa/s.
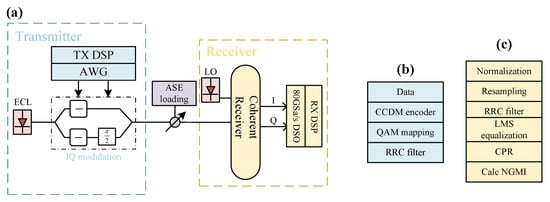
Figure 6.
(a) Experimental setup, (b) transmitter-side DSP flow, and (c) receiver-side DSP flow.
On the receiver side, the SNR of the received symbols is controlled by an amplified spontaneous emission (ASE) loading module. After transmission, the optical signal is coherently demodulated by a local oscillator (LO) with a linewidth of 100 kHz. The electrical signal is digitized by an 80 GSa/s digital storage oscilloscope (DSO) and passed through the Rx DSP, as shown in Figure 6c. The Rx DSP contains the following functions: downsampling, RRC filtering, LMS algorithm adaptive equalization, CPR, and NGMI calculation. The received signal is downsampled from 80 GSa/s to 32 GSa/s, and the roll-off factor in the RRC filter is set to 0.1. After resampling, the signal is recovered by the LMS algorithm and the CPR to obtain the recovered symbols. In this paper, EKF-PC, EKF-CPANE, PCPE, and UKF are used to compare the performance of various CPEs. Finally, the GMI and NGMI performance of various algorithms is obtained based on the comparison of the recovered symbols obtained from different CPEs with the transmitted symbols.
The length of the noise rejection window of the EKF-PC chosen for the experiments was obtained from the simulation experiments described above. The Q and R parameters chosen for the EKF-PC in this article were 0.0001 and 0.00001 [22], respectively.
4.1. Performance of EKF-PC with Variable SFs and SNRs
First, with a laser linewidth of 100 kHz, we investigate the performance of the EKF-PC on PS-64QAM at a variety of SNRs and compare the SNR values required to reach the NGMI threshold at different shaping factors. The experimentally selected noise rejection window was obtained by the the previously described steps and two sets of SFs were selected for comparison, 0.2 and 0.3. The experimental results are shown in Figure 7a, where the solid line indicates the actual results and the dashed line indicates the theoretical values. It can be seen that as the SFs grow progressively larger, the required SNR gradually decreases, that is, the reduction in SF corresponds to an increase in entropy at the cost of an increase in SNR. This indicates that the reduction in SF weakens the system’s noise suppression capability, meaning that the SNR value needs to be increased accordingly in order to achieve the same NGMI threshold. In Figure 7b, the SNR penalty between the EKF-PC and the theoretical value can be clearly observed.
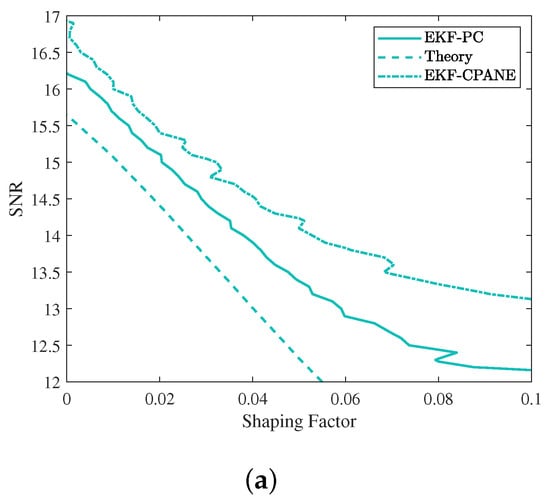
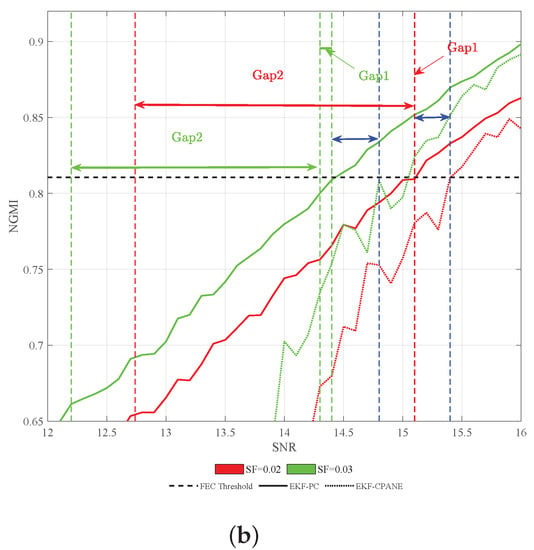
Figure 7.
(a) Theoretical and practical required SNR to meet the FEC threshold and (b) NGMI performance of EKF-PC for the PS-64QAM with various SF and SNR at the 100 kHz combined linewidth.
The experimental results comparing EKF-PC with EKF-CPANE are shown in Figure 7a,b, demonstrating that EKF-PC requires less SNR compared to EKF-CPANE to reach the same NGMI. In Figure 7b, we divide the gap between the theoretically required SNR and the practically required SNR into two parts. The first part Gap1, is due to the presence of phase noise that deteriorates the performance of the EKF-PC, while the second part, Gap2, is from the actual FEC and can be calculated as a constant of about 1.7 dB. The green dashed line in Figure 7 shows the performance curves of EKF-CPANE at both SFs. The blue dashed line in the figure indicates that the performance of EKF-PC is enhanced over EKF-CPANE. It can be calculated that the Gap1 due to the EKF-PC is reduced from 0.3 dB to 0.4 dB compared to the EKF-CPANE. This is a very significant improvement to approach the Shannon limit.
4.2. NGMI Performance
Here, we compare the curves of various NGMI methods under different SNR conditions with four SFs. The tested CPE methods are PCPE, UKF, EKF-CPANE, and the EKF-PC proposed in this paper. The transmission curves and variation of AWGN channels are similar in the experiments due to the absence of the effect of fiber nonlinearity. Increasing the shaping factor decreases the entropy of the constellation and increases the distance between adjacent constellation points, which is more advantageous in reaching a decision, meaning that with a larger shaping factor, a lower SNR can reach the NGMI threshold. For the PCPE method, we inserted three pilot symbols in front of the symbol sequence for the initial state update to avoid cycle slips. When the shaping factor is small, the entropy corresponding to this case is quite high, as in Figure 8a. From the experimental results, it appears that the PCPE outperforms the EKF; however, this turns out not to be true. In the experimental process, when the SNR is low with smaller SFs, PCPE inevitably causes cycle slips, resulting in SNR penalty, while the EKF-PC algorithm does not involve phase unwrapping, avoiding the occurrence of cycle slips while keeping the SNR required to reach the NGMI threshold similar for both methods. Thus, the performance of EKF-PC is slightly better than that of PCPE, and the performance of EKF-PC gradually becomes more superior as the SF increases, as shown in Figure 8b–d. It can be clearly observed that EKF-PC has the best performance among all the compared Kalman CPE methods. As shown in Figure 8, EKF-PC obtains an SNR enhancement of about 0.13–0.5 dB compared to PCPE and at least 0.5–1 dB compared to the other Kalman CPE methods.
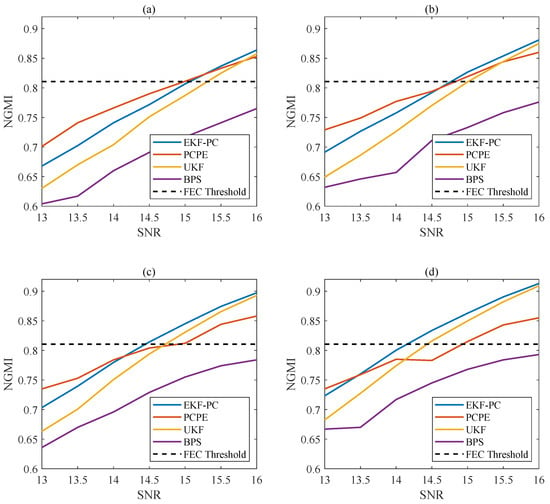
Figure 8.
NGMI performance of the B2B transmission with variable SFs: (a) SF = 0.02, (b) SF = 0.025, (c) SF = 0.03, and (d) SF = 0.035.
5. Conclusions
We propose an EKF-PC algorithm for a PS-QAM carrier recovery with various SFs. The proposed EKF-PC algorithm does not require insertion of pilots, and thus achieves fully blind phase recovery. Furthermore, compared with other Kalman CPE algorithms, EKF-PC has stronger noise immunity, wider linewidth tolerance, and more accurate recovery, making the transmission rate closer to the Shannon limit. We first investigated the effect of the length of the noise rejection window on the algorithm for different SF and different SNR conditions. Subsequently, we performed a joint optimization for SF and window length to obtain the maximum AIR at a fixed SNR. We then carried out performance tests under various SFs and SNRs, and numerically verified the required SNR improvement and linewidth tolerance of the EKF-PC. To validate the proposed EKF-PC algorithm, we simulated a 32Gbaud PS-64QAM with multiple SFs of 0.02, 0.025, 0.3, and 0.035 for B2B transmission. The experimental results show that EKF-PC obtained an SNR enhancement of about 0.13–0.5 dB compared to PCPE and at least 0.5–1 dB compared to other Kalman CPEs. EKF-PC slightly outperforms PCPE and outperforms the other current mainstream Kalman algorithms.
Author Contributions
Conceptualization, S.Z. and J.Y.; Investigation, S.Z. and J.Y.; Writing, S.Z. and J.Y.; Writing—review and editing, S.Z., J.Y. and Z.H. All authors have read and agreed to the published version of the manuscript.
Funding
This research received no external funding.
Institutional Review Board Statement
Not applicable.
Informed Consent Statement
Not applicable.
Data Availability Statement
Not applicable.
Conflicts of Interest
The authors declare no conflict of interest.
Abbreviations
The following abbreviations are used in this manuscript:
| QAM | Quadrature amplitude modulation |
| DSP | Digital signal processing |
| AWGN | Additive white Gaussian noise |
| NLPN | Non-Linear Phase Noise |
| CPE | Carrier phase estimation |
| CPR | Carrier phase recovery |
| QPSK | Quadrature phase shift keying |
| BPS | Blind phase search |
| CS | Cycle slip |
| PS | Probabilistic shaping |
| SNR | Signal-to-noise rate |
| FEC | Forward error correction |
| MI | Mutual information |
| GMI | Generalized mutual information |
| NGMI | Normalized generalized mutual information |
| DD | Decision-Directed |
| SF | Shaping factor |
| LW | Linewidth |
| LUT | Lookup table |
| AIR | Achievable information rate |
| RRC | Root-raised cosine |
| LMS | Least-mean-square algorithm |
| PCPE | Principal component-based phase estimation |
References
- Böcherer, G.; Steiner, F.; Schulte, P. Bandwidth efficient and rate-matched low-density parity-check coded modulation. IEEE Trans. Commun. 2015, 63, 4651–4665. [Google Scholar] [CrossRef]
- Pilori, D.; Bertignono, L.; Nespola, A.; Forghieri, F.; Bosco, G. Comparison of probabilistically shaped 64QAM with lower cardinality uniform constellations in long-haul optical systems. J. Lightw. Technol. 2018, 36, 501–509. [Google Scholar] [CrossRef]
- Fatadin, I.; Ives, D. Laser linewidth tolerance for 16-QAM coherent optical systems using QPSK partitioning. IEEE Photonics Technol. Lett. 2010, 22, 631–633. [Google Scholar] [CrossRef]
- Rozental, V.; Kong, D.; Corcoran, B.; Mello, D.A.A.; Lowery, A.J. Filtered carrier phase estimator for high-order QAM optical systems. J. Lightw. Technol. 2018, 36, 2980–2993. [Google Scholar] [CrossRef]
- Rozental, V.N.; Kong, D.; Foo, B.; Corcoran, B.; Lowery, A.J. Cycle-slip-less low-complexity phase recovery algorithm for coherent optical receivers. Opt. Lett. 2017, 42, 3554–3557. [Google Scholar] [CrossRef] [PubMed]
- Pfau, T.; Hoffmann, S.; Noé, R. Hardware-efficient coherent digital receiver concept with feedforward carrier recovery for M-QAM constellations. J. Lightw. Technol. 2009, 27, 989–999. [Google Scholar] [CrossRef]
- Chen, Z.; Fu, S.; Tang, M.; Zhang, Z.; Qin, Y. Maximum probablity directed blind phase search for PS-QAM with variable shaping factors. Opt. Express 2022, 30, 550–562. [Google Scholar] [CrossRef] [PubMed]
- Zhao, J.; Chen, L. Carrier phase recovery based on KL divergence in probabilistically shaped coherent systems. J. Lightw. Technol. 2021, 39, 2684–2695. [Google Scholar] [CrossRef]
- Mello, D.A.A.; Barbosa, F.A.; Reis, J.D. Interplay of probabilistic shaping and the blind phase search algorithm. J. Lightw. Technol. 2018, 36, 5096–5105. [Google Scholar] [CrossRef]
- Diniz, J.C.M.; Fan, Q.; Ranzini, S.M.; Khan, F.N.; Da Ros, F.; Zibar, D.; Lau, A.P.T. Low-complexity carrier phase recovery based on principal component analysis for square-QAM modulation formats. Opt. Lett. 2019, 17, 15617–15626. [Google Scholar] [CrossRef]
- Pakala, L.; Schmauss, B. Extended Kalman filtering for joint mitigation of phase and amplitude noise in coherent QAM systems. Opt. Express 2016, 24, 6391–6401. [Google Scholar] [CrossRef]
- Liu, S.; Xu, X.; Guo, M.; Tang, X.; Liu, S.; Lu, Y.; Qiao, Y. A pilot-symbols-aided unscented Kalman filter for carrier phase recovery in the wide-linewidth short-range coherent optical transmission systems. Opt. Fiber Technol. 2020, 56, 102208. [Google Scholar] [CrossRef]
- Zhao, J. Format-transparent phase estimation based on KL divergence in coherent optical systems. Opt. Express 2020, 28, 20016–20031. [Google Scholar] [CrossRef] [PubMed]
- Barbosa, F.A.; Rossi, S.M.; Mello, D.A.A. Phase and frequency recovery algorithms for probabilistically shaped transmission. J. Lightw. Technol. 2019, 38, 1827–1835. [Google Scholar] [CrossRef]
- Cho, J.; Schmalen, L.; Winzer, P.J. Normalized generalized mutual information as a forward error correction threshold for probabilistically shaped QAM. In Proceedings of the 2017 European Conference on Optical Communication (ECOC), Gothenburg, Sweden, 17–21 September 2017. [Google Scholar]
- Cho, J.; Winzer, P.J. Probabilistic constellation shaping for optical fiber communications. J. Lightw. Technol. 2019, 37, 1590–1607. [Google Scholar] [CrossRef]
- Ip, E.; Kahn, J.M. Feedforward carrier recovery for coherent optical communications. J. Lightw. Technol. 2007, 25, 2675–2692. [Google Scholar] [CrossRef]
- Essiambre, R.J.; Kramer, G.; Winzer, P.J.; Foschini, G.J.; Goebel, B. Capacity limits of optical fiber networks. J. Lightw. Technol. 2010, 28, 662–701. [Google Scholar] [CrossRef]
- Li, J.; Li, L.; Tao, Z.; Hoshida, T.; Rasmussen, J.C. Laser-linewidth-tolerant feed-forward carrier phase estimator with reduced complexity for QAM. J. Lightw. Technol. 2011, 29, 2358–2364. [Google Scholar] [CrossRef]
- Gené, J.M.; Chen, X.; Cho, J.; Chandrasekhar, S.; Winzer, P. Experimental demonstration of widely tunable rate/reach adaptation from 80 km to 12,000 km using probabilistic constellation shaping. In Proceedings of the Optical Fiber Communication Conference 2020, San Diego, CA, USA, 8–12 March 2020. [Google Scholar]
- Schulte, P.; Böcherer, G. Constant composition distribution matching. IEEE Trans. Inf. Theory 2016, 62, 430–434. [Google Scholar] [CrossRef]
- Li, L.; Feng, Y.; Zhang, W.; Cui, N.; Xu, H.; Tang, X.; Xi, L.; Zhang, X. Extended Kalman filter for carrier frequency offset and carrier phase noise. In Proceedings of the 2017 Conference on Lasers and Electro-Optics (CLEO), San Jose, CA, USA, 14–19 May 2017. [Google Scholar]
Publisher’s Note: MDPI stays neutral with regard to jurisdictional claims in published maps and institutional affiliations. |
© 2022 by the authors. Licensee MDPI, Basel, Switzerland. This article is an open access article distributed under the terms and conditions of the Creative Commons Attribution (CC BY) license (https://creativecommons.org/licenses/by/4.0/).