Article

Surface Measurement of a Large Inflatable Reflector in Cryogenic Vacuum

1
Wyant College of Optical Sciences, University of Arizona, 1630 East University Blvd., Tucson, AZ 85721, USA
2
Department of Astronomy and Steward Observatory, University of Arizona, 933 North Cherry Avenue, Tucson, AZ 85721, USA
3
Large Binocular Telescope Observatory, University of Arizona, 933 North Cherry Avenue, Tucson, AZ 85721, USA
4
L’Garde, Inc., 15181 Woodlawn Avenue, Tustin, CA 92780, USA
5
Northrop Grumman Systems Corporation—Space Sector, 1 Space Park Drive, Redondo Beach, CA 90278, USA
6
Lunar and Planetary Laboratory, University of Arizona, 1629 East University Blvd., Tucson, AZ 85721, USA
*
Author to whom correspondence should be addressed.
Photonics 2022, 9(1), 1; https://doi.org/10.3390/photonics9010001
Submission received: 16 November 2021 / Revised: 15 December 2021 / Accepted: 16 December 2021 / Published: 21 December 2021
(This article belongs to the Special Issue Advances in Optical Metrology)

Abstract

:
The metrology of membrane structures, especially inflatable, curved, optical surfaces, remains challenging. Internal pressure, mechanical membrane properties, and circumferential boundary conditions imbue highly dynamic slopes to the final optic surface. Here, we present our method and experimental results for measuring a 1 m inflatable reflector’s shape response to dynamic perturbations in a thermal vacuum chamber. Our method uses phase-measuring deflectometry to track shape change in response to pressure change, thermal gradient, and controlled puncture. We use an initial measurement as a virtual null reference, allowing us to compare 500 mm of measurable aperture of the concave f/2, 1-meter diameter inflatable optic. We built a custom deflectometer that attaches to the TVAC window to make full use of its clear aperture, with kinematic references behind the test article for calibration. Our method produces 500 × 500 pixel resolution 3D surface maps with a repeatability of 150 nm RMS within a cryogenic vacuum environment (T = 140 K, P = 0.11 Pa).

1. Introduction

Gossamer space structures are not a recent invention. From the Inflatable Aperture Experiment in 1996 to the sunshield assembly of the James Webb Space Telescope, membrane spacecraft assemblies continue to be actively deployed [1]. Up to tens of microns thick, environmentally resistant films such as Mylar and Kapton form large monolithic surface areas. A promising example of future gossamer structures is OASIS, or the Orbiting Astronomical Satellite for Investigating Stellar Systems. OASIS is a proposed ~14 to 20-meter class space observatory that will perform high spectral resolution observations at terahertz frequencies [2]. The advantage for such structures is that they can achieve 7X the collecting area as space observatories with traditionally polished apertures for less than one third of the mass [3]. A spaceborne observatory with a 14 meter diameter size produces a signal-to-noise ratio unobtainable at ground level for far-infrared spectra, enabling the quantitative science of detecting water in distant protoplanetary disks and solar system objects.
For inflatable apertures, technical characteristics of interest include shape response to environmental temperature and pressure, thermal gradients, and puncture by micrometeoroid. Unfortunately, full-field, temporal behavior of inflatable highly aspheric membrane optical surfaces has not been extensively studied in high resolution, no less in a cryogenic vacuum or in puncture.

1.1. Geometrical Shape of Pneumatic Membranes

Two varieties of pneumatic reflectors exist: monolithic membranes and composite gored membranes. This paper concerns the measurement of monolithic membranes, which have higher dynamic slopes than their counterparts stitched from triangular pieces [4]. Monolithic membranes, if composed of ideal mechanically isotropic films, produce a radially symmetric, spherically aberrated shape known as a Hencky Curve Surface [5,6]. In the Zernike description, the Hencky Curve Surface is the sum of defocus and spherical terms. When constructed of real films such as Mylar, pressurization generates astigmatism because manufacturing polymer films imbues different Young’s Moduli across orthogonal axes. At lower pressures, wrinkles sprout from the perimeter of the reflector, introducing higher order spatial frequency errors [7]. These artifacts rapidly diminish at higher pressure because the stress experienced across the entire aperture grows more uniform in all directions under pneumatic loading [8].
In 2019, the University of Arizona constructed a 1 meter surrogate reflector to test optical metrology techniques, shown in Figure 1 [9]. A monolithic, Hencky-forming construction was chosen because of its simplicity and requisite lead time of a gored parabolic assembly. Our requirement for a general metrology technique required capturing surface shapes that are relatively unknown due to latent wrinkles and possible thermoforming variation. We considered tactile solutions such as low-force contact profilometers and confocal probes. However, both systems require a motion travel range at least as large as the unit under test (UUT), and their pointwise, mechanically driven acquisitions would severely limit sampling speed.

1.2. Thermal Vacuum Chamber Testing and Surface Testing

Thermal Vacuum Chamber (TVAC) testing is a regular milestone in space hardware verification; emulating the conditions of device operation in space is important to predict the behavior of hardware already tested on land. Small optical surfaces have been measured through TVAC with careful optomechanical compensation of optical path length [10].
Photogrammetry has also been adopted but is difficult to configure outside-of-chamber because its resolution increases with the distance from cameras to the unit under test and also with the angular subtense between the two cameras and the UUT [11,12]. Finally, specular surface measurement with photogrammetry requires the placement of hundreds of well-placed diffuse fiducials so that higher spatial frequencies are detectable.
Laser radar is a frequency chirped LiDAR technology that has been used in TVAC to measure positions through a TVAC chamber window. However, path lengths must also be carefully compensated, else millimeter-scale errors at multiples of the window length appear [13]. It is our own experience with a Nikon APDIS laser radar metrology system that 800-point sampling across one diameter of the 1 meter prototype takes on the order of 5 min. The duration of point scanning scales linearly with the number of samples, so larger apertures require far more scanning time for equivalent areal sampling density.

1.3. Regular Deflectometry Measurement

The large range of possible inflatable surface shapes, whether gored parabola or monolithic Hencky Curve Surface, compels the use of phase-measuring deflectometry (PMD). The speed at which full-field measurements must be made of a dynamic inflatable surface is not accessible by contact-based methods or interferometry.
Illustrated in Figure 2, PMD is an incoherent measurement technique that has a vast slope measurement range and does not require a physical null. The only hardware required is a spatially modulated light source such as a liquid crystal display (LCD) screen and a camera to observe the reflection of the display at the UUT. Briefly, an imaging camera establishes conjugate imaging with the UUT surface, while the LCD illuminates the UUT aperture with black and white sinusoidal fringes. Advancing the screen pattern by a sequence of fixed phase steps and capturing an image of the UUT at each step, we determine corresponding points between the screen, UUT, and camera as related by the law of specular reflection via a phase-shifting algorithm. Knowledge of these associations allows us to calculate surface slopes. If regions of the UUT are both seen by the camera and illuminated by the source, then those regions are within the range of PMD measurement.
Recently, diverse advances in PMD have enabled the measurement of extremely challenging surfaces. Xu et al. introduced a segmentation-based, data-fusion PMD approach to reconstruct the absolute surface of a monolithic, stepped multi-mirror array [14]. Taking advantage of total internal reflection at a water-air interface, PMD has also been used to measure disturbances of a fluid surface [15]. Willomitzer et al. introduced stitched panoramic measurements of stained-glass windows with a mobile device [16]. PMD for more traditional technical surfaces is well-described in recent literature reviews [17,18].
One instructive representation of deflectometry slope calculation is derived from Ritter’s expression for surface slopes, S y , in the single directional case in y (a similar calculation follows in the x-slopes, S x , shown in Figure 2) [19,20]. The assumptions in the approximation are that the configuration is highly on axis, or z m 2 s     d m 2 s and z m 2 c     d m 2 c , and that the testing distance is very large relative to the sag of the optic, z m 2 s ,   z m 2 c   W ( x m , y m ) .
S y ( x m , y m ) = y m     y s d m 2 s + y m y c d m 2 c z m 2 s     W ( x m , y m ) d m 2 s + z m 2 c     W ( x m , y m ) d m 2 c 1 2 ( y m y s z m 2 s + y m y c z m 2 c )
The assumption of low-order UUT coordinates for surface calculation is not redundant with the result of a physical deflectometry test. This is because the overall sag of the optic plays a tiny role in the slope calculation when z m 2 s ,   z m 2 c   W ( x m , y m ) . When accurate calibration parameters are fed into the slope calculation, accurate slopes across the UUT aperture are sampled. The mid-high spatial frequencies of the UUT’s true shape are revealed in the final surface height maps, which were not modeled in the virtual null [21].
For absolute surface reconstruction accuracy, calibration is critical and requires measuring the spatial positions of the camera pinhole, screen, and UUT. To illustrate the influence of measurement errors during calibration, we can modify expression (1) for calculating S y   ( x m , y m ) with the calibration errors terms ε y , m , ε y , s , ε y , c , ε z ,   m 2 s , and ε z , m 2 c .
S y ( x m , y m ) 1 2 ( ( y m + ε y , m ) ( y s + ε y , s ) z m 2 s + ε z , m 2 s + ( y m + ε y , m ) ( y c + ε y , c ) z m 2 c + ε z , m 2 c )
Non-zero values of ε y , m , ε y , s , ε y , c produce erroneous slope deviation from the true slopes. Surface reconstruction with these lateral calibration errors is akin to miscalculating power in the tangential meridional plane, but not additional power in the sagittal plane (i.e., the x-slopes, S x ); hence, excess astigmatism is embedded into the measurement. Similarly, a miscalibration in longitudinal coordinates ε z , m 2 s and ε z , m 2 c produces equal slope deviation across both planes, so power error is imbedded into the surface reconstruction.

2. Theory and Simulation for Deflectometry Measurement

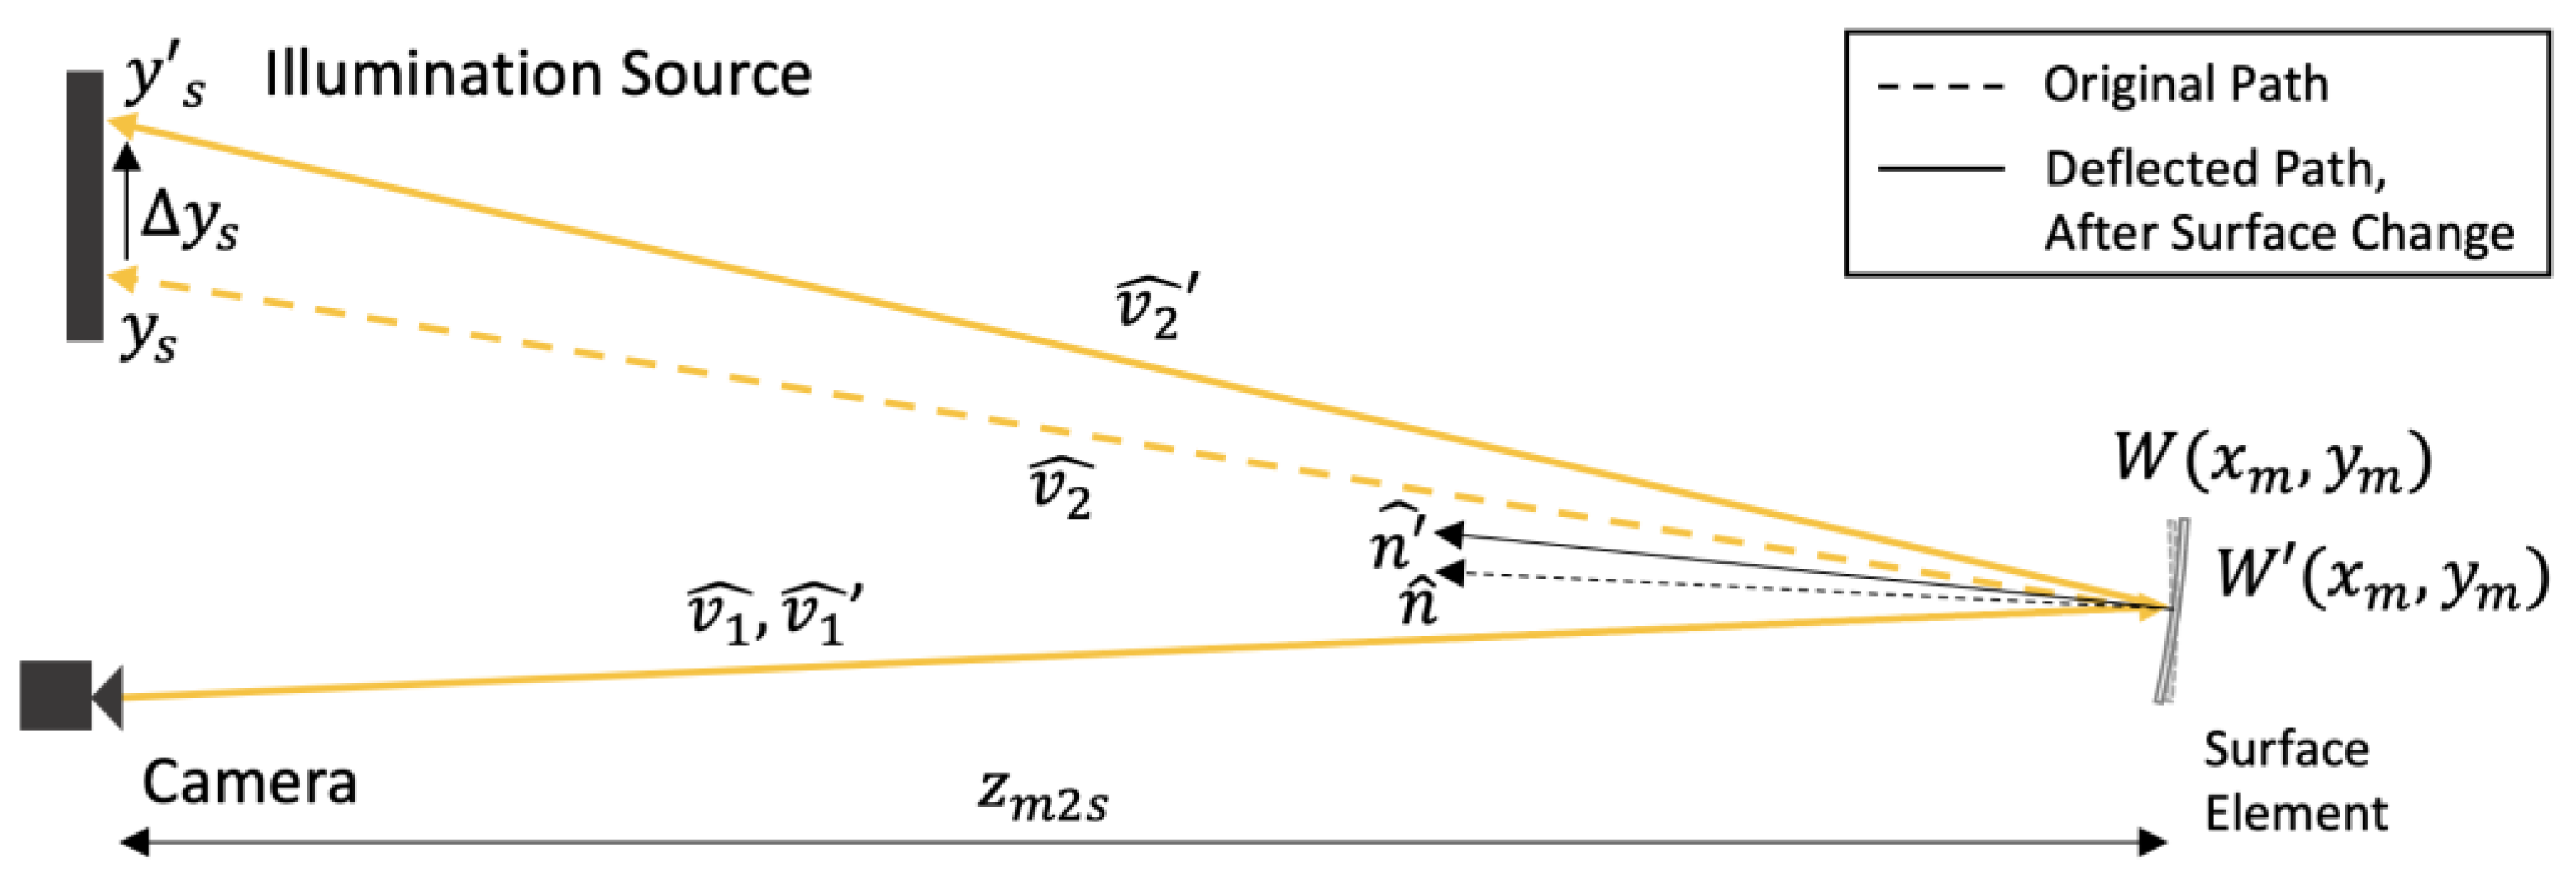
2.1. Differential Deflectometry Measurement

While calibration errors produce low-frequency figure errors in absolute measurements, the subtraction of two deflectometry measurements that use identical calibration parameters produces a high-fidelity shape difference [22]. In Figure 3, a small internal pressure adjustment causes the surface shape change to from W ( x , y ) to W ( x , y ) , surface normals from n ^ y to n ^ y , and difference in surface slopes Δ S y = S y S y and Δ S x = S x S x .
If we take the difference of two deflectometry measurements from the same hardware configuration and calculated with the same calibration parameters, we will find that the influence of the calibration measurement error is largely removed. The next expression (3) illustrates this error removal.
Δ S y ( x m , y m ) = S y ( x m , y m ) S y ( x m , y m ) = 1 2 [ ( y m + ε y , m ) ( y s + ε y , s ) z m 2 s + ε z , m 2 s + ( y m + ε y , m ) ( y c + ε y , c ) z m 2 c + ε z , m 2 c ] 1 2 [ ( y m + ε y , m ) ( y s + ε y , s ) z m 2 s + ε m 2 s + ( y m + ε y , m ) ( y c + ε y , c ) z m 2 c + ε m 2 c ] = y s y s 2 ( z m 2 s + ε z , m 2 s )
In successive measurements of an inflated optic, y m = y m , y c = y c , and z m 2 c = z m 2 c because the positions of the camera pinhole and UUT aperture do not change between acquisitions. Similarly, all calibration measurement errors ε y , m , ε y , s , ε y , c , ε z ,   m 2 s , and ε z , m 2 c are identical between S y ( x m , y m ) and S y ( x m , y m ) because they share the same hardware configuration and use the same calibration parameters during calculation. Simplifying the expression by cancelling identical variable pairs, the slope change Δ S y is dominated by the difference of the deflected ray intercepts, Δ y s = y s y s , and the distance from the UUT to the screen, z m 2 s .
Longitudinal calibration measurement uncertainty ε z , m 2 s directly influences the slope difference calculation. However, the uncertainty is conservatively constrained to ε z , m 2 s = 10 μm when using a common laser tracker. We calculate the induced defocus error as Δ W 020 = 1 / 8 ( f # 2 ) ε z , m 2 s = 312.5   nm , or equivalently,   Z 4 = 1.08   μm PV for the f/2 optic [23]. If one’s objective is to calculate the shape change of an inflatable UUT surface when internal pressure, external environment, or even internal gas composition are altered, then the differential deflectometry method is well-poised for the task.

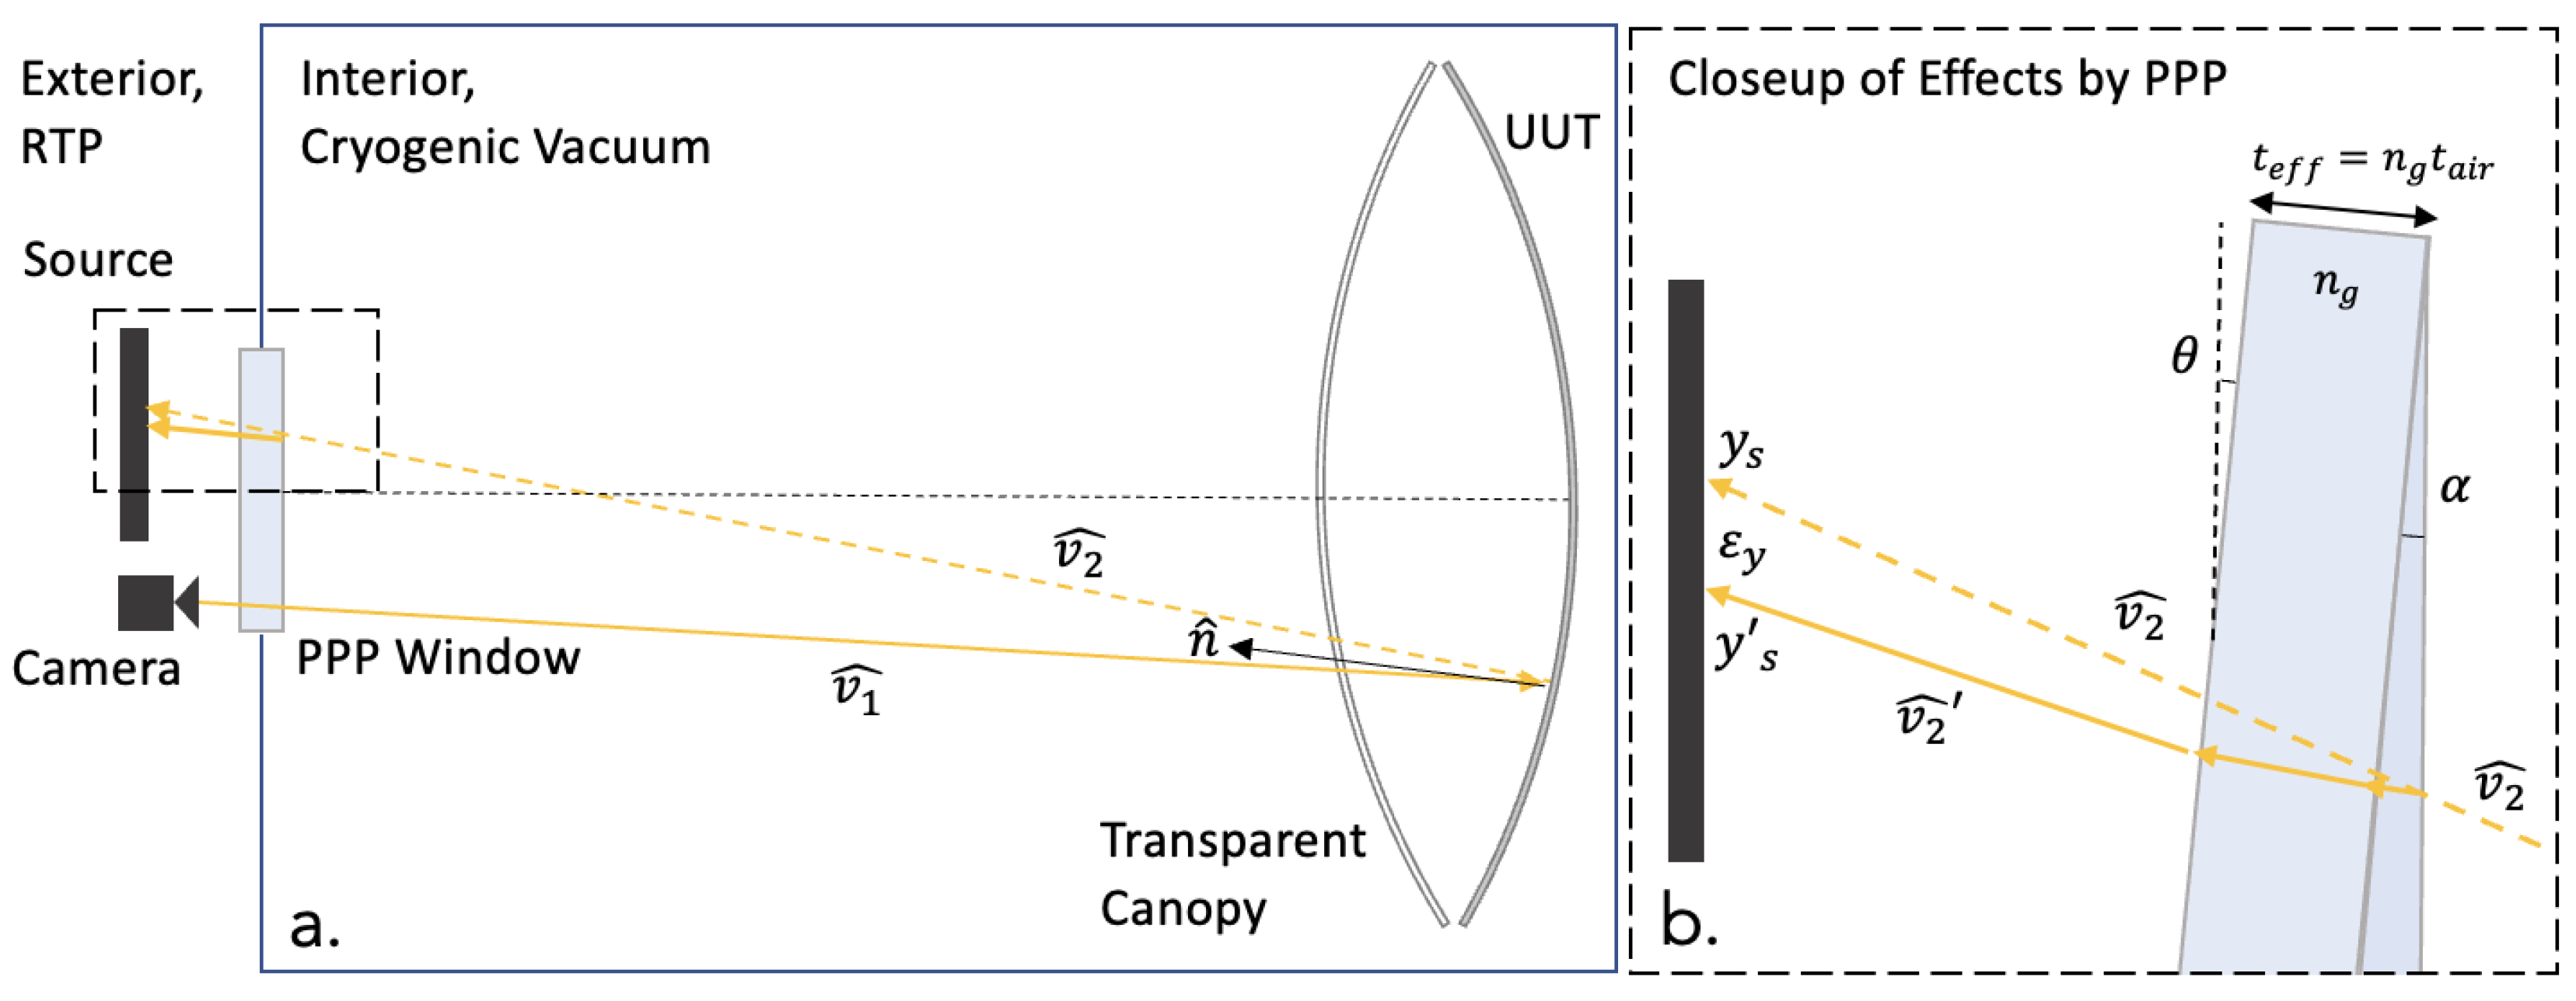
2.2. Unique Geometry of Thermal Vacuum Chamber

An ordinary deflectometry configuration has no intermediate surface interactions between the light source and the UUT and from that UUT to the camera entrance pupil. In a modified configuration through a TVAC window for an inflatable reflector, we have additional refractive surface interactions to consider: those at a plane window, a thin transparent convex canopy, and then backwards through these components. These interactions introduce geometric ray deviations whose influence must be considered in the context of shape reconstruction and are shown exaggerated in Figure 4.
The existing viewport into Northrop Grumman’s TVAC, a plane window, is used to peer into the interior of the chamber volume. The 11.8” (300 mm) diameter plate is 9.14 mm thick and modeled with the properties of fused silica. The glass plate is bolted through thru-holes onto the chamber, atop a 10” (254 mm) steel circular aperture, essentially loading the glass like a simply supported circular plate.
First, we consider the 2 mil (50.8 µm) clear canopy in front of the optic being tested. The canopy is thin, assumed to have uniform thickness, and not considered, given the 4 meter scale of the test configuration. We consider the influence of the plate far larger. An ideal, unloaded plane parallel plate (PPP) introduces defocus to an imaging configuration. Refocusing the camera re-establishes conjugate imaging between the detector and the UUT surface, but the deviation from an interrupted ray path between the camera and the UUT still exists. First, the longitudinal displacement of a PPP with thickness t and refractive index n = 1.46 that affects the deflectometry calculation is given by Smith [24].
ε P P P , t h i c k n e s s = t ( n 1 ) n
Calculating the deflectometry measurement with an uncompensated ε P P P , t h i c k n e s s reduces the power of the reconstructed surface because the image points are physically displaced in the longitudinal direction from the value (measured during calibration) of the camera stop position. Next, if the ideal plate is tilted relative to the incident ray at angle θ from the PPP normal, the transverse ray displacement is ε P P P , t i l t [24].
ε P P P , t i l t = t · s i n ( θ ) [ 1 1 s i n 2 θ n 2 s i n 2 θ   ] t θ ( n 1 ) n
If two rays of different incidence angles, θ and θ , intercept the refractive plane plate at the same position, they will emerge separated by ε P P P , t i l t . Inherent parallelism error, or wedge, also induces angle-dependent errors. If we have wedge in the plate, we take the formalism of prism deviation and multiply by d = 100 mm, the distance from the plane window to the screen, to find the transverse error contribution towards the deflected ray intercept y s at the screen [24].
ε P P P , w e d g e α d ( n 1 ) [ 1 + θ 2 ( n + 1 ) ( 2 n ) ]
Now because of the difference between external room temperature and pressure (RTP) and internal TVAC environmental conditions, the pressure gradient deforms the shape of the window rear into a meniscus with weak curvature [13].
R ( Δ p ) = 4 E t 3 3 ( 1 ν ) ( 3 + ν ) a 2 Δ p
With the vacuum pressure differential, a meniscus is formed. Using plate thickness t = 9.14   mm , Poisson’s ratio ν = 0.15 , plate radius a = 127   mm , Young’s Modulus E = 72   GPa , and pressure differential Δ p   100 , 000   Pa , this results in the radius of curvature R o C = 16.7   m .
Compared to a ray refracting through two parallel flat interfaces, a ray refracting through two curved interfaces will generally possess a different ray slope than when it had entered. For example, an extreme ray from the edge of the 1 m UUT intercepts the center of the first window surface at a 10.5 ° angle of incidence (AOI) relative to the optical axis of the UUT. Refracting and propagating through 9 mm of glass, it exits the second surface into air at 10.4983 ° , a 6 arcsecond difference from the initial AOI. In absolute deflectometry measurements, the holistic effect is that the meniscus window will induce spatially varying error in slope, manifesting as excess defocus and spherical aberration in the integrated height. Trigonometric raytracing is required to discover and compensate for these absolute errors.
For differential deflectometry measurements, the influence of the meniscus is minimized by the subtraction of two measurements. Incrementally inflated or perturbed surfaces still deflect rays through similar angles and surface interception AOIs, especially for the two slow RoC = 16,700 mm surfaces, so we do not consider them in this analysis of differential shape change.

2.3. Plane Parallel Plate Geometry with Differential Deflectometry

For an absolute deflectometry surface measurement, we observe that a measurement of the deflected ray intercept at the screen and plate thickness must compensate for the transverse error quantities ε P P P , t i l t , ε P P P , w e d g e , and ε P P P , t h i c k n e s s . We can rewrite the expression for the true slope S y ,   t r u e in terms of the measured screen deflection intercept y s ,   m e a s and the error terms, which can be dependent on the angle between the deflected ray v 2 from the UUT relative to the plate normal.
S y , t r u e = y s , m e a s     ε P P P , w e d g e ( v 2 ) ε P P P , t i l t ( v 2 ) 2 ( z m 2 s   ε P P P , t h i c k n e s s )
Subtracting slope two measurement calculations, afforded by the knowledge that there was no change in system configuration or calibration, we obtain a new expression,
                                    Δ S y , t r u e = ( y s , m e a s , 2 y s , m e a s , 1 ) Δ ε P P P , w e d g e ( v 2 , v 2 ) Δ ε P P P , t i l t ( v 2 , v 2 ) 2 ( z m 2 s ε P P P , t h i c k n e s s )
The vector v 2 denotes the new vector from a second measurement. The induced errors in wedge and tilt are functions of both v 2 and v 2 . We next express the angles between the plane window and v 2 and v 2 as θ v 2 and θ v 2 .
Δ S y , t r u e = ( y s , m e a s , 2 y s , m e a s , 1 ) α d ( n 2 1 ) 2 n ( θ v 2 2 θ v 2 2 ) t ( n 1 ) n ( θ v 2 θ v 2 ) 2 ( z m 2 s t ( n 1 ) n )
In this expression, the wedge term is insignificant and can be ignored because plane glass plates can routinely achieve α < 5 arcmin, and the difference of θ v 2 2 and θ v 2 2 ; will also be insignificant. As for the tilt term, the difference quantity θ v 2 θ v 2 is approximately twice that of our measurand of interest, Δ S y . To show this, we begin with the observation that for small angles θ v 2 v 2   ,   so θ v 2 θ v 2 v 2 v 2 = Δ v 2 . For example, the slope difference at the aperture edge of a f/3 optic ( = 1000   mm ) inflated to a steep f/1 mirror is 175 mrad yet produces only 1.8 mrad of error with this approximation. Next, we observe that S y n ^ y , so Δ S y = Δ n ^ y because the surface normal is always perpendicular to the surface tangent. Since an angle change θ in surface normal n ^ produces twice the deviation in the deflected ray slope, Δ v 2 = 2 Δ n ^ y = 2 Δ S y . Thus, θ v 2 θ v 2 Δ v 2 = 2 Δ S y . Now substituting,
Δ S y , t r u e = y s , m e a s , 2 y s , m e a s , 1 2 ( z m 2 s 2 t ( n 1 ) n )
Taking two measurements of a common aperture with equivalent static calibration, we calculate differential measurement results even with the introduction of a plane parallel plate. We see that the overall influence of a window, modeled as a plane parallel plate, is to reduce the magnitude of the ray deflection and is compensated in the denominator of the differential slope calculation Δ S y , t r u e , and similarly so for Δ S x , t r u e . With both surface slopes obtained, surface integration obtains the induced sag difference between the two measurements of the inflated optic.

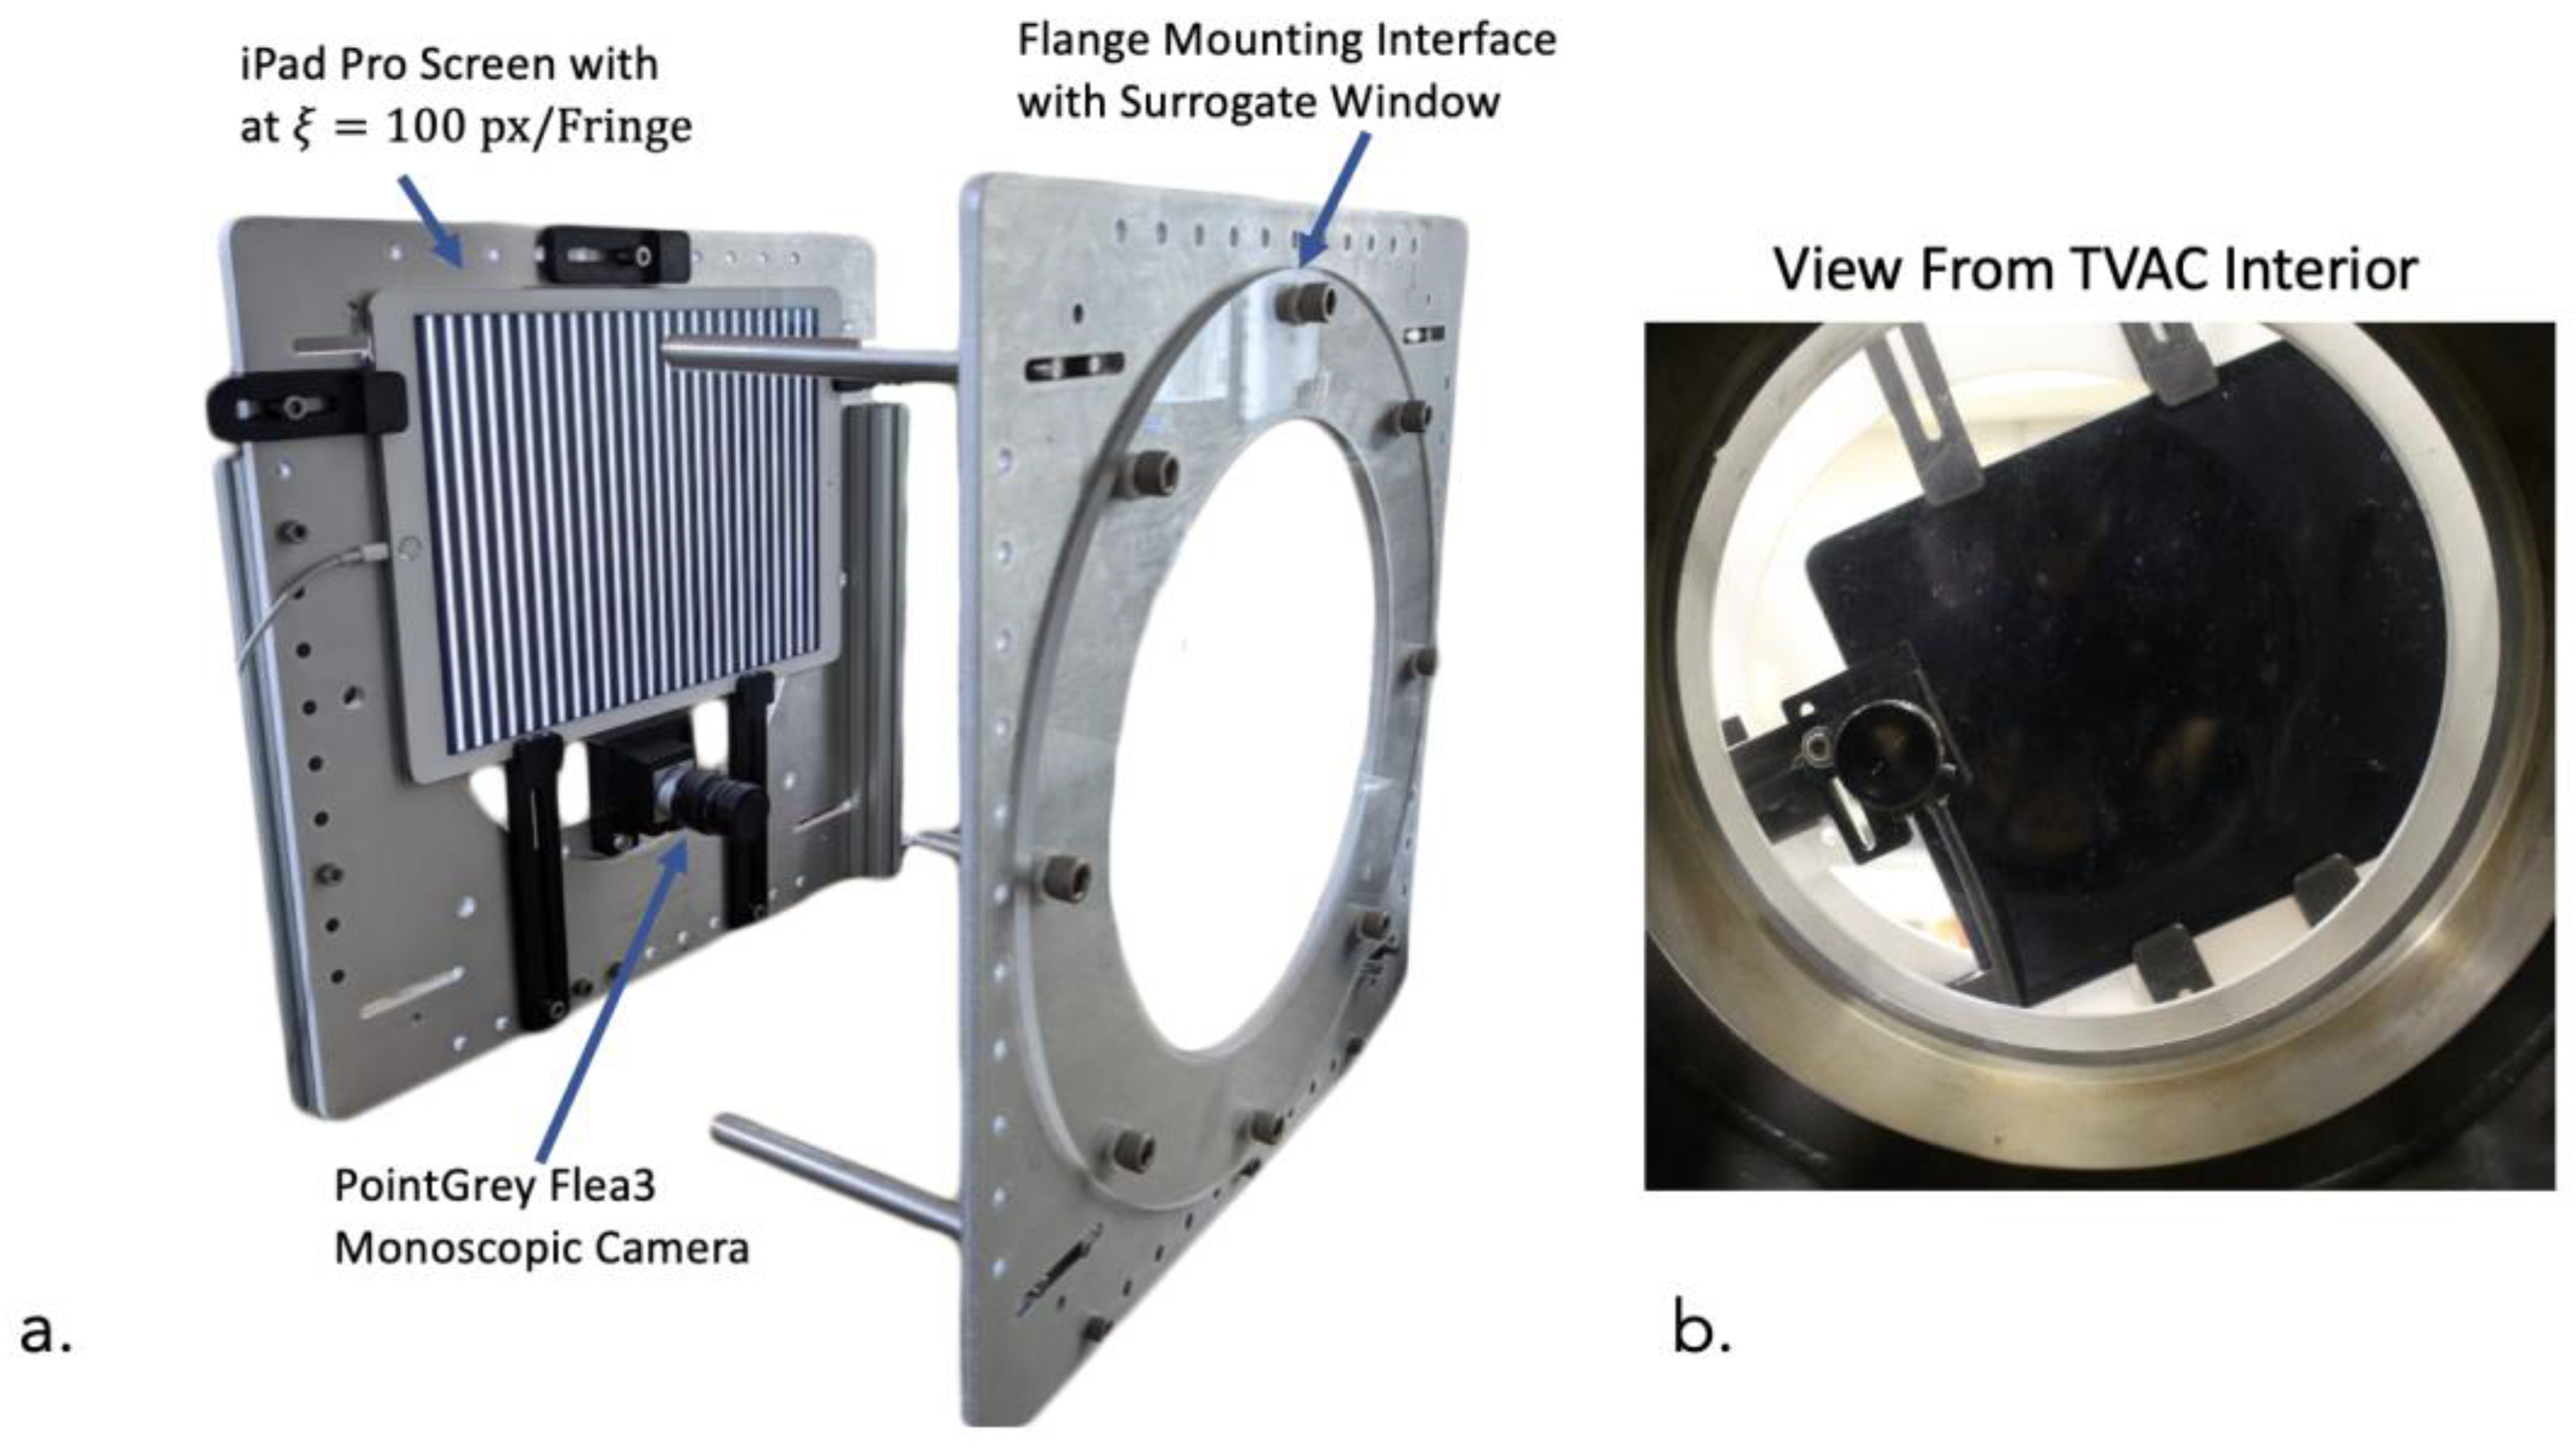
3. Experimental Setups

For TVAC testing, the Mylar sheets of the 1 m UUT were replaced with new 2 mil thick material, seen in Figure 5. Team members iteratively pulled the circumference of the membrane taut to achieve subjectively uniform edge loading. In our experience, non-uniform tensioning forms visible wrinkles. Uniformity can be quantified by sampling the boundary with sensitive force gages for iterative adjustment, but that procedure was not performed for this experiment. After clamping, the UUT was mounted in a custom optomechanical mounting fixture with 3 degrees of freedom [25]. A fixed mechanical datum consisting of three spherical steel tooling balls was placed behind the reflective surface.
A deflectometer, shown in Figure 6, was specially designed to mount to the TVAC window at eight flange bolts. The system consisted of a 12.9” (328 mm) iPad Pro (#A2378) illumination source, a Point Grey monochrome camera (FL3-U3-13Y3M-C) with a f = 12 mm lens, and machined aluminum baseplate frame. Several degrees of tilt and decenter adjustment permitted alignment to the TVAC window for maximum reconstruction signal capture.
Outside the chamber volume, a vacuum inflation control unit provided by FreeFall Aerospace set the internal UUT pressure to a resolution of 10 Pa. The internal pressure was nominally set to 520 Pa relative to the chamber-controlled environmental pressure, which ranged from atmospheric (~100,000 Pa) to near-vacuum (0.11 Pa). In Figure 7, the view of the UUT in its mounting fixture as well as the deflectometer mounting are apparent. Calibration was performed with a Leica laser tracker and spherically mounted retroreflectors (SMRs). The calibration procedure obtained the distances between SMR references at the “X”-like tabs of the UUT tensioning ring, the aluminum tensioning frame plane, the plane of the window, the camera, and the iPad illumination screen plane.

4. Experimental Results

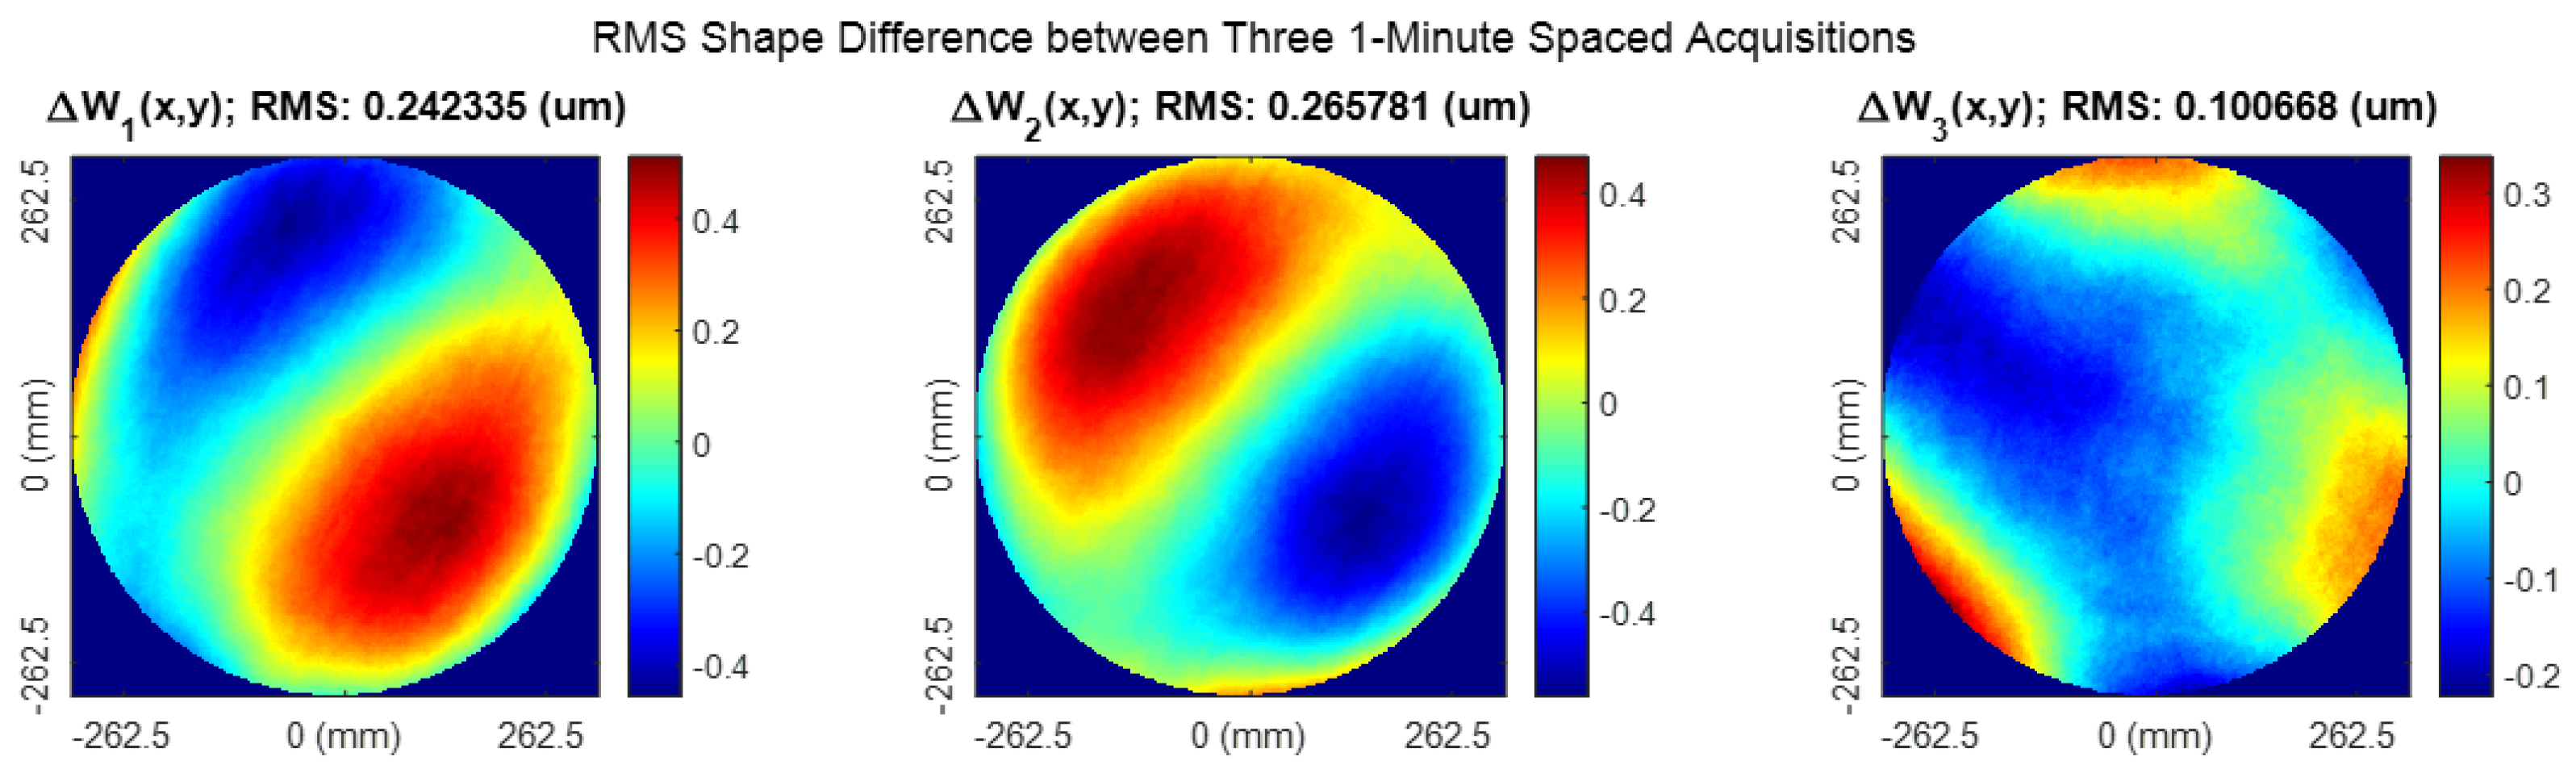
4.1. Deflectometer Repeatability Measurements

Testing took place over one week at the Northrop Grumman Space Systems facility in Redondo Beach. Over 80 surface measurements were taken of the same surface, subject to a variety of environmental setpoints within TVAC. At each fresh inflation of the membrane, the membrane vertex was brought into contact with the rear mechanical datum and then the external pressure control unit stepped back inflation pressure by 10 Pa until the surface no longer contacted the mechanical datum. For an Argon gas fill, an internal pressure of 700 Pa, chamber pressure of 0.11 Pa, and chamber temperature of 137 K, the total RMS difference across the surface was about 100–250 nanometers, shown in Figure 8. This repeatability is a fraction of the wavelength for the smallest band of interest for OASIS’s terahertz optics, ~80 µm [3].
Among all perturbed measurements of the f/2 optic, no more than 600 mm of the diameter was both illuminated by the screen and captured by the camera. The steep inflated state was demanded by the f/# design regime relevant to the OASIS full-sized primary reflector. The common area was cropped to about 525 mm in these measurement maps and all subsequent maps for direct comparison of shape change. A larger measurement area range is limited by the size of the TVAC window, which constrains the slopes measurable by the deflectometry system. A larger window can extend the dynamic measuring slope range at the cost of additional window thickness to maintain structural requirements for a large vacuum chamber.

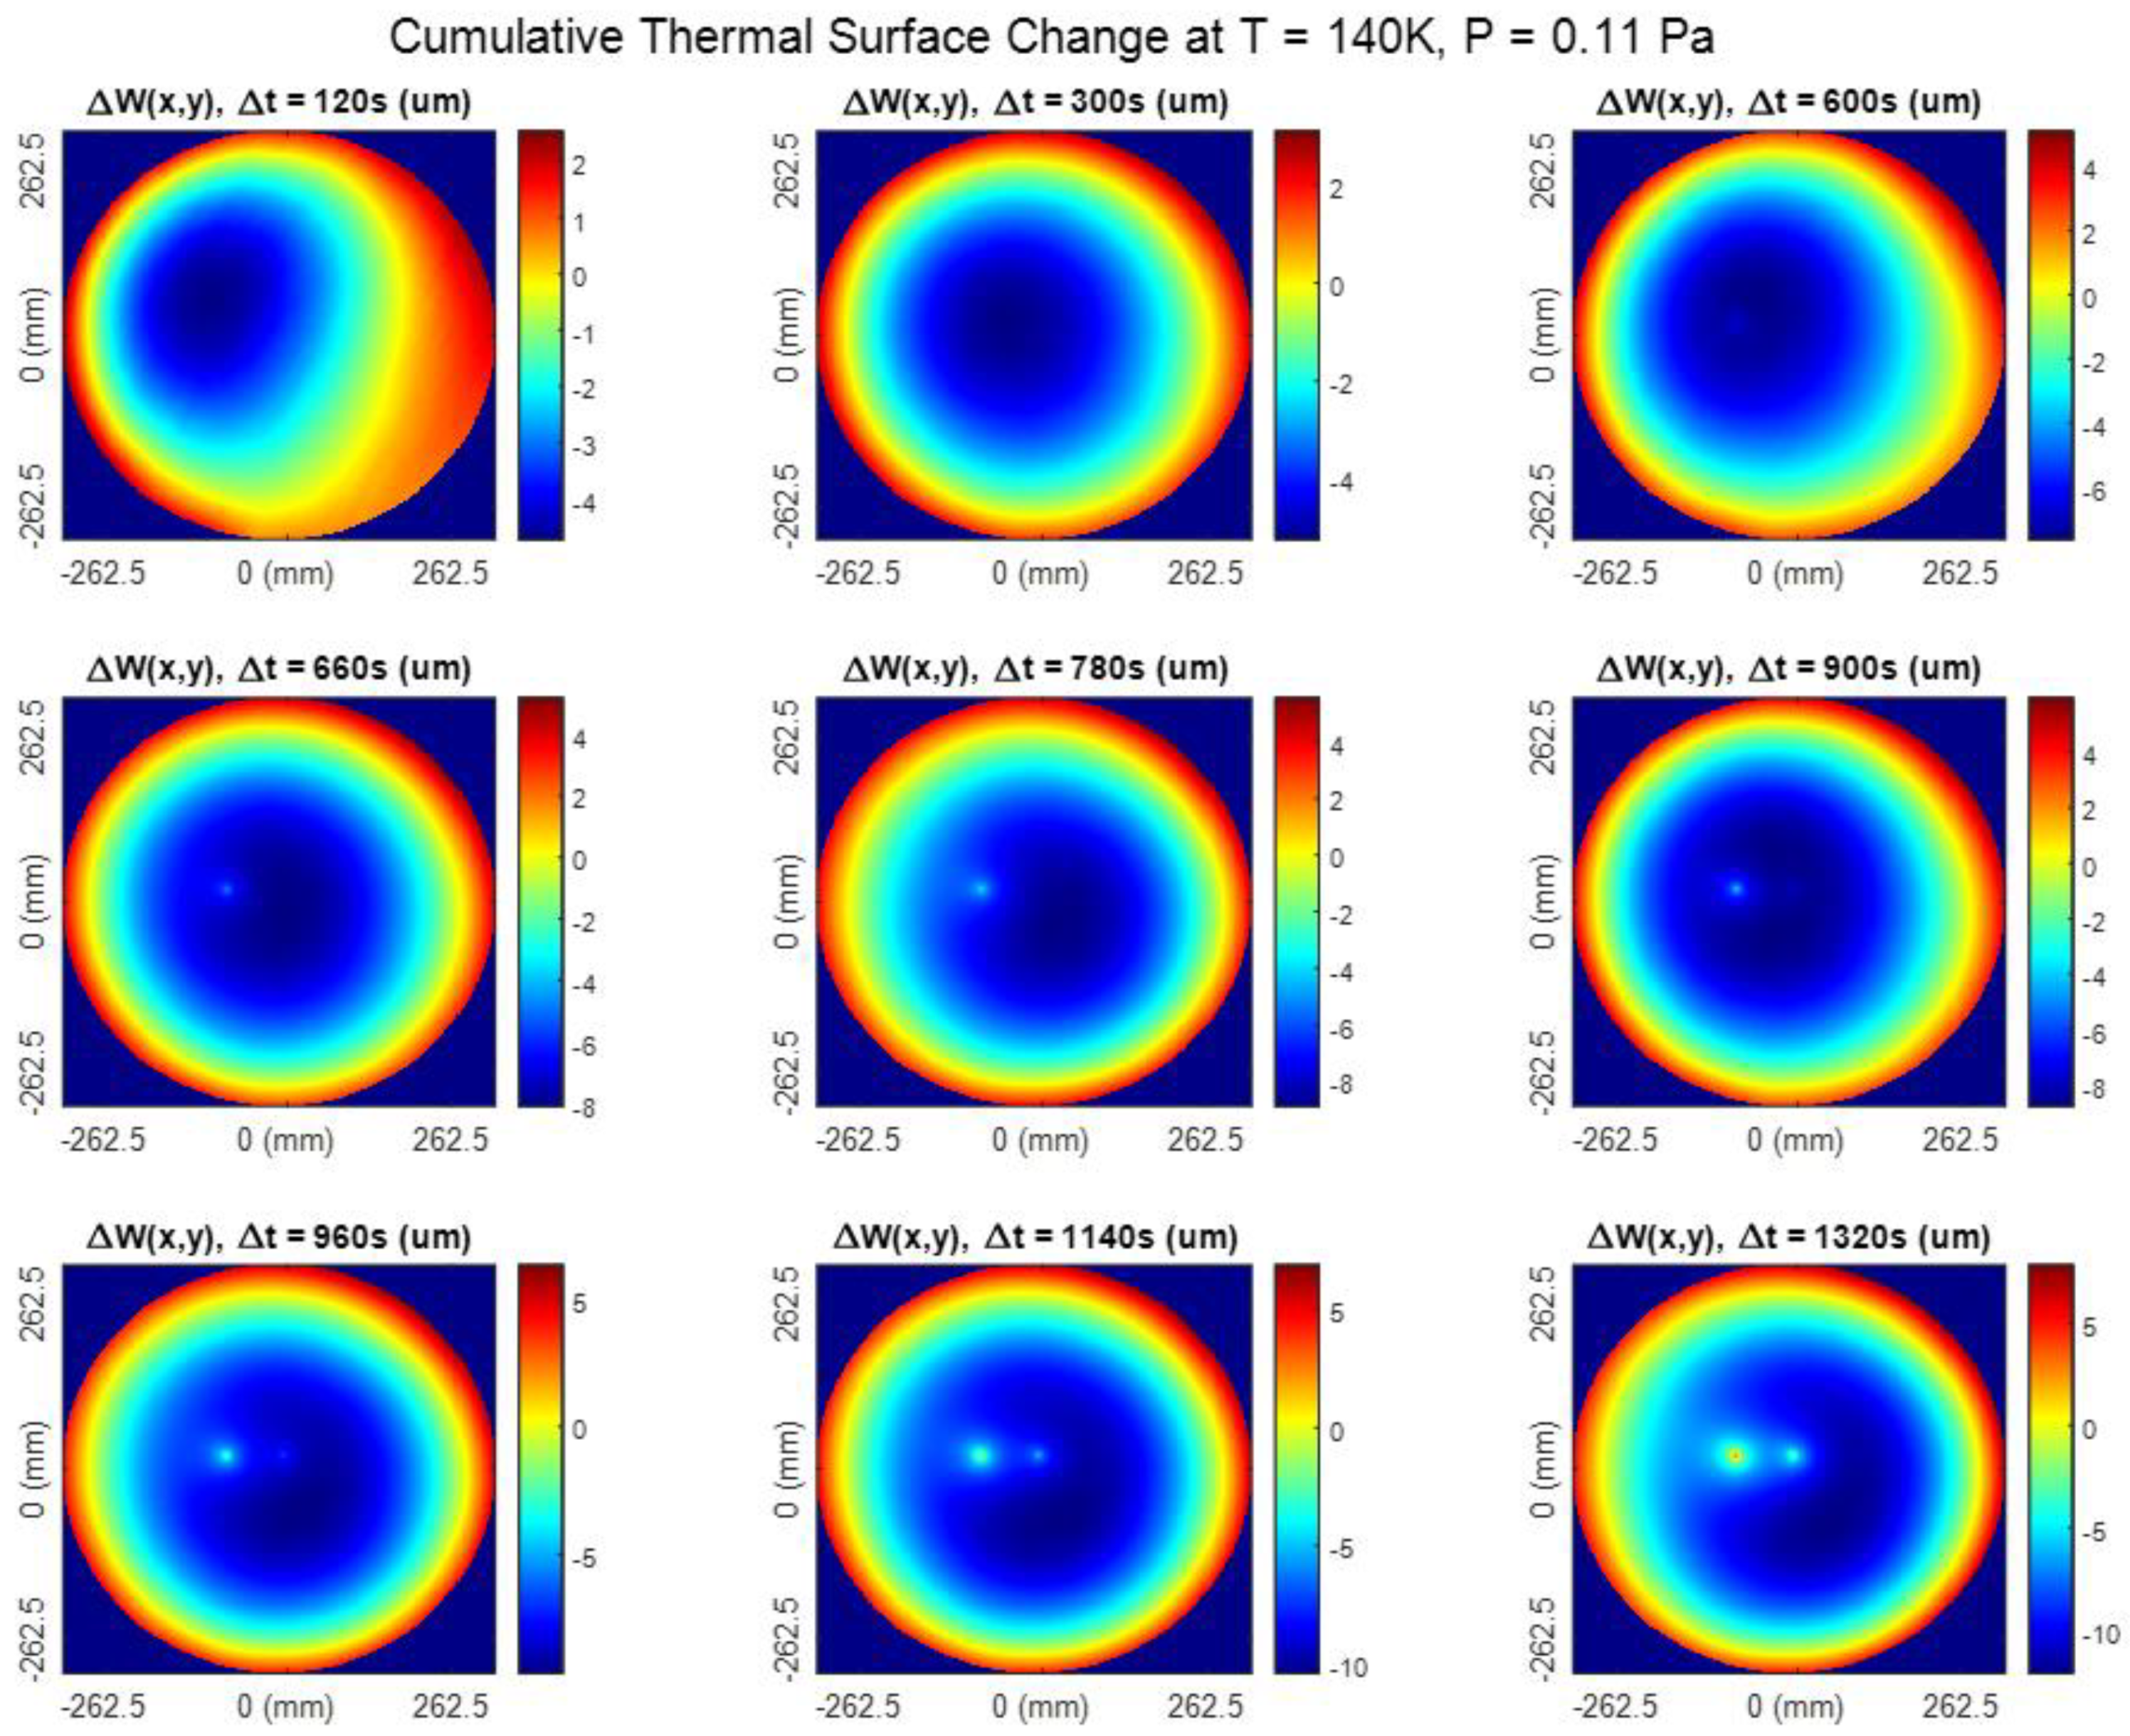
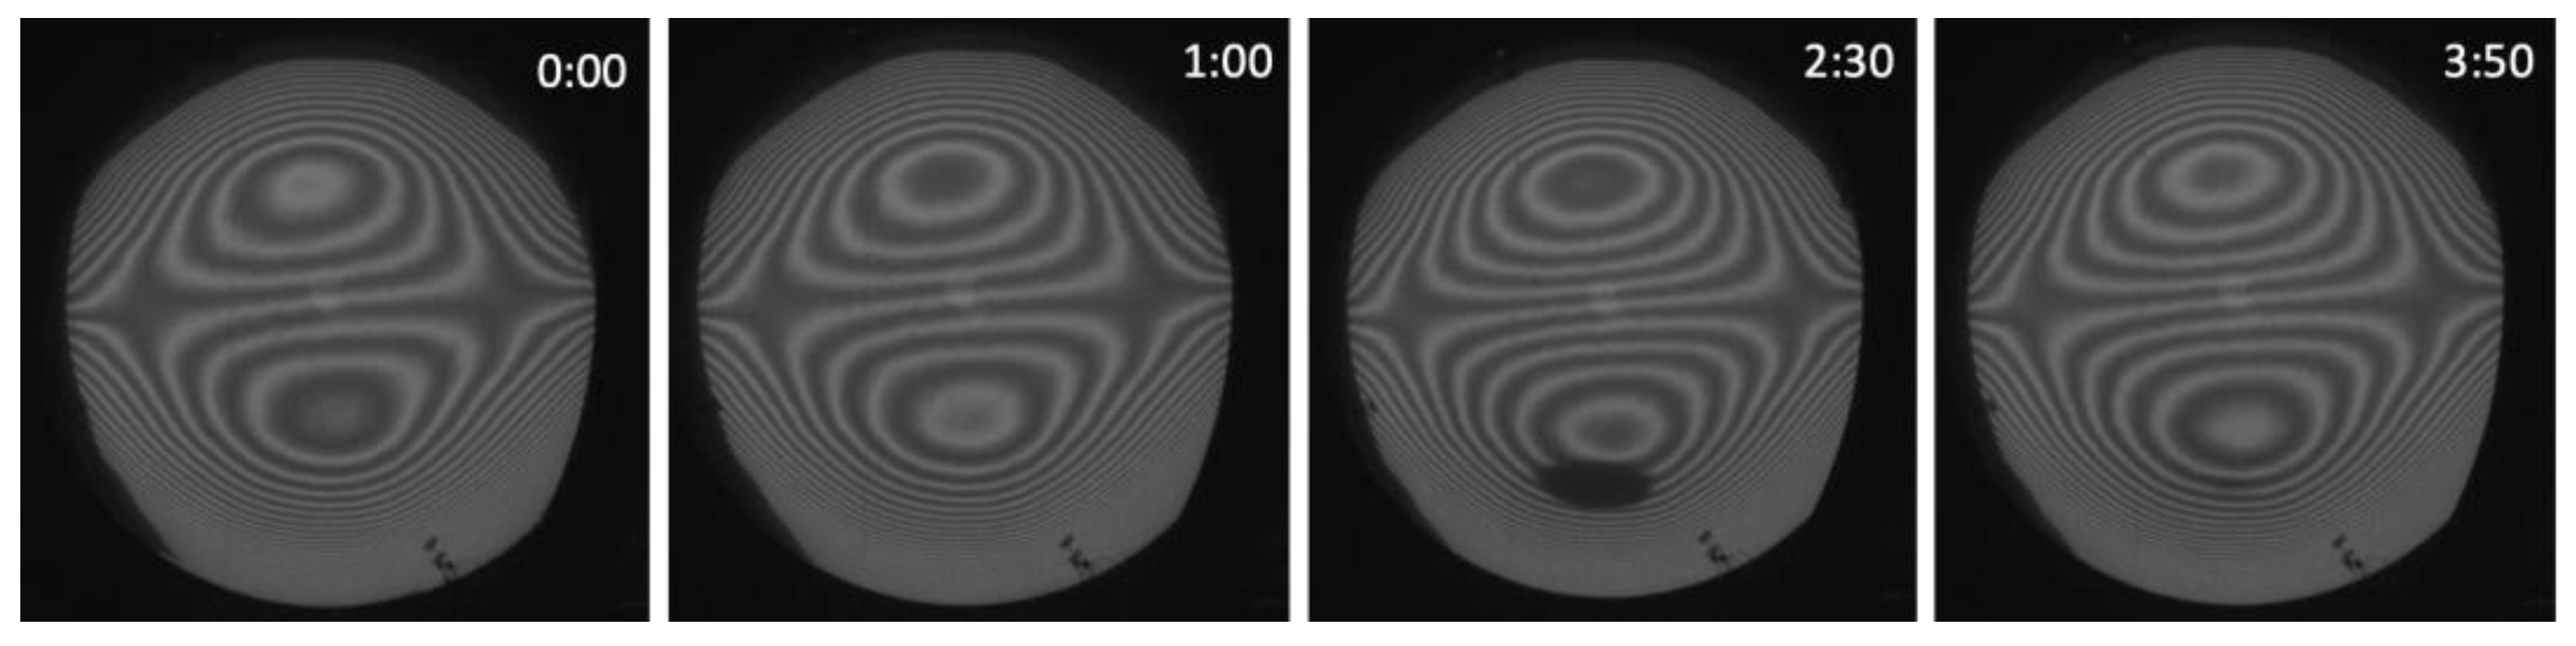
4.2. Induced Thermal Gradient by Artifical Sun

A small overhead heat source (or ‘Artificial Sun’) illuminated the membrane assembly half a meter away. The source was positioned closest to the aperture’s 12 o’clock position (north). Chamber temperature was set to T = 142 K and pressure P = 0.11 Pa was enforced. Once the radiation source was turned on, the reflective Mylar surface began warming. Four T-type thermocouples were attached at the four cardinal points near the tensioning ring periphery of the back membranes. For the next half hour, the temperature detected at each sensor rose by 1 K for the east, west, and south thermocouples, but rose by 5 K for the north sensor, which was closest to the UUT.
Cumulative thermal change resulted in a predominantly surface change in power, as shown in Figure 9. This is the surface response to transient conduction across the large, thin metallized surface and dimensional lengthening of the material with heat. Spatial asymmetry, seen at surface change map at Δ t = 120 s, damped out towards Δ t = 600   s , where the vertex of the concave surface began contacting one of the spherical datums behind the UUT. The protruding surface point in front of the leftmost ball is the most visually apparent feature as a consequence of the thermally induced material expansion.
Eventually, the two outermost balls of the physical reference fiducial are visible by Δ t = 1320 s. Finite friction on the reflective membrane back surface prevents the outer two balls from slipping and obscures the influence of the central ball. The high sensitivity and precision of differential deflectometry towards radiation-induced effects suggest that it will be an asset to space system surface metrology and calibration.

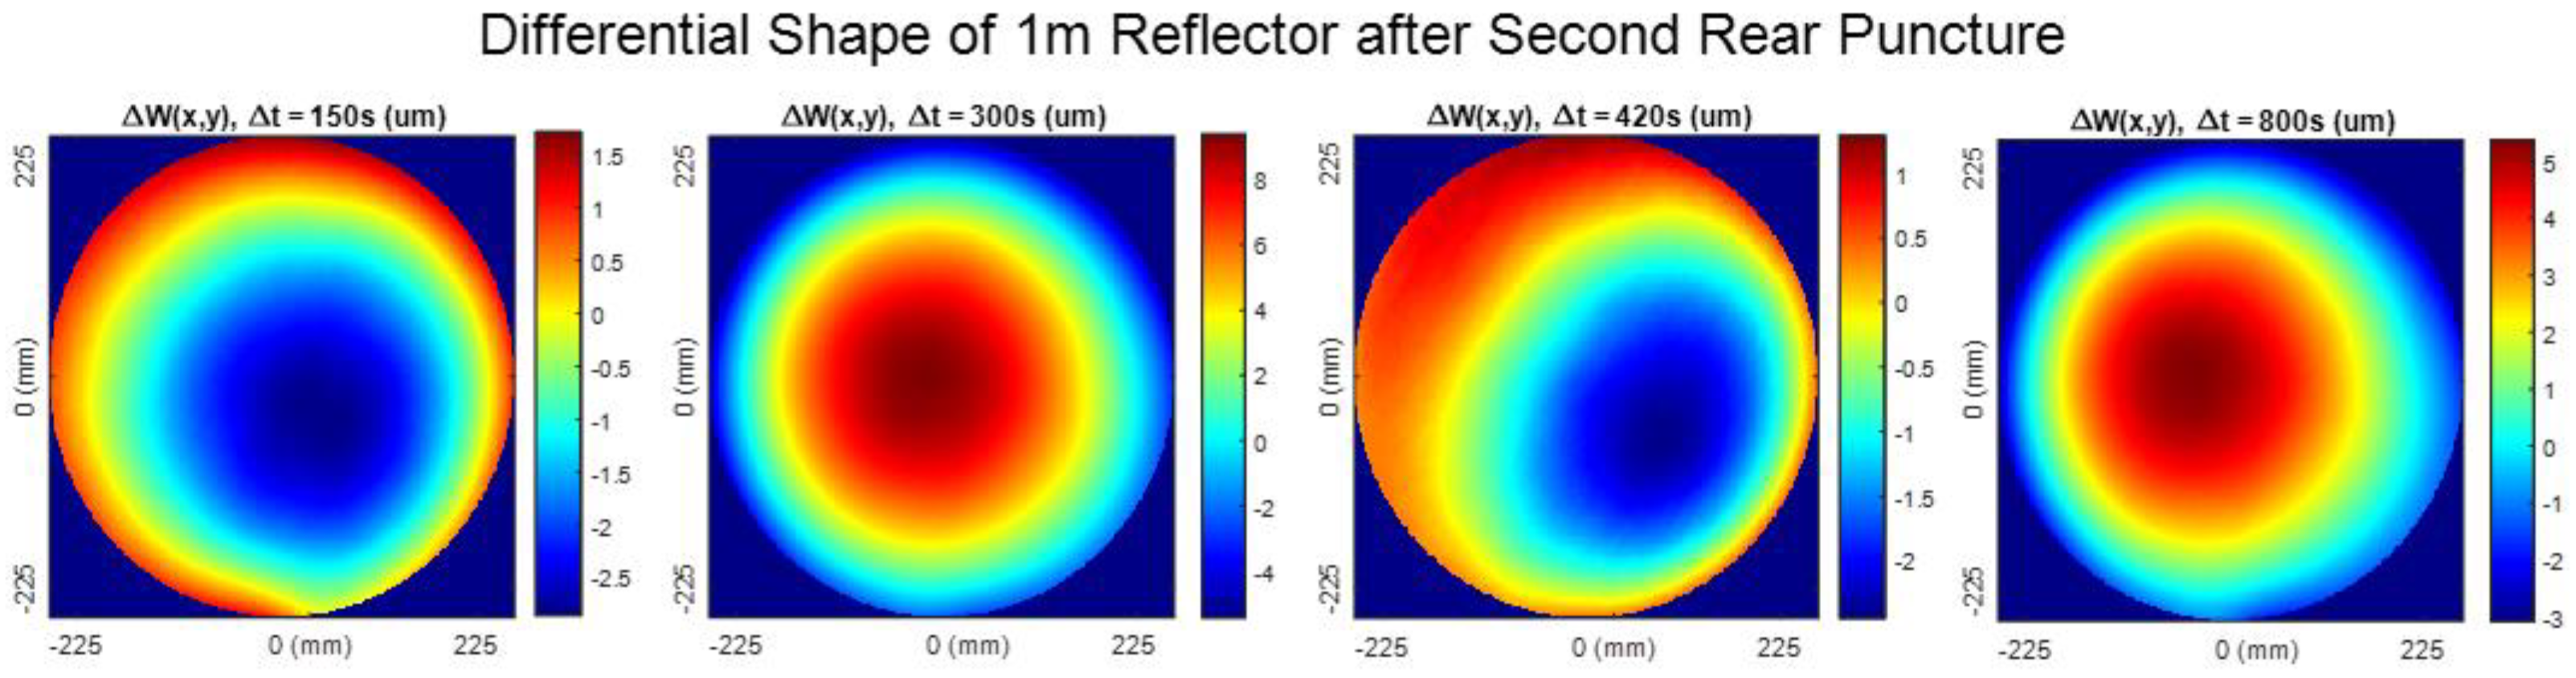
4.3. Induced Puncture Response

The final segment of our protocol was a simulated micrometeoroid puncture test shown in Figure 10 and Figure 11. A feature of Northrop Grumman’s TVAC chamber added for this test is an externally controllable mechanical actuator. Wielding a thin needle in an arc-like motion, the actuator pierced a hole into the back reflective membrane. The cylindrical body of the needle had a diameter of 0.6 mm. The spatial puncture location was chosen at the north cardinal position near the aperture edge of the membrane assembly. Figure 10 reveals the reflected signal before puncture and three snapshots after puncture. Videos were taken using the same camera in the deflectometry setup while a single static fringe was displayed. In this experiment, the chamber temperature was kept to T = 293 K and the inflatant had been solely Argon for four consecutive days.
In Figure 11, we show differential measurements of the puncture after a second puncture in the back concave membrane. The apparent difference in surface flips sign on the scale of every few minutes, now with error 8 µm peak-to-valley and 5.08 µm rms by Δ t = 800 s. Again, these fluctuations resemble low-order power, which is consistent with power being the dominant shape response to internal pressure setpoint [5]. The undulation is not the transient response of the rear membrane surface alone, but a dynamic response of the inflation unit regulation algorithm. That is, the 0.6 mm diameter puncture immediately decreased the UUT internal pressure, triggering a cyclic overshoot and undershoot towards the setpoint pressure. The second puncture did not decrease the internal pressure of the UUT beyond the minimum incremental resolution (10 Pa), but did immediately increase chamber pressure by 3 Pa.
During punctured shape measurement, a single fringe’s undulation was noticeable at the timescale of 20 s up to one minute. Given the similarity to the overall length of deflectometry acquisition (~25 s), dynamic drift will alter the surface measurement to an effect similar to that of vibration during phase-shifting interferometry. This temporal effect does not exist for the thermal gradient study, whose reflected fringes at the camera did not undulate and gradually moved over the course of surface temperatures changing by 5 K over 20 min. Single-shot display and PMD processing techniques exist which could reduce the effects of the dynamic surface drift [26,27].
A final comment is that the micrometeoroid puncture test performed is actually an accelerated simulation of the puncture of a large spaceborne membrane reflector. A surface shape change fluctuation of 5.08 µm RMS due to puncture is conservative because the 1 m monolithic surface UUT was constructed of two flat membranes, which requires higher internal inflation pressure to achieve the same f/# as an identically sized, preformed gored construction. The high time resolution of this full-field metrology solution allows temporal characterization of inflatable primary reflectors—a next step towards realizing the next generation of large-aperture space observatories.

5. Conclusions

TVAC testing results are reported for a 1 m inflatable membrane reflector in response to perturbations in low-temperature, near-vacuum conditions. Surface change was observed with phase-measuring deflectometry, particularly a differential deflectometry method that compensates for the influence of a plane window environmentally separating the test hardware from the UUT. To perform measurements, a custom deflectometer was constructed and mounted to the window plate of a large TVAC chamber, and a laser tracker provided geometric calibration references. A week-long campaign allowed the chamber to reach environmental setpoints dictated by the experimental protocol, and the static deflectometer measured surface shape responses at high spatial resolution.
While desirable, using phase-measuring deflectometry to obtain absolute surface maps is not implemented, because an accurate virtual null is not assumed. Only in the differential variant are the errors induced by a virtual null negated. Errors in calibration can be mitigated by extra calibration devices, which leave the possibility of absolute deflectometry once an approximate virtual null with low-order figure has been established. For absolute shape measurement, studies with a laser radar system have measured the shape down to 50 μm repeatability, but with sparser spatial sampling [28].
At the present, measuring a 14 m, f/1.5 reflector is also desirable. To monitor shape change, a differential deflectometry configuration would set its hardware at the radius of curvature of the optic, or 21 m away. The scale of measurement would be challenging as finite radiance of the illumination screen at each pixel must be considered for sufficient surface reconstruction signal to arrive at the camera detector. Additionally, transverse aberrations of the manufactured mirror scale directly with mirror size and may demand a much larger screen to fully illuminate the aperture.
However, if sufficient radiance and size of a screen can be achieved for this long-distance testing configuration, differential deflectometry will be an invaluable asset to final shape monitoring and mirror characterization. This is because large membrane reflectors achieve identical f/#’s to smaller ones (such as our 1 m surrogate) at a much lower internal pressure (<10 Pa), and will therefore be more sensitive to a finite pressure control resolution. In the limit of finite incremental pressure control, differential deflectometry can keep the influence of systematic pressure drifts at bay, while other non-contact metrology techniques obtain the absolute low-order shape of the large reflector.

Author Contributions

H.Q. provided the design, test, and assembly of the deflectometer and its prototypes, and its processing. H.K., H.C. and D.K. primarily ran the deflectometry experiments over 1 week of TVAC testing. M.E., K.K. and H.K. provided testing development support in atmospheric test runs. C.D.d. managed shipping the larger membrane assembly and project management guidance. All other coauthors (S.S., A.C., J.B., Y.T., A.P., J.W.A. and C.W.) provided similar levels of support in testing, ideation, validation, and supervision. All authors have read and agreed to the published version of the manuscript.

Funding

The authors would like to acknowledge the II-VI Foundation Block-Gift, Technology Research Initiative Fund Optics/Imaging Program, and Friends of Tucson Optics Endowed Scholarships in Optical Sciences for helping support the metrology research conducted in the LOFT group.

Institutional Review Board Statement

Not applicable.

Informed Consent Statement

Not applicable.

Data Availability Statement

Data available upon request.

Acknowledgments

We would like to acknowledge FreeFall Aerospace in Tucson, Arizona for supplying the vacuum pressure modular pumps to maintain internal gas pressure during testing. Finally, we would like to thank the Northrop Grumman Aerospace Systems team for their incredible help during a full week of testing.

Conflicts of Interest

The authors declare no conflict of interest.

References

  1. Freeland, R.E.; Bilyeu, G. In-Step Inflatable Antenna Experiment. Acta Astronaut. 1993, 30, 29–40. [Google Scholar] [CrossRef] [Green Version]
  2. Walker, C.K.; Chin, G.; Aalto, S.; Anderson, C.M.; Arenberg, J.W.; Battersby, C.; Bergin, E.; Bergner, J.; Biver, N.; Bjorakerb, G.L.; et al. Orbiting Astronomical Satellite for Investigating Stellar Systems (OASIS): Following the water trail from the interstellar medium to oceans. In Proceedings of the Astronomical Optics: Design, Manufacture, and Test of Space and Ground Systems III., San Diego, CA, USA, 1–5 August 2021; p. 26. [Google Scholar] [CrossRef]
  3. Arenberg, J.W.; Villareal, M.N.; Yamane, J.; Yu, T.; Lazear, J.; Pohner, J.; Sangalis, M.; Jackson, S.L.; Morse, E.; Tyler, R.; et al. OASIS architecture: Key features. In Proceedings of the Astronomical Optics: Design, Manufacture, and Test of Space and Ground Systems III., San Diego, CA, USA, 1–5 August 2021; p. 30. [Google Scholar] [CrossRef]
  4. Palisoc, A.; Pardoen, G.; Takashima, Y.; Chandra, A.; Sirsi, S.; Choi, H.; Kim, D.W.; Quach, H.; Arenberg, J.; Walker, C.K. Analytical and finite element analysis tool for nonlinear membrane antenna modeling for astronomical applications. In Proceedings of the Astronomical Optics: Design, Manufacture, and Test of Space and Ground Systems III., San Diego, CA, USA, 1–5 August 2021; p. 32. [Google Scholar] [CrossRef]
  5. Hencky, H. Über den Spannungszustand in kreisrunden Platten. Z. Angew. Math. Mech. 1915, 63, 311–317. [Google Scholar]
  6. Quach, H.; Esparza, M.A.; Kang, H.; Chandra, A.; Choi, H.; Berkson, J.; Karrfalt, K.; Sirsi, S.; Takashima, Y.; Palisoc, A.; et al. Deflectometry-based thermal vacuum testing for a pneumatic terahertz antenna. In Proceedings of the Astronomical Optics: Design, Manufacture, and Test of Space and Ground Systems III., San Diego, CA, USA, 1–5 August 2021; p. 34. [Google Scholar] [CrossRef]
  7. Chandra, A.; Walker, C.K. Thermally formed inflatable reflectors for space telescopes. In Proceedings of the Conference 2020 IEEE Aerospace Conference, AERO 2020, Big Sky, MT, USA, 7–14 March 2020. [Google Scholar] [CrossRef]
  8. Choi, H.; Palisoc, A.; Pandde, A.V.; Esparza, M.A.; Berkson, J.; Takashima, Y.; Kim, D.W.; Walker, C.K. Mid-to-high frequency characterization of inflatable membrane optics. In Proceedings of the Astronomical Optics: Design, Manufacture, and Test of Space and Ground Systems III., San Diego, CA, USA, 1–5 August 2021; p. 33. [Google Scholar] [CrossRef]
  9. Quach, H.; Berkson, J.; Sirsi, S.; Choi, H.; Dominguez, R.; Duffy, B.; Lesser, D.; Takashima, Y.; Palisoc, A.; Walker, C.; et al. Full-aperture optical metrology for inflatable membrane mirrors. In Proceedings of the Optical Manufacturing and Testing XIII., Online Only, 24 August–4 September 2020; p. 20. [Google Scholar] [CrossRef]
  10. Evans, C.E.; Greenberg, E.S.; Aldridge, D.A.; Santman, J.J. Cryogenic wavefront error measurement for the James Webb Space Telescope fine guidance sensor powered optics. Interferom. XV Tech. Anal. 2010, 7790, 779004. [Google Scholar] [CrossRef]
  11. Black, J.T.; Pappa, R.S. Photogrammetry and videogrammetry methods for solar sails and other gossamer structures. In Proceedings of the 45th AIAA/ASME/ASCE/AHS/ASC Structures, Structural Dynamics & Materials Conference, Palm Springs, CA, USA, 19–22 April 2004; pp. 1671–1681. [Google Scholar] [CrossRef] [Green Version]
  12. Pappa, R.S.; Giersch, L.R.; Quagliaroli, J.M. Photogrammetry of a 5m inflatable space antenna with consumer-grade digital cameras. Exp. Tech. 2001, 25, 21–29. [Google Scholar] [CrossRef]
  13. Hayden, J.; Eegholm, B.; Space, S.; Kubalak, D.; Hadjimichael, T.; Ohl, R.; Goddard, N.; Flight, S. Mathematical Corrections Applied to Laser Radar Measurements Made Through a Cryogenic Vacuum Chamber Window. In Proceedings of the Coordinate Metrology Systems Conference, Phoenix, AZ, USA, 25–29 July 2011; p. 6. [Google Scholar]
  14. Xu, Y.; Wang, Y.; Gao, F.; Jiang, X. Segmentation phase measuring deflectometry for measuring structured specular surfaces. Int. J. Adv. Manuf. Technol. 2021. [Google Scholar] [CrossRef]
  15. Jain, U.; Gauthier, A.; van der Meer, D. Total-internal-reflection deflectometry for measuring small deflections of a fluid surface. Exp. Fluids 2021, 62, 1–14. [Google Scholar] [CrossRef]
  16. Willomitzer, F.; Yeh, C.-K.; Gupta, V.; Spies, W.; Schiffers, F.; Katsaggelos, A.; Walton, M.; Cossairt, O. Hand-guided qualitative deflectometry with a mobile device. Opt. Express 2020, 28, 9027. [Google Scholar] [CrossRef] [PubMed]
  17. Huang, L.; Idir, M.; Zuo, C.; Asundi, A. Review of phase measuring deflectometry. Opt. Lasers Eng. 2018, 107, 247–257. [Google Scholar] [CrossRef]
  18. Xu, Y.; Gao, F.; Jiang, X. A brief review of the technological advancements of phase measuring deflectometry. PhotoniX 2020, 1, 1–10. [Google Scholar] [CrossRef]
  19. Ritter, R.; Hahn, R. Contribution to analysis of the reflection grating method. Opt. Lasers Eng. 1983, 4, 13–24. [Google Scholar] [CrossRef]
  20. Su, P.; Parks, R.E.; Wang, L.; Angel, R.P.; Burge, J.H. Software configurable optical test system: A computerized reverse Hartmann test. Appl. Opt. 2010, 49, 4404. [Google Scholar] [CrossRef] [PubMed]
  21. Huang, R.; Su, P.; Horne, T.; Brusa, G.; Burge, J.H. Optical metrology of a large deformable aspherical mirror using software configurable optical test system. Opt. Eng. 2014, 53, 085106. [Google Scholar] [CrossRef] [Green Version]
  22. Kam, J. Differential Phase Measuring Deflectometry for High-Sag Freeform Optics; The University of Arizona: Tucson, AZ, USA, 2019. [Google Scholar]
  23. Huang, R. High Precision Optical Surface Metrology Using Deflectometry; University of Arizona: Tucson, AZ, USA, 2015. [Google Scholar]
  24. Smith, W. Modern Optical Engineering, 4th ed.; McGraw-Hill: New York, NY, USA, 2008. [Google Scholar]
  25. Esparza, M.A. Stressed Deformable Reflector and Pneumatic Membrane Antenna for Thermal Vacuum Terahertz Wavefront Control and Measurement. In Proceedings of the Astronomical Optics: Design, Manufacture, and Test of Space and Ground Systems III., San Diego, CA, USA, 1–5 August 2021. [Google Scholar] [CrossRef]
  26. Trumper, I.; Choi, H.; Kim, D.W. Instantaneous phase shifting deflectometry. Opt. Express 2016, 24, 27993. [Google Scholar] [CrossRef] [PubMed] [Green Version]
  27. Nguyen, M.T.; Ghim, Y.S.; Rhee, H.G. Single-shot deflectometry for dynamic 3D surface profile measurement by modified spatial-carrier frequency phase-shifting method. Sci. Rep. 2019, 9, 1–15. [Google Scholar] [CrossRef] [PubMed]
  28. Sirsi, S. Orbiting Astronomical Satellite for Investigating Stellar Systems (OASIS) Space Telescope; The University of Arizona: Tucson, AZ, USA, 2021. [Google Scholar]
Figure 1. An inflatable membrane mirror is constructed by clamping two Mylar sheets between three machined aluminum rings (a). During inflation, the rear aluminized Mylar becomes the concave reflecting surface of interest, while the clear convex Mylar front surface helps hold pres-sure (b). The convex Mylar surface is known as the canopy. In the final full-sized assembly, the canopy will be black polyimide, which is opaque in the visible but transparent with some loss in the target operation wavelengths (~80–660 µm).
Photonics 09 00001 g001
Figure 2. Between an illumination source, a camera, and a UUT, the law of specular reflection is satisfied. Here, the direction z ^ is parallel to the optical axis of a spherical optic, the direction y ^ in the tangential meridional plane, and the direction x ^ in the sagittal plane. The coordinates y m , y s , and y c represent the y-coordinates of the mirror, source, and a pinhole camera as related by the law of specular reflection. d m 2 s and d m 2 c represent the absolute distances between the mirror and screen and mirror and camera, and z m 2 s and z m 2 c represent the distances of these physical locations along the direction z ^ . W ( x m , y m ) is the sag of the optic.
Photonics 09 00001 g002
Figure 3. A unique aspect of inflatable optics is that the tensioning ring is a static datum between all varifocal states of the optic. The location of the aperture edge is stationary; only the surface slopes and height change within this circular area. Since the position of the UUT within the field of view of the camera does not change, v 1 ^ v 1 ^ . In the diagram, rays are reverse traced from the camera to UUT for a more intuitive visualization of ray slope deflection.
Photonics 09 00001 g003
Figure 4. We examine the effects of a plane window between a room temperature and pressure environment (RTP) and a cryogenic vacuum (a). A camera focuses through the plate and transparent Mylar canopy to the reflective Mylar surface. The circular meniscus window is 254 mm in diameter, while the full UUT aperture is 1 m. Rays from the UUT generally intercept the plate at non-normal incidence and introduce transverse displacement deviation ε y as a function of ray slope v 2 ^ . The ray slope v 2 ^ v 2 ^ for any PPP tilt,   θ , and wedge, α , as seen in (b). In absence of the plate, the screen y-intercept position would be y s , rather than the plate-displaced y s . The ray path from the camera to the UUT is also deviated by the plate, but its detail is not highlighted in this schematic.
Photonics 09 00001 g004
Figure 5. Four team members pull the reflective surface taut before clamping it the frame (a). One tooling ball just barely touches the rear side of the reflective mylar UUT (b). The full optomechanical mounting scheme for the 1 m mirror is described in detail [18].
Photonics 09 00001 g005
Figure 6. The mechanical deflectometer frame consists of two 356 mm × 356 mm aluminum plates with mounting holes to allow flexible mounting for a camera and illumination screen (a). Standoffs fastened through aluminum slots allow for longitudinal adjustment. The plates were fastened to existing 3/8” bolts. The deflectometer assembly was rotated 22 degrees about the window normal in order to match the orientation of the in-situ bolt hole pattern (b). A design choice of 100 pixels per black/white fringe, 7-step phase shifts, and 3 averages per shot was optimized on-site.
Photonics 09 00001 g006
Figure 7. The inflated test article is mounted at back of the chamber cylinder (a). The scale of the entire test configuration was nearly 4 m, which places the deflectometer approximately at the radius of curvature of the inflated optic at its inflation pressure range of 500–700 Pa (b). During testing, the first Fresnel reflection at the acrylic window interface was faint enough to not significantly reduce signal contrast at the camera detector. Diffuse machined internal surfaces scatter the illumination from outside the chamber, also slightly reducing reconstruction signal contrast.
Photonics 09 00001 g007
Figure 8. Three differential deflectometry measurements show the repeatability of the central 525 mm aperture. Changes within the first two minute-separated acquisitions resemble coma but flip in sign. At the end of the third minute acquisition, fluctuations damped significantly. Experience with the inflation unit hints that the pressure control unit strongly converges towards the setpoint, but sufficient iterative convergence occurs on longer timescales. Here, the 700 Pa pressure setpoint was met and held to the 10 Pa resolution indicated by the unit.
Photonics 09 00001 g008
Figure 9. Shape differences were observed successively on the timescale of hundreds of seconds. It is interesting that the proximity of the heat source to the northern region of the UUT did not produce local non-uniformity at the center aperture region despite local temperature differences. In this experiment, the inflatant gas was Argon, which most recently expelled a mix of Helium, Argon, and Xenon from the lenticular UUT volume.
Photonics 09 00001 g009
Figure 10. After the unpunctured reflector (first subplot) is pierced, the number of fringes increases (second subplot). With knowledge of the testing distance ( z 3800   mm ) and fringe width at the screen ( ξ 9.62   mm ), one can count the number of fringes passing through a given pixel to coarsely estimate the slope change in y-direction. In the third subfigure, a shadow precludes slope measurement at this local surface region, indicating that the slope change exceeds the measurable dynamic range of the deflectometer in its current position. The shadow shrinks and grows at a low temporal frequency until it fully recovers and is measurable again without the subaperture data void. Chamber pressure increased from 0.84 Pa to 7.07 Pa after puncture.
Photonics 09 00001 g010
Figure 11. The second puncture showed recovery without substantial dynamic change over tens of minutes. Chamber pressure increased from 7.07 Pa to 10.66 Pa after the second puncture. A third puncture brought the chamber pressure to 13.33 Pa.
Photonics 09 00001 g011
Publisher’s Note: MDPI stays neutral with regard to jurisdictional claims in published maps and institutional affiliations.

