Article

Surface Shape Distortion Online Measurement Method for Compact Laser Cavities Based on Phase Measuring Deflectometry

1
Key Laboratory of Photonic Control Technology Ministry of Education, Department of Precision Instrument, Tsinghua University, Beijing 100084, China
2
State Key Laboratory of Precision Measurement Technology and Instruments, Department of Precision Instrument, Tsinghua University, Beijing 100084, China
3
Research Center of Laser Fusion, China Academy of Engineering Physics, Mianyang 621900, China
*
Author to whom correspondence should be addressed.
Photonics 2022, 9(3), 151; https://doi.org/10.3390/photonics9030151
Submission received: 6 February 2022 / Revised: 2 March 2022 / Accepted: 2 March 2022 / Published: 3 March 2022
(This article belongs to the Special Issue Advances in Optical Metrology)

Abstract

:
Conventional phase measuring deflectometry (PMD) takes up a large measurement space and is not suitable for compact online measurement, as the liquid crystal display (LCD) has to be placed in parallel with the mirror under test. In this paper, a compact online phase measuring deflectometry (COPMD) with the LCD screen set perpendicular to the mirror under test is presented for surface shape distortion real-time measurement. The configuration of the COPMD in an enclosed laser cavity is proposed, and the principle of the method is theoretically derived by using the vector-form reflection law. Based on the analysis model, the fringe modulation regulation of the LCD is revealed, and the measurement errors caused by misalignments of the components are illustrated. The validity and flexibility of the COPMD method are verified in the experiment by using a single-actuator deformable mirror as the mirror under test and the PMD method as the comparison. The proposed COPMD method remarkably expands the application range of the conventional PMD method, as it could make efficient use of compact space and is applicable for real-time measurement in enclosed laser facilities and assembled laser systems.

1. Introduction

High-power lasers are widely developed and applied in many applications because of their advantages of good beam quality, high pumping efficiency, and compact structure. Especially in the inertial confinement fusion (ICF) research field, high-power lasers with a single beam of tens thousands of joules are used to ignite thermonuclear fuel to release huge amounts of energy [1]. During the working process of the high-power laser, the laser cavity is specially set to be enclosed to avoid unwanted environmental perturbation and protect the operators from laser irradiation.
In high-power laser facilities, the thermal distortion of the optical surface under high energy radiation has become one of the most serious problems [2,3,4,5], as it would greatly affect the IR-UV conversion efficiency and the beam quality. The accurate acquisition of the thermal distortion of a single optical surface is essentially important to the design and control of the high-power laser. Shack–Hartmann wavefront sensing (SHWFS) is widely used to measure the wavefront distortion of the laser beam in high-power laser facilities, including the National Ignition Facility [6,7], the Laser MégaJoule Facility [8], the OMEGA extended performance Laser System, and the Chinese ICF Facility [9]. However, the SHWFS mainly focuses on the wavefront distortion measurement of the whole system. The wavefront measured by the SHWFS is the wavefront throughout the entire optical route, including the distortion of all the optical elements, the air perturbation, and the vibration of system [10]. It is hard to use the SHWFS to monitor the distortion of a single optical surface [11]. As a low-cost, full-field three-dimensional shape measurement technique with a high dynamic range, the phase measuring deflectometry (PMD) method was first introduced in 2004 and improved to be a flexible and effective approach to inspect specular reflecting surfaces [12]. It could be used to accurately measure the surface shape of a single optical element with the unique advantages of a high dynamic range, full field of view, and non-null measurement [13] on the basis of the triangulation law [14], Scheimpflug principle [15], and diffuse-versus-specular reflections principle [16]. Based on the synergy between deflectometry and ray-tracing, the PMD method was employed for the on-site evaluation of the free-form mirrors with a high speed, high accuracy, and cost reduction [17,18,19]. The software configurable optical test system (SCOTS), an upgraded phase measuring deflectometry, is presented to achieve a high-accuracy surface shape measurement of large astronomical telescopes and ellipsoidal X-ray mirrors with a flexible configuration and high dynamic range [20,21]. A direct PMD method was proposed to measure discontinuous specular objects by utilizing the geometric relations of parallel planes to directly calculate the height from phase information [22]. An instantaneous phase shifting deflectometry method based on PMD was developed to enable the phase shifting data snapshot in high vibration environments and other scenarios by using a multiplexed display pattern and novel data processing [23]. A single-shot phase measuring deflectometry method was proposed to achieve high-speed three-dimensional surface profile measurement by retrieving an accurate phase from a one-frame composite pattern [24]. In 2009, a phase measuring deflectometry to the measurement of the off-axis aspheric surface was introduced, which achieved the surface shape detection of an off-axis aspheric surface. Compared with the traditional PMD method, this method does not need to know the corresponding incident rays by calibrations, a moving screen, or approximation [25,26]. In 2018, the phase measuring deflectometry system combined with a laser resonator was designed to achieve a high-precision online thermal distortion measurement of crystals in the high-power laser [27]. However, limited by the wavefront reconstruction principle and algorithm, the screen of the liquid crystal display (LCD) has to be placed in parallel with the surface of the mirror under test, which takes up a large measurement space [12,13,14,15,16,17,18,19,20,21,22,23,24,25,26,27,28,29]. Thus, these mentioned methods are primarily constrained in offline tests and not applicable for real-time measurement in the enclosed laser facility.
In this paper, a compact online phase measuring deflectometry (COPMD) with the LCD screen set perpendicular to the mirror under test is proposed for the surface shape distortion measurement. The configuration of the COPMD does not occupy the space out of the cavity structure and could be flexibly applied in the enclosed laser facility and assembled laser system, and thus distinctly expands the application range of the conventional PMD method. This paper is organized as follows. In Section 2, the configuration of the COPMD is introduced and the principle is theoretically derived by using the vector-form reflection law. In Section 3, a detailed analysis on the measurement error of the COPMD is investigated based on the theoretical model. In Section 4, an experiment is carried out, and the validity and the feasibility of the proposed method are verified. In Section 5, some related issues including uncertainty, roughness, and sinusoidal fringe pattern projection and detection are discussed.

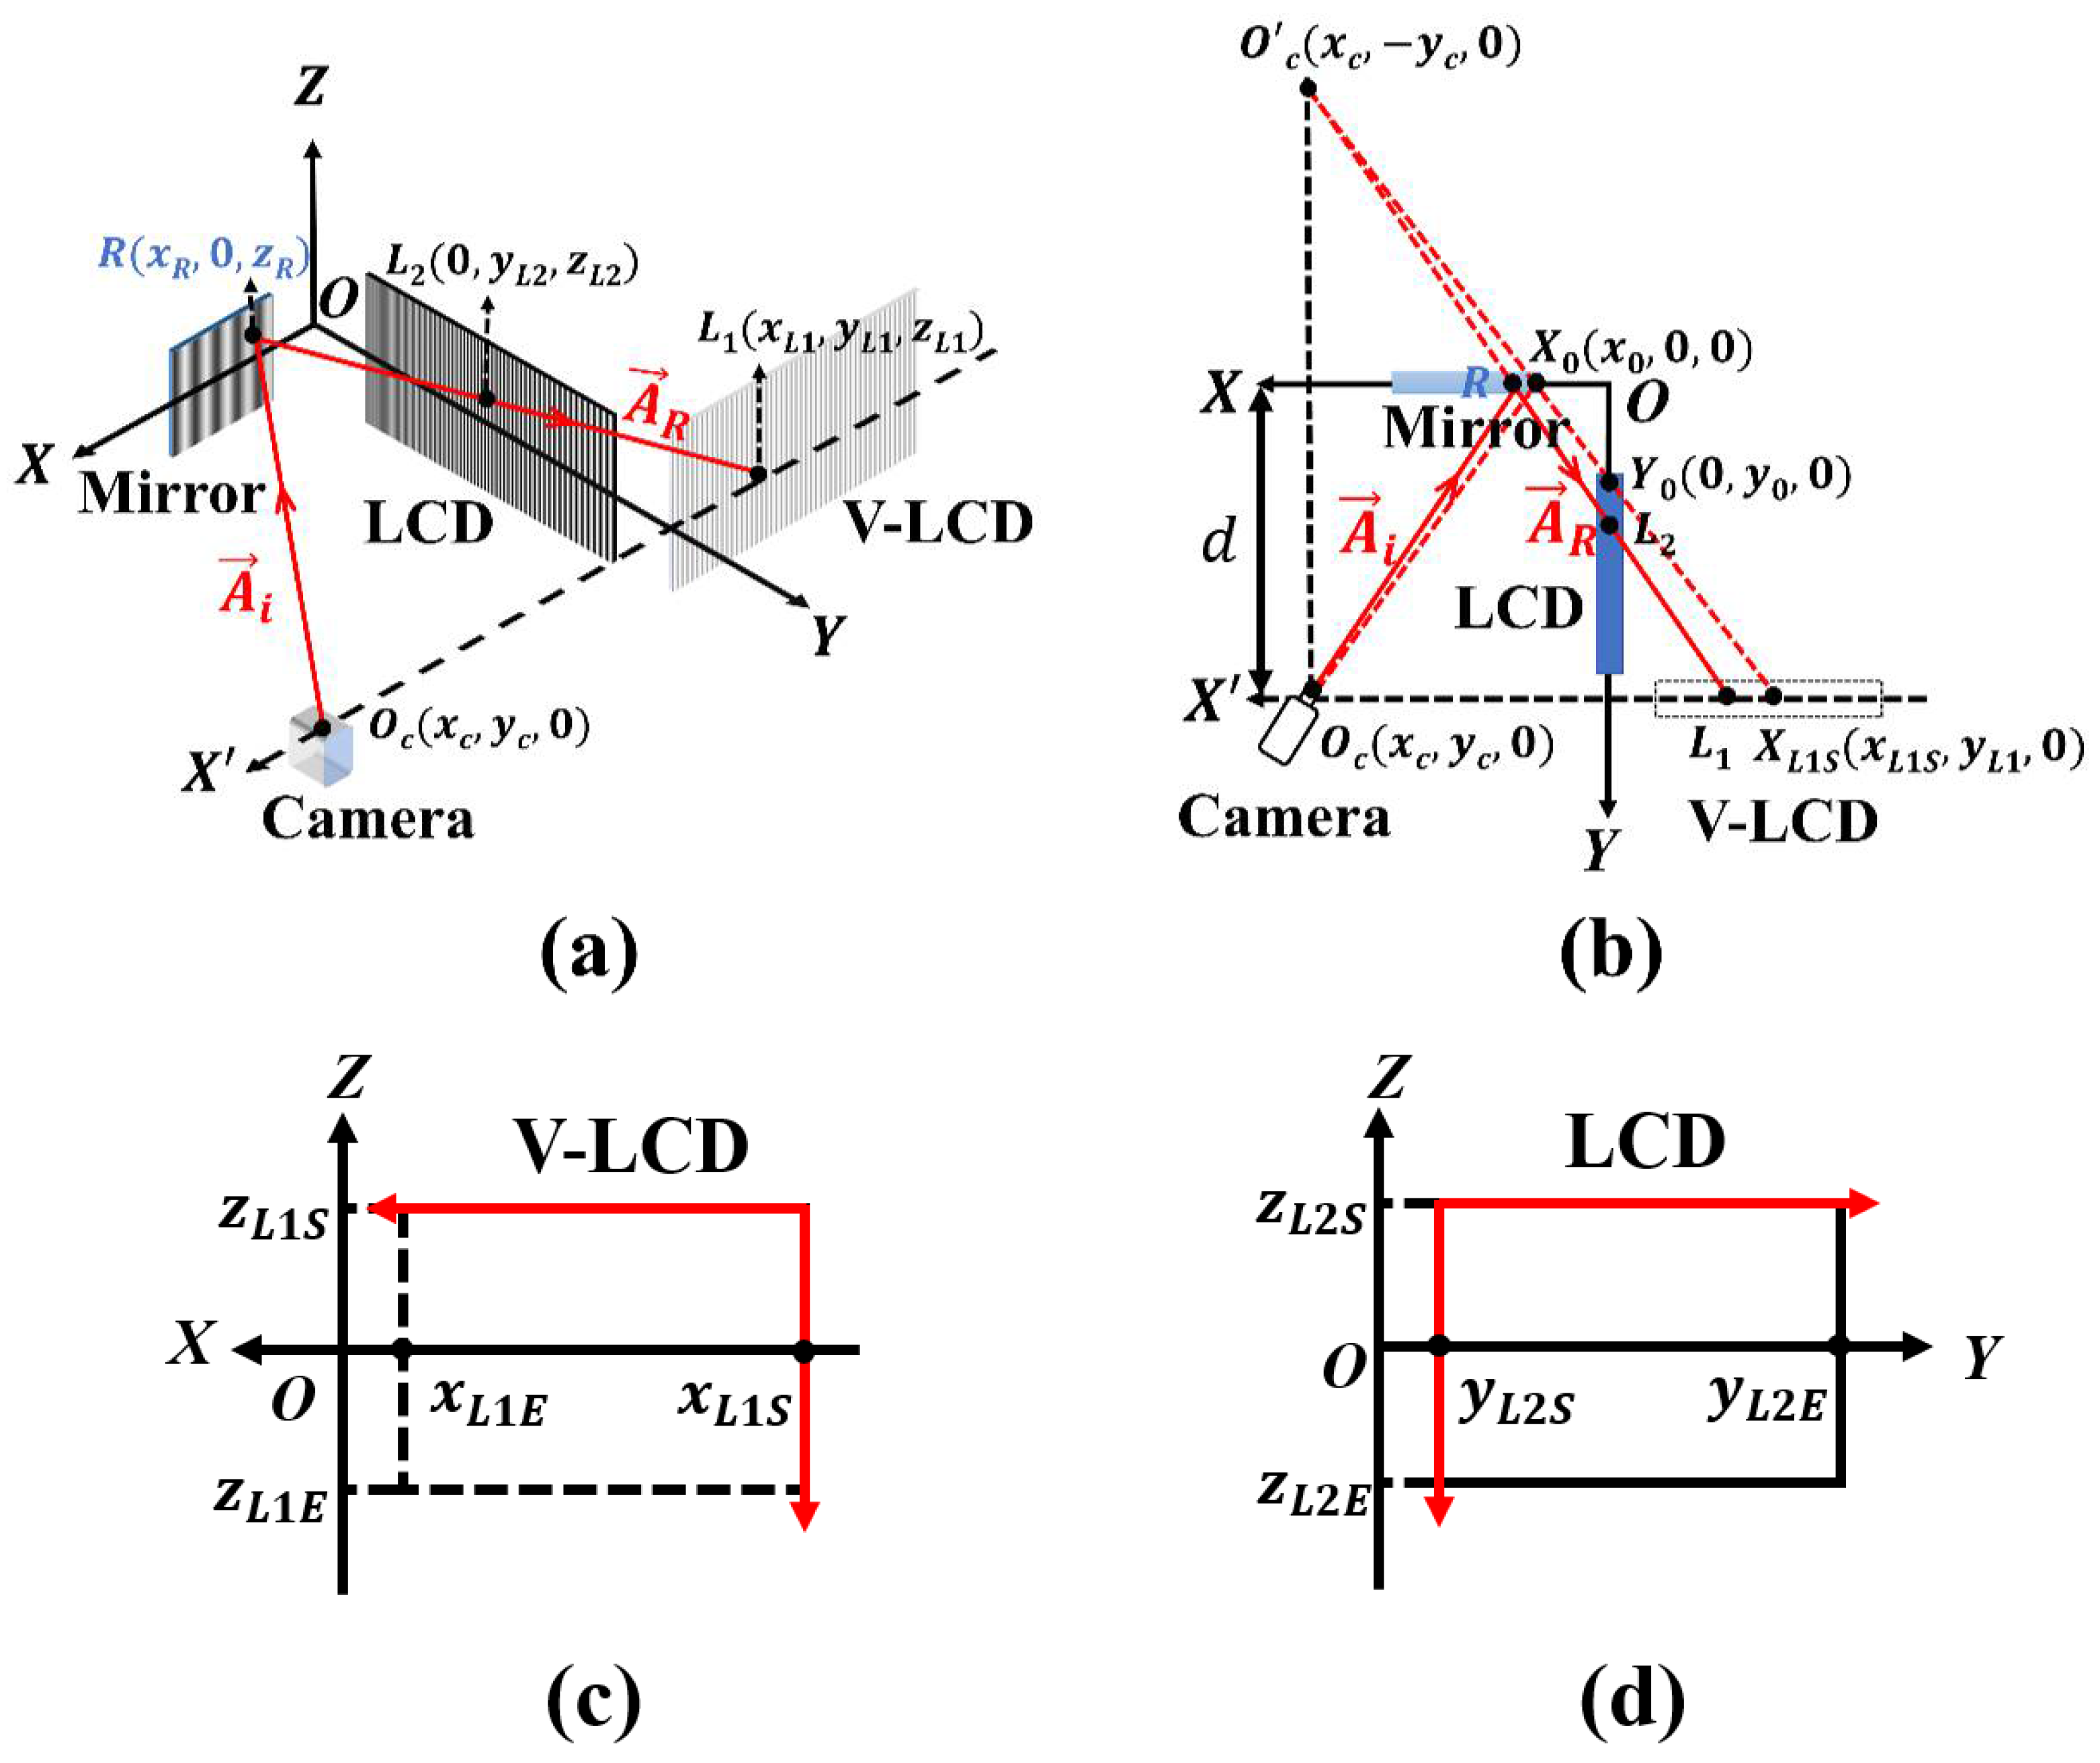
2. Configuration and Principle of the COPMD

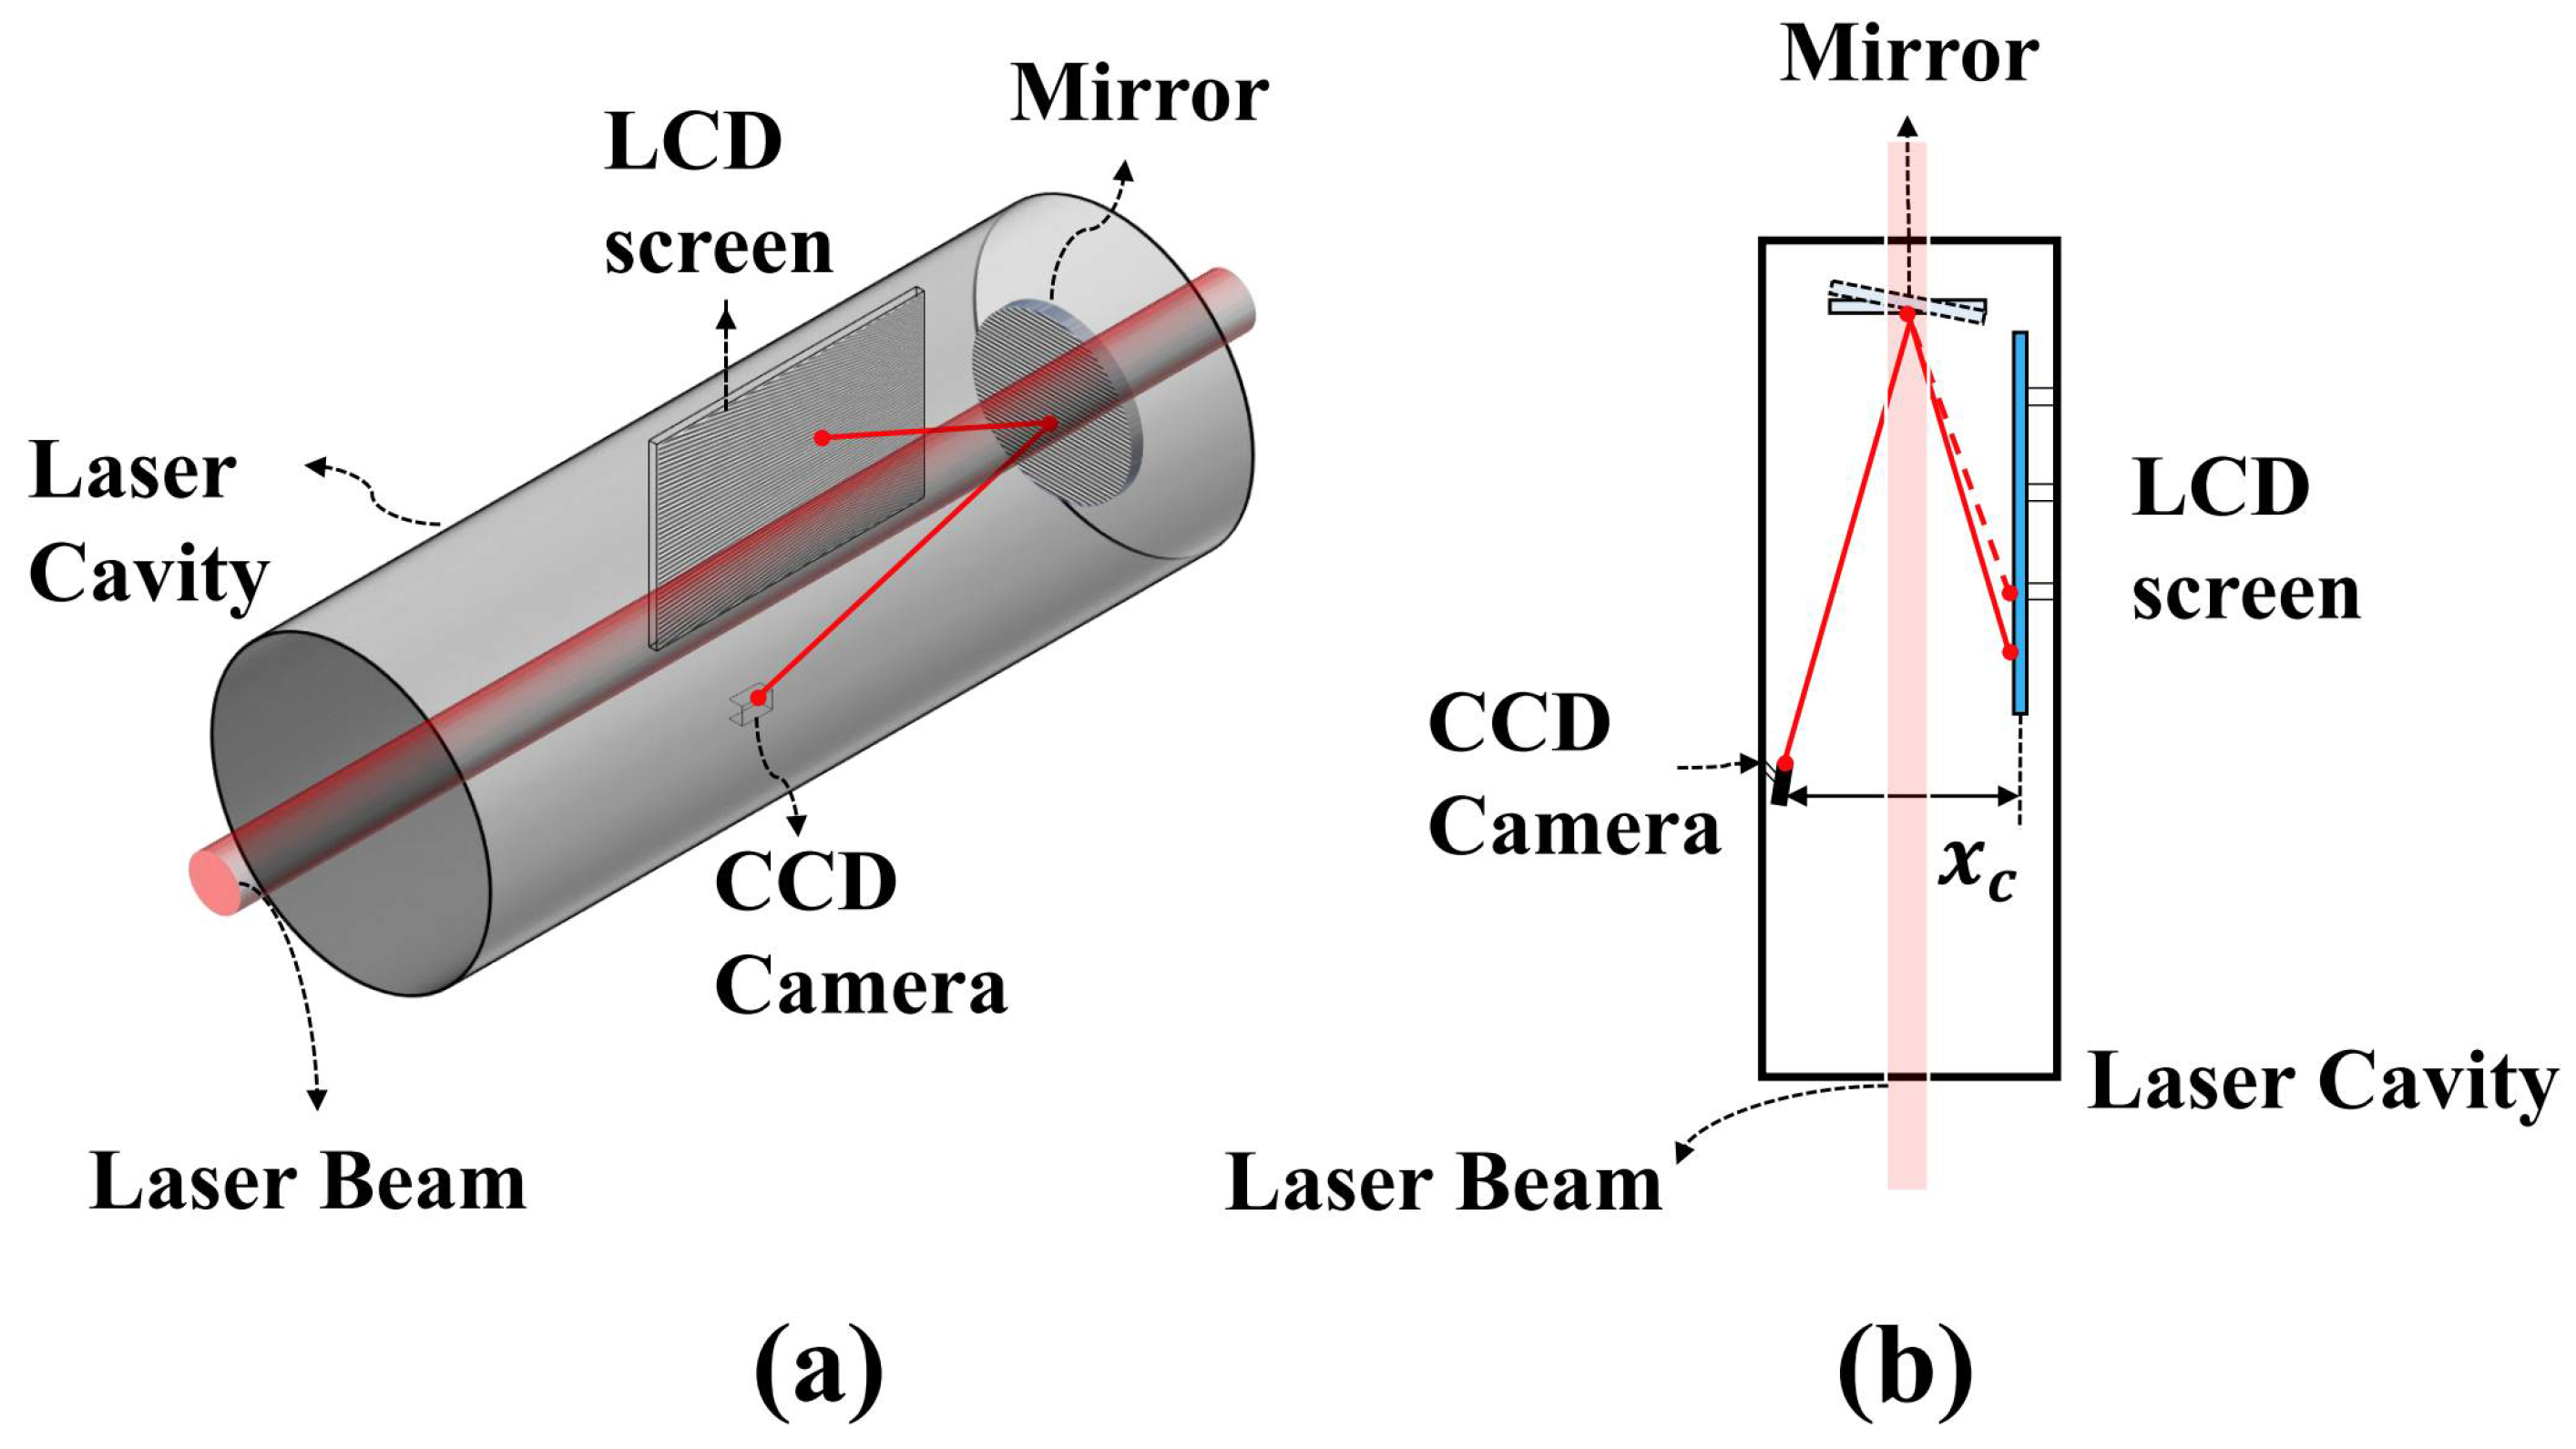
2.1. Configuration of the COPMD

The three-dimensional and plane schematic diagrams of the COPMD configuration in the laser cavity (an NIF-type laser cavity as an example) are depicted in Figure 1a,b, respectively, and consist of a mirror under test, a CCD camera, and an LCD screen. Note that the LCD screen is placed flexibly close and perpendicular to the mirror under test to make efficient use of the compact space within the cavity, which is distinct from the PMD method. The red line indicates the laser beam path (e.g., 1064 nm wavelength), while the gray cylinder indicates the laser cavity. The fringe pattern from the LCD screen will be reflected by the mirror under test and then directly enter into the CCD camera. The CCD camera with a rotatable truss can be moved or rotated in six degrees of freedom to reduce measurement error. Note that the detection light beam will not be affected by the laser beam when passing through the mirror, as the light emitted from the LCD is non-coherent illumination light.
In the measurement process, the surface shape of the mirror before laser operation is measured first and taken as the reference wavefront. During long-time high-energy radiation in a high-power laser cavity, the surface shape of the mirror will be distorted and measured again. Based on the reference wavefront, the surface shape distortion will be accurately measured. Similar to the PMD method [12,13,14,15,16,17,18,19,20,21,22,23,24,25,26,27,28,29], the COPMD method is also based on sinusoidal fringe pattern projection and detection to acquire the wavefront slope through a phase-shift algorithm and then numerical integration to reconstruct the wavefront distortion. In the measurement process of the COPMD, the surface shape of the mirror before laser operation is measured first and taken as the reference. During long-time high-energy radiation in the high-power laser cavity, the surface shape of the mirror will be distorted. The distorted surface shape of the optical mirror will deform the reflected fringe pattern, and the distorted fringe pattern carrying the additional distortion information will be captured by the CCD camera. By subtracting the reference, the additional phase brought by the distorted mirror is acquired, and the distribution of the wavefront slope could be calculated. Finally, the distorted surface shape could be reconstructed by applying numerical integration. The measurement of the surface shape distortion by using the COPMD method includes two steps, i.e., the acquisition of reflection fringes irradiance and the reconstruction of wavefront distortion.

2.2. The Acquisition of Reflection Fringes Irradiance

In the first step of the COPMD, the acquisition of reflection fringes irradiance will be carried out twice for one surface shape distortion measurement. Before laser operation, the sinusoidal fringe pattern outputs from the LCD screen and enters into the image plane of the CCD camera after being reflected by the mirror under test. The initial irradiance distribution I 0 ( x , y ) (i.e., no distortion) of the sinusoidal fringe pattern on the CCD camera can be expressed as Equation (1).
I 0 ( x , y ) = A ( x , y ) + B ( x , y ) cos [ 2 π x * / g + ϕ 0 ( x , y ) ]
Here, A ( x ,   y ) is the background irradiance distribution, and B ( x ,   y ) is the amplitude modulation. ϕ 0 ( x ,   y ) is the initial phase of the COPMD optical system. g is the period of the sinusoidal fringe pattern. x * is the modulation function of the sinusoidal fringe pattern.
When high-power laser is working, the optical mirror is irradiated by the laser beam and massive photons are absorbed by the optical film, which will result in the thermal stress and deformation of the mirror [30]. The distorted surface shape of the optical mirror will deform the reflected sinusoidal fringe pattern, and the produced additional phase is carried [31]. The irradiance distribution I ( x ,   y ) of the deformed sinusoidal fringe pattern could be expressed as Equation (2). Here, ϕ ( x ,   y ) is the additional phase caused by the thermal and stress distortions of the optical mirror [32].
I ( x , y ) = A ( x , y ) + B ( x , y ) cos [ 2 π x * / g + ϕ ( x , y ) + ϕ 0 ( x , y ) ]
In order to explore the complex relationship between the LCD screen and the mirror in Figure 1, a Virtual-LCD (V-LCD) screen parallel to the mirror is set in the analysis model. Note that each light ray from the V-LCD transmits through the LCD and reaches the CCD camera, which means that each point on the V-LCD screen corresponds to that on the LCD screen. As shown in Figure 1, in order to simplify the analysis process, the light rays are assumed to emit from the CCD camera and reach the LCD and V-LCD screens according to the optical path reversal principal. Figure 2 shows the mathematical relationship between the optical mirror, LCD screen, V-LCD screen, and CCD camera in a Cartesian coordinate system.
The spatial three-dimensional configuration is shown in Figure 2a, while the XOY, XOZ, and YOZ planes are shown in Figure 2b–d, respectively. The origin O is set at the intersection of the mirror and the LCD screen. It means that the YOZ plane could represent the initial plane of the LCD screen, which is perpendicular to the optical mirror. The coordinate of optical center O c on the camera’s image plane is set as ( x c , y c , 0 ) , where y c is the distance between the optical center O c and the V-LCD screen. In the case of choosing an arbitrary point R ( x R , 0 , z R ) on the XOZ plane as the reflection point in Figure 2a, the reflection ray vector A R from the arbitrary point R could be written as ( x x c ,   y + y c ,   z z c ) , and the reflection ray equation R L 1 ¯ could be expressed as Equation (3).
x x c x L 1 x c = y + y c y L 1 + y c = z z c z L 1 z c
where the distance between the CCD camera and the LCD screen is represented by x c and the relative position of mirror is represented by x 0 , while the relative position of the LCD screen is represented by y 0 . x c can also be used to represent the diameter of the cavity within the compact space, which determines the relative positions x 0 and y 0 of the mirror and the LCD screen. As shown in Figure 2b, point X 0 is the midpoint of line O C X L 1 S ¯ , which could be expressed as Equation (4).
x L 1 S = 2 x 0 x c
As shown in Figure 2c,d, x L 1 S and z L 1 S are defined as the start X-coordinate and Z-coordinate of the fringes on the V-LCD screen in the XOZ plane, respectively, while y L 2 S and z L 2 S are defined as the start Y-coordinate and Z-coordinate of the fringes of V-LCD in the YOZ plane.
Here, combining Equations (3) and (4), the modulation functions for the vertical fringes x V * and the horizontal fringes x H * could be derived based on the relationship between the reflection ray R L 1 ¯ and line O C X L 1 S ¯ , which could be expressed as Equations (5) and (6). Here, the diameter of each pixel point on the LCD screen is assumed as n , and the position functions for the pixel point is assumed as y L 2 * and z L 2 * , which are the dependent variables of the modulation functions x V * and x H * .
x V * = 2 x c y o ( x o x c ) y L 2 * x 0 + y o ( x o x c ) + x c n
x H * = 2 z L 2 * y o ( x o x c ) y L 2 * x 0 + y o ( x o x c ) n
The initial irradiance distributions [ I x 0 ( x , y ) , I y 0 ( x , y ) ] of the horizontal and vertical fringe patterns reflected by the undistorted mirror and captured by the CCD camera could be expressed as Equations (7) and (8), respectively.
I x 0 ( x , y ) = A ( x , y ) + B ( x , y ) cos [ 2 π x V * / g + ϕ 0 ( x , y ) ]
I y 0 ( x , y ) = A ( x , y ) + B ( x , y ) cos [ 2 π x H * / g + ϕ 0 ( x , y ) ]
The upgraded irradiance distributions [ I x ( x ,   y ) ,   I y ( x ,   y ) ] of the horizontal and vertical fringe patterns reflected by the deformed mirror and captured by the CCD camera could be expressed as Equations (9) and (10), respectively.
I x ( x , y ) = A ( x , y ) + B ( x , y ) cos [ 2 π x V * / g + ϕ ( x , y ) + ϕ 0 ( x , y ) ]
I y ( x , y ) = A ( x , y ) + B ( x , y ) cos [ 2 π x H * / g + ϕ ( x , y ) + ϕ 0 ( x , y ) ]
As shown in Figure 3, the sinusoidal fringe on the LCD screen is a type of modulated fringe, which is different from the conventional PMD method. The modulation function is determined by the relationship between the LCD screen, the CCD camera, and the mirror under test (Equations (5) and (6)). In contrast to the equidistant fringes in the conventional PMD (Figure 3a,b), the widths of the modulated vertical and horizontal fringes of the COPMD (Figure 3c,d) are gradually widened from g v i to g v j and g h i to g h j along the X direction, while the widths of the modulated horizontal fringe are gradually decreasing from g h i to g h i 1 and g h i to g h i + 1 along the Y direction.

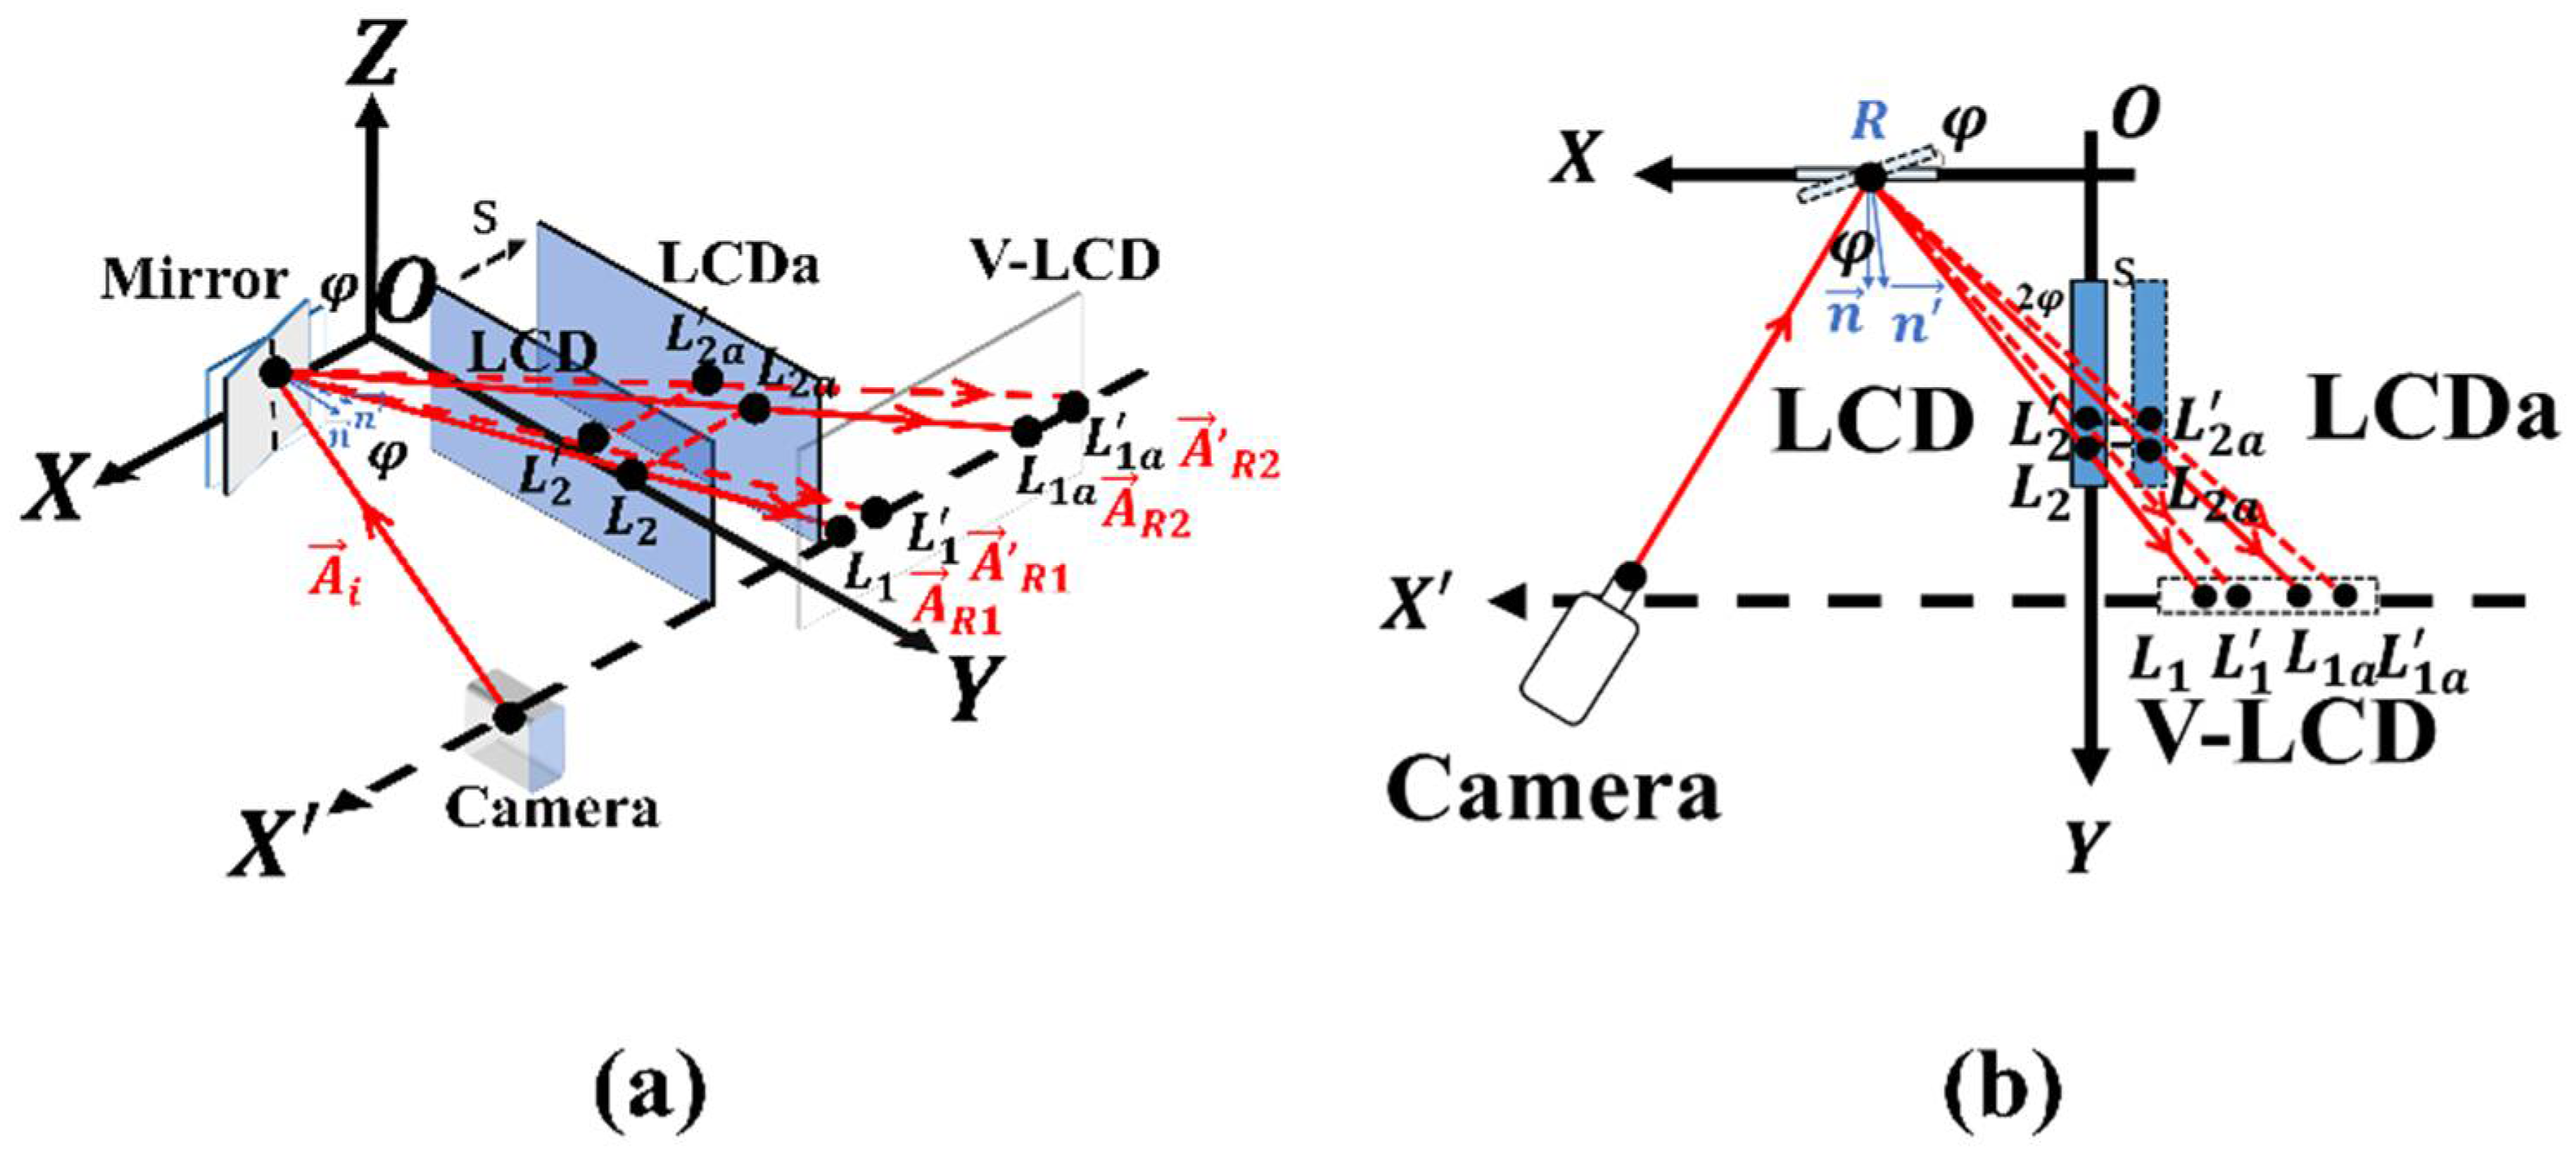
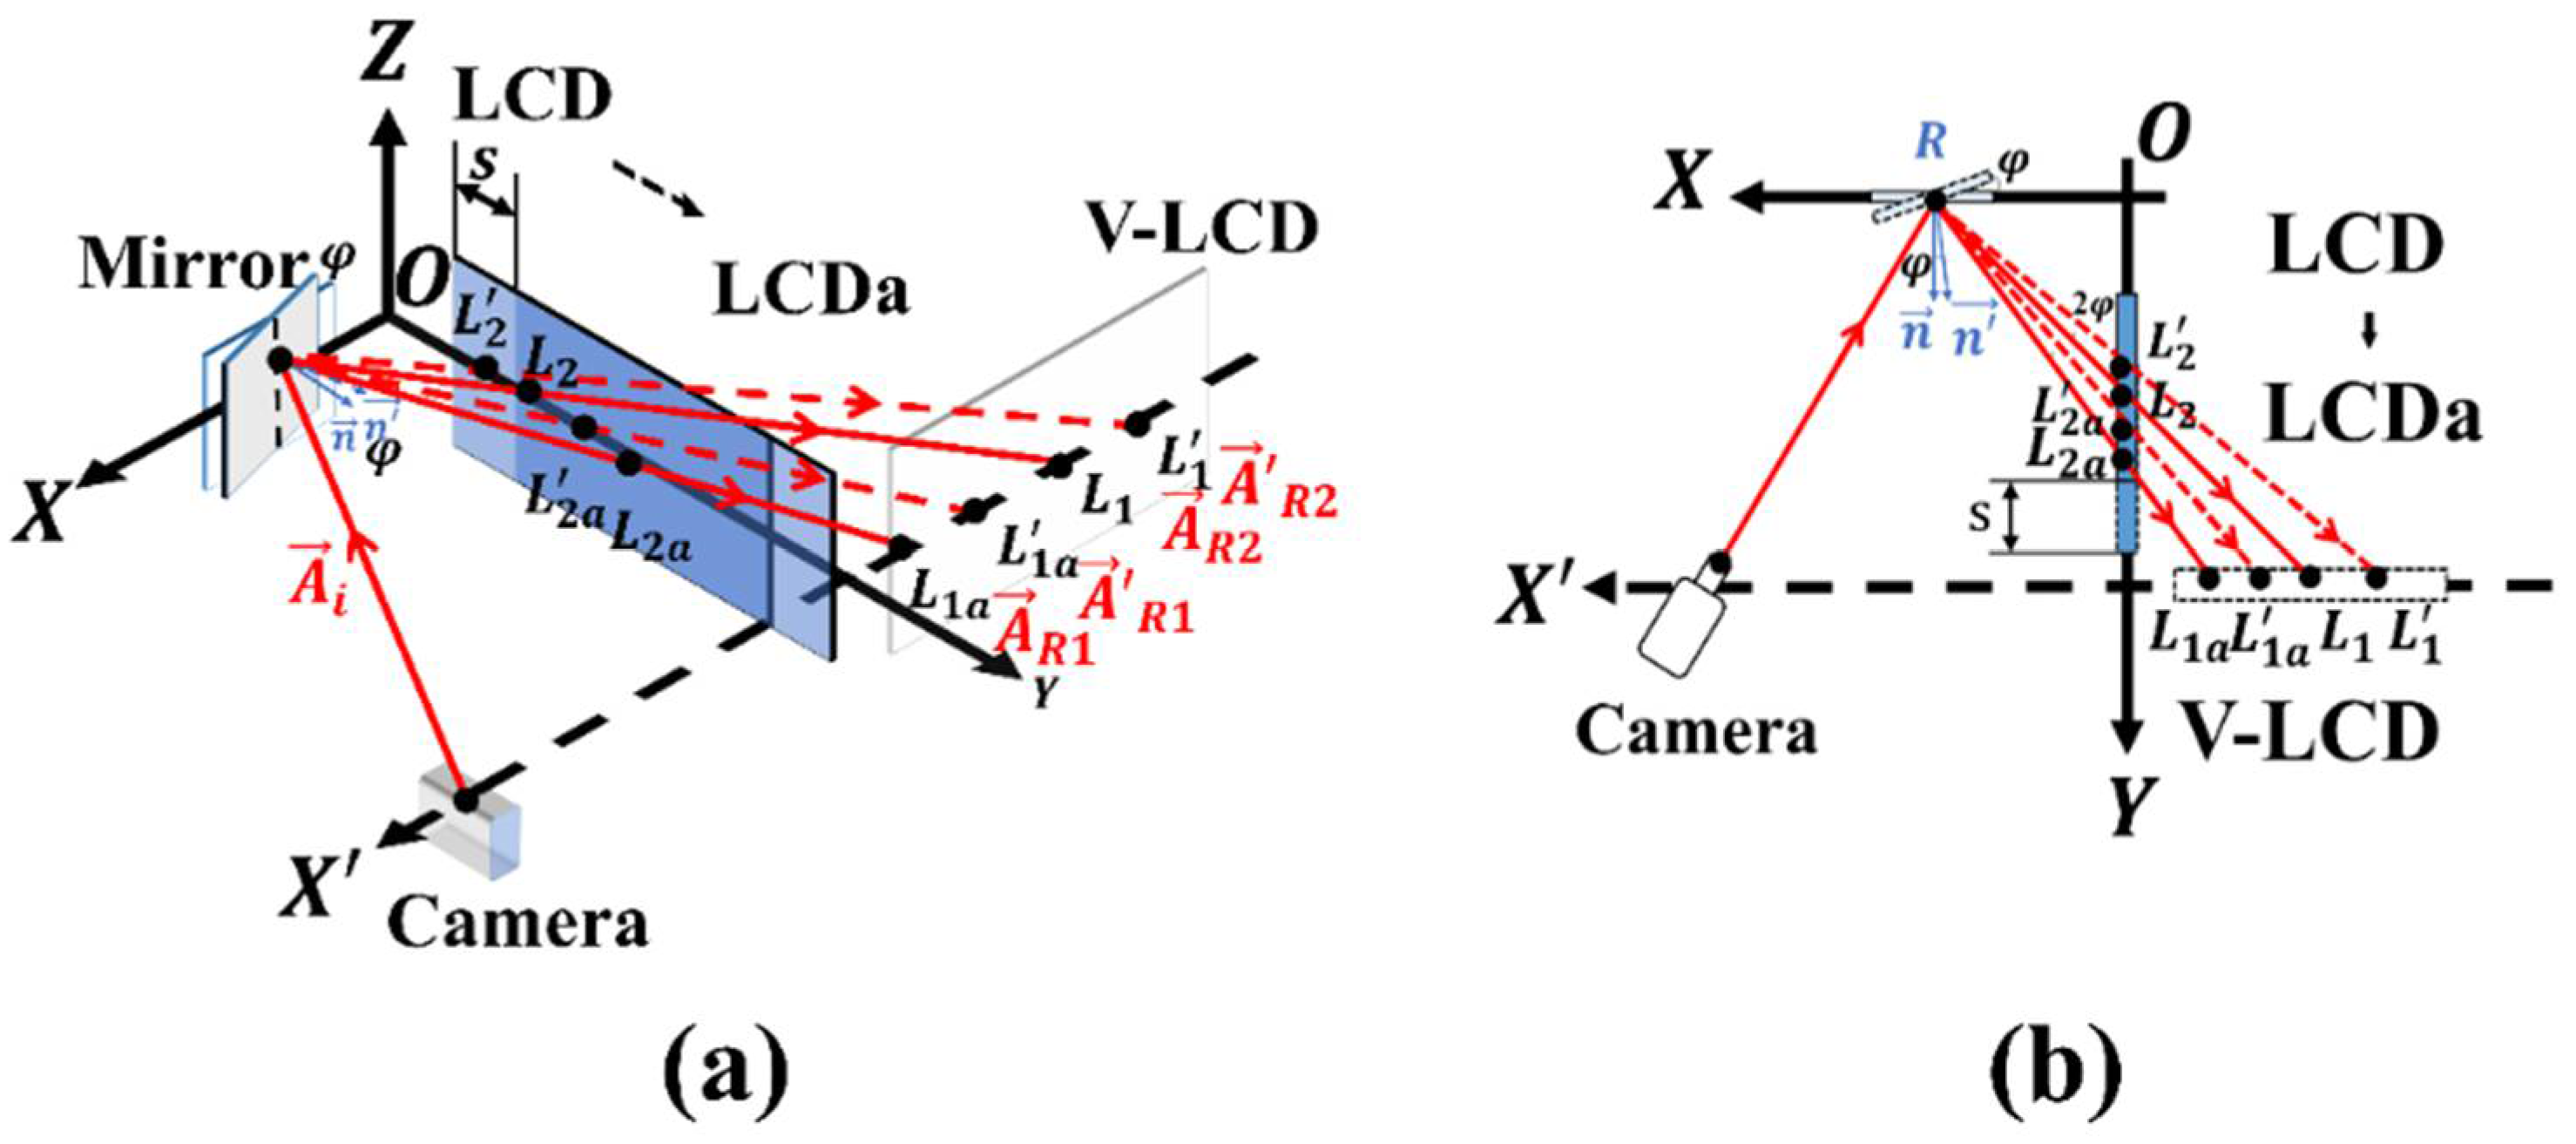
2.3. The Reconstruction of Wavefront Distortion

Based on the modulated fringes on LCD screens, the intensities of the initial irradiance and the deformed irradiance of fringes are reflected by the optical mirror and recorded by the CCD camera. An eight-image acquisition technique based on the four-step phase-shift method is adopted to acquire the additional phase caused by the distorted surface shape. In the eight-image acquisition technique, the measured irradiance distribution I n after the Nth phase-shift can be rewritten as Equation (11), assuming φ 0 ( x ,   y ) = 2 π x * / g + ϕ 0 ( x ,   y ) and φ ( x ,   y ) = 2 π x * / g + ϕ ( x ,   y ) + ϕ 0 ( x ,   y ) .
I n ( x , y ) = A ( x , y ) + B ( x , y ) cos [ φ ( x , y ) + δ n ]
where N is the total number of the phase-shift. δ n is the shifting phase for each phase shift ( δ n = 2 π n / N ). Based on Equations (2) and (11), φ ( x ,   y ) could be expressed as Equation (12).
φ ( x , y ) = arctan [ N = 0 N 1 I n sin ( 2 π n / N ) N = 0 N 1 I n cos ( 2 π n / N ) ]
where φ ( x ,   y ) is the wrapped phase limited within [−π, π], which could be unwrapped as the continuous phase [33,34]. Then the additional phase ϕ ( x ,   y ) caused by the distorted surface shape could be expressed as Equation (13).
ϕ ( x , y ) = φ ( x , y ) φ 0 ( x , y )
In the eight-image acquisition technique, the additional phase ϕ x ( x ,   y ) in the X direction (i.e., the horizontal direction) could be calculated by eight vertical modulated sinusoidal fringe patterns (Figure 3c). Moreover, the additional phase ϕ y ( x ,   y ) in the Y direction (i.e., the vertical direction) could be calculated by eight horizontal modulated sinusoidal fringe patterns (Figure 3d).
Based on the obtained additional phase, i.e., ϕ x ( x ,   y ) and ϕ y ( x ,   y ) , the distribution of the wavefront slope in the X and the Y directions could be written as Equations (14) and (15) [35]. Finally, by applying the numerical integration, the wavefront of the distorted surface shape deviating from the initial could be reconstructed according to Equations (16) and (17) [12].
P x g 2 π d · ϕ x ( x , y )
P y g 2 π d · ϕ y ( x , y )
D x ( x , y ) = P x ( x , y ) x
D y ( x , y ) = P y ( x , y ) y
Here, P x ( x ,   y ) and P y ( x ,   y ) are the distributions of the wavefront slope in the X and Y directions, respectively. D x   ( x ,   y ) and D y   ( x ,   y ) are the wavefront distortions of the surface shape in the X and Y directions, respectively. By integrating the wavefront distortion D x   ( x ,   y ) and D y   ( x ,   y ) in the X and Y directions, the wavefront distortion D   ( x ,   y ) of the mirror under test could be obtained. Note that d is the distance between the CCD camera and the optical mirror, which is determined by the geometric relationship between the CCD camera and the mirror depicted in Figure 2a.

3. Measurement Errors Analysis

In the measurement process of the COPMD, practical system errors (e.g., misalignment, position accuracy of the devices) will influence the transmission of the modulated fringes and the image capture, which will affect the wavefront reconstruction and cause measurement errors. Here, the measurement errors, due to the LCD screen translations along the X-axis and Y-axis and the rotations around the Y-axis and Z-axis, are analyzed and discussed. Note that in the following analysis, the mirror under test is supposed to be in the shape of a square.

3.1. Measurement Error Due to the LCD Screen Translation along the X-Axis

According to the geometric relationship between the optical components illustrated in Section 2, the LCD screen and V-LCD screen have a strict corresponding relationship. During the experiment, measurement errors will occur if the LCD screen shifts along the X-axis. Figure 4 shows the geometric relationship and ray tracing between the optical mirror, the LCD screen, the LCDa screen, and the V-LCD screen, providing that the LCD screen has an axial deviation s and moves to the position of LCDa.
As shown in Figure 4, the coordinate of optical center O c on the camera’s image plane is set as ( x c , y c , 0 ) , where y c is the distance between the optical center O c and the V-LCD screen. For an arbitrary reflection point R ( x R , 0 , z R ) on the XOZ plane, the theoretical vectors of the reflection rays from the original and deformed surface shapes are set as A R 1 and A R 1 , respectively. Vectors A R 1 and A R 1 intersect with the LCD screen at points L 2 ( 0 , y L 2 , z L 2 ) and L 2 ( 0 , y L 2 , z L 2 ) and with the V-LCD screen at points L 1 and L 1 . As the LCD screen moves to the position of LCDa, the actual vectors of the reflection rays from the original and deformed surfaces shape are A R 2 and A R 2 , respectively, while they intersect with the LCDa screen at points L 2 a and L 2 a and with the V-LCD screen at points L 1 a and L 1 a . The relationship between these points could be expressed in Equations (18)–(21). The difference Δ D 1 between the theoretical and actual reconstructed wavefront distortions could be expressed as Equation (22).
L 2 L 2 a ¯ = L 2 L 2 a ¯ = s
L 2 L 2 ¯ = L 2 a L 2 a ¯ = O L 2 ¯ O L 2 ¯ = y L 2 y L 2
L 1 L 1 ¯ = d · x R ( y L 2 y L 2 ) y L 2 · y L 2
L 1 a L 1 a ¯ = d ( s x R ) ( y L 2 y L 2 ) y L 2 · y L 2
Δ D 1 = D i D j = ( 1 d M s + d M ) · D i
where d M is the side length of the mirror under test. L 1 L 1 ¯ and L 1 a L 1 a ¯ represent the theoretical and actual fringe ranges on the V-LCD screen, while D i and D j represent the theoretical and actual reconstructed wavefront distortions, respectively. According to Equation (22), the axial deviation s of the LCD screen along the X-axis, comparing to the side length of the mirror, should be kept as small as possible to reduce the measurement error Δ D 1 .

3.2. Measurement Error Due to the LCD Screen Translation along the Y-Axis

Figure 5 shows the geometric relationship and ray tracing between the optical mirror, the LCD screen, the LCDa screen, and the V-LCD screen when the LCD screen shifts along the Y-axis to the position of LCDa with an axial deviation s .
As shown in Figure 5, the coordinate of optical center O c on the camera’s image plane is also set as ( x c , y c , 0 ) . The theoretical vectors of the reflection rays from the arbitrary reflection point R ( x R , 0 , z R ) on the original and deformed surface shapes are set as A R 1 and A R 1 , respectively. The two vectors intersect with the LCD screen at points L 2 and L 2 and with the V-LCD screen at points L 1 and L 1 . The actual vectors of the reflection rays from the original and deformed surface shapes are A R 2 and A R 2 , while they intersect with the LCDa screen at points L 2 a and L 2 a and with the V-LCD screen at points L 1 a and L 1 a . The difference Δ D 2 between the theoretical and actual reconstructed wavefront distortions could be expressed as Equation (23), which represents the measurement error.
Δ D 2 = D i D j = [ 1 ( s + d M ) 2 d M 2 ] · D i
where d M is the side length of the mirror under test, while D i and D j represent the theoretical and actual reconstructed wavefront distortions, respectively. According to Equation (23), in order to reduce the measurement error Δ D 2 , the axial deviation s of the LCD screen along the Y-axis should be kept as small as possible compared to the side length of the mirror.

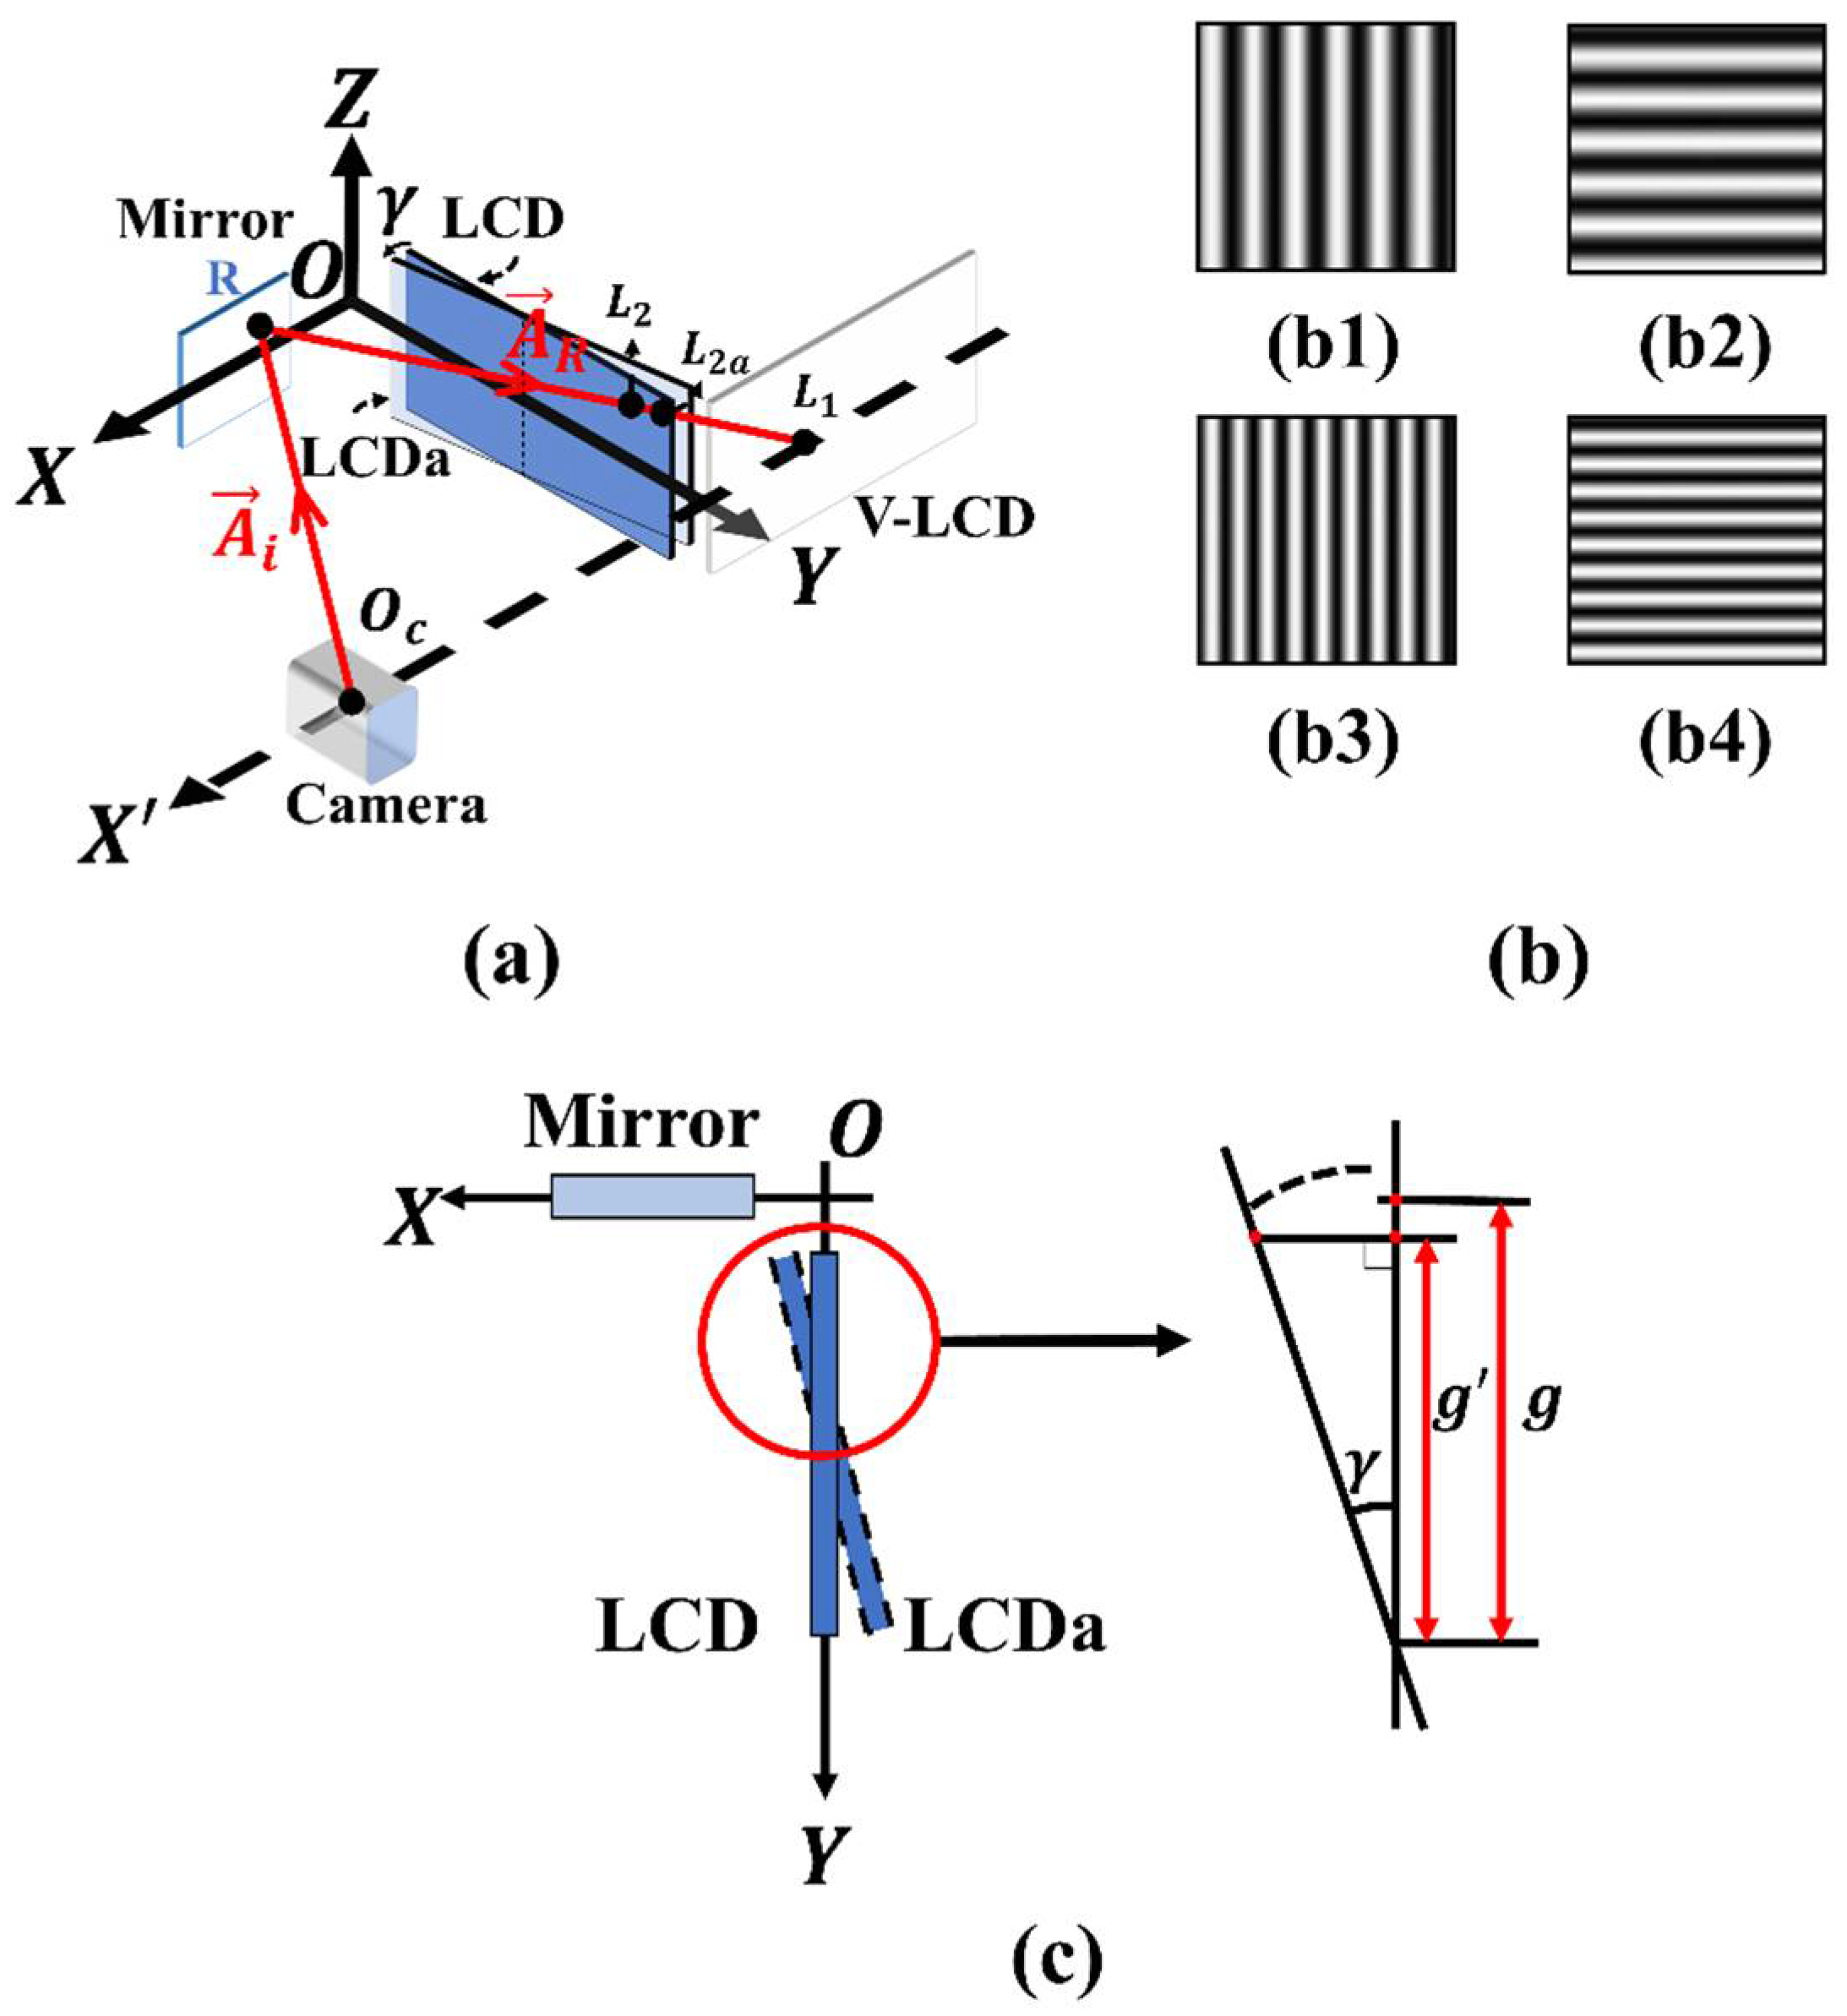
3.3. Measurement Error Due to the LCD Screen Rotation around the Y-Axis

The geometric relationship and ray tracing between the optical mirror, the LCD screen, the LCDa screen, and the V-LCD screen are as shown in Figure 6. Here, the LCD screen rotates around the Y-axis with a rotation angle γ to the position of LCDa (Figure 6a,b). As shown in Figure 6a, the camera’s image plane is set as the coordinate of optical center O c . The vector of the reflection ray from the surface shape of the mirror is set as A R , which intersects with the LCD and V-LCD screens at points L 2 and L 1 . As the LCD screen rotates to the position of LCDa, the vector A R intersects with the LCDa screen at the point L 2 a . Figure 6c shows that the rotation of the LCD screen will cause the clockwise rotation offset of the reflected fringes. In contrast to the original strictly vertical (Figure 6(c1)) and horizontal (Figure 6(c2)) fringes on the LCDa screen, the actual reflected vertical (Figure 6(c3)) and horizontal (Figure 6(c4)) fringes captured by the CCD camera are deflected clockwise and not strictly vertical and horizontal. Figure 6(c5) shows an enlarged schematic diagram of the fringes in Figure 6(c4), in which the solid lines and dotted lines represent the original sinusoidal fringes and deflected clockwise sinusoidal fringes, respectively.
The width between two solid lines represents the period g of the original sinusoidal fringes while the width between two dotted lines represents the period g of the deflected clockwise fringes. The relationship between the periods g and g is written as Equation (24), while the difference Δ D 3 between the theoretical and actual reconstructed wavefront distortions can be expressed as Equation (25).
g = g · cos γ
Δ D 3 = D i D j = ( 1 1 cos γ ) · D i
where D i and D j represent the theoretical and actual reconstructed wavefront distortions, respectively. According to Equation (24), the rotation angle γ of the LCD screen around the Y-axis should be kept as small as possible to reduce the measurement error Δ D 3 , which means that the LCD screen should be controlled strictly perpendicularly to the mirror in practical measurement.

3.4. Measurement Error Due to the LCD Screen Rotation around the Z-Axis
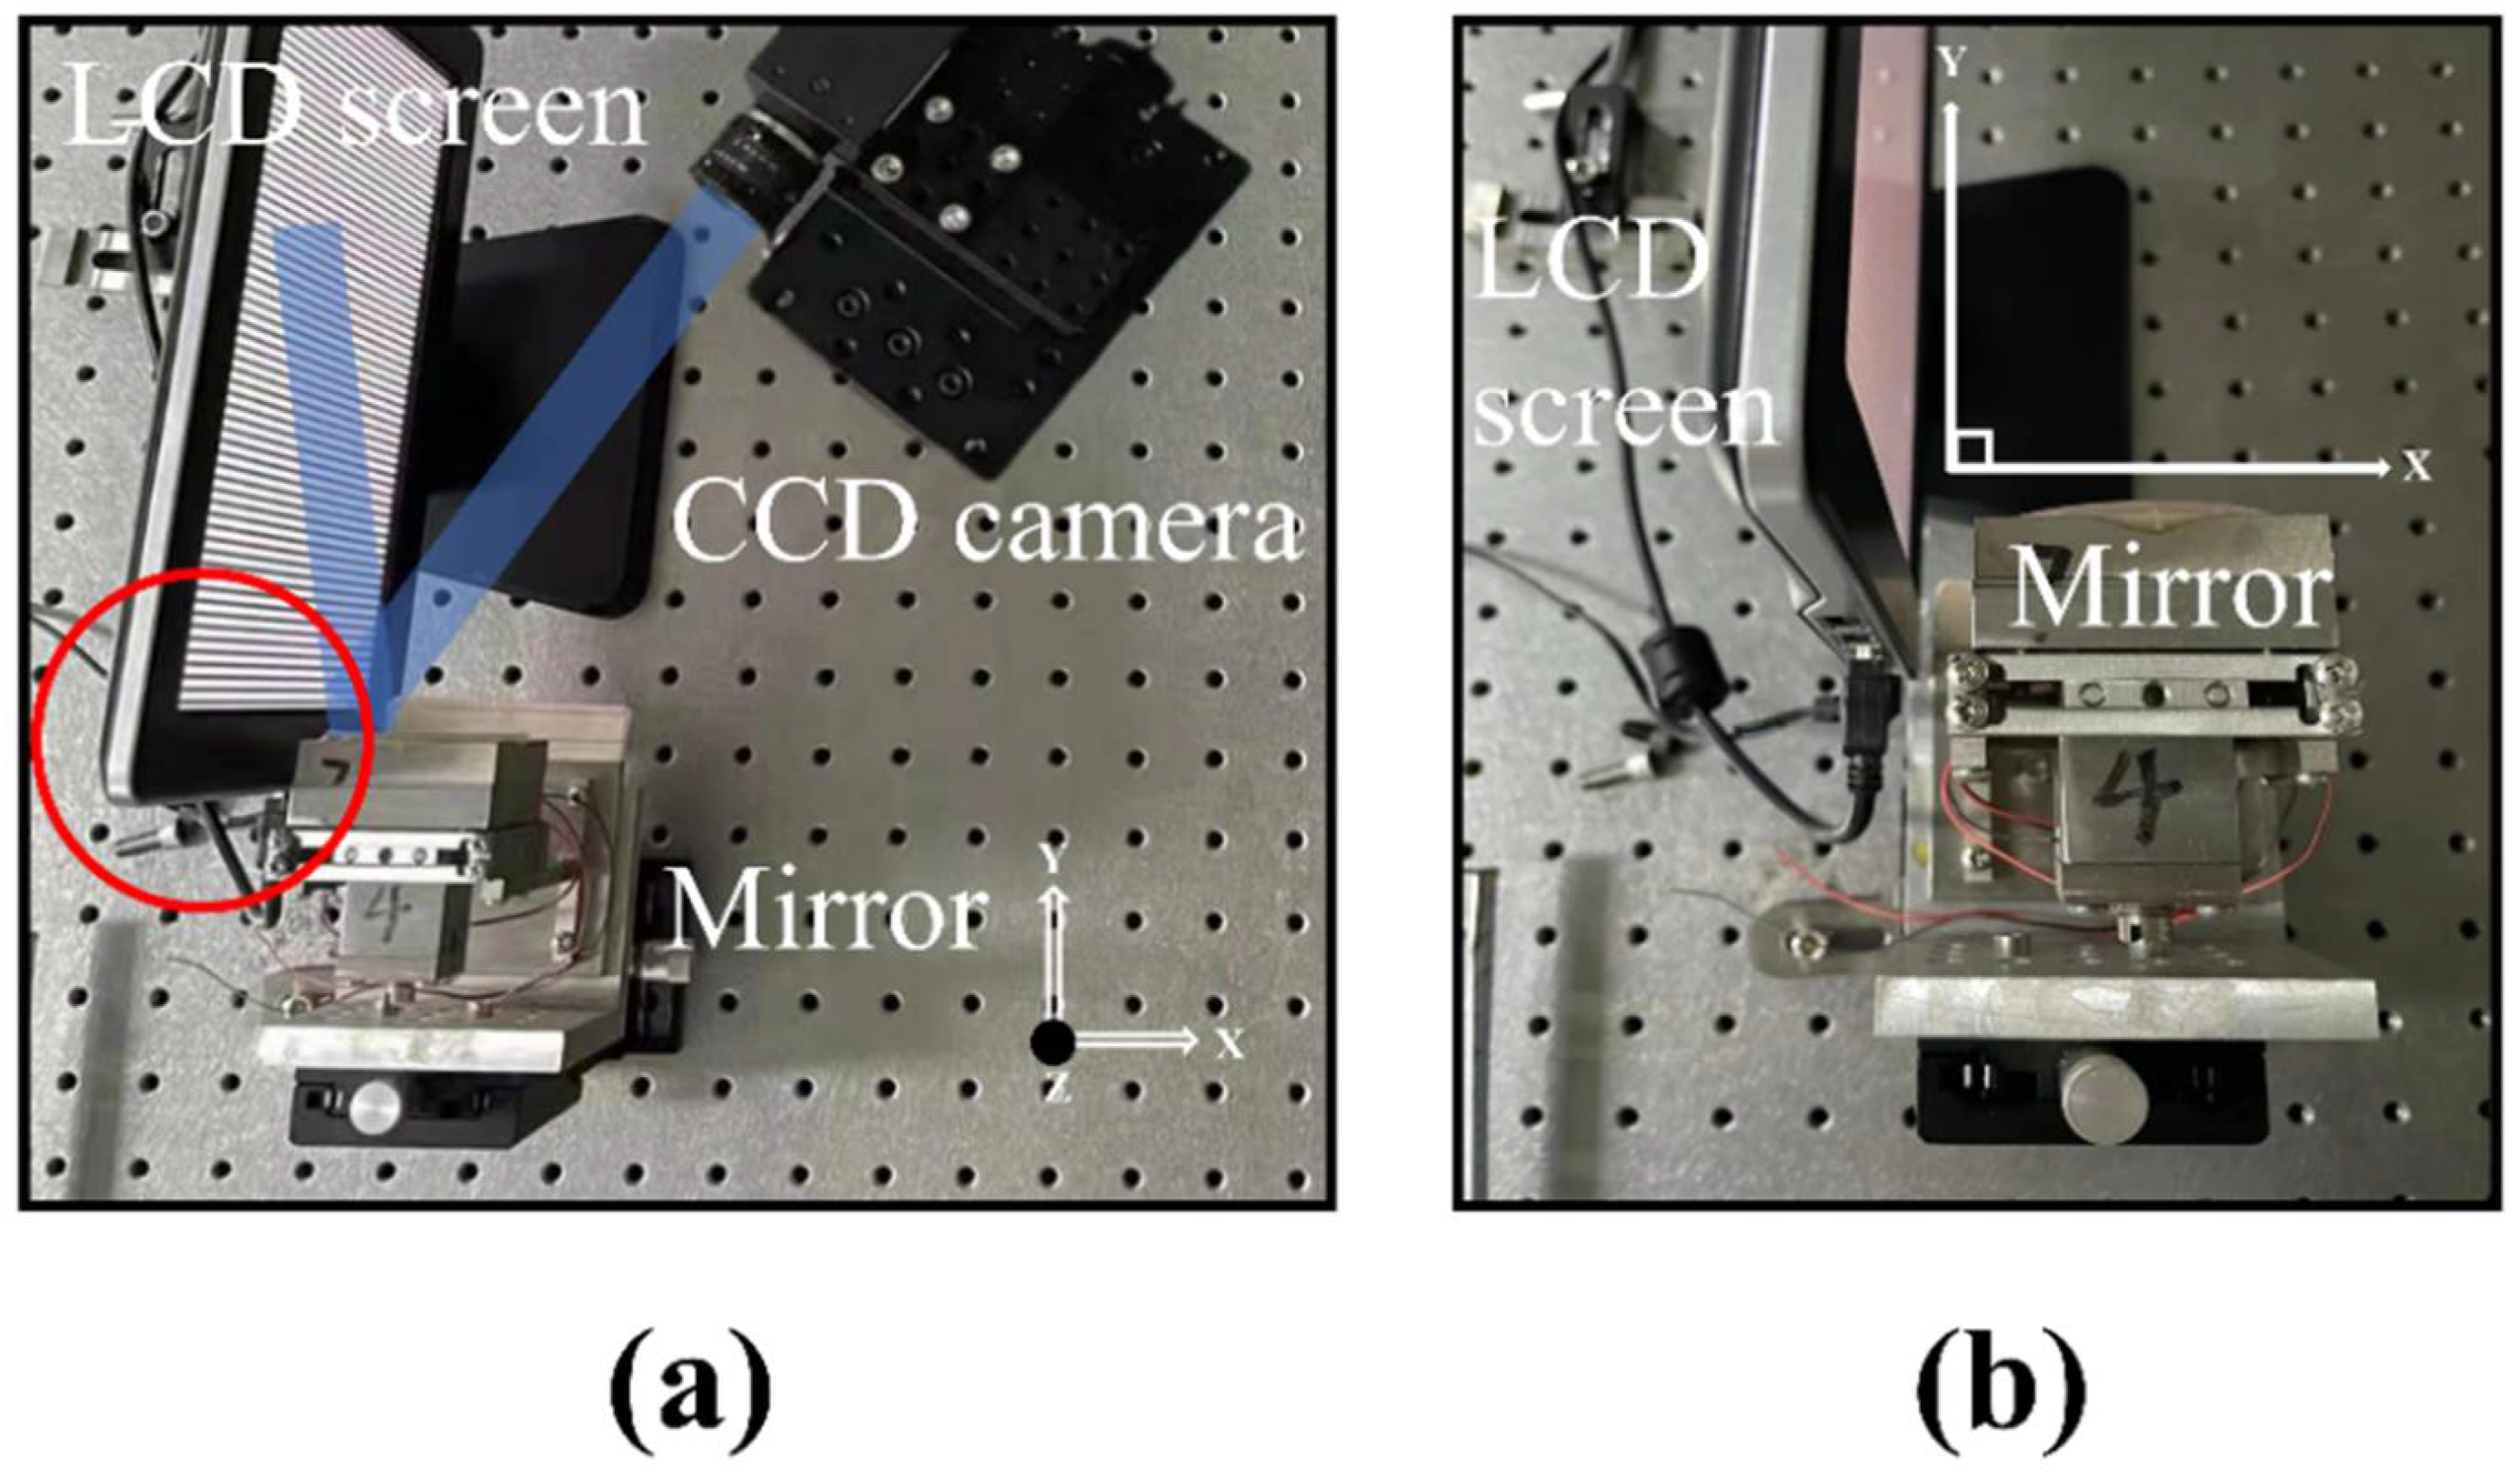
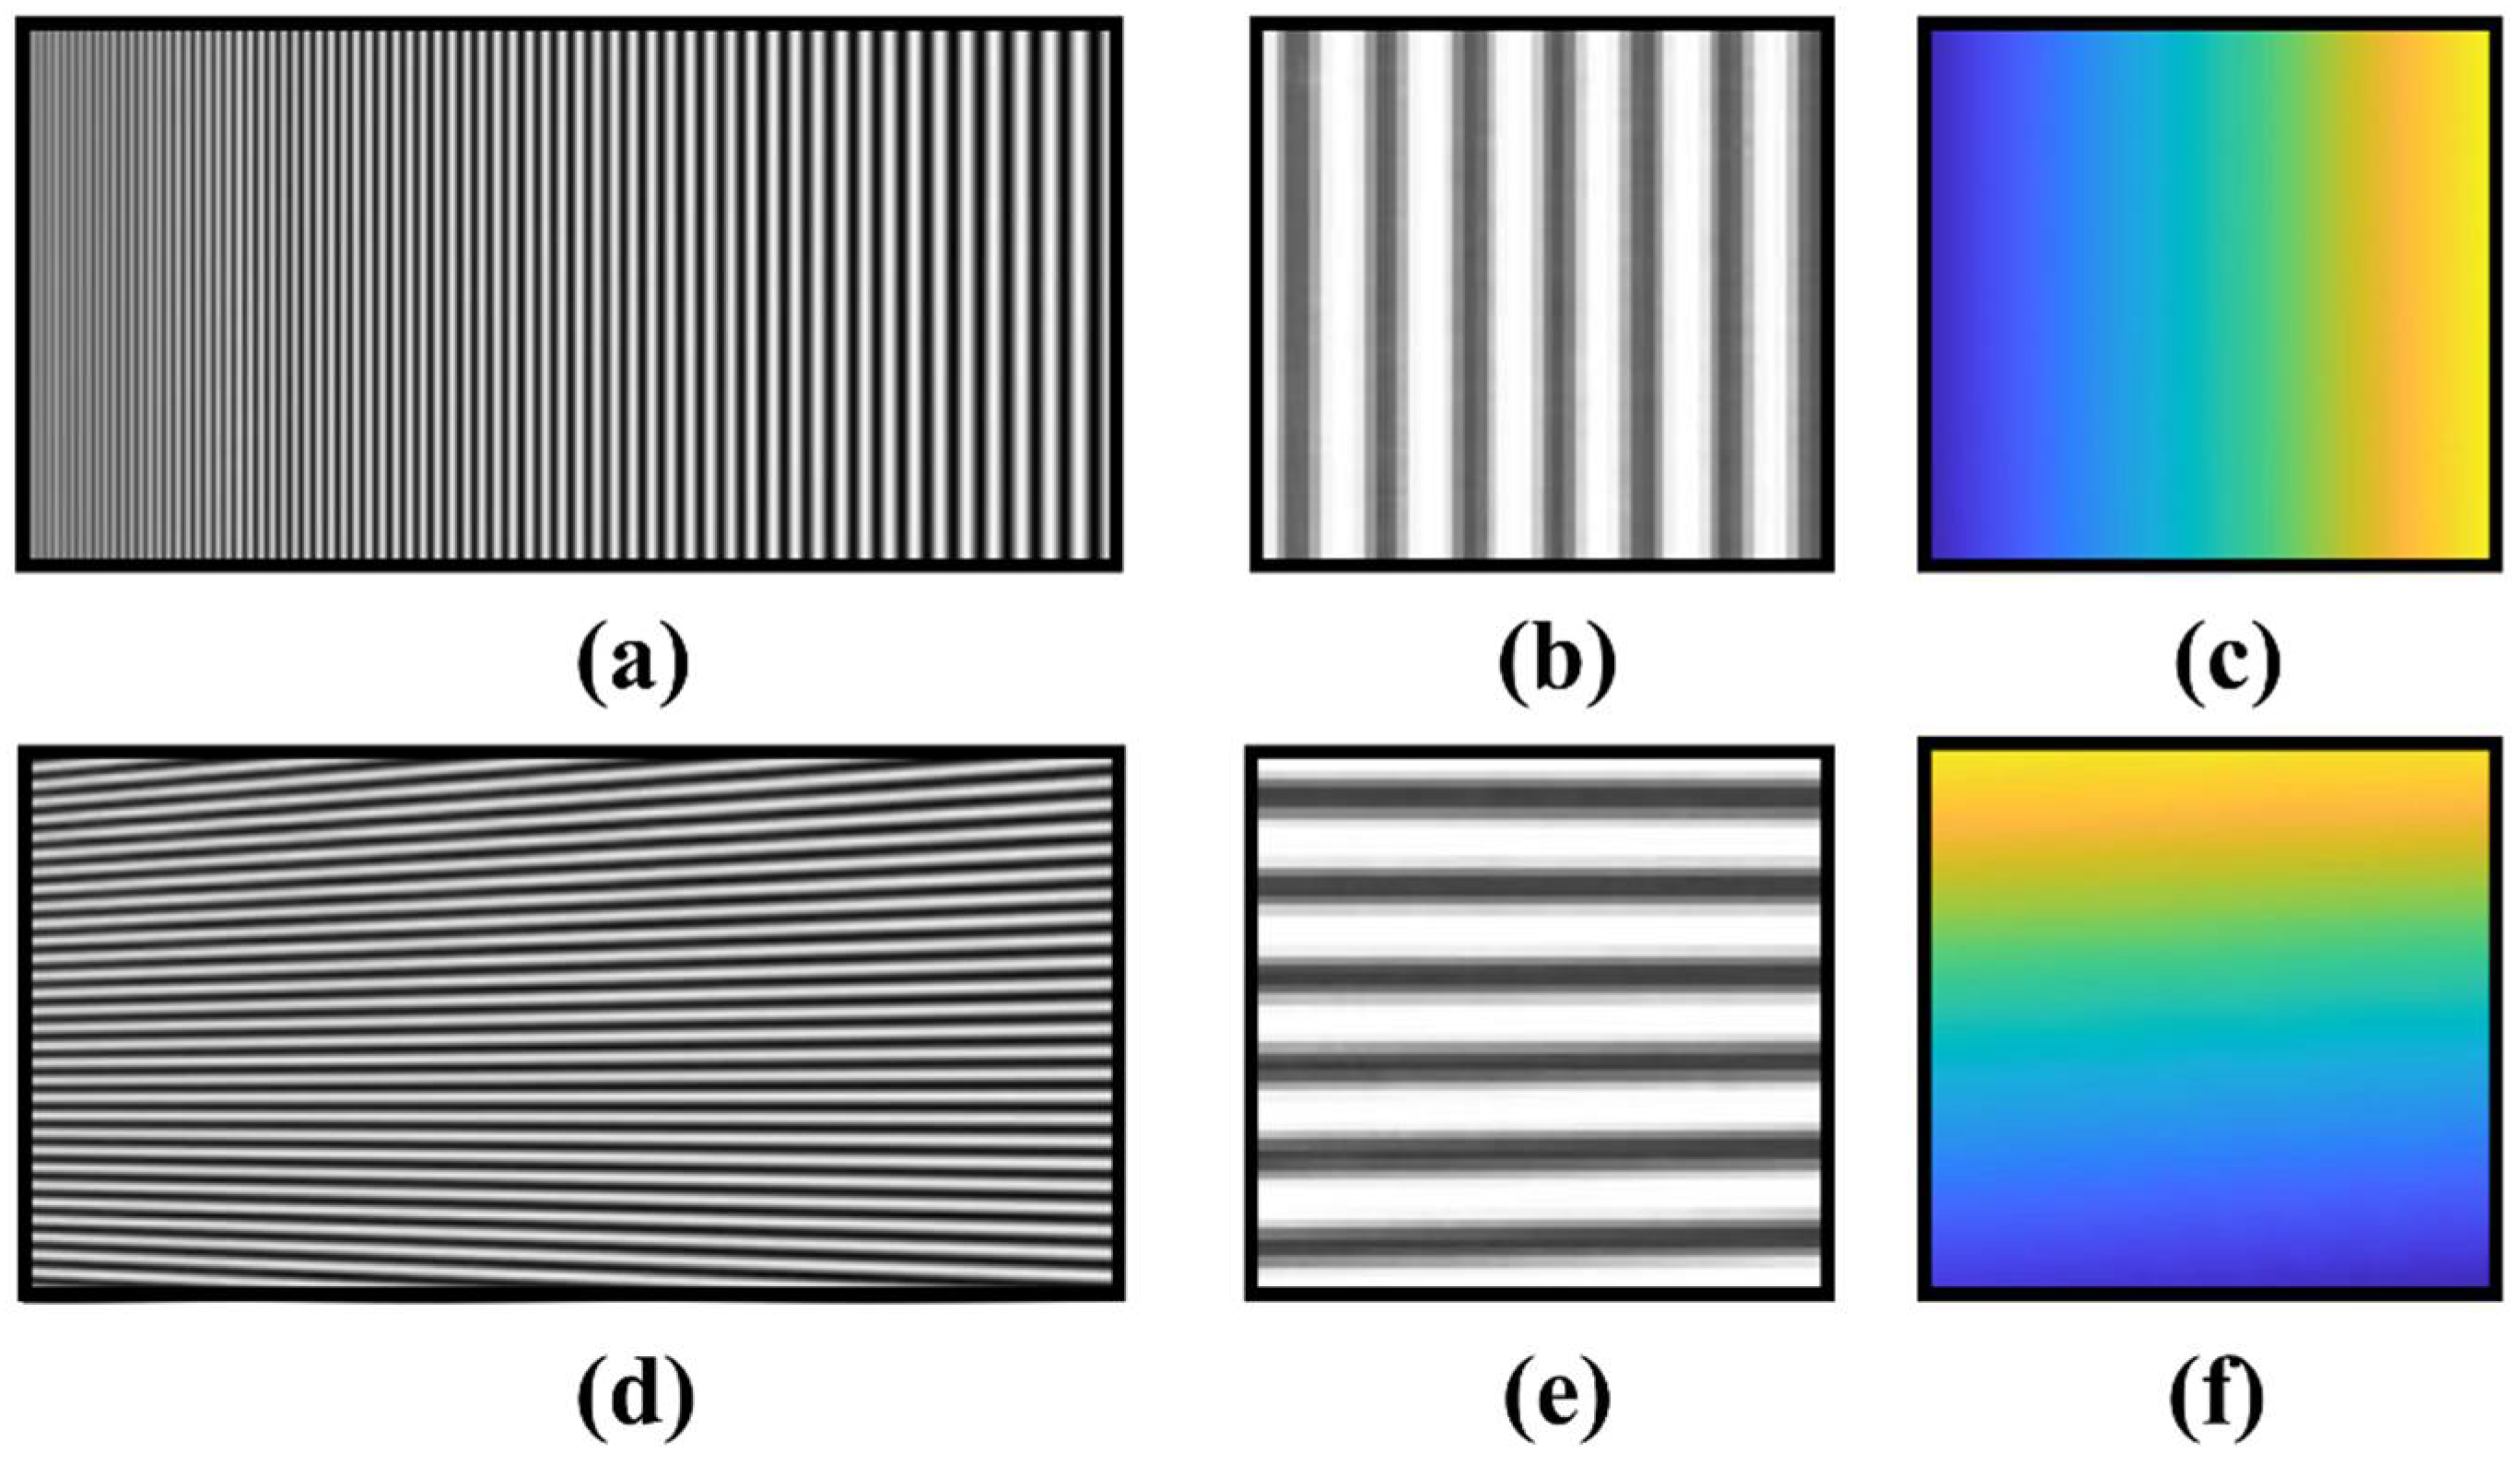
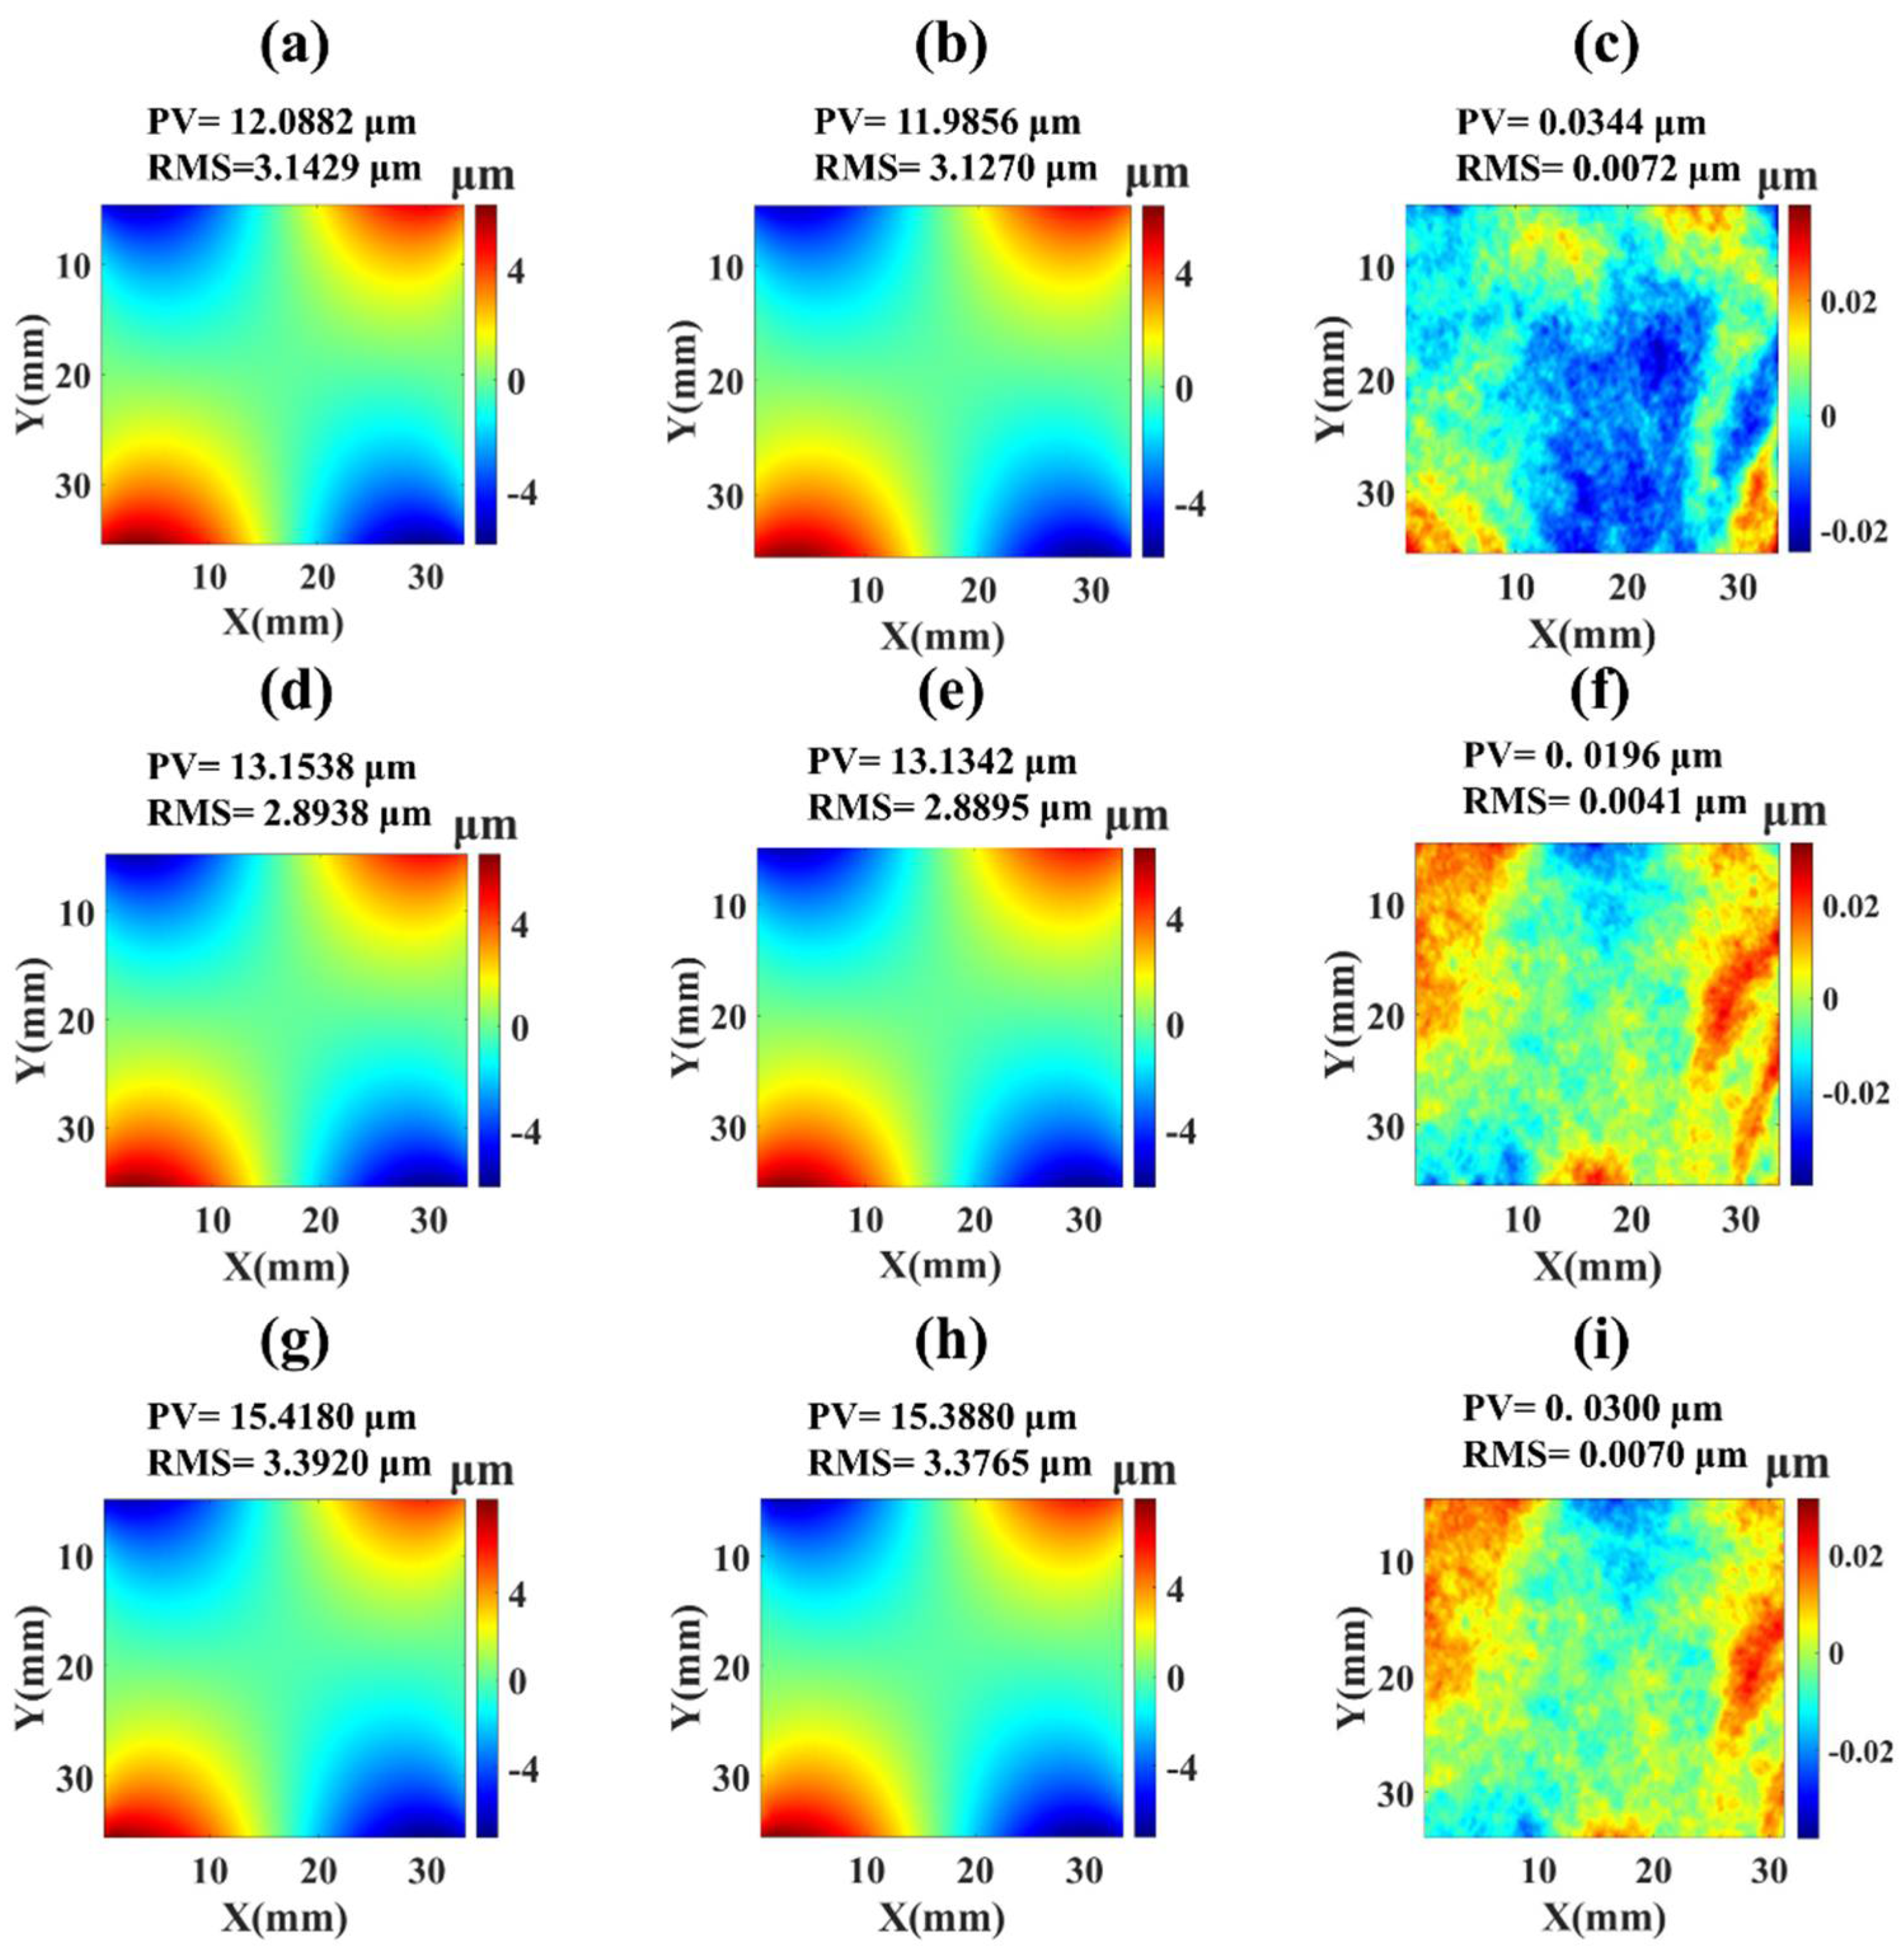
Figure 7 shows the geometric relationship and ray tracing between the optical mirror, the LCD screen, the LCDa screen, and the V-LCD screen, when the LCD screen rotates around the Z-axis with a rotation angle γ to the position of LCDa.
The camera’s image plane is set as the optical center coordinate O c . The vector of the reflection ray from the mirror surface shape is set as A R and intersects with the LCD, V-LCD, and LCDa screens at points L 2 , L 1 , and L 2 a . As the LCD screen rotating to the position of LCDa, in contrast to the original vertical (Figure 7(b1)) and horizontal (Figure 7(b2)) fringes on the LCDa screen, the spacings of the actual reflected vertical (Figure 7(b3)) and horizontal (Figure 7(b4)) fringes captured by the CCD camera become smaller. From the geometric relationship depicted in Figure 7c, the period of the reflected fringes decreases from g to g due to the rotation of the LCD screen. The relationship between the periods g and g is written as Equation (26), and the difference Δ D 4 between the theoretical and actual reconstructed wavefront distortions can be expressed as Equation (27).
g = g · cos γ
Δ D 4 = D i D j = ( 1 cos γ ) · D i
where D i and D j represent the theoretical and actual reconstructed wavefront distortions, respectively. According to Equation (27), the rotation angle γ of the LCD screen around the Z-axis should be kept as small as possible to minimize the measurement error Δ D 4 , which means that the LCD screen should be controlled strictly perpendicular to the mirror in practical measurement.
Measurement errors caused by the translation along the X-axis and Y-axis and the rotation around the Y-axis and Z-axis directions are analyzed to illustrate the measurement accuracy of the COPMD. Beside the four types of misalignments, two other types of misalignments, i.e., the translation along the Z-axis and the rotation around the X-axis of the LCD screen, only bring the translation and rotation of the fringes and will not affect the measurement accuracy. According to the analysis above, the optical components should be aligned in high precision to reduce the influence of measurement errors when applying the COPMD method in a practical laser cavity.

4. Experiment

An experiment was conducted to investigate the validity of the COPMD method. In our experimental setup, a single-actuator deformable mirror (DM, 50 mm aperture, R = 50%@1064 nm) was taken as the mirror under test, as shown in Figure 8. The distance x c between the CCD camera and the LCD screen was set as 175 mm, while the relative position of the mirror x 0 was set as 25 mm, and the relative position of the LCD screen y 0 was set as 33 mm. Note that the LCD screen was set close and perpendicular to the mirror. An industrial lens (Computar M0814-MP2, 8 mm focal length and 1.4 F/#, Lenovo, Beijing, China) was installed on the CCD camera, which ensured the imaging system achieving enough depth of field to capture clear fringe pattern images. In order to obtain a high measurement accuracy, the four-step phase-shift method based on eight phase-shift fringe images was used in the experiment. Each fringe image from the LCD screen (LILLIPUT, 9.7″, 1024 × 768 pixels, 192 μm pixel size, Lenovo, Beijing, China) was captured by the CCD camera (Blackfly 2.3 MP Mono GigE PoE, 1920 × 1200 pixels, 5 μm pixel spacing, Point Grey, Vancouver, BC, Canada) four times repeatedly, and the surface shape of the mirror under test was reconstructed based on the algorithm [36,37]. During experiment, the acquisition noise could be reduced by averaging the captured images of the repeated measurements [38] and filtering out with an appropriate filtering window in the Fourier transform process [39].
In the experiment, the PMD method, a widely verified surface shape measurement method, was set as the comparison to verify the validity and flexibility of the proposed COPMD method. In order to minimize the influence of system errors caused by devices misalignment, the surface shape change (SSC) of a single-actuator DM was taken as the measurement object. Therefore, two major processes were contained in the experiment, including the first COPMD measurement process and the second PMD measurement process. In both processes, the initial surface shape of the single-actuator DM was measured first, and the upgraded surface shape was measured after a driving voltage was applied on the DM. Based on the initial and upgraded surface shapes, the SSC of the DM was measured. Note that during the experiment, only the driving voltage of the DM was changed, while other experimental conditions were kept unchanged.
In the COPMD measurement, the modulation functions (i.e., x V * and x H * ) for the vertical and horizontal fringes were first derived from Equations (5) and (6). Figure 9 shows the vertical (Figure 9a) and horizontal (Figure 9d) modulated sinusoidal fringe patterns on the LCD screen. According to the positional geometric relationship between the LCD screen and the mirror (Figure 2), the modulated fringes were transformed to equidistant fringes and captured by the CCD camera (Figure 9b,e) after being reflected by the DM. Note that it is equivalent to the PMD method that equidistant fringes emitted from V-LCD are captured by the CCD camera. To ensure the accuracy of the calculated phase distribution, an eight-image acquisition technique based on the eight-step phase-shift method was adopted in the wavefront reconstruction progress. Then, a phase-unwrapping algorithm was operated to calculate the fringe phase distribution along the X-axis and Y-axis (Figure 9c,f) based on the acquired images. Note that the acquired phase distributions in Figure 9c,f were calculated based on the fringes reflected by the initial surface shape and are taken as the reference in the experiment. After that, a certain driving voltage was applied on the single-actuator DM to make the surface shape deformed.
Reflected by the deformed surface shape, the upgraded fringe patterns (Figure 10a,c) were captured by the CCD camera, and the corresponding phase distributions along the X-axis and Y-axis are acquired (Figure 10b,d). By subtracting the reference phase distributions from the upgraded phase distributions, the phase distributions of the SSC along the X-axis and Y-axis [i.e., ϕ x ( x ,   y ) and ϕ y ( x ,   y ) ] were obtained. Based on the phase distribution of the SSC, the distributions of the wavefront slopes [i.e., P x and P y ] were achieved based on Equations (14) and (15). Finally, the wavefront of the SSC was reconstructed by applying the numerical integration according to Equations (16) and (17).
Figure 11 shows the measured SSC by using the COPMD and PMD methods when the driving voltage applied on the DM is set as 5 V, 10 V, and 15 V separately. From Figure 11, the spatial distributions of the SSC measured by the two methods are the same astigmatism type. When a 5 V driving voltage was applied on the DM, the surfaces shape of the DM was distorted, and the PV values of the measured SSCs were 12.0882 μm (Figure 11a) and 11.9856 μm (Figure 11b) by using the COPMD and PMD methods, respectively, while the difference between the measurement results by using the two methods was as small as the PV value of 0.0344 μm and RMS value of 0.0072 μm (Figure 11c). In order to further verify the validity of the COPMD method, 10 V and 15 V driving voltages were separately applied on the DM, and the SSCs of the mirror were measured by using the two methods, while other experiment conditions remained unchanged. For the 10 V driving voltage, the difference between the measurement results was as small as the PV value of 0.0196 μm and RMS value of 0.0041 μm (Figure 11f), while the PV values of the measured SSCs were 13.1538 μm (Figure 11d) and 13.1342 μm (Figure 11e) by using the two methods, respectively. When the driving voltage increases to 15 V, the surface shape of the DM will get more distorted, but the difference between the measurement results is still very small (PV value of 0.0300 μm and RMS value of 0.0070 μm, Figure 11i), while the PV values of the SSC were measured as 15.4180 μm (Figure 11g) and 15.3880 μm (Figure 11h) by using the two methods, respectively. It should be noted that the difference in the experiment might be caused by measurement errors, including air perturbation, ambient vibration, and misalignment of the components.
Experiments show that the difference between the measurement results by using the two methods is quite small, which means that the measurement accuracy of the COPMD method could reach the high precision of the PMD method. In the COPMD method, the LCD screen was placed close and perpendicular to the mirror under test, and the compact space within the cavity could be efficiently used. Thus, the COPMD system could be flexibly applied for the real-time measurement in the enclosed laser facility and assembled laser system and remarkably expand the application range of the conventional PMD method.

5. Discussion

In a practical PMD system, the fringes reflected by the mirror captured in the CCD camera are used to calculate the wavefront distortion. However, limited by the wavefront reconstruction principle and algorithm, the LCD screen has to be placed in parallel with the surface of the mirror under test, which will take up a large measurement space [12,13,14,15,16,17,18,19,20,21,22,23,24,25,26,27,28,29,31,32,33,34,35,36,37]. It leads these mentioned methods to be primarily constrained in offline tests and not applicable for real-time measurement in the compact laser. Different from the PMD method, the proposed COPMD could make efficient use of compact space within the cavity by placing the LCD screen close and perpendicular to the mirror under test. Similar to the PMD method, the wavefront reconstruction of the COPMD method is also based on the sinusoidal fringe pattern projection and detection. However, the sinusoidal fringe on the LCD screen is a type of modulated fringe, which is determined by the relationship between the LCD screen, the CCD camera, and the mirror under test. As we know, the measurement is nonideal, and practical noises always exist, which would result in the difference between the actual distortion and the theoretical reconstructed wavefront. It should be noted that, in the COPMD measurement, if the slope of local surface shape is large enough, the reflected light might be blocked by bulges or pits on the surface. and the reflected fringe patterns received on the CCD camera will be incomplete. This means that wavefront reconstruction error will occur when measuring the optical mirror with a rough surface. Fortunately, the optical mirrors inside the cavity have a relatively good surface flatness, and small surface shape slopes to ensure the operation performance of the laser system. The distorted surface shapes of the mirrors resulting from thermal stress are primarily in low-order aberrations with small local slopes. Thus, the influence of the rough surface on the wavefront reconstruction is small enough and could be ignored. In order to avoid the crosstalk between the projection and detection, a reading trigger signal will be sent out to the CCD camera when the LCD screen is controlled to display a set of fringe patterns in the COPMD measurement. After acquiring each fringe pattern, the CCD camera will stop the detection and inform the LCD screen to update the projection. The synchronization between the projection and detection could help to avoid false readings and decrease acquisition accuracy. From the analysis in Section 3, the measurement error of the COPMD is primarily caused by the misalignments of the components, including the translation and rotation of the LCD screen, which provide practical guides for the alignment of the components to reduce the error and improve the measurement accuracy. Note that the measurement uncertainty might be caused and be estimated by system errors and ambient disturbances [12], including the defects in the LCD screen and the CCD camera, airflow disturbances, and ambient vibrations. To reduce the measurement uncertainty as much as possible, a high-resolution and high-quality LCD screen and CCD camera should be chosen, and the measurement environment should be maintained stably without ambient disturbances. For a wavefront distortion measurement system, the implementation of the COPMD requires no additional sensors and does not affect the measurement speed [40,41,42,43,44,45,46]. At the same time, the reconstructed calculation of the wavefront distortion is relatively simple and does not need to occupy lots of computing resources. The presented COPMD method provides an effective approach with good applicability and practicability to improve the surface shape distortion measurement capability in compact laser cavities.

6. Conclusions

In this paper, a compact online phase measuring deflectometry (COPMD) with the LCD screen set perpendicular to the mirror under test is presented for the surface shape distortion real-time measurement. The configuration of the COPMD method in an enclosed laser cavity is proposed, and the three-dimensional simulation model in the coordinate system is established to explore the relationship between the LCD screen and the mirror under test. The principle of the COPMD was theoretically derived by using the vector-form reflection law, and the modulation regulation of the sinusoidal fringe on the LCD screen was investigated. Based on the theoretical model, the measurement errors, due to the LCD screen translations along the X-axis and Y-axis, and the rotations around the Y-axis and Z-axis, are analyzed and discussed, which clarifies the relationship between the measurement accuracy and the misalignments of the components in practical lasers. In the experiment, a single-actuator deformable mirror was taken as the mirror under test and the PMD method was set as the comparison to verify the validity and flexibility of the proposed COPMD method. Experiment results show that the difference between the measurement results by using the two methods is very small, and the COPMD method has a high precision measurement accuracy. The presented COPMD system could make efficient use of the compact space for the online measurement in enclosed laser facilities and assembled laser systems, and thus remarkably expand the application range of the conventional PMD method.

Author Contributions

Conceptualization, L.H.; Data curation, Y.Z. (Yongchen Zhuang) and Y.Z. (Yamin Zheng); Formal analysis, Y.Z. (Yongchen Zhuang) and Y.Z. (Yifan Zhang); Funding acquisition, L.H.; Investigation, Y.Z. (Yongchen Zhuang) and L.H.; Methodology, Y.Z. (Yongchen Zhuang); Project administration, L.H.; Resources, L.H. and Y.Z. (Yamin Zheng); Software, Y.Z. (Yamin Zheng), S.L. and D.W.; Supervision, L.H.; Validation, Y.Z. (Yongchen Zhuang) and Y.Z. (Yamin Zheng); Visualization, Y.Z. (Yongchen Zhuang) and Y.Z. (Yamin Zheng); Writing—original draft, Y.Z. (Yongchen Zhuang); Writing—review and editing, Y.Z. (Yongchen Zhuang) and L.H. All authors have read and agreed to the published version of the manuscript.

Funding

This research was funded by the Science and Technology on Plasma Physics Laboratory, China Academy of Engineering Physics, grant number 6142A04180304, and the National Natural Science Foundation of China, grant number 61775112.

Data Availability Statement

The data presented in this study are available on request from the corresponding author.

Acknowledgments

Than authors are grateful to other colleagues for their help during the period of experimental measurement.

Conflicts of Interest

The authors declare no conflict of interest.

References

  1. Fedotov, S.I.; Feoktistov, L.P.; Osipov, M.V.; Starodub, A.N. Lasers for ICF with a controllable function of mutual coherence of radiation. Laser Res. 2004, 25, 79–92. [Google Scholar] [CrossRef]
  2. Koechner, W. Properties of solid-state laser materials. Solid-State Laser Eng. 1999, 1, 28–87. [Google Scholar]
  3. Chen, Y.F.; Liao, T.S.; Kao, C.F.; Huang, T.M.; Lin, K.H.; Wang, S.C. Optimization of fiber-coupled laser-diode end-pumped lasers: Influence of pump-beam quality. Quantum Electron. 1996, 32, 2010–2016. [Google Scholar] [CrossRef]
  4. Xiaolu, S.; Zhen, G.; Bingbin, L.; Shiyu, W.; Defang, C.; Jianguo, W. Thermal relaxation time of crystal in pulsed laser diode end-pumped solid-state laser. Chin. J. Lasers 2008, 35, 1132. [Google Scholar] [CrossRef]
  5. Wynne, R.; Daneu, J.L.; Fan, T.Y. Thermal coefficients of the expansion and refractive index in YAG. Appl. Opt. 1999, 38, 3282–3284. [Google Scholar] [CrossRef]
  6. Zacharias, R.A.; Beer, N.R.; Bliss, E.S.; Burkhart, S.C.; Cohen, S.J.; Sutton, S.B.; Arnold, T.J. Alignment and wavefront control systems of the National Ignition Facility. Opt. Eng. 2004, 43, 2873–2884. [Google Scholar] [CrossRef]
  7. Homoelle, D.; Bowers, M.W.; Budge, T.; Haynam, C.; Heebner, J.; Hermann, M.; Jancaitis, K.; Jarboe, J.; LaFortune, K.; Salmon, J.T.; et al. Measurement of the repeatability of the prompt flashlamp-induced wavefront aberration on beamlines at the National Ignition Facility. Appl. Opt. 2011, 50, 4382–4388. [Google Scholar] [CrossRef]
  8. Aleksandrov, A.G.; Zavalova, V.E.E.; Kudryashov, A.V.E.; Rukosuev, A.L.V.; Sheldakova, Y.V.; Samarkin, V.V.E.; Romanov, P.N. Shack—Hartmann wavefront sensor for measuring the parameters of high-power pulsed solid-state lasers. Quantum Electron. 2010, 40, 321. [Google Scholar] [CrossRef]
  9. Zheng, W.; Wei, X.; Zhu, Q.; Jing, F.; Hu, D.; Su, J.; Deng, X. Laser performance of the SG-III laser facility. High Power Laser Sci. Eng. 2016, 4, 21. [Google Scholar] [CrossRef] [Green Version]
  10. Platt, B.C.; Shack, R. History and principles of Shack-Hartmann wavefront sensing. J. Refract. Surg. 2001, 17, S573–S577. [Google Scholar] [CrossRef]
  11. Seifert, L.; Liesener, J.; Tiziani, H.J. The adaptive shack–hartmann sensor. Opt. Commun. 2003, 216, 313–319. [Google Scholar] [CrossRef]
  12. Knauer, M.C.; Kaminski, J.; Hausler, G. Phase measuring deflectometry: A new approach to measure specular free-form surfaces. Opt. Metrol. Prod. Eng. 2004, 5457, 366–376. [Google Scholar]
  13. Xu, Y.; Gao, F.; Jiang, X. A brief review of the technological advancements of phase measuring deflectometry. PhotoniX 2020, 1, 1–10. [Google Scholar] [CrossRef]
  14. Speck, A.; Zelzer, B.; Kannengießer, M.; Langenbucher, A.; Eppig, T. Inspection of freeform intraocular lens topography by phase measuring deflectometric methods. Appl. Opt. 2013, 52, 4279–4286. [Google Scholar] [CrossRef]
  15. Zhang, Z.; Chang, C.; Liu, X.; Li, Z.; Shi, Y.; Gao, N.; Meng, Z. Phase measuring deflectometry for obtaining 3D shape of specular surface: A review of the state-of-the-art. Opt. Eng. 2021, 60, 020903. [Google Scholar] [CrossRef]
  16. Liu, X.; Zhang, Z.; Gao, N.; Meng, Z. 3D shape measurement of diffused/specular surface by combining fringe projection and direct phase measuring deflectometry. Opt. Express 2020, 28, 27561–27574. [Google Scholar] [CrossRef] [PubMed]
  17. Sironi, G.; Canestrari, R.; Pareschi, G.; Pelliciari, C. Deflectometry for optics evaluation: Free form segments of polynomial mirror. Adv. Opt. Mech. Technol. Telesc. Instrum. 2014, 9151, 91510T. [Google Scholar]
  18. Häusler, G.; Knauer, M.C.; Faber, C.; Richter, C.; Peterhänsel, S.; Kranitzky, C.; Veit, K. Deflectometry Challenges Interferometry: 3D-Metrology from Nanometer to Meter. In Proceedings of the Digital Holography and Three-Dimensional Imaging, Vancouver, BC, Canada, 26–30 April 2009; p. DMC4. [Google Scholar]
  19. Faber, C.; Olesch, E.; Krobot, R.; Häusler, G. Deflectometry challenges interferometry: The competition gets tougher! Interferom. XVI Tech. Anal. 2012, 8493, 84930. [Google Scholar]
  20. Su, P.; Khreishi, M.; Huang, R.; Su, T.; Burge, J.H. Precision aspheric optics testing with SCOTS: A deflectometry approach. Opt. Meas. Syst. Ind. Insp. 2013, 8788, 392–398. [Google Scholar]
  21. Ye, J.; Niu, Z.; Zhang, X.; Wang, W.; Xu, M. Simultaneous measurement of double surfaces of transparent lenses with phase measuring deflectometry. Opt. Eng. 2021, 137, 106356. [Google Scholar] [CrossRef]
  22. Zhao, P.; Gao, N.; Zhang, Z.; Gao, F.; Jiang, X. Performance analysis and evaluation of direct phase measuring deflectometry. Opt. Lasers Eng. 2018, 103, 24–33. [Google Scholar] [CrossRef] [Green Version]
  23. Trumper, I.; Choi, H.; Kim, D.W. Instantaneous phase shifting deflectometry. Opt. Express 2016, 24, 27993–28007. [Google Scholar] [CrossRef] [PubMed] [Green Version]
  24. Nguyen, M.T.; Ghim, Y.S.; Rhee, H.G. Single-shot deflectometry for dynamic 3D surface profile measurement by modified spatial-carrier frequency phase-shifting method. Sci. Rep. 2019, 9, 1–15. [Google Scholar] [CrossRef] [PubMed]
  25. Zhao, W.; Su, X.; Liu, Y.; Zhang, Q. Testing an aspheric mirror based on phase measuring deflectometry. Opt. Eng. 2009, 48, 103603. [Google Scholar] [CrossRef]
  26. Burge, J.H.; Benjamin, S.; Caywood, D.; Noble, C.; Novak, M.; Oh, C.; Zhao, C. Testing of 1.4-m convex off-axis aspheric optical surfaces. Opt. Manuf. Test. 2009, 7426, 74260L. [Google Scholar]
  27. Yan, M.; Huang, L.; Sun, L.; Fan, J. Laser thermal distortion all-time metrology system for solid-state laser based on phase measuring deflectometry. Opt. Commun. 2018, 423, 134–139. [Google Scholar] [CrossRef]
  28. Zhou, P.; Martin, H.M.; Zhao, C.; Burge, J.H. Mapping distortion correction for GMT interferometric test. In Proceedings of the Optical Fabrication and Testing, Monterey, CA, USA, 24–28 June 2012; p. OW3D-2. [Google Scholar]
  29. Huang, R.; Su, P.; Horne, T.; Zappellini, G.B.; Burge, J.H. Measurement of a large deformable aspherical mirror using SCOTS (Software Configurable Optical Test System). Opt. Manuf. Test. 2013, 8838, 883807. [Google Scholar]
  30. Bian, P.; Shao, X.; Du, J. Finite element analysis of thermal stress and thermal deformation in typical part during SLM. Appl. Sci. 2019, 9, 2231. [Google Scholar] [CrossRef] [Green Version]
  31. Liu, Y.; Su, X.; Zhang, Q. Wavefront measurement based on active deflectometry. Opt. Test Meas. Technol. Equip. 2008, 6723, 67232N. [Google Scholar]
  32. Bothe, T.; Li, W.; Von Kopylow, C.; Juptner, W.P. High-resolution 3D shape measurement on specular surfaces by fringe reflection. Opt. Metrol. 2004, 5457, 411–422. [Google Scholar]
  33. Canabal, H.A.; Alonso, J. Automatic wavefront measurement technique using a computer display and a charge-coupled device camera. Opt. Eng. 2002, 41, 822–826. [Google Scholar] [CrossRef]
  34. Ghiglia, D.C. Two-Dimentional Phase Unwrapping: Theory. Algorithms Softw. 1998, 4, 21–24. [Google Scholar]
  35. Massig, J.H. Measurement of phase objects by simple means. Appl. Opt. 1999, 38, 4103–4105. [Google Scholar] [CrossRef]
  36. Huang, L.; Idir, M.; Zuo, C.; Asundi, A. Review of phase measuring deflectometry. Opt. Lasers Eng. 2018, 107, 247–257. [Google Scholar] [CrossRef]
  37. Zhang, Z.; Wang, Y.; Huang, S.; Liu, Y.; Chang, C.; Gao, F.; Jiang, X. Three-dimensional shape measurements of specular objects using phase-measuring deflectometry. Sensors 2017, 17, 2835. [Google Scholar] [CrossRef] [PubMed] [Green Version]
  38. Wu, Y.; Yue, H.; Yi, J.; Li, M.; Liu, Y. Phase error analysis and reduction in phase measuring deflectometry. Opt. Eng. 2015, 54, 064103. [Google Scholar] [CrossRef]
  39. Dhanotia, J.; Bhatia, V.; Prakash, S. Collimation testing using deflectometry in conjunction with windowed Fourier transform analysis. Appl. Opt. 2017, 56, 2346–2352. [Google Scholar] [CrossRef]
  40. Höfer, S.; Burke, J.; Heizmann, M. Infrared deflectometry for the inspection of diffusely specular surfaces. Adv. Opt. Technol. 2016, 5, 377–387. [Google Scholar] [CrossRef]
  41. Liu, Y.; Olesch, E.; Yang, Z.; Häusler, G. Fast and accurate deflectometry with crossed fringes. Adv. Opt. Technol. 2014, 3, 441–445. [Google Scholar] [CrossRef] [Green Version]
  42. Pehkonen, J.; Palojarvi, P.; Kostamovaara, J. Receiver channel with resonance-based timing detection for a laser range finder. IEEE Trans. 2006, 53, 569–577. [Google Scholar] [CrossRef]
  43. Nitzan, D.; Brain, A.E.; Duda, R.O. The measurement and use of registered reflectance and range data in scene analysis. Proc. IEEE 1977, 65, 206–220. [Google Scholar] [CrossRef]
  44. Beheim, G.; Fritsch, K. Remote displacement measurements using a laser diode. Electron. Lett. 1985, 21, 93–94. [Google Scholar] [CrossRef]
  45. Reza, S.A.; Khwaja, T.S.; Mazhar, M.A.; Niazi, H.K.; Nawab, R. Improved laser-based triangulation sensor with enhanced range and resolution through adaptive optics-based active beam control. Appl. Opt. 2017, 56, 5996–6006. [Google Scholar] [CrossRef] [PubMed]
  46. Trudel, V.; St-Amant, Y. One-and two-dimensional single-mode differential fiber-optic displacement sensor for submillimeter measurements. Appl. Opt. 2008, 47, 1082–1089. [Google Scholar] [CrossRef] [PubMed]
Figure 1. Configuration of the COPMD in an enclosed laser cavity. (a) Three-dimensional schematic diagram of the COPMD in laser cavity (an NIF-type laser cavity as an example). (b) Plane section of the schematic diagram.
Photonics 09 00151 g001
Figure 2. Measurement principle of the COPMD method. (a) Geometric relationship between the LCD screen, the V-LCD screen, the CCD camera, and the mirror. (b) Ray tracing from the CCD camera to the mirror, LCD screen, and V-LCD screen. (c) The V-LCD screen in the XOZ coordinate. (d) The LCD screen in the YOZ coordinate.
Photonics 09 00151 g002
Figure 3. Equidistant vertical fringes (a) and horizontal fringes (b) in the conventional PMD. Modulated vertical fringes (c) and horizontal fringes (d) fringes in the COPMD.
Photonics 09 00151 g003
Figure 4. Measurement error due to the LCD screen translation along the X-axis. Geometric relationship (a) and ray tracing (b) between the optical mirror, the LCD screen, the LCDa screen, and the V-LCD screen.
Photonics 09 00151 g004
Figure 5. Measurement error due to the LCD screen translation along the Y-axis. Geometric relationship (a) and ray tracing (b) between the optical mirror, the LCD screen, the LCDa screen, and the V-LCD screen.
Photonics 09 00151 g005
Figure 6. Measurement error due to the LCD screen rotation around the Y-axis. (a) Geometric relationship and ray tracing between the optical mirror, the LCD screen, the LCDa screen, and the V-LCD screen. (b) Representation of the XOZ plane of the LCD screen rotation. (c) Representation of the changes of reflected sinusoidal fringes due to the rotation.
Photonics 09 00151 g006
Figure 7. Measurement error due to the LCD screen rotation around the Z-axis. (a) Geometric relationship and ray tracing between the optical mirror, the LCD screen, the LCDa screen, and the V-LCD screen. (b) Representation of the changes of reflected sinusoidal fringes due to the rotation. (c) Representation of the XOZ plane of the LCD screen rotation.
Photonics 09 00151 g007
Figure 8. Experimental setup consisting of an LCD screen, a CCD camera, and a mirror under test. (a) The entire experimental configuration. Note that the blue area indicates the light beam path. (b) Enlarged view of the red marked area in (a).
Photonics 09 00151 g008
Figure 9. Initial surface shape measurement by using the COPMD. (a,d) are the vertical and horizontal sinusoidal patterns displayed in the LCD screen, (b,e) are the captured vertical and horizontal sinusoidal patterns on the CCD camera after reflected by the initial surface shape, while (c,f) are the vertical and horizontal calculated fringe phase of the initial surface shapes, respectively.
Photonics 09 00151 g009
Figure 10. Upgraded surface shape measurement by using the COPMD. (a,c) are the captured vertical and horizontal sinusoidal patterns on the CCD camera after reflected by the upgraded surface shape, while (b,d) are the vertical and horizontal calculated fringe phase of the upgraded surface shape, respectively.
Photonics 09 00151 g010
Figure 11. Spatial distribution and PV value of the SSC when 5 V, 10 V and 15 V voltages are applied on the DM separately by using the COPMD method [(a) 5 V, (d) 10 V, (g) 15 V] and the PMD method [(b) 5 V, (e) 10 V, (h) 15 V]. (c,f,i) are the difference map between the measurement results of the COPMD and PMD methods when 5 V, 10 V and 15 V voltages are applied on the DM separately.
Photonics 09 00151 g011
Publisher’s Note: MDPI stays neutral with regard to jurisdictional claims in published maps and institutional affiliations.

