Review

Application of Reflectance Indices for Remote Sensing of Plants and Revealing Actions of Stressors

Department of Biophysics, N.I. Lobachevsky State University of Nizhny Novgorod, 603950 Nizhny Novgorod, Russia
*
Author to whom correspondence should be addressed.
Photonics 2021, 8(12), 582; https://doi.org/10.3390/photonics8120582
Submission received: 8 November 2021 / Revised: 2 December 2021 / Accepted: 13 December 2021 / Published: 16 December 2021
(This article belongs to the Special Issue Topical Problems of Biophotonics)

Abstract

:
Environmental conditions are very changeable; fluctuations in temperature, precipitation, illumination intensity, and other factors can decrease a plant productivity and crop. The remote sensing of plants under these conditions is the basis for the protection of plants and increases their survivability. This problem can be solved through measurements of plant reflectance and calculation of reflectance indices. Reflectance indices are related to the vegetation biomass, specific physiological processes, and biochemical compositions in plants; the indices can be used for both short-term and long-term plant monitoring. In our review, we considered the applications of reflectance indices in plant remote sensing. In Optical Methods and Platforms of Remote Sensing of Plants, we briefly discussed multi- and hyperspectral imaging, including descriptions of multispectral and hyperspectral cameras with different principles and their efficiency for the remote sensing of plants. In Main Reflectance Indices, we described the main reflectance indices, including vegetation, water, and pigment reflectance indices, as well as the photochemical reflectance index and its modifications. We focused on the relationships of leaf reflectance and reflectance indices to plant biomass, development, and physiological and biochemical characteristics. In Problems of Measurement and Analysis of Reflectance Indices, we discussed the methods of the correction of the reflectance indices that can be used for decreasing the influence of environmental conditions (mainly illumination, air, and soil) and plant characteristics (orientation of leaves, their thickness, and others) on their measurements and the analysis of the plant remote sensing. Additionally, the variability of plants was also considered as an important factor that influences the results of measurement and analysis.

1. Introduction

Agriculture is one of the most important fields of human activity because it is the basis for food security and industry. However, plant cultivation is a long-term process and requires various resources, including energy, water, fertilizer, etc. The consumption of the products of plant cultivation increases with the increasing population of Earth. Plant cultivation can be limited for several reasons: (i) the variability of environmental conditions, including changes in temperature, precipitation, illumination, and others [1,2,3]; (ii) the local human activity contributing to pollution, unregulated fertilization, disturbances of the water regime in the soil, etc. [4]; (iii) the global climate changes that cause the expansion of droughty (arid) regions, soil salinization, etc. [5]. Important targets of action of these stressors in plants are energetic processes (namely photosynthesis and respiration), mineral exchange, hormone synthesis, stress programs in plant cells, and others [3]. The short-term influence of the stressors can increase the plant survivability; in contrast, their prolonged action exhausts plants [3,6]. Thus, the changes in environmental conditions become harmful for agricultural plants, which are strategically significant for regional development.
The control of the plant cultivation under changeable environmental conditions becomes an important problem, which requires the development of the methods of plant remote sensing [7,8]. Plant remote sensing is an important technology of a digital agriculture that provides the short-term and long-term monitoring of plants [9]. This sensing is mainly based on optical methods that are non-invasive, relatively simple, and high-throughput. Moreover, the important advantage of the optical methods is their safety for the environment. It is important that the modern optical methods can indicate plant physiological changes and damage that cannot be detected by a simple visual inspection.
Particularly, measurements of reflected light at specific wavelengths and calculation of reflectance indices (RIs) are widely used methods of the estimation of the development, productivity, and forming stress changes in plants [9]. There are several advantages of the application of the reflectance indices. First, the calculation of RIs usually requires measurements of the reflected light at only two to three wavelengths [10]; i.e., simple technical solutions can be used for these measurements. Second, RIs can be related to specific physiological processes [11] and biochemical compositions [12,13] in plants. This means that RIs can be used for the remote and non-invasive estimation of the details of plant development or stress changes [7,14]. Third, the imaging of RIs can have different temporal and spatial resolutions; this property provides additional tools for plant remote sensing [15,16]. Particularly, the spatial scale is the basis for the choice between the investigation of the single plant in detail and the complex analysis of the whole canopy of plants [9,17]. The analysis of the plant level contributes to reveal specific characteristics of single plant organisms, e.g., the forming physiological changes in leaves caused by the actions of stressors, including drought, salinity, excess light, non-optimal temperatures [11,18,19], and others. In the future, this analysis can be the basis for the recognition of the type of stressor that acts on the plant because the spatial distribution of RIs in the plant organism can be related to this type [1,16]. However, the spatial distribution of RIs in the canopy can also be heterogeneous [9,16]. This variability in the canopy optical properties can be related to large-scale differences in biomass, structures of leaves and canopy, pigment concentration, and others [16,20]. These differences can be caused by spatial heterogeneity in mineral nutrition [20], light intensity [16,21], precipitation [1], and other environmental factors. This heterogeneity can play both positive and negative roles in plant remote sensing. It can cause a decrease in the ratio of signal to noise at the imaging of the reflected light; i.e., disturb the measurement. In contrast, the information about this spatial heterogeneity of plant characteristics in the field can be used for the analysis of the distribution of the action of stressors; i.e., this information can be the basis for using protection actions in damaged zones.
Thus, the application of RIs has wide perspectives for plant investigations and remote sensing: (i) reflectance indices can be used for laboratory investigations of plant organisms in vivo; particularly, the development of the RI-based methods can simplify the analysis of physiological and biochemical processes in comparison with using complicated and expensive classical methods [10,22]; (ii) measurements of RIs can be used for high-throughput plant monitoring in fields and greenhouses [22]; in the future, they can be an important part of automatic systems of plant cultivation.
In our review, we considered the perspective and limitations of applying RIs for plant remote sensing. In Section 2, we described some optical methods of plant remote sensing, the main principles of scanning systems for measurements of reflectance in plants and canopy, and some mobile platforms for this remote sensing. Further, we described the main reflectance indices, including vegetation, water, pigment, and photosynthetic indices (Section 3). We focused on the relationship of growth, physiological, and biochemical characteristics with plant reflectance and on applications of these RIs. In Section 4, we discussed the methods of the corrections of RIs that are used for decreasing the influence of the environmental conditions on plant remote sensing.

2. Optical Methods and Platforms of Remote Sensing of Plants

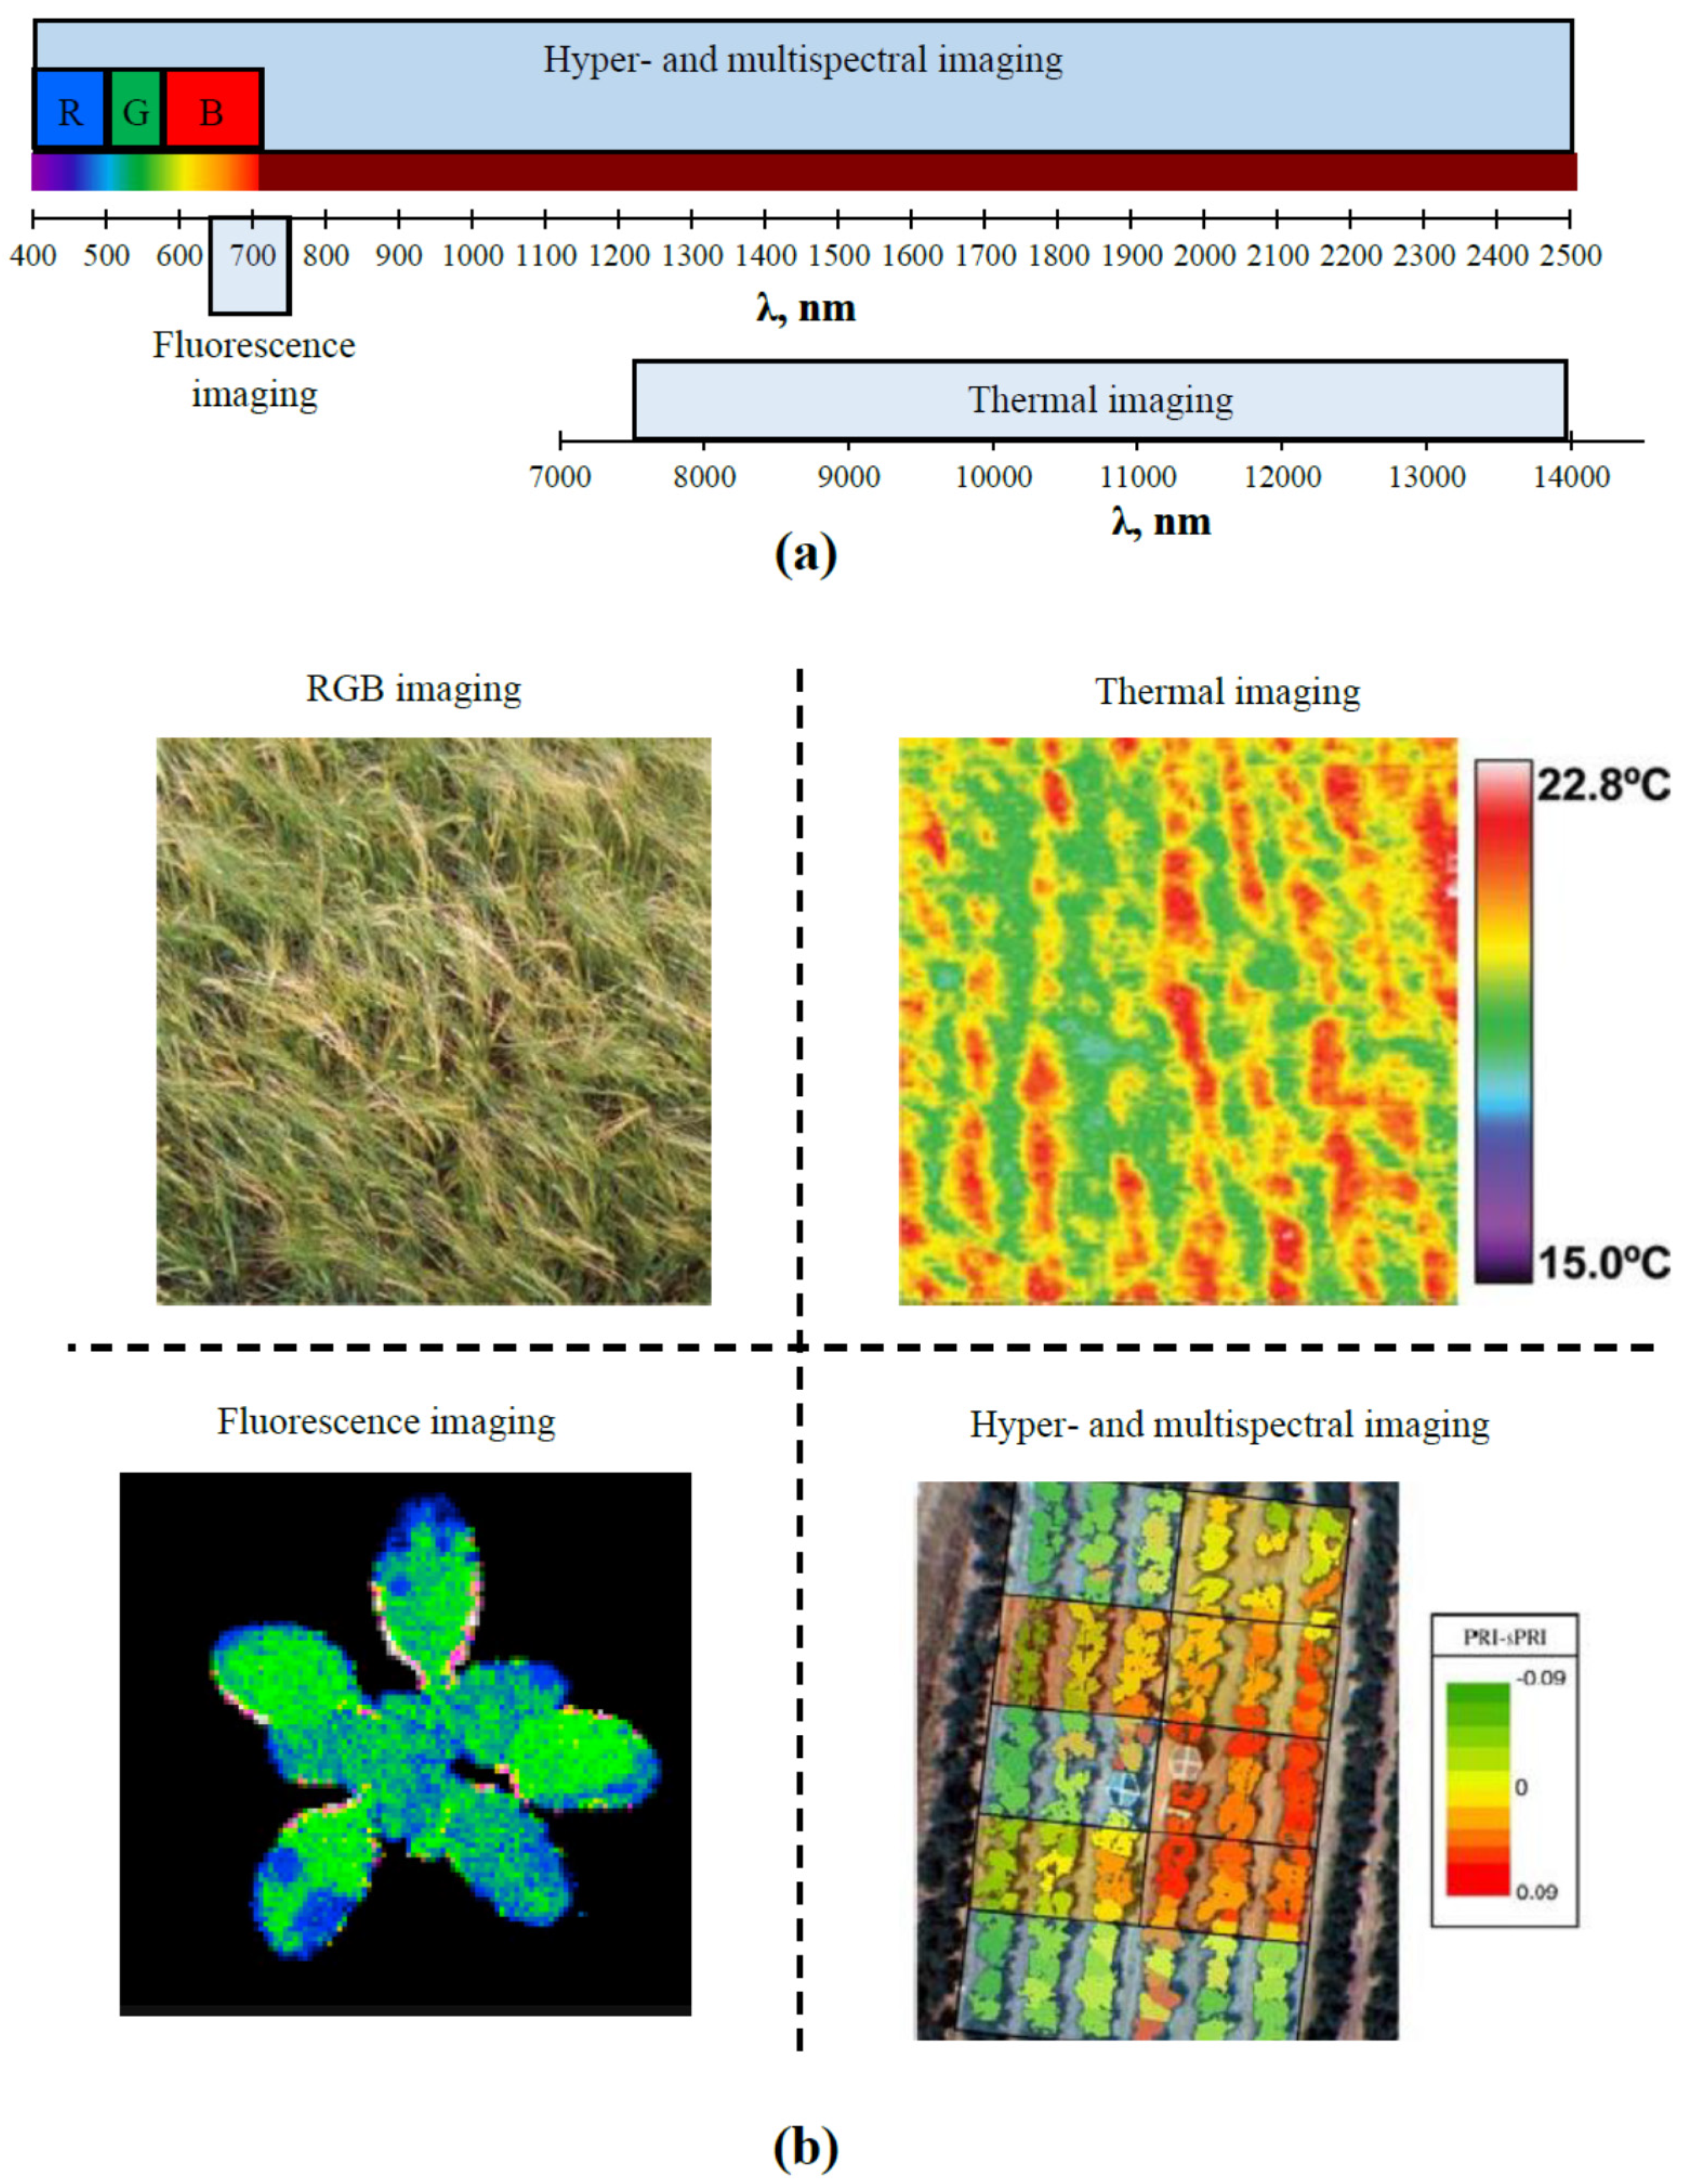
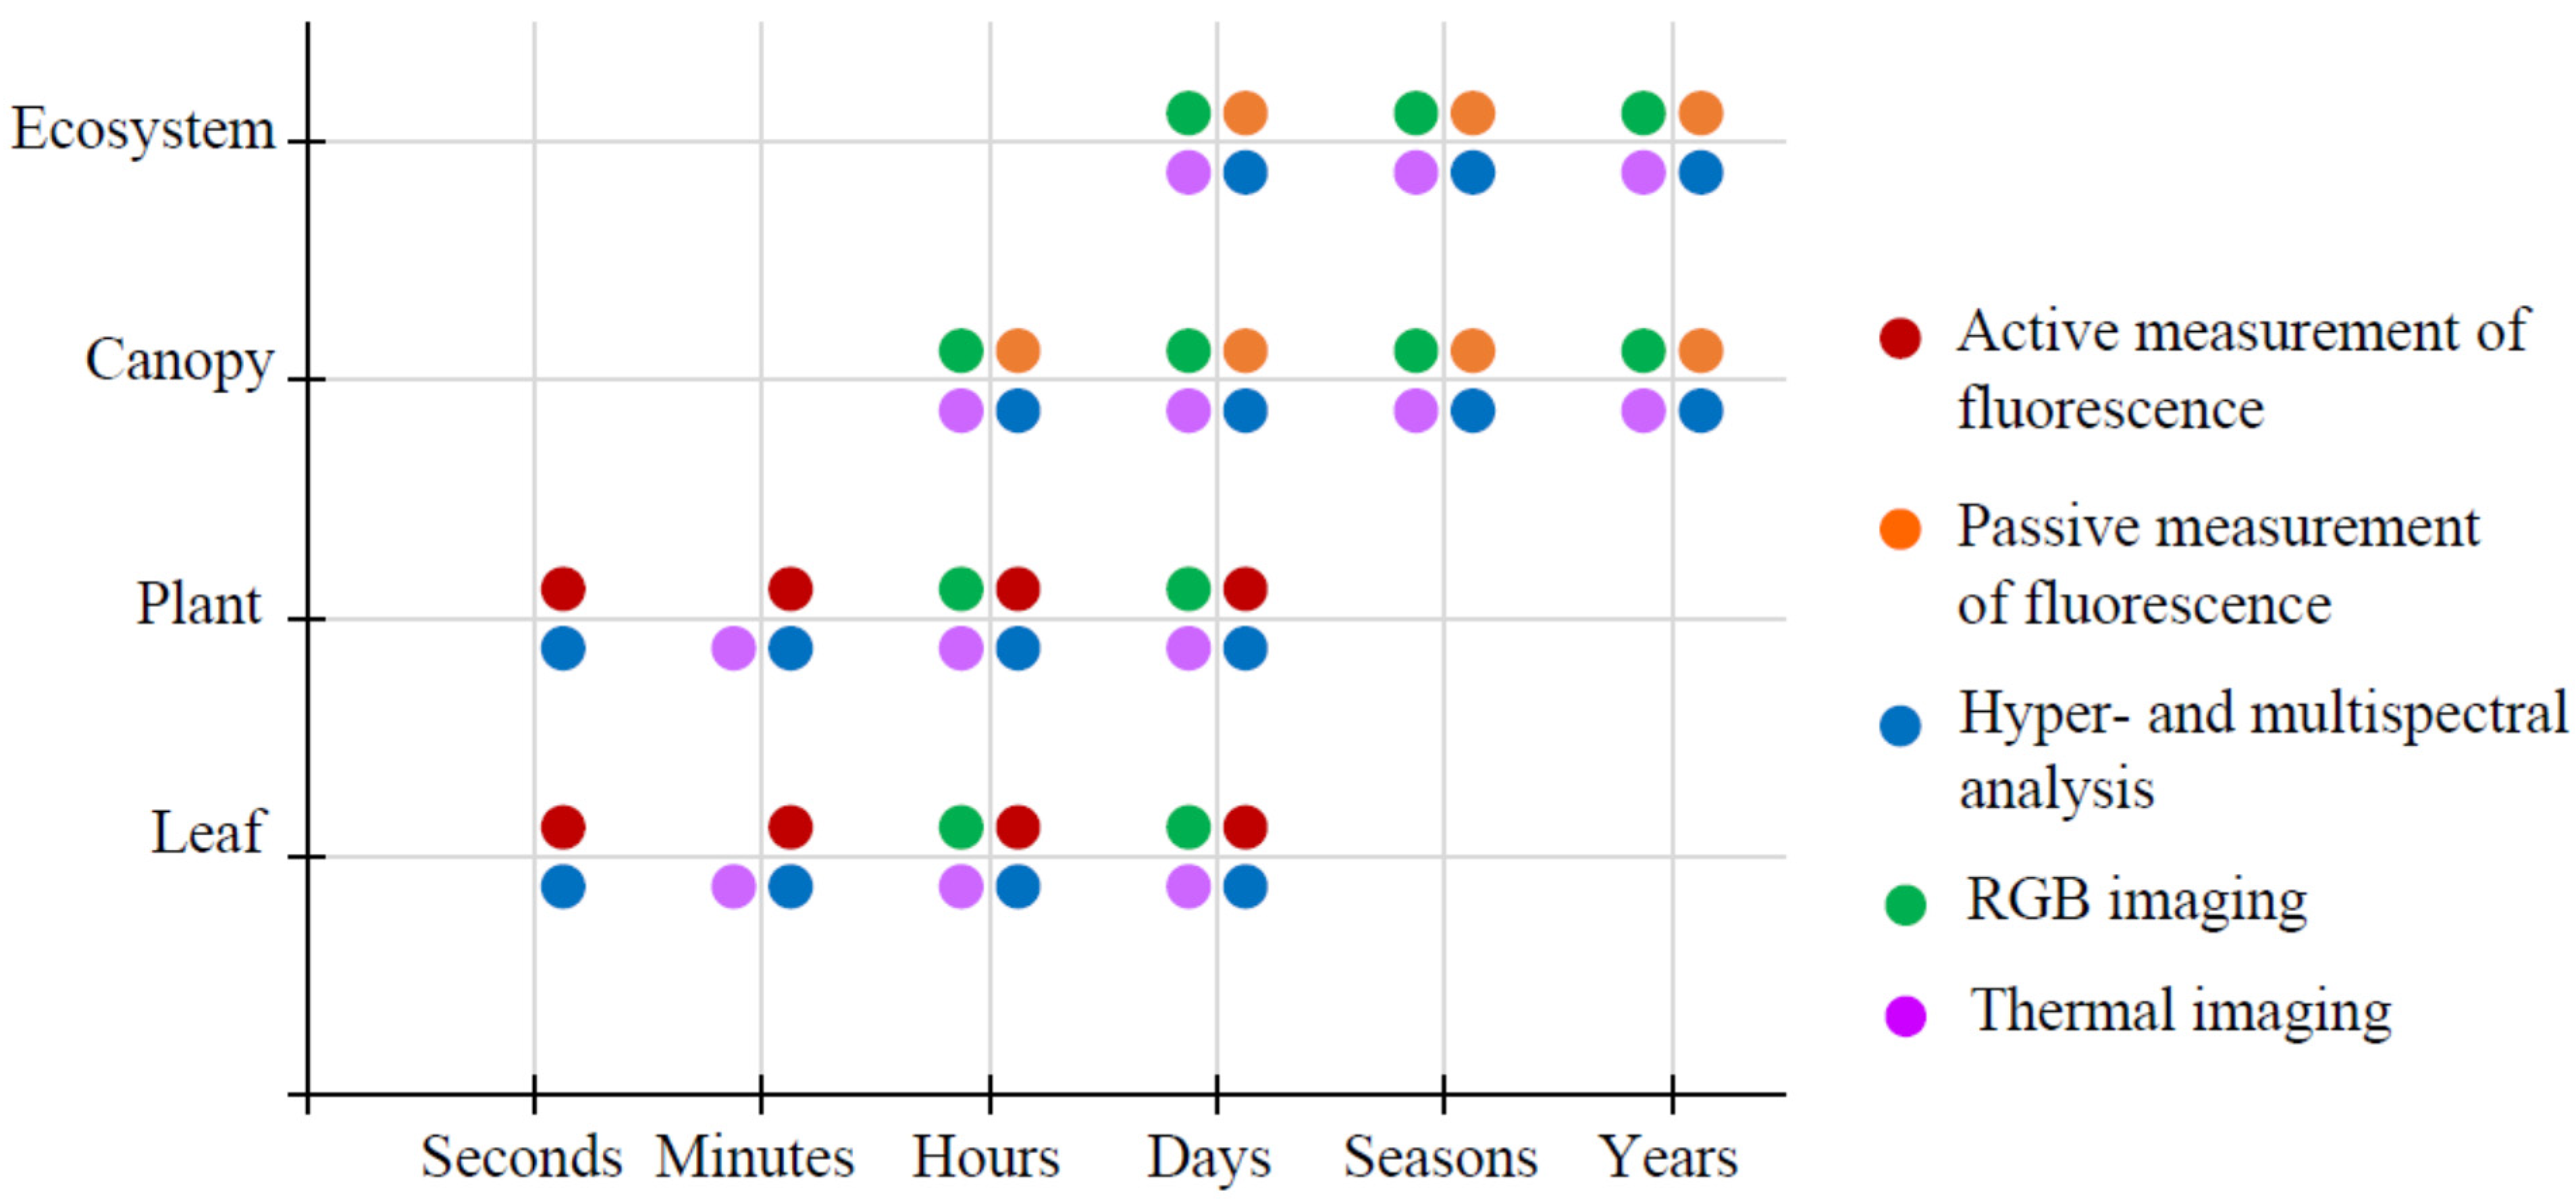
2.1. Main Optical Methods of Remote Sensing

The remote sensing of plants is often based on optical methods, including imaging of a chlorophyll fluorescence, RGB imaging, thermal imaging, and spectral imaging of the reflected light [23] (Figure 1). These methods are non-invasive; additionally, many of their modifications are remote and high-throughput.
The RGB imaging is a very important method of plant remote sensing because it is characterized by technical simplicity and availability [23,27]. As a result, this method can be used for the remote sensing of plant changes on various spatial scales (from single leaf to whole ecosystem(s)) (Figure 2); at that, RGB-imaging can be used for revealing relatively slow changes in plants (from hours and even days). The RGB cameras measure light in broad spectral bands of the visible light (red, green, and blue bands) (Figure 1a); these cameras also have weak sensitivity to the near-infrared light (NIR) [28]. The RGB imaging is widely used for morphometric analysis (e.g., estimation of biomass [29] or leaf area index (LAI) [30]), recognition and classification of plants [31,32,33], mapping of species in the ecosystem (e.g., forest) [34,35], and others. However, the RGB analysis is restricted by a number of problems. First, the RGB imaging can be disturbed by fluctuations in light intensity or wind gusts [27]. Second, the calibration of the RGB camera is difficult due to the nonlinear gamma correction effect [33]. Additionally, a large number of interpolations for the transformation of the RGB image to the digital surface model are necessary; this decreases the accuracy of using the RGB imaging at remote sensing of this surface [33]. Moreover, relations between the broad bands of reflectance and specific physiological changes can be weak (e.g., these bands are not significantly related to changes in the parameters of photosynthetic light reactions [36]). Finally, the structural analysis of the plant canopy on the basis of the RGB imaging has limitations and requires special software [33].
Another prospective method of plant remote sensing is the measurement of a chlorophyll fluorescence, which is strongly related to the distribution of energy in the photosynthetic apparatus [37]. There are active (the fluorescence is induced by special measuring light with controlled intensity) and passive (the fluorescence is induced by ambient light) methods of fluorescence imaging [38]. The emission of the chlorophyll fluorescence is mainly observed at a 650–750 nm spectral range; the fluorescence is maximal at about 680 nm [39] (Figure 1a). The active measurements of the chlorophyll fluorescence are used for the estimation of photosynthetic activity on spatial scales from leaves to plants. However, using the active illumination of plants by the measuring light strongly limits the application of this method in cases of the remote sensing of canopy or ecosystems because long distances between the camera and plants are necessary in these cases [38] (Figure 2). In contrast, the passive measurement of the chlorophyll fluorescence does not require using the artificial measuring light because the ambient light (especially sunlight) is used for the fluorescence induction in this method [38,40]. The measurement of the sunlight-induced chlorophyll fluorescence is based on an analysis of the Fraunhofer lines, including lines of hydrogen absorption (656.4 nm) and telluric absorption of oxygen (687 and 760 nm); the lines are used for the discrimination between the chlorophyll fluorescence and reflected light (which can be more intensive) [40]. The development of methods of measurement and analysis of the sunlight-induced fluorescence is an important task of plant remote sensing; however, the interpretation of the results of the measurements of this fluorescence remains a very difficult problem [40].
The temperature can also be informative for plant remote sensing. The temperature changes can be measured in the 7500–14,000 nm range [23] (Figure 1a). The thermal imaging is mainly used for the analysis of transpiration in plants [23,41]. The transpiration is regulated by the opening/closing of stomates, which prevent overheating of the plant under increased temperatures [41] and control water loss in drought conditions [42]; i.e., the influence of these factors on plants can be analyzed on the basis of this thermal imaging. Additionally, changes in the temperature can be caused by plant damage during the development of diseases that influence transpiration [43]. However, the spatial resolution of the thermal imaging is lower in comparison to the RGB imaging (small details cannot be revealed), and the efficiency of this method is strongly dependent on the ambient temperature [23].
Finally, the spectral analysis of the reflected light on the basis of hyper- and multispectral imaging is a very promising method of plant remote sensing [33,44]. It is based on strong relations between the spectra of the reflected light and growth, physiological, and biochemical parameters of plants [7,12,13]. Visible, NIR, and short-wavelength infrared (SWIR) light ranges are used for the spectral imaging of the reflected light [7]. As a result, this imaging can be effectively used for plant remote sensing; the development of models of prediction and management of the plant productivity in agro- and natural ecosystems can also be based on the results of the spectral imaging of the reflected light [10]. Thus, methods of the hyper- and multispectral imaging were analyzed in our review; at that, we focused on the analysis of reflectance indices because measurements on the basis of these indices are a widely used method of plant remote sensing. There are numerous systems (from handheld devices to satellites) that were developed for measurements of the reflectance indices.

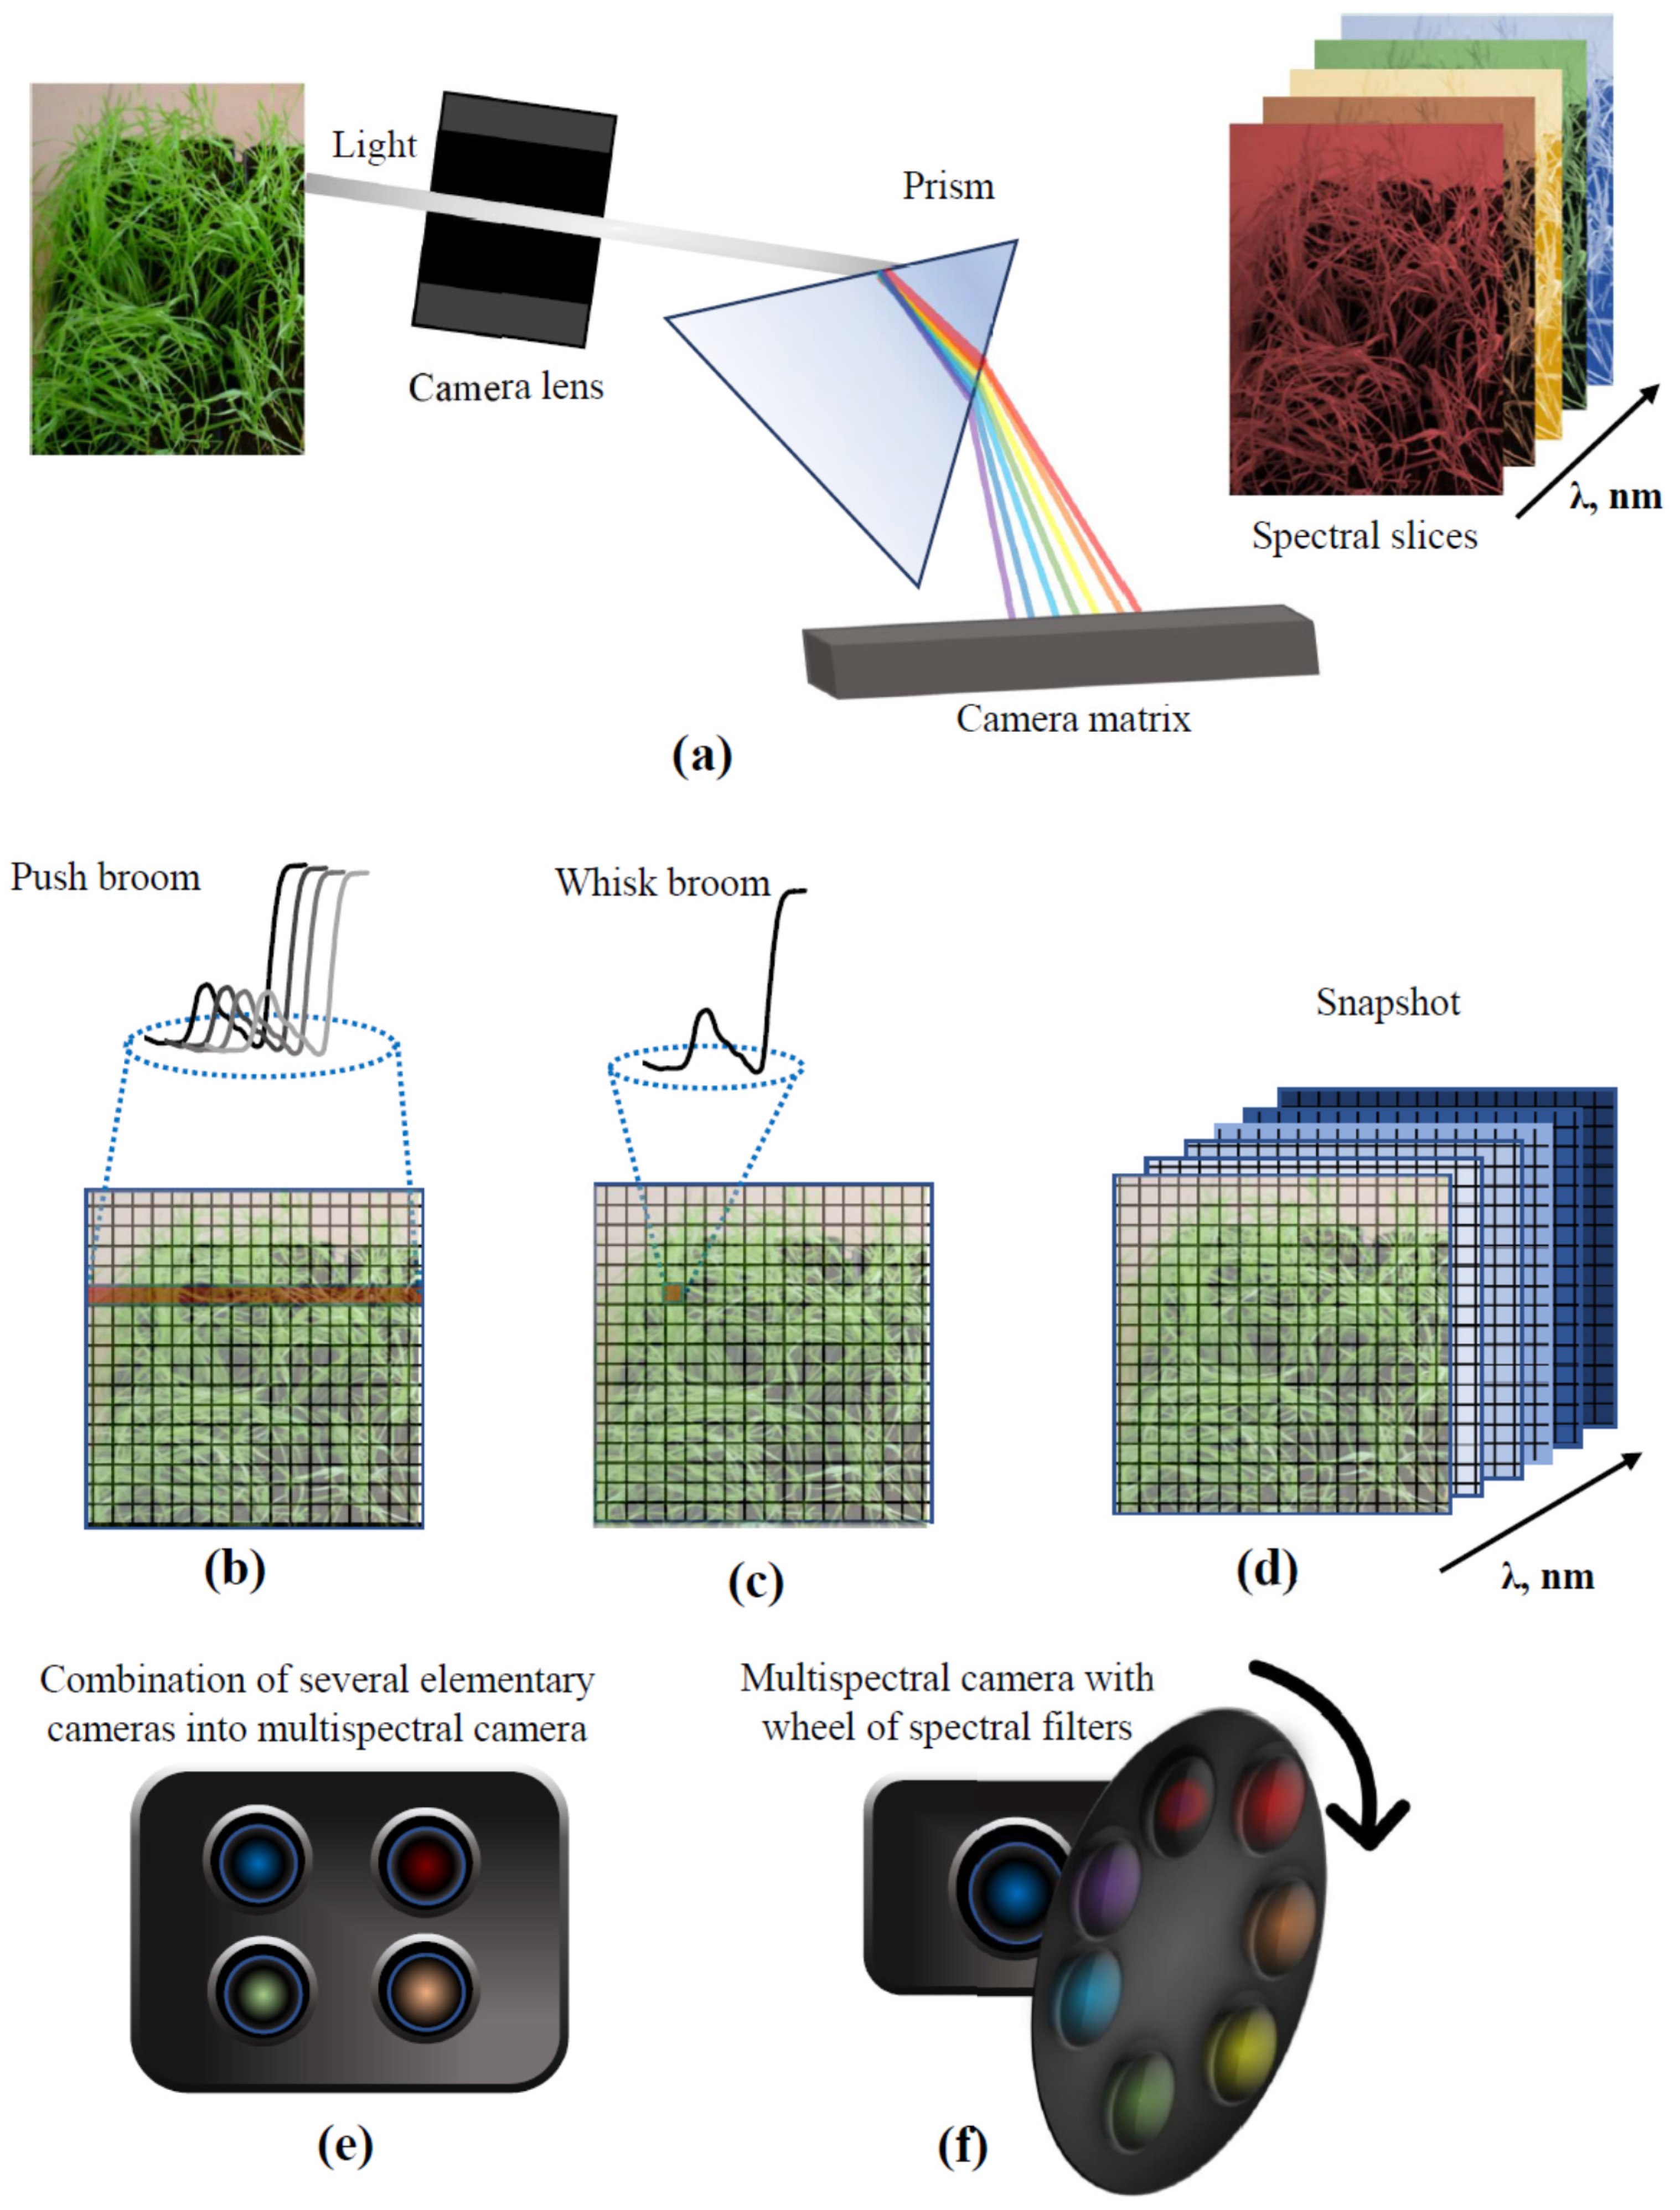
2.2. Multi- and Hyperspectral Imaging

The light interacts with all the environmental objects; the interactions include light absorption, reflectance, and scattering, which are dependent on the optical characteristics of the material of these objects. Measurements of the intensities of reflected light at narrow spectral bands are an effective approach of plant remote sensing that can be used for the estimation of the growth and development of plants [10], investigation of their physiological processes and biochemical compositions [12,13], analysis of water exchange [45], and others. Changes in the reflectance spectra of plants can be detected by hyper- and multispectral cameras, which are tools for hyperspectral and multispectral imaging, respectively. In accordance with Paulus and Mahlein [44] and Katsoulas et al. [22], a camera measuring more than 20 wavelengths can be classified as a hyperspectral camera; in contrast, a camera measuring less than 20 wavelengths is a multispectral camera. Hyperspectral data can be presented as a set of frames (“hypercube”), where each frame shows the spatial reflectance distribution at a specific wavelength; as a result, the whole spectrum of the reflected light in each point of the investigated object can be analyzed. In contrast, when using a multispectral camera, the information is strongly minimized because images are measured at only several specific wavelengths.
The hyperspectral cameras seem to be more interesting for application by researchers because they can be used for the solution of a broad range of tasks in the fields of the plant sciences and plant remote sensing. A simple variant in the architecture of the hyperspectral camera can include the camera lens, prism (or diffraction grating) for the division of light with different wavelengths, and matrix for the registration of the light signal (Figure 3a). This architecture is used in the “push broom” camera (Figure 3b). These sensors scan the surface line by line and simultaneously measure the light spectra in each point of the current line; an image is formed from these lines [22,44,46]. This type of sensor is widely used in plant remote sensing; particularly, flying mobile platforms of remote sensing, including copters, drones, airplanes, and satellites, are mainly equipped with these sensors.
Another variant of sensor, namely “whisk broom”, scans point by point [22,44]. The rotating mirror scans the surface; further, light is transmitted through the prism, and the spectrum of each point is registered [46]. The result of the hyperspectral measurement is the hypercube, which includes a set of images with reflectance at specific spectral bands. It should be noted that the possibility of using this method on the basis of the mobile platforms is rather limited.
The more complicated variant of sensors is the “snapshot” technique, including a group of alternative methods of remote sensing that can scan the whole hypercube in a small time (Figure 3d) and, therefore, have an increased speed of measurement [47,48]. The snapshot imaging is based on different technical solutions, which can be complicated (e.g., see review [47] for details). Potentially, snapshot imaging seems to be very promising for plant remote sensing and can compete with push and whisk broom cameras in the future.
The detectors of hyperspectral cameras with a spectral range from 300 nm to 1000 nm are two-dimensional matrices of photosensors performed on the basis of silicon. The registration of the waves in the SWIR light range requires detectors with InGaAs, which is a rare and expensive material [46]. It should be noted that hyperspectral cameras with an extremely broad spectral range (for simultaneous measurement of visible light, NIR, and SWIR) include matrices of both types [49].
Hyperspectral cameras (with small modifications) can be used for investigation in different spatial scales: from leaf to plant canopies and ecosystems [8]. Both the whole spectra of reflectance and specific spectral bands (which are the basis of the calculation of RIs) can be analyzed with hyperspectral imaging; both variants of analysis can be used for the detection of stress changes (e.g., revealing damage induced by diseases) [44].
Multispectral cameras are widely used alternatives for the hyperspectral cameras and can be applied for the remote sensing of single plants, their groups, canopies, and ecosystems [8]. These cameras are based on relatively simple technical solutions (e.g., simultaneously using several elementary cameras with different narrow-band spectral filters (Figure 3e) [44,48]), can minimize spectral data, and allow to estimate specific RIs; as a result, these cameras are also effective and provide the high-throughput scanning of plants. However, the combination of several cameras into the integrated imaging system can cause problems of alignment of the measured images. The different optical properties of the lens and spectral filters in the used elementary cameras cause different optical paths and aberrations in the measured images [50]; the problems are more expressive at low distances from plants. Potentially, the matrices of cameras can also have some differences. An alternative variant of the multispectral system can be equipped by the wheel of spectral filters (Figure 3f); using the single camera solves the problem of the alignment of measured images. However, the limited velocity of the mechanical rotation of this wheel decreases the velocity of the multispectral imaging [51]. Finally, it should be noted that the multispectral cameras with several elementary cameras equipped by the narrow band spectral filters are the main type of multispectral cameras that can be localized on flying mobile platforms (copters, drones, airplanes, and satellites).
Thus, the imaging on the basis of the measurements of reflected light at narrow spectral bands is a dynamically developing field of plant remote sensing. The hyper- and multispectral systems are actively used by investigators for imaging with a wide range of spatial and temporal scales.

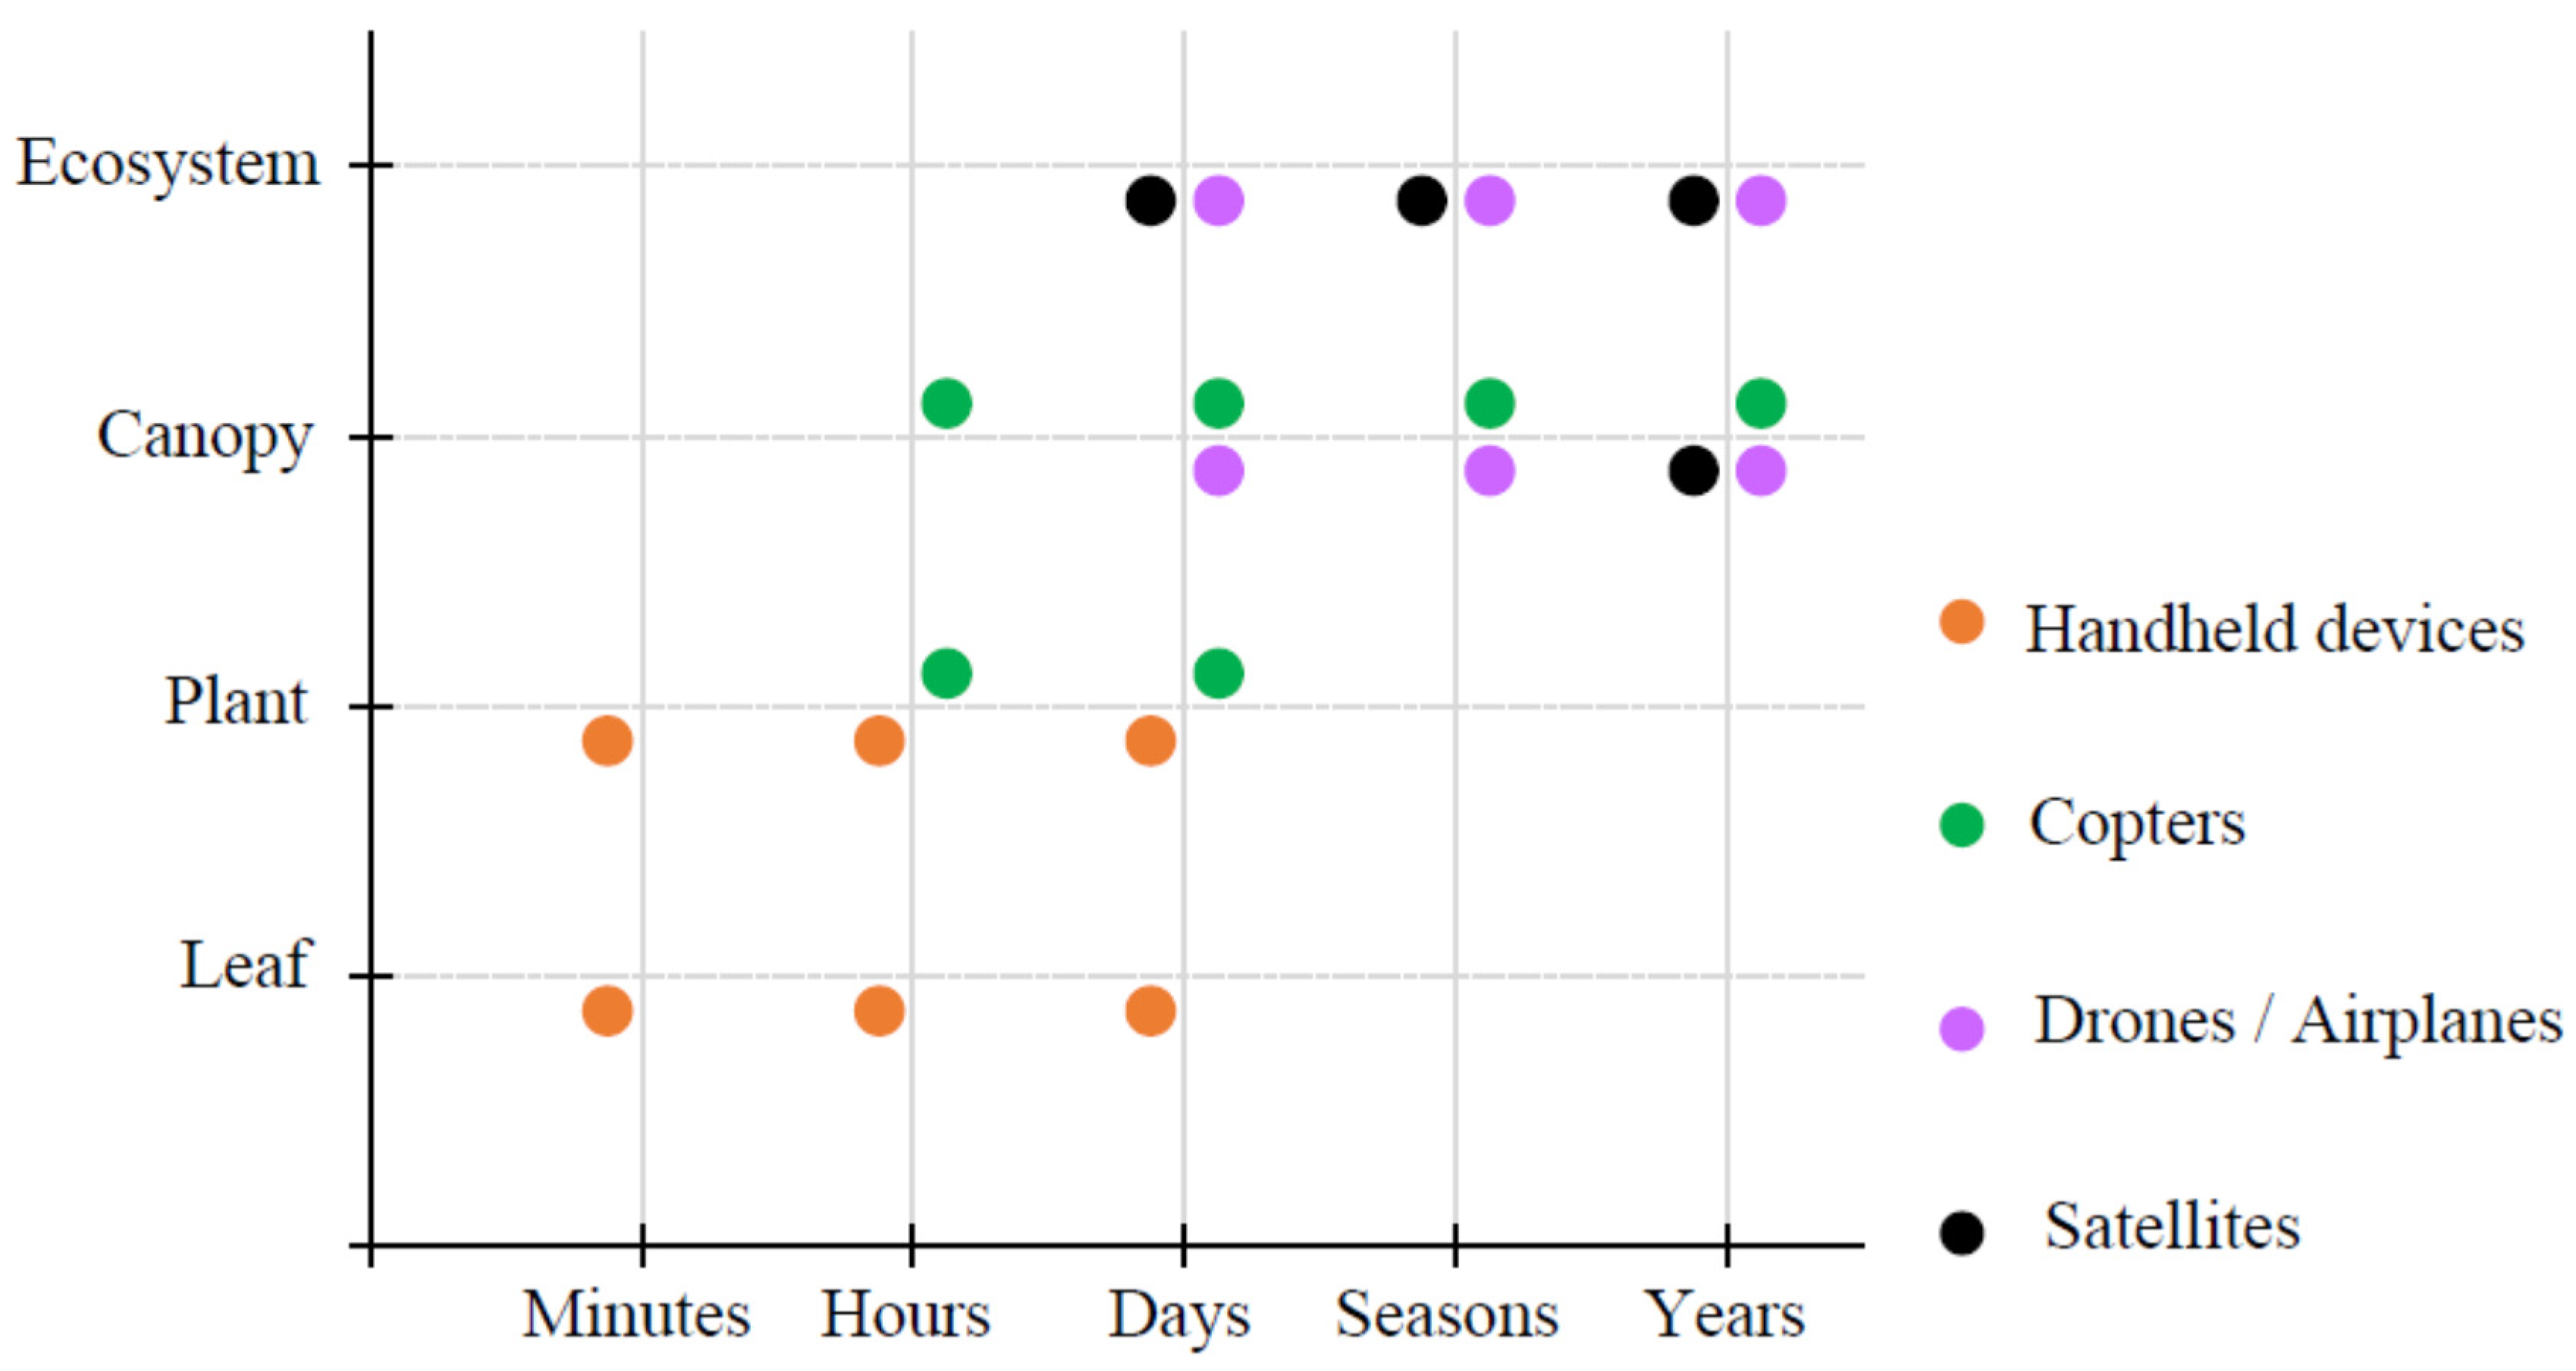
2.3. Some Platforms for the Plant Remote Sensing

The platforms of plant remote sensing can strongly differ; their type is dependent on the specific tasks of the remote sensing. In our review, we selected some groups of flying platforms: unmanned aircraft systems (UAS), including copters and drones, airplanes, and satellites. Manual measurements with handheld devices were also described because this “classical” method is also actively used for plant monitoring. Further, we used some criteria for the description of these systems of plant remote sensing, including the automatization of measurement, accessibility for researchers, possibility of construction of individual and complex of trajectory of measurements, and spatial and temporal resolution.
The handheld devices, which include systems of multi- and hyperspectral measurements in single leaves or plants, are the most accessible variants for researchers. In many handheld devices (see, e.g., the devices by Photon System Instruments, Czech), the positions of the leaf, light source, and light detector are fixed; this means that the measurements of the spectral characteristics of the reflected light can be very accurate. It should be noted that artificial illumination or a combination of the artificial illumination and sunlight can be used with these handheld systems [52] (e.g., halogen lamps are optimal for hyperspectral measurements [44] or light-emitting diodes for multispectral measurements [17]); in contrast, most of the flying mobile platforms for plant remote sensing cannot support the artificial illumination of objects (only sunlight is used because the distances between the camera and objects are too large). However, the velocity and spatial and temporal resolution of these measurements (Figure 4) are strongly limited by the speed of manual measurements; any automatization of the trajectory of the measurements is absent [33].
The prospective group is UAS platforms, which includes copters and drones [23]. The automatization of plant remote sensing on the basis of UAS is very high for both drones and copters because a program of flight can be automatically formed in accordance with a program of measurements [33,53]. The trajectories of multi- and hyperspectral measurements on the basis of copters can be constructed in wide ranges (the scanning of specific areas or point-by-point scanning of interesting parts can be used; the height of measurements can be controlled; the copter can hang over the area of interest and makes dependable observations; etc.) [53]. The resolutions of these systems vary from a few cm to tens of cm [33]; this property is interesting for the research of different spatial scales. An additional advantage of using the copter is their relatively low costs and accessibility for researchers [23]. However, using copters can be limited by the low loading capacity of copters, relatively slow speed, and short time of flight [23,33].
These problems are not crucial for drones, which have a high speed and relatively high loading capacity [27]. However, drones are more expensive than copters and cannot be used for the accurate scanning of interesting areas (there are minimal speeds and heights of the flight of drones [27,33]); as a result, increasing the total area of investigation and duration of the flight by using drones is accompanied with a decrease in the resolution of the measurements [33]. Using airplanes for plant remote sensing is similar to using drones, but their loading capacity and speed are even greater; the last point increases the spatial and temporal scale of the measurement and decreases the spatial resolution [53]. Additionally, airplanes are very expensive, and their application requires the participation of pilots (i.e., automatization is lower) [53].
Satellites are the final group of the flying platforms for plant remote sensing. Using satellites for plant remote sensing is based on global programs (e.g., programs of NASA and European Space Agency) [49] because the cost of these investigations is very high [33]. Satellites can be used for the regular remote sensing of plant ecosystems [49]. The analysis of data from satellites plays a key role in the estimation of the global primary productivity [54], influence of temperature [55], evapotranspiration [56], and air CO2 concentration changes on this productivity [49], estimation of forests areas [57] and their changes under anthropogenic activity [49], and solutions to other global problems. On the other hand, plant remote sensing on the basis of satellites can be limited by the low spatial and time resolutions and the constant trajectories of the flight of these platforms [33].

3. Main Reflectance Indices

3.1. Vegetation Indices

Vegetation indices (VIs) are widely used for the estimation of the biomass production in plants and the analysis of their health. VIs are measured on the basis of the reflectance in the red (600–700 nm) and part of the near-infrared (NIR) (700–900 nm) spectral regions [10]. The red region of this reflectance is related to light absorption by photosynthetic pigments; the reflectance in the NIR spectral region is dependent on the structure of the leaf and canopy [58,59,60]. Using combinations of reflectance in these regions of wavelengths provides the long-term estimation of the photosynthetic capacity, which is related to the plant productivity. The main VIs are summarized in Part 1 of Table 1.
Classical VIs are the simple ratio (SR), difference vegetation index (DVI), and normalized difference vegetation index (NDVI). The SR is calculated as a ratio of reflectance at the NIR spectral region to the reflectance at the red region [58]. The DVI is calculated as the difference between reflectance at the NIR spectral region and at the red region [61]. However, these two indices can change in a wide range; these changes make the scaling and comparative analysis of different plants difficult. This problem can be solved by using the NDVI, which changes in the range from −1 to +1 [59,74,98].
The NDVI is the most known and widely used reflectance index, which was developed by Rouse et al. [58]. Many works show that the NDVI is effective to estimate various vegetation characteristics, including the total biomass (e.g., [99]), plant productivity (e.g., [100]), leaf area index (LAI, [101,102,103]), parameters of vegetation cover (e.g., [104]), content of chlorophylls in leaves (e.g., [105]), and stress changes in plants (e.g., [106,107]). The NDVI can be used for the remote sensing of the abundance and spatial arrangement of green vegetation and estimation of the canopy photosynthetic capacity and net primary productivity [100,107].
The sensitivity of the NDVI to soil background and atmospheric effects stimulates the development of new Vis, such as the soil-adjusted vegetation index (SAVI) [63], optimized soil-adjusted vegetation index (OSAVI) [64], and atmospherically resistant vegetation index (ARVI) [71]. All these reflectance indices include specific correction coefficients, minimizing errors caused by the soil and atmosphere. For example, the OSAVI is not dependent on the soil background [64,98] through using the canopy background adjustment factor, which can be assumed as 0.16 for all types of soils. This index is often used for the monitoring of sparse vegetation where soil is visible [64,98]. There are other Vis on the basis of the NDVI; e.g., the green normalized difference vegetation index (GNDVI) is more sensitive to chlorophyll concentration than the NDVI [23].
Another interesting VI is the triangular vegetation index (TVI), which is also related to the light absorption by photosynthetic pigments in plant leaves [73]. The TVI is based on the idea of increasing the total area of the triangle between reflectance at green (550 nm), red (670 nm), and infrared (750 nm) wavelengths with increasing the chlorophyll content (decrease of red reflectance) and leaf tissue abundance (increase of near-infrared reflectance) [59,73,74,108]. There are modifications of the TVI, including modified triangular vegetation index 1 (MTVI1) and modified triangular vegetation index 2 (MTVI2), which permit a more accurate assessment of the LAI [59,74]. Moreover, Xing et al. [74] developed transformed TVI (TTVI), which is more sensitive to the LAI in comparison with other VIs. Additionally, this index has a minimal saturation effect under the high plant density or pigment concentrations [74]. Thus, triangular vegetation indices seem to be promising for the remote sensing of plants; they can be used for the development of new methods in agricultural monitoring.
Thus, the vegetation indices (particularly, NDVI, OSAVI, EVI, and others) are widely used for plant remote sensing on the basis of manual measurements and different mobile platforms, including UAS and satellites [23,49,53]. Vis can be used for the remote sensing of spatial [59] and temporal [109] changes in the green vegetation, including the estimation of the morphological characteristics of plants (e.g., LAI or the total biomass [74,99,101]) or activity of important physiological processes (e.g., the light absorption by leaves or gross primary productivity (GPP) [110]). These changes can be observed for weeks, season(s), year(s), or tens of years [49,106,109]. Flying platforms, including UAS and satellites, are widely used for measurements of the vegetation indices; particularly, satellites can be used for measuring the GPP and other parameters on an ecosystem and landscape scale. However, the efficiency of these indices, which can be quantitatively estimated on the basis of the coefficients of determination (for regressions connecting VIs and investigated parameters) and correlation can be varied from high to low values [111,112]. This variability in relations is caused by the influence of environmental conditions and geometry of measurements (some influencing factors are shown in Section 4).

3.2. Water Indices

Water is an important factor limiting plant growth and development. Particularly, the estimation of the water content in crops is necessary for controlled irrigation and the mitigation of drought. The several water light absorption bands were shown in the range from 800 to 2500 nm for single leaves [113]. It should be noted that a spectral range more than 1000 nm can be difficult for the reflectance measurements because more expensive and complicated cameras with the InGaAs matrices are necessary [46].
It is important that the light absorption by water in a leaf is low, at about 750 to 900 nm, and high, at 1240, 1450, and 1940 nm [45]. Combinations of these wavelengths seem to be promising for the estimation of the water content and can be used for the development of reflectance indices [45]. The main reflectance indices that are sensitive to the water content in plants are summarized in Part 2 of Table 1.
The normalized difference water index (NDWI) [75] based on reflectance at 860 and 1240 nm shows high sensitivity to changes in the moisture content in the vegetation cover and stability to atmospheric influences [75,114,115]. There are a number of other reflectance indices that are sensitive to the water content, including the moisture stress index (MSI, [78]), normalized difference infrared index (NDII, [77]), and normalized multi-band drought index (NMDI, [76]), which are calculated on the basis of wavelengths at slopes near local spectral maximums of the light absorption by water in plants. These reflectance indices can be used not only for the direct remote sensing of the water content in plants but can show processes related to this content; e.g., the NMDI can be effective for the prediction of fires [116].
Reflectance at 950–970 nm, which is related to the NIR spectral band of the light absorption by water, can also be used for the water content estimation; the light absorption in this spectral region is weaker than this absorption in the range of SWIR [10] Peñuelas et al. [79] proposed the water index (WI) based on the ratio of reflectance at 900 to reflectance at 970 nm; the wavelengths are the local minimum and maximum of light absorption by water, respectively [79,117].
Additionally, broadband indices can also be sensitive to the water content; particularly, changes in the normalized reflectance indices based on 500–600 and 700–800 nm spectral ranges and on 600–700 and 700–800 nm spectral ranges (RI(500–600, 700–800) and RI(600–700, 700–800), respectively) are strongly correlated with water changes after the propagation of electrical signals and under drought conditions [80].
Thus, water indices are promising for agricultural and ecological remote sensing. The monitoring of the water in vegetation and soil can be used for the estimation of the water availability and detection of water restrictions for the increase in the plant biomass.

3.3. Pigment Indices

The reflectance in the region of visible light is strongly related to the content of photosynthetic pigments. These plant pigments play an important role in many physiological processes, including the absorption of light energy and its consumption [118], photoprotection [119,120], photoreception [121,122], and others. Changes in the concentrations of pigments can also be used for the estimation of forming stress responses in plants.
Chlorophylls are the main photosynthetic pigments and have complicated spectra of light absorption. Their spectra include blue and red maximums, which differ for chlorophylls of different types. The absorption maximums of chlorophyll a and b, which are the main chlorophylls in higher plants, are 438 and 668 nm and 463 and 650 nm, respectively [123]. The region around 700 nm (“red edge”) is interesting because it corresponds to the border between the spectral range with the high light absorption by chlorophylls (wavelengths are less than 700 nm) and the high light reflectance (wavelengths are more than 700 nm) [81]. As a result, this slope is sensitive to changes in the chlorophyll concentration. The other slope (“green edge”), which is placed at about 500–550 nm wavelengths, is also sensitive to chlorophyll concentration. The NIR region around 750–900 nm has low light absorption by chlorophylls and is insensitive to changes in chlorophyll concentrations; this region is widely used as the reference reflectance in the pigment reflectance indices [81,82]. It should be noted that the absorption at the red edge is mostly caused by chlorophyll a; in contrast, the green edge is related to concentrations of chlorophyll a and b and, additionally, carotenoids [81]. Combinations of reflectance at these wavelengths can be used for the precise estimation of the concentration of chlorophylls.
The recent meta-analysis [124] shows that RIs, which are the most effective for the estimation of the concentrations of total chlorophyll and chlorophyll a, should be calculated on the basis of combinations of reflectance at 550–560 nm (the green) and at 680–750 nm (the red edge); RIs that are the most effective for the estimation of the concentration of chlorophyll b should be calculated on the basis of combinations of reflectance at 630–660 nm (the red), at 670–710 nm (the red edge), and at 800–810 nm (NIR). It should be noted that these spectral regions include both measuring (sensitive) wavelengths and reference ones.
The main reflectance indices that are sensitive to chlorophyl contents in plants are summarized in Part 3 of Table 1. There are the Chappelle index ( R 675 R 700 ) [88], Datt index ( R 680 R 708 R 550 ) [89], and index proposed by Gitelson et al. (2003) ( R 750 800 R 695 740 1 ) [90], which can be more sensitive to concentrations of chlorophylls in plants than the VIs (e.g., more sensitive than the NDVI [90]) and allow the accurate estimation of the chlorophyll content in a wide range of concentrations [81,90,125,126].
Additionally, the estimation of the ratio of carotenoid concentration to chlorophyll one (Car/Chl) can be important for the diagnosis of stress changes in plants. It is known that the degradation of chlorophylls under the action of stressors or at senescence is faster than the degradation of carotenoids [12,13]. The different rates of the degradation of pigments cause non-proportional changes in the blue (absorption of the blue light is related to both carotenoids and chlorophylls) and red (absorption of the red light is related to chlorophylls) spectral regions [12]. The correlation with Car/Chl can be observed for the simple ratio pigment index (SRPI), normalized difference pigment index (NDPI), structure intensive pigment index (SIPI), normalized phaeophytinization index (NPQI), and plant senescence reflectance index (PSRI) [12,91,92].
Car/Chl can also be used for the estimation of the nitrogen status of plants because nitrogen restrictions lead to the loss of chlorophyll and increase the concentration of carotenoids in comparison with the concentration of chlorophylls [6,127,128,129]. For example, the normalized pigment chlorophyll index (NPCI) [6], which shows the ratio of the total amount of photosynthetic pigments to chlorophyll, can be used for the estimation of the nitrogen status, which plays a key role in the productivity of plants.
The other prospective pigments for the detection of stress changes are anthocyanins. It is known that anthocyanins protect plants from the destructive influence of excess light; they can be “optical filters” and absorb high-energy quanta [130]. Anthocyanins stimulate the plant antioxidant system, neutralizing reactive oxygen species and radicals [13]. Anthocyanins mainly absorb light in green and yellow spectral regions [130]; the recent meta-analysis [124] shows that RIs that are calculated on the basis of measuring the reflectance at 550–560 nm (the green) and references at 700–710 nm (the red edge) or 780–790 nm (NIR) are effective for the estimation of the anthocyanin content. Gamon and Surfus [93] proposed the index based on broadbands in the red and green spectral regions; it is effective for the estimation of the ratio of concentration of chlorophylls to concentrations of anthocyanins. The other indices for the estimation of the anthocyanin concentration are anthocyanin reflectance indices 1 and 2 (ARI1 and ARI2), which are based on the green and NIR reflected light [94].
Thus, the indices based on the concentration of photosynthetic pigments seem to be multipotential. These pigment indices can be effective tools for the estimation of the concentration of chlorophylls, anthocyanin, and carotenoids in plants [124]; however, efficiencies of many pigment indices are lower on canopy or landscape levels. In contrast, these efficiencies for RIs that are sensitive to concentrations of total chlorophyll and chlorophyll a remain high on these spatial levels [124]. Besides, these pigment indices can also be used for revealing stress changes in plants and for the morphological analysis, including the estimation of LAI, which is similar to the estimation of this parameter on the basis of VIs.

3.4. Photochemical Reflectance Index and Its Modifications

In our review, we considered the photochemical reflectance index (PRI) and its modifications (Part 4 of the Table 1) as separate reflectance indices that are distinguished from other pigment indices. It is shown that the PRI can depend on the photosynthetic pigment concentrations and ratio between the concentrations of carotenoids and chlorophylls [2,131]; i.e., the PRI and its modifications can be used as pigment indices that are sensitive to slow changes in concentrations of pigments [11,132]. However, changes in the PRI can also be caused by short-term processes (minutes and even seconds), which are strongly associated with photosynthetic changes [133,134].
There are several mechanisms of short-term changes in the PRI. The PRI is related to an activity of the xanthophyll cycle, which is an important mechanism of fast photosynthetic adaptation to the action of stressors (the non-photochemical quenching of chlorophyll fluorescence, NPQ) [11,54]. Typical PRI is based on the reflected light at 531 nm (the measuring wavelength); the 531 nm wavelength is the center of the green shift in reflectance due to the de-epoxidation of violaxanthin to zeaxanthin via antheraxanthin [133]. This de-epoxidation, which is an important photosynthetic defense mechanism under excess intensity of illumination and action of other stressors, is induced by the acidification of the chloroplast lumen [11,54]. The reflected light at 570 nm is usually used as a reference wavelength for PRI calculation because the reflectance at 570 nm changes weakly [54,95,96]. These pH-induced changes in the xanthophyll cycle are relatively quick: their characteristic time is about ten minutes [133]. Additionally, fast and superfast changes in the PRI are also shown in experiments. Fast changes in the PRI can be observed for several seconds [134] and can be caused by the light-induced shrinkage of chloroplasts; this shrinkage is also related to the acidification of lumen in chloroplasts [96,135]. Superfast changes in the PRI can be formed for hundreds of milliseconds and, probably, are related to the electrochromic shift in the light absorption by carotenoids with 515 to 520 nm maximum [17]; this shift is induced by the activation of the electron-transport chain of chloroplasts and forming electrical gradient across the thylakoid membrane [136].
As a result of these complex mechanisms of changes in the PRI, a modification of the measuring wavelength (531 nm) at the PRI calculation can influence the sensitivity of this index to photosynthetic parameters. Modified PRIs calculated on the basis of 515 and 525 nm measuring wavelengths mainly show changes in the xanthophyll cycle; in contrast, modified PRIs calculated on the basis of 545 and 555 nm measuring wavelengths mainly show changes in the shrinkage of chloroplasts [96,97]. This means that using these different measuring wavelengths for the PRI calculation seems to be promising for plant remote sensing and can be used for increasing the accuracy of the investigations of characteristics of fast photosynthetic changes.
There are several meta-analyses [11,54,137] that show that the PRI (mainly the typical PRI) can be strongly related to the photosynthetic radiation-use efficiency (RUE), quantum yield of photosystem II, NPQ, and pigment composition. However, there are several factors that can strongly modify the values of correlations between the PRI and photosynthetic parameters (the leaf or canopy levels of measurements, the sunlight or artificial light at these measurements, different intensities of action of stressors on plants, and other factors) [54,137]. The efficiency of the PRI using the estimation of the photosynthetic parameters in plants can be increased through the application of light-induced changes in this index [17,97,138,139,140]: the correlations of these changes with RUE, NPQ, and quantum yield of photosystems I and II are stronger than the correlations of the absolute values of PRI with these photosynthetic parameters. Finally, it should be noted that the measurements of PRI can be successfully performed on the basis of different variants of the mobile platforms, including satellites (e.g., MODIS and GOME) [54]; in the last case, the PRI can be used for the estimation of GPP on ecosystem spatial scales.

4. Problems of Measurement and Analysis of Reflectance Indices

Above, we showed that reflectance indices can be successfully used for revealing the plant physiological processes, biochemical composition, water content, and actions of biotic and abiotic stressors. However, the reflectance of leaves has different mechanisms and depends on the conditions of the measurements. The measured signal can be affected by numerous factors, including the leaf surface roughness, content of aerosols and molecules in the atmosphere, soil background, and changes in the intensity and spectra of light sources (e.g., sunlight), etc. These factors disturb the measurements of the reflected light and make its analysis difficult. Below, we considered some ways to minimize the influence of these factors on the measurements and analysis of RIs (see Table 2).

4.1. Changeability of Illumination Parameters

The changeability of the illumination parameters is a very important problem for the measurement of RIs [17,39]. In laboratory conditions, the geometry of the plant illumination in experiments is controlled and corresponds to the aim of the investigation. However, even in this case, the heating of the lamps in the light source, which causes changes in the illumination spectrum, or the blinking of these lamps can negatively influence the reflectance measurements. This changeability of the illumination parameters can be strongly increased under the environmental conditions; e.g., clouds cause illumination blinking and increase light scattering in the atmosphere. The problem of the changeability of light parameters can be solved by periodical calibrations using white and black cards, which serve as standards of absolute reflectance and absorption, respectively [22]. For example, the atmospheric influence can cause up to 50% of the difference between NDVI without corrections and NDVI corrected by using white and black cards [141]. This influence of the light parameters can be corrected using Equation (1) [141]:
R e f l e c t a n c e = I I B I W I B
where I, IW, and IB are intensities of light reflected from plant, white standard, and black one, respectively.
Effects of the illumination parameters can also be minimized by averaging spectra [145]. However, this method is limited by plant variability and influence of atmosphere and soil, which can be complex and non-linear.
On the other hand, normalized RIs can be corrected on the basis of only the white standard in accordance with Equation (2) [155]:
R I = I 1 I 2 ( I W 1 I W 2 ) I 1 + I 2 ( I W 1 I W 2 )  
where I1 and I2 are intensities of the reflected light in plant at wavelengths one and two, respectively; IW1 and IW2 are intensities of the reflected light in the white standard at wavelengths one and two, respectively.
Finally, the influence of the parameters of the changeable background light can be eliminated on the basis of the active illumination of the investigated plant by pulses of the measuring light [17,139]. In this case, two images are used (the image measured under only the background light, and the image measured under combination of the background light and measuring light with the standard spectrum). The intensity of the reflected light is calculated as the difference between these images. This method allows to exclude periodic calibration of the reflected light [139]. However, the method can be used at only small distances from plant objects and can be relatively slow because two images should be measured; moreover, short-term fluctuations in the intensity of the light can cause errors when using this method.

4.2. Orientation of Leaves and Parameters of Their Surface

Errors in the measured reflectance of leaves can also be caused by additional factors, including the variability in the leaves’ orientation, roughness at the surface, and specular reflection. These factors cause the appearance of the diffuse component of the reflected light. The direct and diffuse components can be simultaneously detected by a hemispherical spectrometer under laboratory conditions, but they cannot be independently measured by a hyperspectral camera in fields. The plant hyperspectral imaging at multiple angles (e.g., see [143,156]) can decrease these errors and improve the accuracy of the information about plant physiological processes and biochemical composition. Parameters of plant reflectance can also be reconstructed by using a combination of hyperspectral images and 3D plant reconstruction [144,145].
An increase in the quantity of plants and their density per area can make the measurements of the reflected light and interpretation of results difficult. In this case, the reflectance spectra can be interpreted by using radiation transfer models; e.g., PROCOSINE, which is a combination of the PROSPECT and COSINE models, can describe specular reflection and leaf orientation [142]. Potentially, this model can be used for the prediction of the signal/noise ratio and correction of reflectance measurements; however, its application is limited by the leaf scale now [145]. The possibility of its use on the canopy scale requires future investigations.

4.3. The Atmosphere and Soil Influence on Plant Reflectance

The atmosphere and soil background can strongly modify vegetation indices (particularly the NDVI, SR, and others), decreasing their informativity. The atmosphere influence is related to the atmospheric water vapor, aerosol depth, clouds, brightness, and other factors [10,147,149]. It was shown that the light scattering in the atmosphere influences mainly the transmission of visible light, and the atmosphere light absorption influences mainly the transmission of NIR [147]. The influence of the soil background is related to color, structure and relief, humidity, erosion, and other factors [10,146]. It should be noted that the influences of vegetation, atmosphere, and soil on RIs can interact with each other [10] because the atmosphere and soil can directly modify the spectrum of reflected light and its spatial distribution.
It is important that the increasing intensity of the atmospheric influence positively shifts the values of NDVI [10]; in contrast, increasing the soil brightness negatively influences these values. The noise induced by the atmosphere and soil influences increases the error of the RIs measurement up to 30 to 50% [10,141]. The effective methods of the investigation of the influence of atmosphere and soil parameters on the plant reflectance are the development of radiation transfer models. On the basis of these models, it was shown that sharp changes in RIs are caused by aerosol depth and soil brightness [147]. Using the SAIL model, Baret et al. [146] showed that soil properties (including texture and moisture) influence the sensitivity of the NDVI, SAVI, TSAVI, MSAVI, and GEMI to vegetation. Based on this investigation, the authors proposed a new vegetation index, OSAVI, which is optimized for the minimization of the soil influence on the measurement of RIs. The modifications of OSAVI can be used for all types of soil [64,98].
The mathematical modelling is an effective tool of the reflectance data analysis and interpretation of results. However, its application is limited by a long duration of calculations, which is unsuitable for routine measurements. Alternatively, a system analysis of the influence of soil and atmosphere based on statistical methods is widely used. For example, the different components of the influence of atmosphere and soil on RIs can be detected by using the “principal component analysis” [10]. Another way is the development of new reflectance indices that can decrease soil- and atmosphere-caused errors. The OSAVI, which was noted above, can exclude the soil influence. The atmospheric effects can be minimized by the correction of the difference between red and blue light in the vegetation index IAVI [70] and its special case ARVI [71]. The empirical vegetation index EVI, which is based on the red, blue, and NIR reflected light [157], includes correction, decreasing the influence of aerosols and soil.

4.4. Saturation of Measurement of Reflectance Indices

The saturation that decreases the sensitivity of RIs to plant characteristics at high values of vegetation density is an important problem of the measurement of reflectance indices, especially RIs based on the NIR reflected light (e.g., vegetation indices). The non-linear changes in the NIR/red ratios that are caused by the high plant density, structural properties, and changes in the chlorophyll concentration [10,158,159] are some reasons for this saturation. This problem can be solved by using specific weights for values of the reflected light intensity at an NIR range to correct vegetation indices [69,159]. Considering this point, the WDRVI can be used as a corrected analogue to the NDVI; the MCARI corresponds to CARI [10,69]; there are other indices with these corrections.

4.5. Variability of Plants

The relation between the plant reflectance and physiological, biochemical, and anatomical properties is the key problem for plant remote sensing. Three regions that are related to changes in the content and composition of pigments (400–700 nm), anatomy of mesophyll cells in leaves and canopy structure (700–1300 nm), and water content in plants (1300–2500 nm) can be shown within the reflectance spectra of plants [7,160]. The spatial heterogeneity of plants in the ecosystem, which can be caused by interspecific properties and characteristics for individual species, is a source of the variability in the reflectance measurements in all the spectral regions. Time-dependent fluctuations in environmental conditions are another source of this variability. The variability causes errors of reflectance measurements and increases the noise of the measured signal.
The photosynthetic pigments influence the reflectance of the visible light because they are strongly related to the light absorption in this spectral range [7]. This light absorption by pigments is related to photosynthesis [81], and its stress changes include, e.g., the light dissipation by anthocyanins [130] and xanthophylls [12], which play a protective role for photosynthetic machinery. As a result, the displacement in the spectral peaks of the light absorption by pigments (and, thereby, in the reflectance spectra) shows disturbances in the balance between the processes of photosynthetic energy consumption and processes of photosynthetic stress changes [7].
These processes can be the basis for the spatial heterogeneity in the plant reflectance and its time-dependent fluctuations related to photosynthetic pigments. The changes in reflectance are caused by both short-term (seconds and minutes) and long-term (days, months, and seasons) processes. Shifts in the content of photosynthetic pigments are related to the long-term variability of plants. It is known that the composition of photosynthetic pigments is very variable for different species [150,161]; this composition changes regarding the individual development of the plant [162,163,164], and it can be strongly dependent on local environmental conditions [161]. Particularly, the mineral nutrition is an important factor influencing concentrations of pigments in plants; e.g., changes in the nitrogen nutrition can influence concentrations of photosynthetic pigments and the content of RUBISCO, which is the key photosynthetic enzyme [7,165,166,167,168]. Thus, heterogeneity of the pigment composition can be the long-term factor modifying the efficiency of the plant remote sensing. It should be noted that mathematical models of radiation transfer (e.g., PROSAIL [150,169]) are effectively used tools for the analysis of relations between the heterogeneity in the content of photosynthetic pigments and heterogeneity in RIs.
On the other hand, the environmental conditions can induce short-term changes in the pigment light absorption, which can contribute increasing noise of signals through the stimulation of the time-dependent fluctuation in the reflectance and spatial heterogeneity in RIs. For example, the light fluctuations cause changes in the photosynthetic activity and increase the NPQ [21], which is the important photosynthetic protective mechanism [170]. The light intensity and spectrum profile can also influence the regulatory processes for chlorophyll [171], carotenoid [172], and anthocyanin [173] synthesis. Additionally, the spatial heterogeneity and time-dependent fluctuations in the environmental conditions can influence the characteristics of photosynthetic pigments through the plant signaling systems [174,175]; these influences can also induce variability of reflectance spectra. Particularly, the pigment modifications under stress conditions can be induced by changes in the pH and Ca2+ concentrations or ROS generation. It is known that a decrease in the luminal pH inhibits light photosynthetic reactions and activates the xanthophyll cycle [119]; these effects influence reflectance indices (e.g., PRI [11,97,137]). The increase in the Ca2+ concentration in the stroma of chloroplasts modifies the activity of the Calvin–Benson cycle [176]; this modification contributes to a decrease in the luminal pH and, thereby, can also induce changes in RIs. The ROS generation both damages photosynthetic machinery [170] and induces adaptive photosynthetic changes through the activation of transcription of defense genes [177].
As a result, the individual reflectance spectra of a plant (or even parts of plants) can be caused by a unique combination of factors influencing the pigment absorption (profile expression of genes for individual plant or specie, stage of development, and local environmental conditions); these factors contribute to variability in the plant reflectance spectra.
Differences in the leaf anatomy and orientation are another important reason for the variability in the reflectance spectra. It is known that the reflectance of the adaxial leaf surface is lower at the visible light range than this reflectance of the abaxial surface; in the NIR range, this effect is the opposite [20,178,179]. This effect is caused by the different optical properties of palisade and spongy mesophylls: the palisade mesophyll has high light absorption of the visible light, low light absorption of the NIR light, and low light scattering; in contrast, the spongy mesophyll has great light scattering (through numerous air spaces) and relatively low light absorption [20,180]. Other important factors influencing the leaf surface reflectance are the leaf thickness [150,180,181] and presence of hairs [182]. Additionally, the orientation of leaves [20,150] and their fluttering under the wind [183] can also modify measurements of reflectance. The leaf parameters can also be dependent on the plant nutrition; e.g., the nitrogen content can be an important factor influencing reflectance through plant morphology and canopy structure [20]. The minimization of the influence of these processes on the estimation of the content of photosynthetic pigments on the basis of the reflectance measurements can be based on the development of models of RIs that are insensitive to differences in the reflectance of the leaf surface [179,183]. An analysis of the current mathematical models shows an important role of the leaves’ distribution, frequency, and orientation of leaves for canopy reflectance [150,151,152,153].
Potentially, differences in the water content in plants should also be reasons for the variability in water RIs. These differences can be related to spatial heterogeneity in the soil water content (e.g., as a result of microrelief [1,184]) and to plant responses on environmental factors (e.g., heating-induced electrical signals can modify transpiration and water index in pea seedlings [80]).
Hereby, the plant heterogeneity is the important factor that influences plant spectra and RIs [11,54]. A solution to the problem can be based on the combined use statistical methods, including spatial and temporal averaging, and simple empirical models of relations between RIs and plant characteristics [20,88,149]. The analysis of whole reflectance spectra using heat maps of correlation between physiological parameters and RIs [19,185] or heat maps of the significance of differences between RIs under action of environmental factors [186] can also be used for revealing RIs that are insensitive to the plant variability. The other prospective instrument of the minimization of the influence of RIs’ variability is a meta-analysis of the literature data [11,54,137], which shows the influence of environmental factors, physiological processes and biochemical composition in plants, type of vegetation, and other factors on the efficiency of using RIs for plant remote sensing. On the other hand, the parameters of the variability of reflectance (e.g., variation coefficients of reflectance or RIs) can also be informative for plant remote sensing; the importance of these parameters for plant remote sensing is investigated by using the texture analysis [148], which can be used for revealing the actions of stressors, searching for ROIs, and image contrasting.
Thus, the variability in plants’ properties, including the content of photosynthetic pigments, anatomical structure of leaves, canopy morphological and biochemical aspects, water content, and other factors, can be important factors influencing the leaf and canopy reflectance [15,149,150,154]. Ustin and Gamon [187] proposed to consider this complex of the reflectance properties of plants as “optical type”. These optical types can be collected in the library for classification and statistical analysis [20,187]. On the other hand, the analysis of this heterogeneity seems to be the additional tool of plant remote sensing. This tool can be used for the ecological and agricultural monitoring [10], estimation of soil quality [18], disease detection [188], and others.

5. Conclusions

Remote sensing is the prospective tool of agricultural and environmental monitoring. It permits using the optimal management of the plant cultivation, which can be intelligent and minimizes disturbances in the environment. The importance of the development of methods of plant remote sensing increases with the decreasing stability of environmental conditions and increasing losses of crops. The multi- and hyperspectral imaging and calculation of reflectance indices are important methods of plant remote sensing because these indices are strongly related to the plant growth and development, specific physiological processes, and biochemical compositions. The availability of measuring systems can permit the wide use of RIs for short-term and long-term plant imaging. However, there are some problems regarding the measurement and analysis of reflectance indices, including the environmental influence and plant variability. The development of modified RIs, simulations, and methods of statistical and texture analysis should solve this problem in perspective.

Author Contributions

Conceptualization, A.K., V.S. and E.S.; writing—original draft preparation, A.K. and E.S.; writing—review and editing, E.S. and V.S.; supervision, V.S. All authors have read and agreed to the published version of the manuscript.

Funding

This research was funded by the Ministry of Science and Higher Education of the Russian Federation for large scientific projects in priority areas of scientific and technological development (contract no. 075–15-2020–774).

Institutional Review Board Statement

Not applicable.

Informed Consent Statement

Not applicable.

Data Availability Statement

No new data were created or analyzed in this study. Data sharing is not applicable to this article.

Conflicts of Interest

The authors declare no conflict of interest. The funders had no role in the design of the study; in the collection, analyses, or interpretation of data; in the writing of the manuscript, or in the decision to publish the results.

References

  1. Garbulsky, M.F.; Peñuelas, J.; Papale, D.; Ardö, J.; Goulden, M.L.; Kiely, G.; Richardson, A.D.; Rotenberg, E.; Veenendaal, E.M.; Filella, I. Patterns and controls of the variability of radiation use efficiency and primary productivity across terrestrial ecosystems. Glob. Ecol. Biogeogr. 2010, 19, 253–267. [Google Scholar] [CrossRef]
  2. Porcar-Castell, A.; Garcia-Plazaola, J.I.; Nichol, C.J.; Kolari, P.; Olascoaga, B.; Kuusinen, N.; Fernández-Marín, B.; Pulkkinen, M.; Juurola, E.; Nikinmaa, E. Physiology of the seasonal relationship between the photochemical reflectance index and photosynthetic light use efficiency. Oecologia 2012, 170, 313–323. [Google Scholar] [CrossRef] [PubMed]
  3. Fahad, S.; Bajwa, A.A.; Nazir, U.; Anjum, S.A.; Farooq, A.; Zohaib, A.; Sadia, S.; Nasim, W.; Adkins, S.; Saud, S.; et al. Crop production under drought and heat stress: Plant responses and management options. Front. Plant Sci. 2017, 8, 1147. [Google Scholar] [CrossRef] [Green Version]
  4. Akhtar, N.; Ishak, M.I.S.; Bhawani, S.A.; Umar, K. Various natural and anthropogenic factors responsible for water quality degradation: A review. Water 2021, 13, 2660. [Google Scholar] [CrossRef]
  5. Gornall, J.; Betts, R.; Burke, E.; Clark, R.; Camp, J.; Willett, K.; Wiltshire, A. Implications of climate change for agricultural productivity in the early twenty-first century. Philos. Trans. R. Soc. B 2010, 365, 2973–2989. [Google Scholar] [CrossRef]
  6. Peñuelas, J.; Gamon, J.A.; Fredeen, A.L.; Merino, J.; Field, C.B. Reflectance indices associated with physiological changes in nitrogen- and water-limited sunflower leaves. Remote Sens. Environ. 1994, 48, 135–146. [Google Scholar] [CrossRef]
  7. Peñuelas, J.; Filella, I. Visible and near-infrared reflectance techniques for diagnosing plant physiological status. Trends Plant Sci. 1998, 3, 151–156. [Google Scholar] [CrossRef]
  8. Prabhakar, M.; Prasad, Y.G.; Rao, M.N. Remote sensing of biotic stress in crop plants and its applications for pest management. In Crop Stress and Its Management: Perspectives and Strategies; Venkateswarlu, B., Shanker, A., Shanker, C., Maheswari, M., Eds.; Springer: Dordrecht, The Netherlands, 2012; pp. 517–545. [Google Scholar]
  9. Zarco-Tejada, P.J.; Ustin, S.L.; Whiting, M.L. Temporal and spatial relationships between within-field yield variability in cotton and high-spatial hyperspectral remote sensing imagery. Agron. J. 2005, 97, 641–653. [Google Scholar] [CrossRef] [Green Version]
  10. Xue, J.; Su, B. Significant remote sensing vegetation indices: A review of developments and applications. J. Sens. 2017, 2017, 2–17. [Google Scholar] [CrossRef] [Green Version]
  11. Zhang, C.; Filella, I.; Garbulsky, M.F.; Peñuelas, J. Affecting factors and recent improvements of the photochemical reflectance index (PRI) for remotely sensing foliar, canopy and ecosystemic radiation-use efficiencies. Remote Sens. 2016, 8, 677. [Google Scholar] [CrossRef] [Green Version]
  12. Merzlyak, M.N.; Gitelson, A.A.; Chivkunova, O.B.; Rakitin, V.Y. Non-destructive optical detection of pigment changes during leaf senescence and fruit ripening. Physiol. Plant. 1999, 106, 135–141. [Google Scholar] [CrossRef] [Green Version]
  13. Sims, D.A.; Gamon, J.A. Relationships between leaf pigment content and spectral reflectance across a wide range of species, leaf structures and developmental stages. Remote Sens. Environ. 2002, 81, 337–354. [Google Scholar] [CrossRef]
  14. Gitelson, A.A. Novel technique for remote estimation of CO2 flux in maize. Geophys. Res. Lett. 2003, 30, 1486. [Google Scholar] [CrossRef] [Green Version]
  15. Stylinski, C.D.; Gamon, J.A.; Oechel, W.C. Seasonal patterns of reflectance indices, carotenoid pigments and photosynthesis of evergreen chaparral species. Oecologia 2002, 131, 366–374. [Google Scholar] [CrossRef]
  16. Gamon, J.A.; Kitajima, K.; Mulkey, S.S.; Serrano, L.; Wright, S.J. Diverse optical and photosynthetic properties in a neotropical dry forest during the dry season: Implications for remote estimation of photosynthesis1. Biotropica 2005, 37, 547–560. [Google Scholar] [CrossRef]
  17. Sukhov, V.; Sukhova, E.; Khlopkov, A.; Yudina, L.; Ryabkova, A.; Telnykh, A.; Sergeeva, E.; Vodeneev, V.; Turchin, I. Proximal imaging of changes in photochemical reflectance index in leaves based on using pulses of green-yellow light. Remote Sens. 2021, 13, 1762. [Google Scholar] [CrossRef]
  18. Peñuelas, J.; Isla, R.; Filella, I.; Araus, J.L. Visible and near-infrared reflectance assessment of salinity effects on barley. Crop Sci. 1997, 37, 198–202. [Google Scholar] [CrossRef]
  19. El-Hendawy, S.; Al-Suhaibani, N.; Dewir, Y.H.; Elsayed, S.; Alotaibi, M.; Hassan, W.; Refay, Y.; Tahir, M.U. Ability of modified spectral reflectance indices for estimating growth and photosynthetic efficiency of wheat under saline field conditions. Agronomy 2019, 9, 35. [Google Scholar] [CrossRef] [Green Version]
  20. Ollinger, S.V. Sources of variability in canopy reflectance and the convergent properties of plants. New Phytol. 2011, 189, 375–394. [Google Scholar] [CrossRef]
  21. Rascher, U.; Nedbal, L. Dynamics of photosynthesis in fluctuating light. Curr. Opin. Plant Biol. 2006, 9, 671–678. [Google Scholar] [CrossRef]
  22. Katsoulas, N.; Elvanidi, A.; Ferentinos, K.P.; Kacira, M.; Bartzanas, T.; Kittas, C. Crop reflectance monitoring as a tool for water stress detection in greenhouses: A review. Biosyst. Eng. 2016, 151, 374–398. [Google Scholar] [CrossRef]
  23. Jang, G.; Kim, J.; Yu, J.-K.; Kim, H.-J.; Kim, Y.; Kim, D.-W.; Kim, K.-H.; Lee, C.W.; Chung, Y.S. Review: Cost-effective unmanned aerial vehicle (UAV) platform for field plant breeding application. Remote Sens. 2020, 12, 998. [Google Scholar] [CrossRef] [Green Version]
  24. Costa, J.M.; Grant, O.M.; Chaves, M.M. Thermography to explore plant–environment interactions. J. Exp. Bot. 2013, 64, 3937–3949. [Google Scholar] [CrossRef] [PubMed]
  25. Cruz, J.A.; Savage, L.J.; Zegarac, R.; Hall, C.C.; Satoh-Cruz, M.; Davis, G.A.; Kovac, W.K.; Chen, J.; Kramer, D.M. Dynamic environmental photosynthetic imaging reveals emergent phenotypes. Cell Syst. 2016, 2, 365–377. [Google Scholar] [CrossRef] [PubMed] [Green Version]
  26. Berni, J.; Zarco-Tejada, P.; Suárez, L.; González-Dugo, V.; Fereres, E. Remote sensing of vegetation from UAV platforms using lightweight multispectral and thermal imaging sensors. Int. Arch. Photogramm. Remote Sens. Spat. Inf. Sci. 2014, 38, 6. [Google Scholar]
  27. Guo, W.; Carroll, M.E.; Singh, A.; Swetnam, T.L.; Merchant, N.; Sarkar, S.; Singh, A.K.; Ganapathysubramanian, B. UAS -based plant phenotyping for research and breeding applications. Plant Phenomics 2021, 2021, 9840192. [Google Scholar] [CrossRef]
  28. Salamati, N.; Larlus, D.; Csurka, G.; Süsstrunk, S. Semantic image segmentation using visible and near-infrared channels. In Computer Vision—ECCV 2012. Workshops and Demonstrations; ECCV 2012. Lecture Notes in Computer Science; Fusiello, A., Murino, V., Cucchiara, R., Eds.; Springer: Berlin/Heidelberg, Germany, 2012. [Google Scholar]
  29. Ballesteros, R.; Ortega, J.F.; Hernandez, D.; Moreno, M.A. Onion biomass monitoring using UAV-based RGB imaging. Precision Agric. 2018, 19, 840–857. [Google Scholar] [CrossRef]
  30. Córcoles, J.I.; Ortega, J.F.; Hernández, D.; Moreno, M.A. Estimation of leaf area index in onion (Allium cepa L.) using an unmanned aerial vehicle. Biosyst. Eng. 2013, 115, 31–42. [Google Scholar] [CrossRef]
  31. Hung, C.; Zhe, X.; Sukkarieh, S. Feature learning based approach for weed classification using high resolution aerial images from a digital camera mounted on a UAV. Remote Sens. 2014, 6, 12037–12054. [Google Scholar] [CrossRef] [Green Version]
  32. Plesoianu, A.I.; Stupariu, M.S.; Sandric, I.; Pătru-Stupariu, I.; Drăguț, L. Individual tree-crown detection and species classification in very high-resolution remote sensing imagery using a deep learning ensemble model. Remote Sens. 2020, 12, 2426. [Google Scholar] [CrossRef]
  33. Sun, Z.; Wang, X.; Wang, Z.; Yang, L.; Xie, Y.; Huang, Y. UAVs as remote sensing platforms in plant ecology: Review of applications and challenges. J. Plant Ecol. 2021, 14, 1003–1023. [Google Scholar] [CrossRef]
  34. Onishi, M.; Ise, T. Explainable identification and mapping of trees using UAV RGB image and deep learning. Sci. Rep. 2021, 11, 903. [Google Scholar] [CrossRef] [PubMed]
  35. Schiefer, F.; Kattenborn, T.; Frick, A.; Frey, J.; Schall, P.; Koch, B.; Schmidtlein, S. Mapping forest tree species in high resolution UAV-based RGB-imagery by means of convolutional neural networks. ISPRS J. Photogram. Remote Sens. 2020, 170, 205–215. [Google Scholar] [CrossRef]
  36. Sukhova, E.; Yudina, L.; Akinchits, E.; Vodeneev, V.; Sukhov, V. Influence of electrical signals on pea leaf reflectance in the 400–800-nm range. Plant Signal Behav. 2019, 14, 1610301. [Google Scholar] [CrossRef] [PubMed]
  37. Kalaji, H.M.; Schansker, G.; Ladle, R.J.; Goltsev, V.; Bosa, K.; Allakhverdiev, S.I.; Brestic, M.; Bussotti, F.; Calatayud, A.; Dąbrowski, P. Frequently asked questions about in vivo chlorophyll fluorescence: Practical issues. Photosynth. Res. 2014, 122, 121–158. [Google Scholar] [CrossRef] [Green Version]
  38. Porcar-Castell, A.; Tyystjärvi, E.; Atherton, J.; van der Tol, C.; Flexas, J.; Pfündel, E.E.; Moreno, J.; Frankenberg, C.; Berry, J.A. Linking chlorophyll a fluorescence to photosynthesis for remote sensing applications: Mechanisms and challenges. J. Exp. Bot. 2014, 65, 4065–4095. [Google Scholar] [CrossRef]
  39. Pedrós, R.; Moya, I.; Goulas, Y.; Jacquemoud, S. Chlorophyll fluorescence emission spectrum inside a leaf. Photochem. Photobiol. Sci. 2008, 7, 498–502. [Google Scholar] [CrossRef] [Green Version]
  40. Meroni, M.; Rossini, M.; Guanter, L.; Alonso, L.; Rascher, U.; Colombo, R.; Moreno, J. Remote sensing of solar-induced chlorophyll fluorescence: Review of methods and applications. Remote Sens. Environ. 2009, 113, 2037–2051. [Google Scholar] [CrossRef]
  41. Jones, H.G. Use of infrared thermometry for estimation of stomatal conductance as a possible aid to irrigation scheduling. Agric. For. Meteorol. 1999, 95, 139–149. [Google Scholar] [CrossRef]
  42. Jones, H.G.; Leinonen, I. Thermal Imaging for the study of plant water relations. J. Agric. Meteorol. 2003, 59, 205–217. [Google Scholar] [CrossRef] [Green Version]
  43. Mahlein, A.-K. Plant disease detection by imaging sensors—Parallels and specific demands for precision agriculture and plant phenotyping. Plant Dis. 2016, 100, 241–251. [Google Scholar] [CrossRef] [PubMed] [Green Version]
  44. Paulus, S.; Mahlein, A.-K. Technical workflows for hyperspectral plant image assessment and processing on the greenhouse and laboratory scale. GigaScience 2020, 9, 1–10. [Google Scholar] [CrossRef] [PubMed]
  45. Wu, C.; Niu, Z.; Tang, Q.; Huang, W. Predicting vegetation water content in wheat using normalized difference water indices derived from ground measurements. J. Plant Res. 2009, 122, 317–326. [Google Scholar] [CrossRef] [PubMed]
  46. Fowler, J.E. Compressive pushbroom and whiskbroom sensing for hyperspectral remote-sensing imaging. In Proceedings of the International Conference on Image Processing (ICIP), Paris, France, 27–30 October 2014; pp. 684–688. [Google Scholar]
  47. Hagen, N. Review of snapshot spectral imaging technologies. Opt. Eng. 2013, 52, 090901. [Google Scholar] [CrossRef] [Green Version]
  48. Wang, Y.W.; Reder, N.P.; Kang, S.; Glaser, A.K.; and Liu, J.T.C. Multiplexed optical imaging of tumor-directed nanoparticles: A review of imaging systems and approaches. Nanotheranostics 2017, 1, 369–388. [Google Scholar] [CrossRef] [PubMed]
  49. Ustin, S.L.; Middleton, E.M. Current and near-term advances in Earth observation for ecological applications. Ecol. Process 2021, 10, 1. [Google Scholar] [CrossRef]
  50. Brauers, J.; Aach, T. Geometric calibration of lens and filter distortions for multispectral filter-wheel cameras. IEEE Trans Image Process 2011, 20, 496–505. [Google Scholar] [CrossRef]
  51. Morales, A.; Guerra, R.; Horstrand, P.; Diaz, M.; Jimenez, A.; Melian, J.; Lopez, S.; Lopez, J.F. A multispectral camera development: From the prototype assembly until its use in a UAV system. Sensors 2020, 20, 6129. [Google Scholar] [CrossRef]
  52. Photon Systems Instruments. POLYPEN RP400 & RP410 Manual and User Guide; Photon Systems Instruments: Drásov, Czech Republic, 2018; 38p. [Google Scholar]
  53. Wang, T.; Liu, Y.; Wang, M.; Fan, Q.; Tian, H.; Qiao, X.; Li, Y. Applications of UAS in crop biomass monitoring: A review. Front. Plant Sci. 2021, 12, 616689. [Google Scholar] [CrossRef]
  54. Garbulsky, M.F.; Peñuelas, J.; Gamon, J.; Inoue, Y.; Filella, I. The photochemical reflectance index (PRI) and the remote sensing of leaf, canopy and ecosystem radiation use efficiencies. A review and meta-analysis. Remote Sens. Environ. 2011, 115, 281–297. [Google Scholar] [CrossRef]
  55. Gillespie, A.; Rokugawa, S.; Matsunaga, T.; Cothern, J.S.; Hook, S.; Kahle, A.B. A temperature and emissivity separation algorithm for Advanced Spaceborne Thermal Emission and Reflection Radiometer (ASTER) images. IEEE Transact. Geosci. Remote Sens. 1998, 36, 1113–1126. [Google Scholar] [CrossRef]
  56. Galleguillos, M.; Jacob, F.; Prévot, L.; French, A.; Lagacherie, P. Comparison of two temperature differencing methods to estimate daily evapotranspiration over a Mediterranean vineyard watershed from ASTER data. Remote Sens. Environ. 2011, 115, 1326–1340. [Google Scholar] [CrossRef]
  57. Wulder, M.A.; Dechka, J.A.; Gillis, M.A.; Luther, J.E.; Hall, R.J.; Beaudoin, A.; Franklin, S.E. Operational mapping of the land cover of the forested area of Canada with Landsat data: EOSD land cover program. For. Chron. 2003, 79, 1075–1083. [Google Scholar] [CrossRef] [Green Version]
  58. Rouse, J.W.; Haas, R.; Schell, J.; Deering, D. Monitoring vegetation systems in the great plains with ERTS. NASA Spec. Public. 1974, 351, 309–317. [Google Scholar]
  59. Haboudane, D.; Miller, J.; Pattey, E.; Zarco-Tejada, P.J.; Strachane, I.B. Hyperspectral vegetation indices and novel algorithms for predicting green LAI of crop canopies: Modeling and validation in the context of precision agriculture. Remote Sens. Environ. 2004, 90, 337–352. [Google Scholar] [CrossRef]
  60. Mokarram, M.; Hojjati, M.; Roshan, G.; Negahban, S. Modeling the behavior of Vegetation Indices in the salt dome of Korsia in North-East of Darab, Fars, Iran. Model. Earth Syst. Environ. 2015, 1, 27. [Google Scholar] [CrossRef] [Green Version]
  61. Richardson, A.J.; Weigand, C. Distinguishing vegetation from soil background information. Photogramm. Engin. Remote Sens. 1977, 43, 1541–1552. [Google Scholar]
  62. Gitelson, A.A.; Kaufman, Y.J.; Merzlyak, M.N. Use of a green channel in remote sensing of global vegetation from EOS-MODIS. Remote Sens. Environ. 1996, 58, 289–298. [Google Scholar] [CrossRef]
  63. Huete, A.R. A soil-adjusted vegetation index (SAVI). Remote Sens. Environ. 1988, 25, 295–309. [Google Scholar] [CrossRef]
  64. Rondeaux, G.; Steven, M.; Baret, F. Optimization of soil-adjusted vegetation indices. Remote Sens. Environ. 1996, 55, 95–107. [Google Scholar] [CrossRef]
  65. Qi, J.; Chehbouni, A.; Huete, A.R.; Kerr, Y.H.; Sorooshian, S. A modified soil adjusted vegetation index. Remote Sens. Environ. 1994, 48, 119–126. [Google Scholar] [CrossRef]
  66. Baret, F.; Guyot, G.; Major, D.J. TSAVI: A vegetation index which minimizes soil brightness effects on LAI and APAR estimation. In Proceedings of the 12th Canadian Symposium on Remote Sensing Geoscience and Remote Sensing Symposium, Vancouver, BC, Canada, 10–14 July 1989; pp. 1355–1358. [Google Scholar]
  67. Pinty, B.; Verstraete, M.M. GEMI: A non-linear index to monitor global vegetation from satellites. Vegetation 1992, 101, 15–20. [Google Scholar] [CrossRef]
  68. Huete, A.; Didan, K.; Miura, T.; Rodriguez, E.P.; Gao, X.; Ferreira, L.G. Overview of the radiometric and biophysical performance of the MODIS vegetation indices. Remote Sens. Environ. 2002, 83, 195–213. [Google Scholar] [CrossRef]
  69. Gitelson, A.A. Wide dynamic range vegetation index for remote quantification of biophysical characteristics of vegetation. J. Plant Physiol. 2004, 161, 165–173. [Google Scholar] [CrossRef] [PubMed] [Green Version]
  70. Zhang, R.-H.; Rao, N.X.; Liao, K.N. Approach for a vegetation index resistant to atmospheric effect. Acta Bot. Sin. 1996, 38, 53–62. [Google Scholar]
  71. Kaufman, Y.J.; Tanré, D. Atmospherically resistant vegetation index (ARVI) for EOS-MODIS. IEEE Transact. Geosci. Remote Sens. 1992, 30, 261–270. [Google Scholar] [CrossRef]
  72. Smith, R.C.G.; Adams, J.; Stephens, D.J.; Hick, P.T. Forecasting wheat yield in a Mediterranean-type environment from the NOAA satellite. Austr. J. Agric. Res. 1995, 46, 113–125. [Google Scholar] [CrossRef]
  73. Broge, N.H.; Leblanc, E. Comparing prediction power and stability of broadband and hyperspectral vegetation indices for estimation of green leaf area index and canopy chlorophyll density. Remote Sens. Environ. 2001, 76, 156–172. [Google Scholar] [CrossRef]
  74. Xing, N.; Huang, W.; Xie, Q.; Shi, Y.; Ye, H.; Dong, Y.; Wu, M.; Sun, G.; Jiao, Q.A. Transformed triangular vegetation index for estimating winter wheat leaf area index. Remote Sens. 2020, 12, 16. [Google Scholar] [CrossRef] [Green Version]
  75. Gao, B. NDWI—A normalized difference water index for remote sensing of vegetation liquid water from space. Remote Sens. Environ. 1996, 58, 257–266. [Google Scholar] [CrossRef]
  76. Wang, L.; Qu, J. NMDI: A normalized multi-band drought index for monitoring soil and vegetation moisture with satellite remote sensing. Geophys. Res. Lett. 2007, 34, L20405. [Google Scholar] [CrossRef]
  77. Hardisky, M.A.; Klemas, V.; Smart, R.M. The influences of soil salinity, growth form, and leaf moisture on the spectral reflectance of spartina alterniflora canopies. Photogram. Eng. Remote Sens. 1983, 49, 77–83. [Google Scholar]
  78. Ceccato, P.; Flasse, S.; Tarantola, S.; Jacquemoud, S.; Grégoire, J.-M. Detecting vegetation leaf water content using reflectance in the optical domain. Remote Sens. Environ. 2001, 77, 22–33. [Google Scholar] [CrossRef]
  79. Penuelas, J.; Pinol, J.; Ogaya, R.; Filella, I. Estimation of plant water concentration by the reflectance Water Index WI (R900/R970). Int. J. Remote Sens. 1997, 18, 2869–2875. [Google Scholar] [CrossRef]
  80. Sukhova, E.; Yudina, L.; Gromova, E.; Nerush, V.; Vodeneev, V.; Sukhov, V. Burning-induced electrical signals influence broadband reflectance indices and water index in pea leaves. Plant Signal. Behav. 2020, 15, 1737786. [Google Scholar] [CrossRef]
  81. Gitelson, A.; Merzlyak, M.N. Signature analysis of leaf reflectance spectra: Algorithm development for remote sensing of chlorophyll. J. Plant Physiol. 1996, 148, 494–500. [Google Scholar] [CrossRef]
  82. Datt, B. A new reflectance index for remote sensing of chlorophyll content in higher plants: Tests using eucalyptus leaves. J. Plant Physiol. 1999, 154, 30–36. [Google Scholar] [CrossRef]
  83. Carter, G.A. Ratios of leaf reflectances in narrow wavebands as indicators of plant stress. Int. J. Remote Sens. 1994, 15, 697–703. [Google Scholar] [CrossRef]
  84. Zarco-Tejada, P.J.; Miller, J.R.; Mohammed, G.H.; Noland, T.L.; Sampson, P.H. Scaling-up and model inversion methods with narrow-band optical indices for chlorophyll content estimation in closed forest canopies with hyperspectral data. IEEE Trans. Geosci. Remote Sens. 2001, 39, 1491–1507. [Google Scholar] [CrossRef] [Green Version]
  85. Lichtenthaler, H.K.; Lang, M.; Sowinska, M.; Heisel, F.; Miehé, J.A. Detection of vegetation stress via a new high resolution fluorescence imaging system. J. Plant Physiol. 1996, 148, 599–612. [Google Scholar] [CrossRef]
  86. Daughtry, C.S.T.; Walthall, C.L.; Kim, M.S.; Brown de Colstoun, E.; McMurtrey III, J.E. Estimating corn leaf chlorophyll concentration from leaf and canopy reflectance. Remote Sens. Environ. 2000, 74, 229–239. [Google Scholar] [CrossRef]
  87. Haboudane, D.; Miller, J.R.; Tremblay, N.; Zarco-Tejada, P.J.; Dextraze, L. Integrated narrow-band vegetation indices for prediction of crop chlorophyll content for application to precision agriculture. Remote Sens. Environ. 2002, 81, 416–426. [Google Scholar] [CrossRef]
  88. Chappelle, E.W.; Kim, M.S.; McMurtrey, J.E. Ratio analysis of reflectance spectra (RARS): An algorithm for the remote estimation of the concentrations of chlorophyll A, chlorophyll B, and carotenoids in soybean leaves. Remote Sens. Environ. 1992, 39, 239–247. [Google Scholar] [CrossRef]
  89. Datt, B. Remote sensing of chlorophyll a, chlorophyll b, chlorophyll a+b, and total carotenoid content in eucalyptus leaves. Remote Sens. Environ. 1998, 66, 111–121. [Google Scholar] [CrossRef]
  90. Gitelson, A.A.; Gritz, Y.; Merzlyak, M.N. Relationships between leaf chlorophyll content and spectral reflectance and algorithms for non-destructive chlorophyll assessment in higher plant leaves. J. Plant Physiol. 2003, 160, 271–282. [Google Scholar] [CrossRef] [PubMed]
  91. Penuelas, J.; Baret, F.; Filella, I. Semi-empirical indices to assess carotenoids/chlorophyll-a ratio from leaf spectral reflectance. Photosynthetica 1995, 31, 221–230. [Google Scholar]
  92. Barnes, D.; Balaguer, L.; Manrique, E.; Elvira, S.; Davison, A.W. A reappraisal of the use of DMSO for the extraction and determination of chlorophylls a and b in lichens and higher plants. Enniron. Exp. Bot. 1992, 2, 85–100. [Google Scholar] [CrossRef]
  93. Gamon, J.A.; Surfus, J.S. Assessing leaf pigment content and activity with a reflectometer. New Phytol. 1999, 143, 105–117. [Google Scholar] [CrossRef]
  94. Gitelson, A.A.; Merzlyak, M.N.; Chivkunova, O.B. Optical properties and nondestructive estimation of anthocyanin content in plant leaves. Photochem. Photobiol. 2001, 71, 38–45. [Google Scholar] [CrossRef]
  95. Gamon, J.A.; Penuelas, J.; Field, C.B. A narrow-waveband spectral index that tracks diurnal changes in photosynthetic efficiency. Remote Sens. Environ. 1992, 41, 35–44. [Google Scholar] [CrossRef]
  96. Gamon, J.A.; Serrano, L.; Surfus, J.S. The photochemical reflectance index: An optical indicator of photosynthetic radiation use efficiency across species, functional types, and nutrient levels. Oecologia 1997, 112, 492–501. [Google Scholar] [CrossRef] [PubMed]
  97. Sukhova, E.; Sukhov, V. Relation of photochemical reflectance indices based on different wavelengths to the parameters of light reactions in photosystems I and II in pea plants. Remote Sens. 2020, 12, 1312. [Google Scholar] [CrossRef] [Green Version]
  98. Huete, A. Vegetation Indices. In Encyclopedia of Remote Sensing; Encyclopedia of Earth Sciences Series; Njoku, E.G., Ed.; Springer: New York, NY, USA, 2014; pp. 883–886. [Google Scholar]
  99. Zhu, X.; Liu, D. Improving forest aboveground biomass estimation using seasonal Landsat NDVI time-series. ISPRS J. Photogram. Remote Sens. 2015, 102, 222–231. [Google Scholar] [CrossRef]
  100. Vicente-Serrano, S.M.; Camarero, J.J.; Olano, J.M.; Martín-Hernández, N.; Peña-Gallardo, M.; Tomás-Burguera, M.; Gazol, A.; Azorin-Molina, C.; Bhuyan, U.; El Kenawy, A. Diverse relationships between forest growth and the Normalized Difference Vegetation Index at a global scale. Remote Sens. Environ. 2016, 187, 14–29. [Google Scholar] [CrossRef] [Green Version]
  101. Jiang, J.; Chen, S.; Cao, S.; Wu, H.; Zhang, L.; Zhang, H. Leaf area index retrieval based on canopy reflectance and vegetation index in eastern China. J. Geogr. Sci. 2005, 15, 247–254. [Google Scholar] [CrossRef]
  102. Tian, J.; Wang, L.; Li, X.; Gong, H.; Shi, C.; Zhong, R.; Liu, X. Comparison of UAV and WorldView-2 imagery for mapping leaf area index of mangrove forest. Int. J. Appl. Earth Obs. Geoinform. 2017, 61, 22–31. [Google Scholar] [CrossRef]
  103. Mendes, J.M.; Filipe, V.M.; dos Santos, F.N.; Morais dos Santos, R. A low-cost system to estimate leaf area index combining stereo images and normalized difference vegetation index. In Progress in Artificial Intelligence, Proceedings of the 19th EPIA Conference on Artificial Intelligence, EPIA 2019, Vila Real, Portugal, 3–6 September 2019; Lecture Notes in Computer Science; Moura Oliveira, P., Novais, P., Reis, L., Eds.; Springer: Cham, Switzerland, 2019; Volume 11804, pp. 236–247. [Google Scholar]
  104. Dutrieux, L.P.; Verbesselt, J.; Kooistra, L.; Herold, M. Monitoring forest cover loss using multiple data streams, a case study of a tropical dry forest in Bolivia. ISPRS J. Photogram. Remote Sens. 2015, 107, 112–125. [Google Scholar] [CrossRef]
  105. Pastor-Guzman, J.; Atkinson, P.; Dash, J.; Rioja-Nieto, R. Spatiotemporal variation in mangrove chlorophyll concentration using Landsat 8. Remote Sens. 2015, 7, 14530–14558. [Google Scholar] [CrossRef] [Green Version]
  106. Chavez, R.O.; Clevers, J.G.P.W.; Decuyper, M.; De Bruin, S.; Herold, M. 50 years of water extraction in the Pampa del Tamarugal basin: Can Prosopis tamarugo trees survive in the hyper-arid Atacama Desert (Northern Chile)? J. Arid. Environ. 2016, 124, 292–303. [Google Scholar] [CrossRef]
  107. Huang, S.; Tang, L.; Hupy, J.P.; Wang, Y.; Shao, G. A commentary review on the use of normalized difference vegetation index (NDVI) in the era of popular remote sensing. J. For. Res. 2021, 32, 1–6. [Google Scholar] [CrossRef]
  108. Eitel, J.U.H.; Long, D.S.; Gessler, P.E.; Hunt, E.R. Combined spectral index to improve ground-based estimates of nitrogen status in dryland wheat. Agr. J. 2008, 100, 1694–1702. [Google Scholar] [CrossRef] [Green Version]
  109. Moreira, A.; Bremm, C.; Fontana, D.C.; Kuplich, T.M. Seasonal dynamics of vegetation indices as a criterion for grouping grassland typologies. Sci. Agr. 2019, 76, 24–32. [Google Scholar] [CrossRef]
  110. Hinojo-Hinojo, C.; Goulden, M.L. Plant traits help explain the tight relationship between vegetation indices and gross primary production. Remote Sens. 2020, 12, 1405. [Google Scholar] [CrossRef]
  111. Glenn, E.P.; Huete, A.R.; Nagler, P.L.; Nelson, S.G. Relationship between remotely-sensed vegetation indices, canopy attributes and plant physiological processes: What vegetation indices can and cannot tell us about the landscape. Sensors 2008, 8, 2136–2160. [Google Scholar] [CrossRef] [Green Version]
  112. Sharma, M.; Bangotra, P.; Gautam, A.S.; Gautam, S. Sensitivity of normalized difference vegetation index (NDVI) to land surface temperature, soil moisture and precipitation over district Gautam Buddh Nagar, UP, India. Stoch. Environ. Res. Risk Assess. 2021, 1–11. [Google Scholar] [CrossRef] [PubMed]
  113. Kokaly, R.F.; Despain, D.G.; Clark, R.N.; Livo, K.E. Mapping vegetation in Yellowstone National Park using spectral feature analysis of AVIRIS data. Remote Sens. Environ. 2003, 84, 437–456. [Google Scholar] [CrossRef] [Green Version]
  114. Xu, H. Modification of normalised difference water index (NDWI) to enhance open water features in remotely sensed imagery. Int. J. Remote Sens. 2006, 27, 3025–3033. [Google Scholar] [CrossRef]
  115. Ma, S.; Zhou, Y.; Gowda, H.P.; Dong, H.J.; Zhang, G.; Kakani, G.V.; Wagle, P.; Chen, L.; Flynn, K.C.; Jiang, W. Application of the water-related spectral reflectance indices: A review. Ecol. Ind. 2019, 98, 68–79. [Google Scholar] [CrossRef]
  116. Wang, L.; Qu, J. Forest fire detection using the normalized multi-band drought index (NMDI) with satellite measurements. Agric. For. Meteorol. 2008, 148, 1767–1776. [Google Scholar] [CrossRef]
  117. Zhang, F.; Zhou, G. Estimation of vegetation water content using hyperspectral vegetation indices: A comparison of crop water indicators in response to water stress treatments for summer maize. BMC Ecol. 2019, 19, 18. [Google Scholar] [CrossRef] [PubMed] [Green Version]
  118. Kalaji, H.M.; Schansker, G.; Brestic, M.; Bussotti, F.; Calatayud, A.; Ferroni, L.; Goltsev, V.; Guidi, L.; Jajoo, A.; Li, P.; et al. Frequently asked questions about chlorophyll fluorescence, the sequel. Photosynth. Res. 2017, 132, 13–66. [Google Scholar] [CrossRef] [Green Version]
  119. Demmig-Adams, B. Carotenoids and photoprotection in plants: A role for the xanthophyll zeaxanthin. Biochim. Biophys. Acta 1990, 1020, 1–24. [Google Scholar] [CrossRef]
  120. Gitelson, A.A.; Chivkunova, O.B.; Merzlyak, M.N. Nondestructive estimation of anthocyanins and chlorophylls in anthocyanic leaves. Am. J. Bot. 2009, 96, 1861–1868. [Google Scholar] [CrossRef] [PubMed]
  121. Franklin, K.A.; Quail, P.H. Phytochrome functions in Arabidopsis development. J. Exp. Bot. 2010, 61, 11–24. [Google Scholar] [CrossRef] [PubMed] [Green Version]
  122. Yu, X.; Liu, H.; Klejnot, J.; Lin, C. The Cryptochrome Blue Light Receptors. Arab. Book 2010, 8, e0135. [Google Scholar] [CrossRef] [Green Version]
  123. Kume, A.; Akitsu, T.; Nasahara, K.N. Why is chlorophyll b only used in light-harvesting systems? J. Plant Res. 2018, 131, 961–972. [Google Scholar] [CrossRef] [Green Version]
  124. Huang, J.; Wei, C.; Zhang, Y.; Blackburn, G.A.; Wang, X.; Wei, C.; Wang, J. Meta-analysis of the detection of plant pigment concentrations using hyperspectral remotely sensed data. PLoS ONE 2015, 10, e0137029. [Google Scholar]
  125. Gitelson, A.A.; Merzlyak, M.N. Quantitative estimation of chlorophyll a using reflectance spectra: Experiments with autumn chestnut and maple leaves. J. Photochem. Photobiol. B 1994, 22, 247–252. [Google Scholar] [CrossRef]
  126. Routh, P.K.; Sarkar, N.C.; Das, P.K.; Debnath, D.; Bandyopadhyay, S.; Raj, U. Retrival of bio-physical parameters in sunflower crop (Helianthus Annuus) using field based hyperspectral remote sensing. Int. Arch. Photogramm. Remote Sens. Spat. Inf. Sci. 2019, XLII-3/W6, 623–629. [Google Scholar] [CrossRef] [Green Version]
  127. Huang, W.; Yang, Q.; Pu, R.; Yang, S. Estimation of nitrogen vertical distribution by bi-directional canopy reflectance in winter wheat. Sensors 2014, 14, 20347–20359. [Google Scholar] [CrossRef] [Green Version]
  128. Nayaka, S.; Saxena, P. Physiological responses and ecological success of lichen Stereocaulon foliolosum and moss Racomitrium subsecundum growing in same habitat in Himalaya. Indian J. Fundam. Appl. Life Sci. 2014, 4, 167–179. [Google Scholar]
  129. Klem, K.; Záhora, J.; Zemek, F.; Trunda, P.; Tůma, I.; Novotná, K.; Hodaňová, P.; Rapantová, B.; Hanuš, J.; Vavříková, J.; et al. Interactive effects of water deficit and nitrogen nutrition on winter wheat. Remote sensing methods for their detection. Agric. Water Manag. 2018, 210, 171–184. [Google Scholar] [CrossRef]
  130. Gould, K.S. Nature’s Swiss army knife: The diverse protective roles of anthocyanins in leaves. J. Biomed. Biotech. 2004, 2004, 314–320. [Google Scholar] [CrossRef] [PubMed] [Green Version]
  131. Wong, C.Y.S.; Gamon, J.A. Three causes of variation in the photochemical reflectance index (PRI) in evergreen conifers. New Phytol. 2015, 206, 187–195. [Google Scholar] [CrossRef]
  132. Peñuelas, J.; Filella, I.; Gamon, J.A. Assessment of photosynthetic radiation-use efficiency with spectral reflectance. New Phytol. 1995, 131, 291–296. [Google Scholar] [CrossRef]
  133. Filella, I.; Porcar-Castell, A.; Munné-Bosch, S.; Bäck, J.; Garbulsky, M.F.; Peñuelas, J. PRI assessment of long-term changes in carotenoids/chlorophyll ratio and short-term changes in de-epoxidation state of the xanthophyll cycle. Int. J. Remote Sens. 2009, 30, 4443–4455. [Google Scholar] [CrossRef]
  134. Evain, S.; Flexas, J.; Moya, I. A new instrument for passive remote sensing: 2. Measurement of leaf and canopy reflectance changes at 531 nm and their relationship with photosynthesis and chlorophyll fluorescence. Remote Sens. Environ. 2004, 91, 175–185. [Google Scholar] [CrossRef]
  135. Sukhova, E.M.; Yudina, L.M.; Vodeneev, V.A.; Sukhov, V.S. Analysis of changes in photochemical reflectance index (PRI) in relation to the acidification of the lumen of the chloroplasts of pea and geranium leaves under a short-term illumination. Biochem. Suppl. Ser. A 2019, 13, 243–252. [Google Scholar] [CrossRef]
  136. Bailleul, B.; Cardol, P.; Breyton, C.; Finazzi, G. Electrochromism: A useful probe to study algal photosynthesis. Photosynth. Res. 2010, 106, 179–189. [Google Scholar] [CrossRef] [Green Version]
  137. Sukhova, E.; Sukhov, V. Connection of the Photochemical Reflectance Index (PRI) with the photosystem ii quantum yield and nonphotochemical quenching can be dependent on variations of photosynthetic parameters among investigated plants: A meta-analysis. Remote Sens. 2018, 10, 771. [Google Scholar] [CrossRef] [Green Version]
  138. Soudani, K.; Hmimina, G.; Dufrêne, E.; Berveiller, D.; Delpierre, N.; Ourcival, J.M.; Rambal, S.; Joffre, R. Relationships between photochemical reflectance index and light-use efficiency in deciduous and evergreen broadleaf forests. Remote Sens. Environ. 2014, 144, 73–84. [Google Scholar] [CrossRef]
  139. Sukhova, E.; Sukhov, V. Analysis of light-induced changes in the Photochemical Reflectance Index (PRI) in leaves of pea, wheat, and pumpkin using pulses of green-yellow measuring light. Remote Sens. 2019, 11, 810. [Google Scholar] [CrossRef] [Green Version]
  140. Yudina, L.; Sukhova, E.; Gromova, E.; Nerush, V.; Vodeneev, V.; Sukhov, V. A light-induced decrease in the photochemical reflectance index (PRI) can be used to estimate the energy-dependent component of non-photochemical quenching under heat stress and soil drought in pea, wheat, and pumpkin. Photosynth. Res. 2020, 146, 175–187. [Google Scholar] [CrossRef]
  141. Agapiou, A.; Hadjimitsis, D.G.; Papoutsa, C.; Alexakis, D.D.; Papadavid, G. The importance of accounting for atmospheric effects in the application of NDVI and interpretation of satellite imagery supporting archaeological research: The case studies of Palaepaphos and Nea Paphos Sites in Cyprus. Remote Sens. 2011, 3, 2605–2629. [Google Scholar] [CrossRef] [Green Version]
  142. Jay, S.; Bendoula, R.; Hadoux, X.; Féret, J.-B.; Gorretta, N. A physically-based model for retrieving foliar biochemistry and leaf orientation using close-range imaging spectroscopy. Remote Sens. Environ. 2016, 177, 220–236. [Google Scholar] [CrossRef] [Green Version]
  143. Kong, W.; Huang, W.; Casa, R.; Zhou, X.; Ye, H.; Dong, Y. Off-nadir hyperspectral sensing for estimation of vertical profile of leaf chlorophyll content within wheat canopies. Sensors 2017, 17, 2711. [Google Scholar] [CrossRef] [PubMed] [Green Version]
  144. Huang, P.K.; Luo, X.W.; Jin, J.; Wang, L.J.; Zhang, L.B.; Liu, J.; Zhang, Z.G. Improving high-throughput phenotyping using fusion of close-range hyperspectral camera and low-cost depth sensor. Sensors 2018, 18, 2711. [Google Scholar] [CrossRef] [PubMed] [Green Version]
  145. Mishra, P.; Lohumi, S.; Khan, H.A.; Nordon, A. Close-range hyperspectral imaging of whole plants for digital phenotyping: Recent applications and illumination correction approaches. Comput. Electron. Agricult. 2020, 178, 105780. [Google Scholar] [CrossRef]
  146. Baret, F.; Jacquemoud, S.; Hanocq, J.F. The soil line concept in remote sensing. Remote Sens. Rev. 1993, 7, 65–82. [Google Scholar] [CrossRef]
  147. Myneni, R.B.; Asrar, G. Atmospheric effects and spectral vegetation indices. Remote Sens. Environ. 1994, 47, 390–402. [Google Scholar] [CrossRef]
  148. Bharati, M.H.; Liu, J.J.; MacGregor, J.F. Image texture analysis: Methods and comparisons. Chemom. Intel. Lab. Syst. 2004, 72, 57–71. [Google Scholar] [CrossRef]
  149. Malenovský, Z.; Mishra, K.B.; Zemek, F.; Rascher, U.; Nedbal, L. Scientific and technical challenges in remote sensing of plant canopy reflectance and fluorescence. J. Exp. Bot. 2009, 60, 2987–3004. [Google Scholar] [CrossRef] [PubMed] [Green Version]
  150. Kattenborn, T.; Fassnacht, F.E.; Schmidtlein, S. Differentiating plant functional types using reflectance: Which traits make the difference? Remote Sens. Ecol. Conserv. 2019, 5, 5–19. [Google Scholar] [CrossRef] [Green Version]
  151. Niinemets, Ü.; Lukjanova, A. Total foliar area and average leaf age may be more strongly associated with branching frequency than with leaf longevity in temperate conifers. New Phytol. 2003, 158, 75–89. [Google Scholar] [CrossRef]
  152. Rautiainen, M.; Stenberg, P.; Nilson, T.; Kuusk, A. The effect of crown shape on the reflectance of coniferous stands. Remote Sens. Environ. 2004, 89, 41–52. [Google Scholar] [CrossRef]
  153. Rautiainen, M.; Mõttus, M.; Stenberg, P.; Ervasti, S. Crown envelope shape measurements and models. Silva Fenn. 2008, 42, 19–33. [Google Scholar] [CrossRef] [Green Version]
  154. Zarco-Tejada, P.J.; Rueda, C.A.; Ustin, S.L. Water content estimation in vegetation with MODIS reflectance data and model inversion methods. Remote Sens. Environ. 2003, 85, 109–124. [Google Scholar] [CrossRef]
  155. Ibaraki, Y.; Dutta Gupta, S. Nondestructive evaluation of the photosynthetic properties of micropropagated plantlets by imaging photochemical reflectance index under low light intensity. In Vitro Cell. Dev. Biol. Plant. 2010, 46, 530–536. [Google Scholar] [CrossRef]
  156. Middleton, E.M.; Cheng, Y.-B.; Hilker, T.; Black, T.A.; Krishnan, P.; Coops, N.C.; Huemmrich, K.F. Linking foliage spectral responses to canopy-level ecosystem photosynthetic light-use efficiency at a Douglas-fir forest in Canada. Can. J. Remote Sens. 2009, 35, 166–188. [Google Scholar] [CrossRef]
  157. Liu, H.Q.; Huete, A. A feedback based modification of the NDVI to minimize canopy background and atmospheric noise. IEEE Transact. Geosci. Remote Sens. 1995, 33, 457–465. [Google Scholar] [CrossRef]
  158. Gitelson, A.A.; Merzlyak, M.N. Remote estimation of chlorophyll content in higher plant leaves. Int. J. Remote Sens. 1997, 18, 2691–2697. [Google Scholar] [CrossRef]
  159. Vescovo, L.; Wohlfahrt, G.; Balzarolo, M.; Pilloni, S.; Sottocornola, M.; Rodeghiero, M.; Gianelle, D. New spectral vegetation indices based on the near-infrared shoulder wavelengths for remote detection of grassland phytomass. Int. J. Remote Sens. 2012, 33, 2178–2195. [Google Scholar] [CrossRef] [PubMed] [Green Version]
  160. Lowe, A.; Harrison, N.; French, A.P. Hyperspectral image analysis techniques for the detection and classification of the early onset of plant disease and stress. Plant Methods 2017, 13, 80. [Google Scholar] [CrossRef]
  161. Esteban, R.; Barrutia, O.; Artetxe, U.; Fernández-Marín, B.; Hernández, A.; García-Plazaola, J.I. Internal and external factors affecting photosynthetic pigment composition in plants: A meta-analytical approach. New Phytol. 2015, 206, 268–280. [Google Scholar] [CrossRef] [PubMed]
  162. Moorthy, I.; Miller, J.R.; Noland, T.L. Estimating chlorophyll concentration in conifer needles with hyperspectral data: An assessment at the needle and canopy level. Remote Sens. Environ. 2008, 112, 2824–2838. [Google Scholar] [CrossRef]
  163. Schlemmer, M.; Gitelson, A.; Schepers, J.; Ferguson, R.; Peng, Y.; Shanahana, J.; Rundquist, D. Remote estimation of nitrogen and chlorophyll contents in maize atleaf and canopy levels. Int. J. Appl. Earth Obser. Geoinform. 2013, 25, 47–54. [Google Scholar] [CrossRef] [Green Version]
  164. Ma, X.; Migliavacca, M.; Wirth, C.; Bohn, F.J.; Huth, A.; Richter, R.; Mahecha, M.D. Monitoring plant functional diversity using the reflectance and echo from space. Remote Sens. 2020, 12, 1248. [Google Scholar] [CrossRef] [Green Version]
  165. Elvidge, C.D. Visible and near infrared reflectance characteristics of dry plant materials. Int. J. Remote Sens. 1990, 11, 1775–1795. [Google Scholar] [CrossRef]
  166. Sage, R.F.; Pearcy, R.W. The nitrogen use efficiency of C3 and C4 plants: II. Leaf nitrogen effects on the gas exchange characteristics of Chenopodium album (L.) and Amaranthus retroflexus (L.). Plant Physiol. 1987, 84, 959–963. [Google Scholar] [CrossRef] [Green Version]
  167. Gao, J.; Wang, F.; Sun, J.; Tian, Z.; Hu, H.; Jiang, S.; Luo, Q.; Xu, Y.; Jiang, D.; Cao, W.; et al. Enhanced Rubisco activation associated with maintenance of electron transport alleviates inhibition of photosynthesis under low nitrogen conditions in winter wheat seedlings. J. Exp. Bot. 2018, 69, 5477–5488. [Google Scholar] [CrossRef]
  168. Wang, N.; Fu, F.; Wang, H.; Wang, P.; He, S.; Shao, H.; Ni, Z.; Zhang, X. Effects of irrigation and nitrogen on chlorophyll content, dry matter and nitrogen accumulation in sugar beet (Beta vulgaris L.). Sci. Rep. 2021, 11, 16651. [Google Scholar] [CrossRef]
  169. Kong, W.; Huang, W.; Zhou, X.; Song, X.; Casa, R. Estimation of carotenoid content at the canopy scale using the carotenoid triangle ratio index from in situ and simulated hyperspectral data. J. Appl. Remote Sens. 2016, 10, 026035. [Google Scholar] [CrossRef]
  170. Ruban, A.V. Nonphotochemical chlorophyll fluorescence quenching: Mechanism and effectiveness in protecting plants from photodamage. Plant Physiol. 2016, 170, 1903–1916. [Google Scholar] [CrossRef] [Green Version]
  171. Ptushenko, O.S.; Ptushenko, V.V.; Solovchenko, A.E. Spectrum of light as a determinant of plant functioning: A historical perspective. Life 2020, 10, 25. [Google Scholar] [CrossRef] [Green Version]
  172. Pizarro, L.; Stange, C. Light-dependent regulation of carotenoid biosynthesis in plants. Cien. Inv. Agrar. 2009, 36, 143–162. [Google Scholar] [CrossRef]
  173. Mancinelli, A.L. Light-dependent anthocyanin synthesis: A model system for the study of plant photomorphogenesis. Bot. Rev. 1985, 51, 107–157. [Google Scholar] [CrossRef]
  174. Sukhov, V.; Sukhova, E.; Gromova, E.; Surova, L.; Nerush, V.; Vodeneev, V. The electrical signal-induced systemic photosynthetic response is accompanied by changes in the photochemical reflectance index in pea. Funct. Plant Biol. 2019, 46, 328–338. [Google Scholar] [CrossRef]
  175. Sukhova, E.; Yudina, L.; Gromova, E.; Ryabkova, A.; Vodeneev, V.; Sukhov, V. Influence of local burning on difference reflectance indices based on 400-700 nm wavelengths in leaves of pea seedlings. Plants 2021, 10, 878. [Google Scholar] [CrossRef] [PubMed]
  176. Hochmal, A.K.; Schulze, S.; Trompelt, K.; Hippler, M. Calcium-dependent regulation of photosynthesis. Biochim. Biophys. Acta Bioenerg. 2015, 1847, 993–1003. [Google Scholar] [CrossRef] [PubMed] [Green Version]
  177. Pfannschmidt, T.; Bräutigam, K.; Wagner, R.; Dietzel, L.; Schröter, Y.; Steiner, S.; Nykytenko, A. Potential regulation of gene expression in photosynthetic cells by redox and energy state: Approaches towards better understanding. Ann. Bot. 2009, 103, 599–607. [Google Scholar] [CrossRef] [Green Version]
  178. Lu, S.; Lu, F.; You, W.; Wang, Z.; Liu, Y.; Omasa, K. A robust vegetation index for remotely assessing chlorophyll content of dorsiventral leaves across several species in different seasons. Plant Methods 2018, 14, 15. [Google Scholar] [CrossRef] [PubMed] [Green Version]
  179. Xie, M.; Wang, Z.; Huete, A.; Brown, L.A.; Wang, H.; Xie, Q.; Xu, X.; Ding, Y. Estimating peanut leaf chlorophyll content with dorsiventral leaf adjusted indices: Minimizing the impact of spectral differences between adaxial and abaxial leaf surfaces. Remote Sens. 2019, 11, 2148. [Google Scholar] [CrossRef] [Green Version]
  180. Castro, K.L.; Sanchez-Azofeifa, G.A. Changes in spectral properties, chlorophyll content and internal mesophyll structure of senescing Populus balsamifera and Populus tremuloides leaves. Sensors 2008, 8, 51–69. [Google Scholar] [CrossRef] [Green Version]
  181. Knapp, A.K.; Carter, G.A. Variability in leaf optical properties among 26 species from a broad range of habitats. Am. J. Bot. 1998, 85, 940–946. [Google Scholar] [CrossRef] [PubMed] [Green Version]
  182. Lu, S.; Lu, X.T.; Zhao, W.L.; Liu, Y.; Wang, Z.Y.; Omasa, K. Comparing vegetation indices for remote chlorophyll measurement of white poplar and Chinese elm leaves with different adaxial and abaxial surfaces. J. Exp. Bot. 2015, 66, 5625–5637. [Google Scholar] [CrossRef] [PubMed] [Green Version]
  183. You, W.; Wang, Z.; Lu, F.; Zhao, Y.; Lu, S. Spectral indices to assess the carotenoid/chlorophyll ratio from adaxial and abaxial leaf reflectance. Spectr. Lett. 2017, 50, 387–393. [Google Scholar] [CrossRef]
  184. Mansouri, M.; Javadi, S.A.; Jafari, M.; Arzani, H. Effect of microrelief and water-table on vegetation dynamics in silty loam saline soils of coastal areas. SN Appl. Sci. 2021, 3, 381. [Google Scholar] [CrossRef]
  185. Balzarolo, M.; Peñuelas, J.; Filella, I.; Portillo-Estrada, M.; Ceulemans, R. Assessing ecosystem isoprene emissions by hyperspectral remote sensing. Remote Sens. 2018, 10, 1086. [Google Scholar] [CrossRef] [Green Version]
  186. Sukhova, E.; Yudina, L.; Gromova, E.; Ryabkova, A.; Kior, D.; Sukhov, V. Complex analysis of the efficiency of difference reflectance indices on the basis of 400–700 nm wavelengths for revealing the influences of water shortage and heating on plant seedlings. Remote Sens. 2021, 13, 962. [Google Scholar] [CrossRef]
  187. Ustin, S.L.; Gamon, J.A. Remote sensing of plant functional types. New Phytol. 2010, 186, 795–816. [Google Scholar] [CrossRef] [PubMed]
  188. Mahlein, A.-K.; Rumpf, T.; Welke, P.; Dehne, H.-W.; Plümer, L.; Steiner, U.; Oerke, E.-C. Development of spectral indices for detecting and identifying plant diseases. Remote Sens. Environ. 2013, 128, 21–30. [Google Scholar] [CrossRef]
Figure 1. The optical methods of estimation of growth and development, physiological processes, and biochemical composition of plants, including the RGB, thermal, fluorescence, and spectral imaging. (a) Spectral ranges of these optical methods. (b) Examples of using the RGB imaging, the thermal imaging, the imaging of the chlorophyll fluorescence, and the spectral imaging of reflected light. These examples are based on works [24,25,26]. R, G, and B are the red, green, and blue spectral bands of the reflected light that are measured at the RGB imaging.
Photonics 08 00582 g001
Figure 2. Spatial (from leaf to ecosystem(s)) and temporal (from seconds to years) scales of main optical methods of plant remote sensing. Two types of measurements of the chlorophyll fluorescence are shown: a passive measurement (without fluorescence induction by special measuring light) and an active measurement (with this induction).
Photonics 08 00582 g002
Figure 3. Some variants of hyper- and multispectral cameras. (a) The simple schema of the hyperspectral camera with line-by-line scanning. (b) The schema of the line-by-line scanning (push broom). (c) The schema of the point-by-point scanning (whisk broom). (d) The schema of scanning of the whole hypercube (snapshot). (e) Multispectral camera with several elementary cameras equipped by narrow band spectral filters. (f) Multispectral camera with single camera and wheel of narrow band spectral filters.
Photonics 08 00582 g003
Figure 4. Spatial (from leaf to ecosystem(s)) and temporal (from seconds to years) scales of plant remote sensing on basis of manual measurements using handheld devices and different flying platforms (copters, drones, airplanes, and satellites).
Photonics 08 00582 g004
Table 1. Main reflectance indices used for the plant remote sensing.
Reflectance IndexFormulaReferences
Vegetation indices
Difference Vegetation Index (DVI) D V I = R N I R R R e d [61]
Simple Ratio Index (SR) S R = R N I R R R e d [58]
Normalized Difference Vegetation Index (NDVI) N D V I = R N I R R R e d R N I R + R R e d [58]
Green Normalized Difference Vegetation Index GNDVI G N D V I = N I R G r e e n N I R + G r e e n [62]
Soil-adjusted Vegetation Index (SAVI) S A V I = ( R N I R R R e d ) ( 1 + L ) R N I R + R R e d + L [63]
Optimized Soil-Adjusted Vegetation Index (OSAVI) O S A V I = 1.16 R 790 R 670 R 790 R 670 + 0.16 [64]
Modified
Soil-Adjusted Vegetation Index (MSAVI)
M S A V I = 0.5 [ 2 R 800 + 1 ( 2 R 800 + 1 ) 2 8 ( R 800 R 670 ) ] [65]
Transformed Soil-Adjusted Vegetation Index (TSAVI) T S A V I = a ( R N I R a R R e d b ) R R e d + a R N I R a b [66]
Global
Environment Monitoring Index (GEMI)
G E M I = n ( 1 0.25 n ) R e d 0.125 1 R e d [67]
Enhanced Vegetation
Index (EVI)
E V I = 2.5 R N I R R r R N I R + C 1 R r C 2 R b + L [68]
Wide Dynamic
Range Vegetation Index (WDRVI)
W D R V I = α R N I R R R e d α R N I R + R R e d [69]
Atmospherically effect resistant
vegetation index (IAVI)
I A V I = R N I R ( R R e d γ ( R B l u e R R e d ) ) R N I R + ( R R e d γ ( R B l u e R R e d ) ) [70]
Atmospherically Resistant Vegetation
Index (ARVI)
A R V I = R N I R R B R N I R + R B [71]
Greenness Index (G) G = R 554 R 677 [72]
Triangular Vegetation Index (TVI) T V I = 0.5 [ 120 ( R 750 R 550 ) 200 ( R 670 R 550 ) ] [73]
Modified Triangular Vegetation Index 1 (MTVI1) M T V I 1 = 1.2 [ 1.2 ( R 800 R 550 ) 2.5 ( R 670 R 550 ) ] [59]
Modified Triangular Vegetation Index 2 (MTVI2) M T V I 2 = 1.5 [ 1.2 ( R 800 R 550 ) 2.5 ( R 670 R 550 ) ] ( ( 2 R 800 + 1 ) 2 ( 6 R 800 5 R 670 ) ) 0.5 [59]
Transformed Triangular Vegetation Index (TTVI) T T V I = 0.5 [ ( 783 740 ) ( R 865 R 740 ) ( 865 740 ) ( R 783 R 740 ) ] [74]
Water indices
Normalized Difference Water Index (NDWI) N D W I = R 857 R 1241 R 857 + R 1241 [75]
Normalized Multi-band Drought Index (NMDI) N M D I = R 860 ( R 1640 R 2130 ) R 860 + ( R 1640 R 2130 ) [76]
Normalized Difference Infrared Index (NDII) N D I I = R 819 R 1649 R 819 + R 1649 [77]
Moisture Stress Index (MSI) M S I = R 1667 R 927 [78]
Water index W I = R 900 R 970 [79]
Broadband normalized indices RI(500–600, 700–800) and RI(600–700, 700–800) R I ( 500 600 ,   700 800 ) = R 500 600 R 700 800 R 500 600 + R 700 800
R I ( 600 700 ,   700 800 ) = R 600 700 R 700 800 R 600 700 + R 700 800
[80]
Pigment indices
Gitelson and Merzlyak Indices 1 and 2 (GM1, GM2) G M 1 = R 750 R 550
G M 2 = R 750 R 700
[81]
Leaf Chlorophyll Index (LCI) L C I = R 850 R 710 R 850 + R 710 [82]
Carter Indices 1 and 2 (Ctr1 and Ctr2) C t r 1 = R 695 R 420
C t r 2 = R 695 R 760
[83]
Zarco-Tejada & Miller Index (ZMI) Z M I = R 750 R 710 [84]
Lichtenthaler Indices 1 and 2 (Lic1 and Lic2) L i c 1 = R 790 R 680 R 790 + R 680
L i c 2 = R 440 R 690
[85]
Normalized Pigment Chlorophyll Index (NPCI) N P C I = R 680 R 430 R 680 + R 430 [6]
Modified Chlorophyll Absorption in Reflectance Indices (MCARI and MCARI1) M C A R I = [ ( R 700 R 670 ) 0.2 ( R 700 R 550 ) ] R 700 R 670
M C A R I 1 = 1.2 [ 2.5 ( R 790 R 670 ) 1.3 ( R 790 R 550 ) ]
[59,86]
Transformed CAR Index (TCARI) T C A R I = 3 [ ( R 700 R 670 ) 0.2 ( R 700 R 550 ) R 700 R 670 ] [87]
Chappelle index R 675 R 700 [88]
Datt index R 680 R 708 R 550 [89]
Index proposed by Gitelson et al. (2003) R ( 750 800 ) R ( 695 740 ) 1 [90]
Simple Ratio Pigment Index (SRPI) S R P I = R 430 R 680 [91]
Normalized difference pigment index (NDPI) N D P I = R 680 R 430 R 680 + R 430 [91]
Structure Intensive Pigment Index (SIPI) S I P I = R 790 R 450 R 790 + R 650 [91]
Normalized Phaeophytinization Index (NPQI) N P Q I = R 415 R 435 R 415 + R 435 [92]
Plant Senescence Reflectance Index (PSRI) P S R I = R 680 R 500 R 750 [12]
Anthocyanin R e d G r e e n = i = 600 699 R i / i = 500 599 R i [93]
Anthocyanin Reflectance Indices 1 and 2 (ARI1 and ARI2) A R I 1 = 1 R 550 1 R 700
A R I 2 = R 800 ( 1 R 550 1 R 700 )
[94]
Photochemical reflectance index and its modifications
Photochemical Reflectance Index (PRI) P R I = R 531 R 570 R 531 + R 570 [95]
Modified Photochemical Reflectance Index (PRIm) P R I m = R 531 R m R 531 + R m
m = 512, 515, 551, 555, 602, 645, 667, 668 nm
[11]
P R I m = R m R 570 R m + R 570
m =531, 515, 525, 535, 545 nm
[96,97]
Table 2. Some problems of measurement and analysis of reflectance indices.
ProblemProblem SolutionReferences
Changeability of illumination parametersUsing of white and black reflectance standard[22,141]
Using short pulses of measuring light[17,39]
Orientation of leaves and parameters of their surfaceSpectra correction using mathematical models of PROCOSIN and PROSPECT[142]
Measuring at multitude angles.[143]
Combination of 3D plant model and hyperspectral images[144,145]
The atmosphere and soil influence on plant reflectanceStatistical methods (e.g., principal component analysis)[10]
Using models of radiation transfer in leaves and canopy[146,147]
Development of corrected RIs[64,98]
Saturation of measurement of reflectance indicesDevelopment of corrected RIs[10,69]
Variability of plantsUsing statistical methods and methods of texture analysis[20,148,149]
Prediction of changes in spectral properties using model of radiation transfer in leaves and canopy[150,151,152,153,154]
Publisher’s Note: MDPI stays neutral with regard to jurisdictional claims in published maps and institutional affiliations.

