Abstract
This paper describes a modified Sagnac interferometer with a self-referenced polarization and phase-shifting technique for real-time thickness measurement of single- and double-layer transparent thin films. The proposed interferometric setup generated outstanding rotating linearly polarized light with a degree of polarization (DOP) of 99.40%. A beam splitter placed at the interferometer output separated the beam into two identical linearly polarized beams. One of the beams served as a reference, while the other served as a sensing arm. The output linear polarizer set at 45° relative to a reference plane was positioned anterior to the photodetectors to get rotating light intensities for phase shift measurement; hence, the intensities at various polarizations of 0°, 45°, and 90° were automatically acquired without any polarizing device adjustments. These intensities were then transformed into a phase retardation introduced by a sample, and the resulting phase shift was eventually converted into film thickness. The samples were properly prepared, with pure BK7 substrate being deposited by -, -, and / films of known thicknesses. The thickness measurement obtained from the proposed system yielded reading errors of 1.3%, 0.2%, and 1.3/2.5% for -, -, and / films, respectively. The mathematical theory was effectively demonstrated and empirically confirmed. The experimental results show that the proposed setup has a lot of potential for real-time, non-destructive thickness assessment of transparent thin films without the need to modify polarizing device orientations.
1. Introduction
One of the most significant properties of light for optical measurements of a material is the phase shift. This is achieved by the interference of two lights propagating through the same medium and this scheme is famously called interferometry. Many studies have been conducted to investigate various configurations and applications of the interferometers such as Michelson, Mach–Zehnder, and Sagnac interferometers. Michelson interferometer is the simplest arrangement using a beam splitter to generate fringes from coherent beams. It is so sensitive to its surroundings that even the slightest movement generates vibrations [1]. Mach–Zehnder interferometer, developed after Michelson configuration, consists of a reference arm, a sample arm, and two beam splitters. It minimizes environmental interactions, but a small change in path length affects intensity and refractive index of the medium. Practically, it is difficult in alignment and produces noise [2]. Sagnac interferometer is insensitive to ambient disturbances; as a result, any movement or noise is avoided because all transmission paths interact with each other [3]. It may be configured in a variety of ways, including shearing (lateral and radial), cyclic, and triangular interferometers. Lateral shearing is formed when one of the two mirrors is adjusted, while radial shearing uses a lens and a pinhole placed before the transmitted and reflected beams incident on the two mirrors [4]. Both types can either be triangular or rectangular paths [5]. The most appropriate configuration for Sagnac interferometer is the triangular configuration with the help of polarization phase-shifting approach. To avoid any convergence or divergence of the two beams, the lateral shearing concept is applied using a single alignment.
Several phase shifting approaches were investigated on a modified Sagnac interferometer utilizing linearly polarized light with several phase stepping algorithms [6]. The phase shift is obtained by replicating two cyclic interferometric couplings using two stepping algorithms [7]. According to [8], a double cyclic interferometer is used for parallel phase shift measurement in a single shift. A reproduction of the cyclic coupled interferometer is employed to measure phase shift is reported in [9]. A phase shift using rotating circularly polarized light was accomplished in [10] by rotating a quarter-wave plate (QWP) at the input of interferometer to 45°. In this case, the phase shift is achieved by manually rotating a half-wave plate, and cyclic interferometry-based measurements were further improved together with the phase stepping algorithms using the frequency shifter scheme. Several self-referenced measurements using cyclic interferometer were studied for an automatic phase shift requisition using a piezoelectric transducer (PZT) [11]. The PZT, which is connected to the mirror and causes it to vibrate, creates a path length difference by frequency modulation. In [12], it is reported that up to five-stepping phase shifting techniques were automatically evaluated. According to [13,14], a simultaneous phase shifting technique for thickness measurement is achieved as the phase shift is obtained using four-stepping algorithms. A polarization phase shift for a single layer thickness measurement of the thin film is reported in [15], as the reference and sample arms are separately observed. There are also reports that the signal can be split at the input with a non-polarizing beam splitter (NPBS) and the two beams were detected for simultaneous measurements of both sample and reference arms [16,17].
According to the majority of the aforementioned studies, the phase shifting is accomplished by manually adjusting or rotating the polarizing component. This may result in nonlinearity and signal instabilities. It may also generate potential sources of systematic mistakes in phase-shift creation. Moreover, such reports use a single beam with a single detection at the output, which can lead to errors due to frequency–time domain. Despite the fact that certain systems could achieve 4D thickness with the assistance of a CCD camera, such systems were difficult to implement due to a large number of components, a high cost, or a long processing time in digital image analysis.
To overcome difficulties described above, this paper proposes real-time simultaneous measurements of sample and reference arms using an automated phase shifting approach with balanced photodetectors located at the output. The experiments are mainly separated into two parts: determination of the degree of polarization using a single beam propagation, and the development of a three-step algorithm for measuring the phase retardation and thickness of single- and double-layer transparent thin films. In this research, the principle of lateral shearing is applied using a single alignment to avoid any convergence or divergence of the two beams. The mathematical theory behind the three-step technique is proved and presented in the next section. Section 3 and Section 4 include the experimental results as well as discussions. The significance of this endeavor is described in the last section.
2. Related Theories and Principle of Operation
2.1. Principle of Operation without Sample
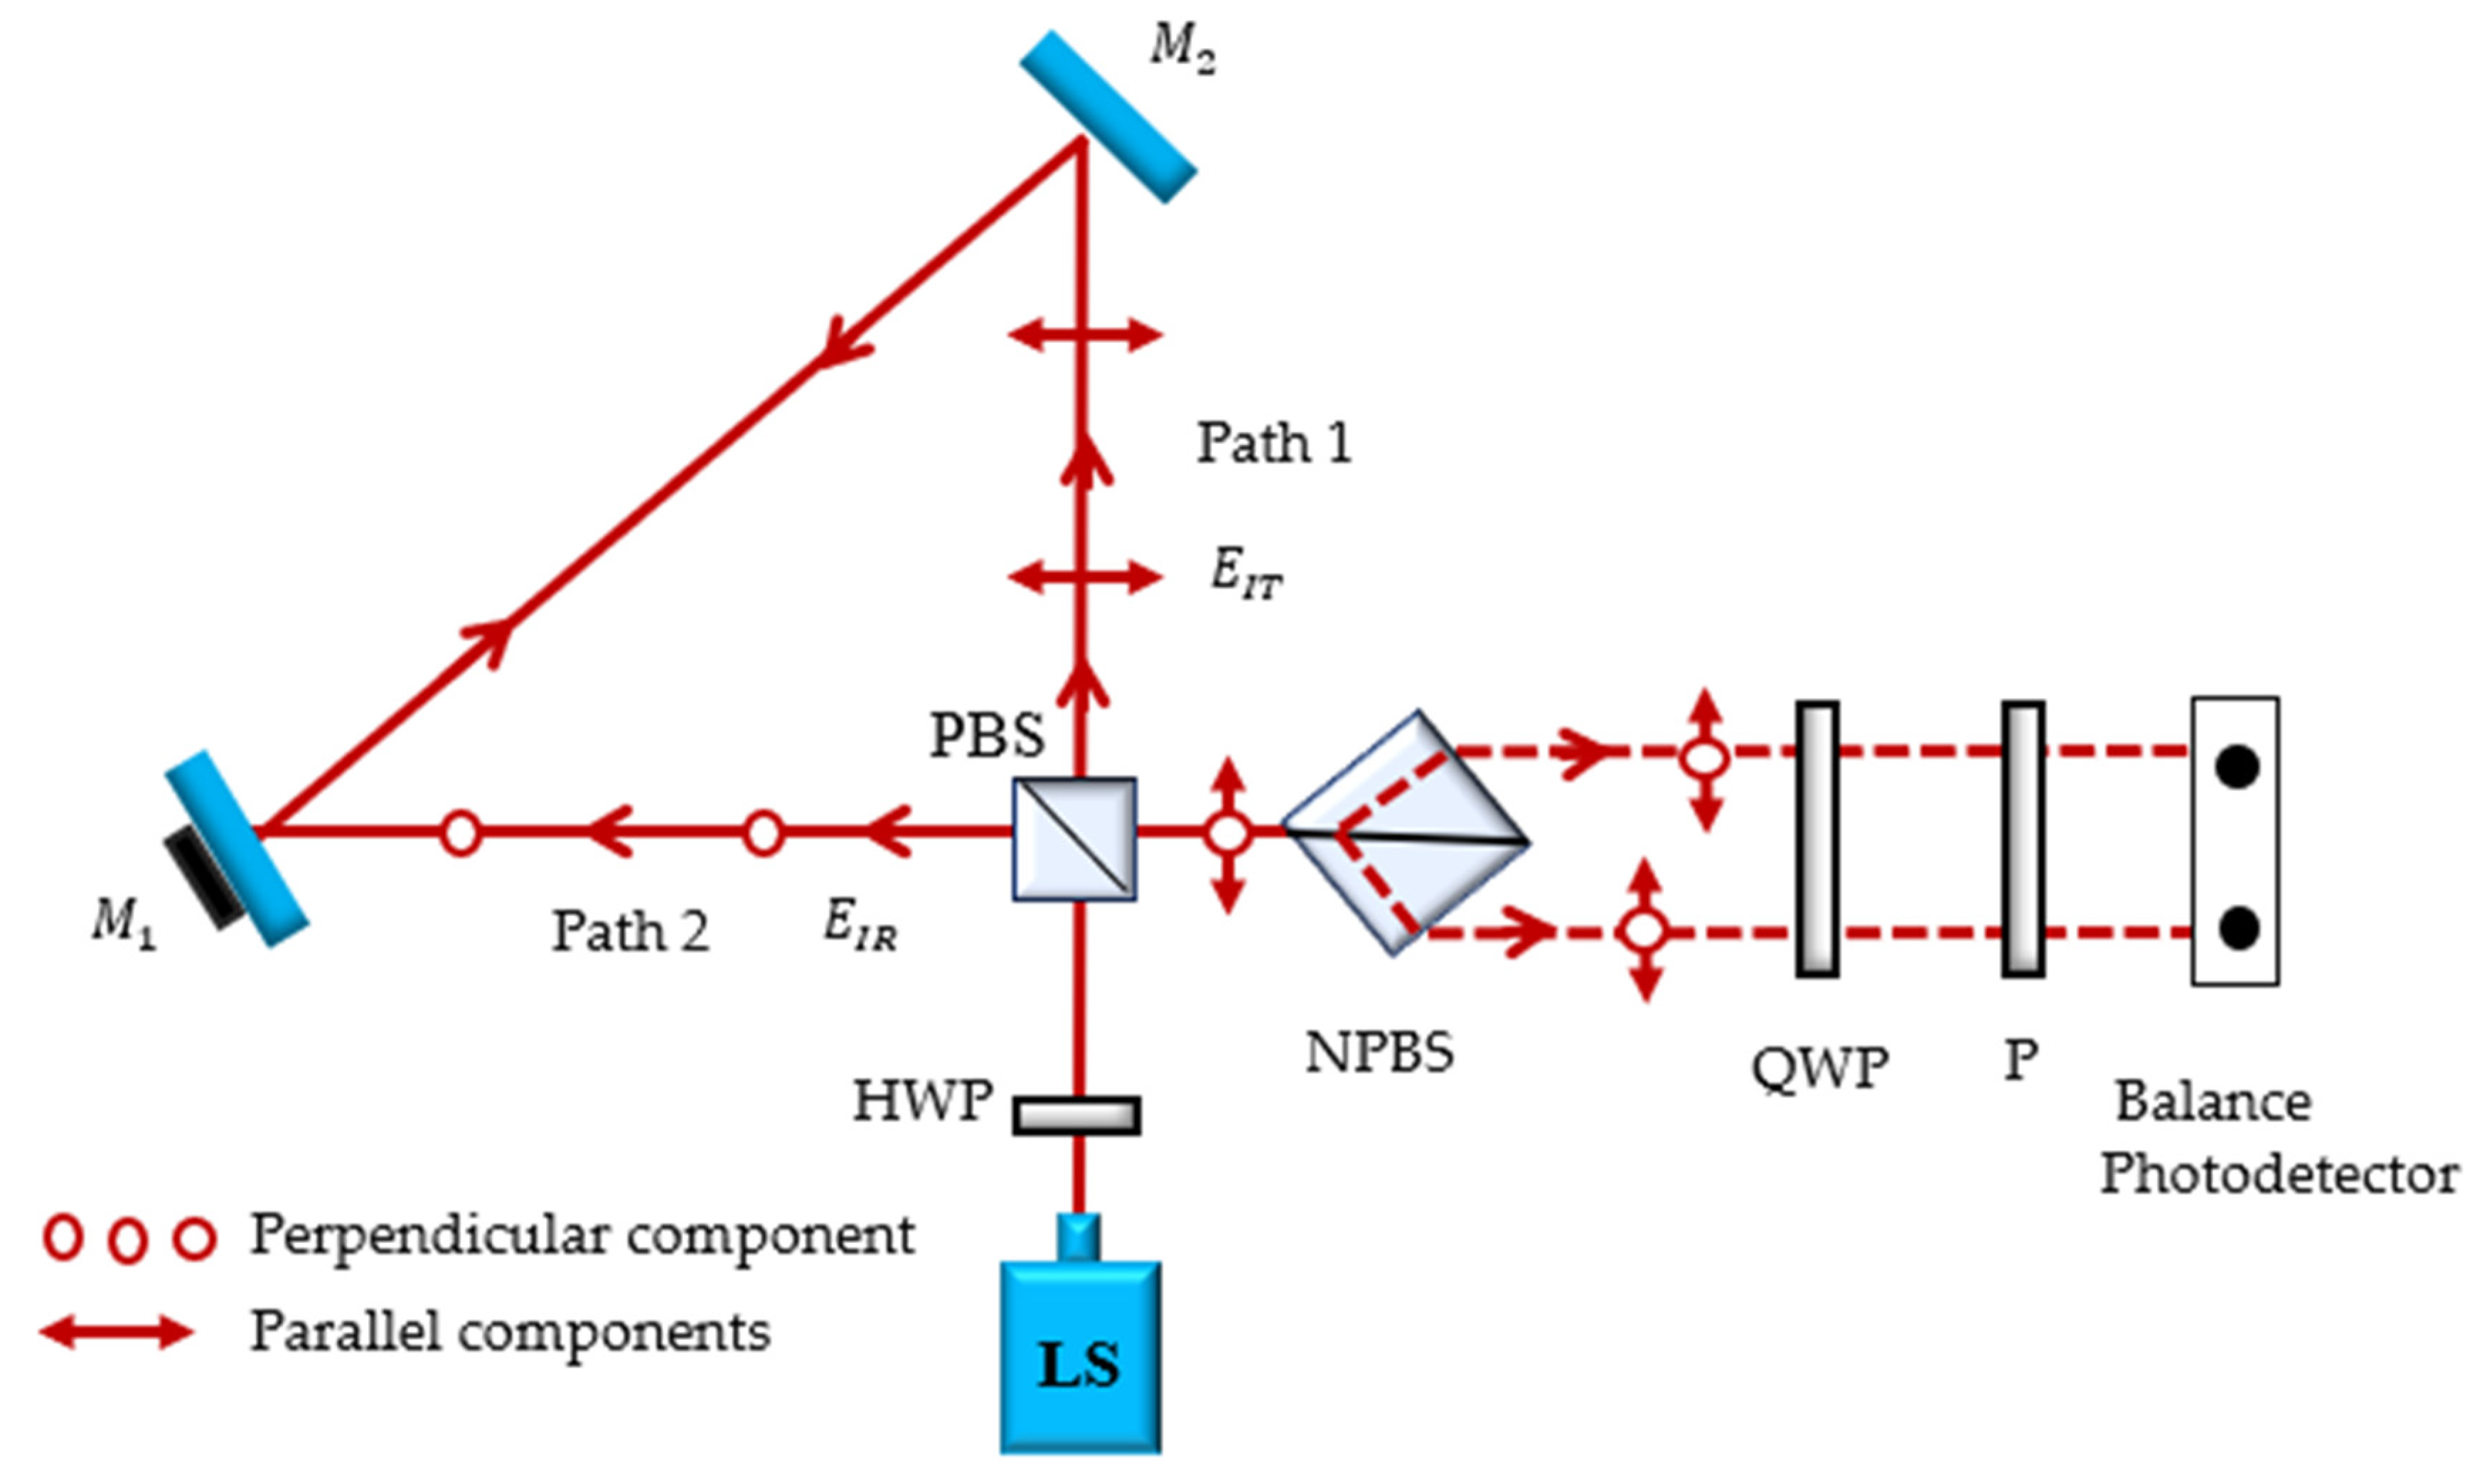
This section discusses the electric field vector determination in the absence of any samples. The Jones calculus is utilized here as it is the fundamental mathematical theory used to evaluate the polarization state of an optical interferometer [18]. In addition, a degree of polarization (DOP) is also stated to assure the quality of the generated rotating polarized lights. A perfectly polarized light having a DOP of 100% is preferable. The arrangement to produce a self-reference and controllable generation of linearly polarized light to achieve DOP is presented, with a simple design, low cost of components, less computational processing time [19,20]. Prior to the setup of the interferometer, lights from a light source, all wave plates, and beam splitter were examined using a software Polar VIEW to ensure states of polarizations. The schematic of a proposed modified Sagnac interferometer is depicted in Figure 1. A half-wave plate (HWP) oriented at 22.5° to the plane of incidence, known as a reference plane, was utilized to form a linearly polarized light at 45° relative to the reference. The Jones vector, , representing an input electric field out of an HWP, can be expressed as
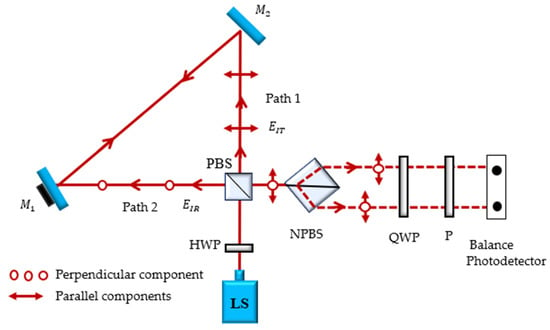
Figure 1.
Schematic of the proposed modified Sagnac interferometer without sample.
A polarization beam splitter (PBS) then divides the light into two beams, which are orthogonal and travel along pathways 1 and 2. Two mirrors ( and ) are used to reflect the orthogonal beams, with attached to a PZT. The PZT was driven by a piezo controller (Thorlabs: MDT694B, New Jersey, USA), which is precision, low-noise, and low-drift controller for piezo actuators. The intelligent-speed-control potentiometers on the front panel allow for precise setting of the output voltage over the full operating range. This controller produced vibration caused by the introduction of the periodic signal generated from the function generator. The PZT vibrated the mirror M1 to introduce the phase shift as a function of time. The PZT is linearly controlling the signal at a constant frequency, which results in a path length difference between the two orthogonal beams, allowing a dynamic phase-shifting scheme.
The transmitted light out of a PBS is defined by the path 1, shown in Figure 1, as → → → → NPBS → QWP (quarter-wave plate). The Jones electric field vector of a transmitted light is linearly parallel to the reference plane travelling in route x (path 1 in Figure 1) can be expressed as
The terms (t) and represent the phase retardations after reflections from mirrors and , respectively, where (t) is time dependent. The Jones matrix representation of QWP, NPBS, transmitted component of a PBS (), and two reflecting mirrors and can be given by the following equations [15].
The route of a reflected light out of a PBS is defined, otherwise, as → → → → NPBS → QWP. The electric field vector of this reflected light, EIR, travelling in route y (path 2 in Figure 1) can be found as
where is the Jones matrix of the reflected component of the PBS and can be given as
with and representing the output phase shifts for transmitted and reflected lights, respectively. Finally, the Jones vector, representing the output electric field, can be expressed as
where is a time-varying phase called offset time.
Therefore, the DOP of the RLPL can be determined to evaluate the quality of the rotating linearly polarized light using the numerical values of the minimum and maximum amplitudes ( and ) of the light electric field. The DOP can be expressed as [19]
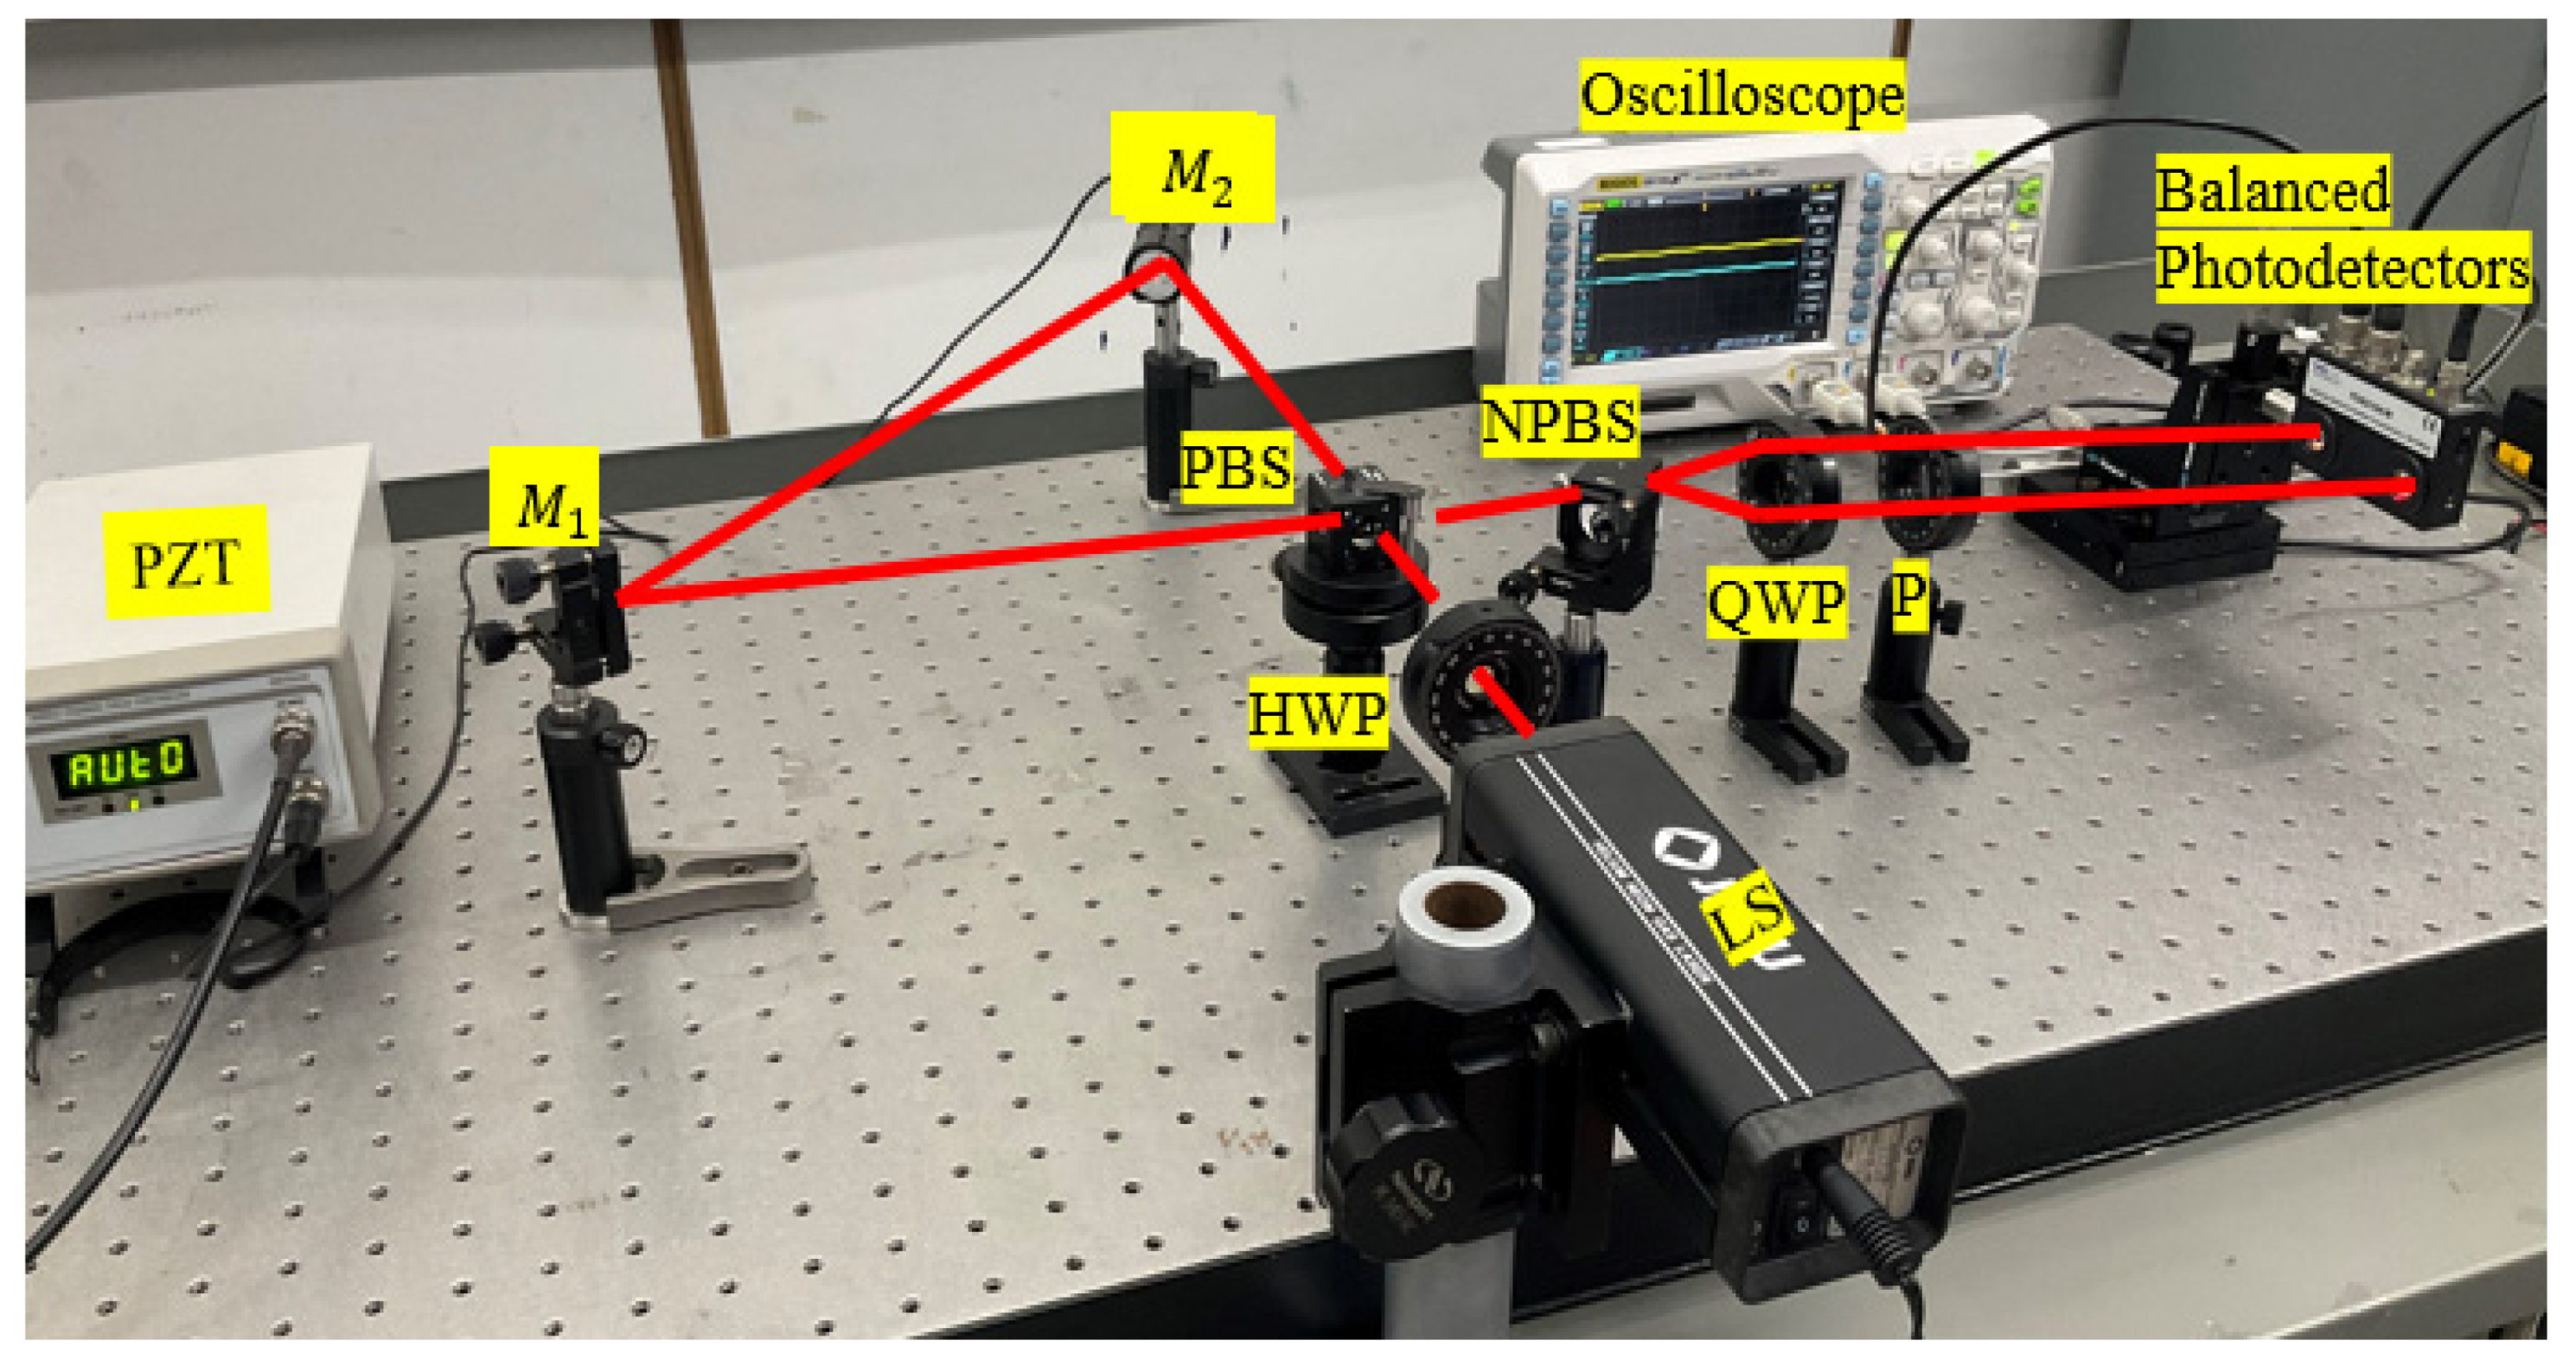
At the output, the NPBS divides a single combined beam out of a PBS into two identical polarized beams, resulting in the reference and sample arms. These dual beams are transformed into two sets of rotating linearly polarized lights (RLPLs) by a QWP oriented at 45° relative to a reference. These are the time-varying phase of rotating linearly polarized light orientation, which depends on the rotation of the mirror attached to the PZT. Finally, they travel through an output linear polarizer or an analyzer (P in Figure 1) oriented at 45° to a reference [21,22]. The balanced photodetectors placed as the last equipment at the output capture both beams, and their signal waveforms are later displayed on the oscilloscope. In most cases, phase shifting is accomplished by rotating the analyzer and collecting light intensities at specific angles. The orientation of RLPL is time varying in relation to the analyzer’s transmission axis in this setup, therefore, it is automatically rotated even while the analyzer’s transmission axis is kept fixed. The variation of light intensities is achieved by phase modulation, not by analyzer alteration, which enables straightforward acquisition of the output light intensities at desired angles without any adjustments at the analyzer. In this paper, a three-phase stepping algorithm is used to obtain light intensities at 0°, 45°, and 90° without touching an analyzer. These intensities are used to evaluate the phase retardation introduced by the sample and its thicknesses. The image of an actual arrangement is depicted in Figure 2.
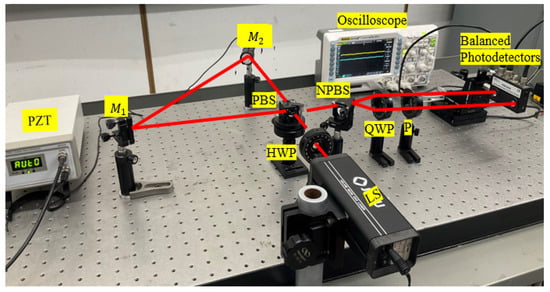
Figure 2.
The experimental setup of the proposed modified Sagnac interferometer.
2.2. Principle of Operation with Samples
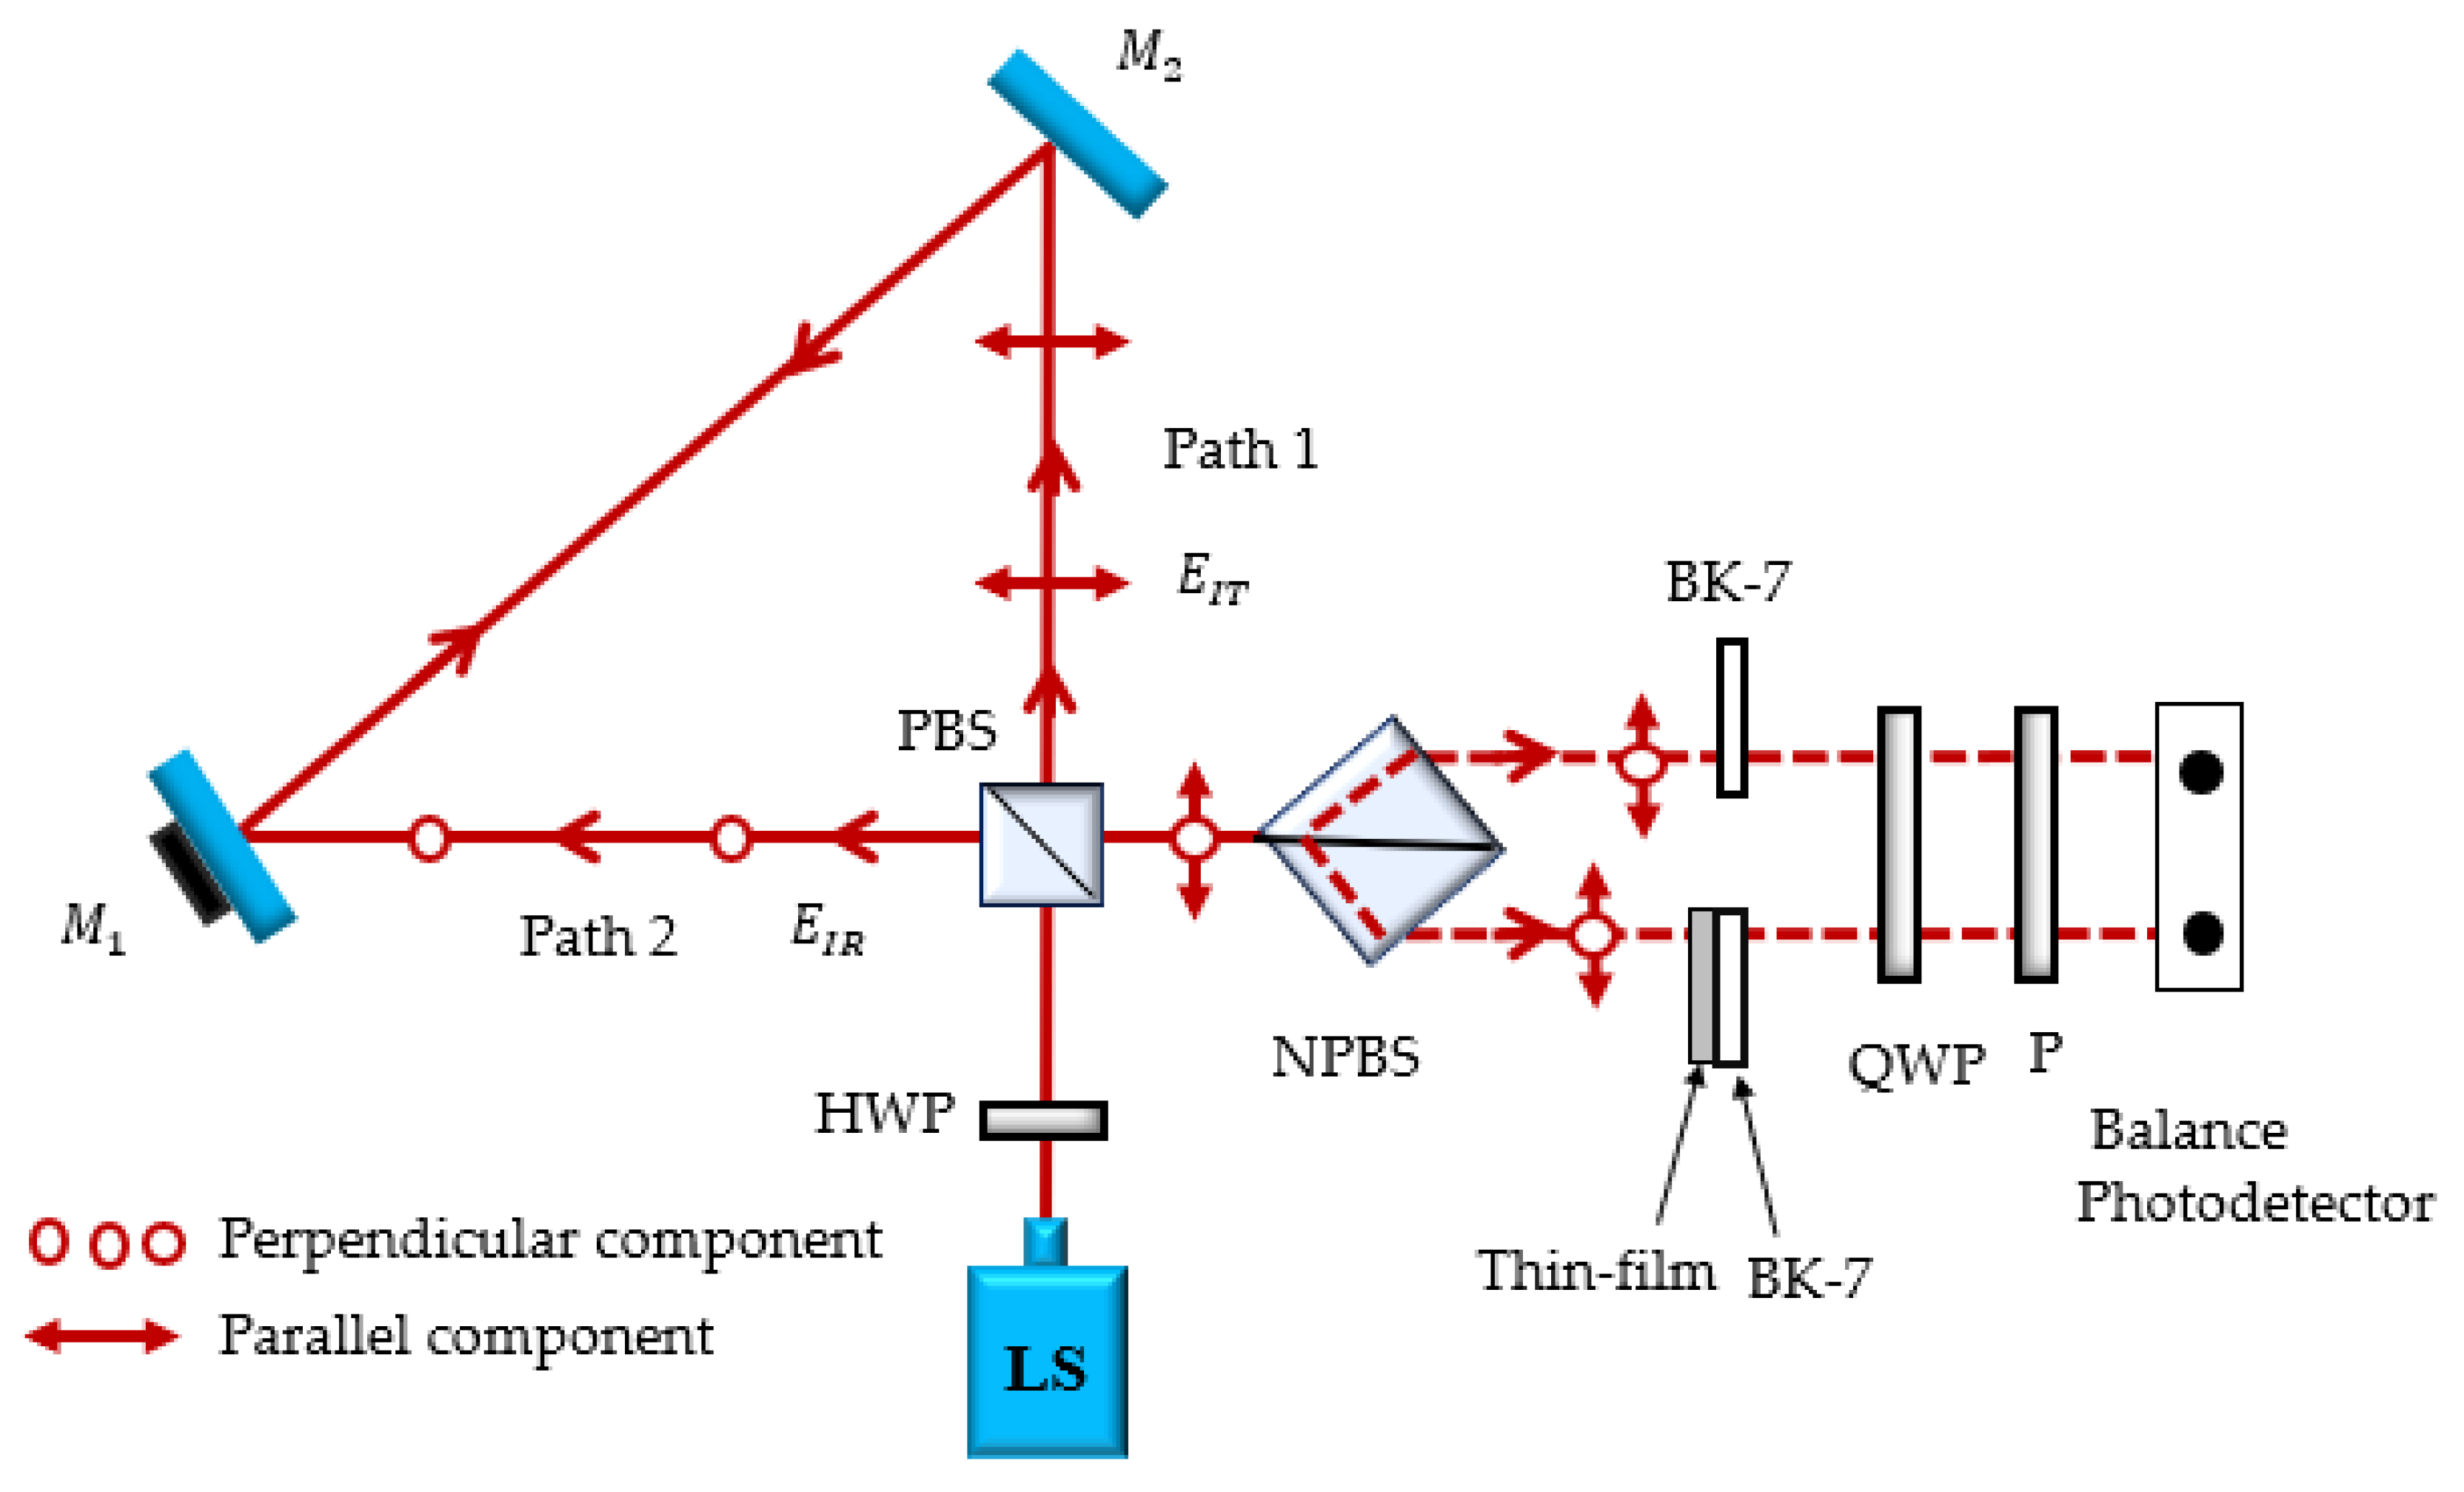
The samples are placed between a NPBS and QWP in the proposed system as depicted in Figure 3. One of the dual rotating linearly polarized lights travels through a pure substrate and it is stated as a reference arm, while the other propagates through a thin-film sample and is called a sensing arm. The Jones matrix representing a homogeneous sample is given by [23]
where and are the transmission coefficients along the principal axes of the thin film coated on the transparent sample and is the phase retardation introduced by a sample. Therefore, the Jones electric field vector of transmitted and reflected lights, and , when samples are inserted, can be written as
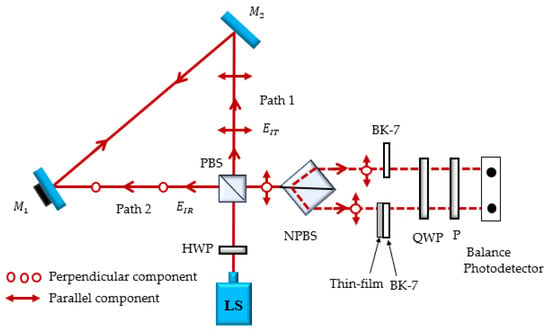
Figure 3.
Schematic of the proposed modified Sagnac interferometer with the presence of samples.
The total electric field vectors of the two signals through a sample, can be obtained as the summation of Equations (13) and (14) as
By letting and , Equation (15) can be written as
2.3. Light Intensities at Various Polarizaton Settings
An analyzer P(θ) located at the output of the proposed system is fixed 45° relative to a reference. The light in Equation (16) travels through this analyzer and its electric field vector can be written as
The light intensity is , where θ refers to the angle that a linear polarizer is set related to the reference plane. As the analyzer, in this work, is constantly set at 45° to the reference axis, the output light intensities at the polarization state of θ = 0°, 45°, or 90° to the reference axis can be represented by a function of θ as [3].
Therefore, the phase retardation induced by the presence of a thin-film sample can be found as
Finally, the phase retardation induced by a reference arm (substrate) and a sensing arm (sample) can be expressed in Equations (20) and (21), respectively.
As a result, the phase difference Δ between the reference and testing samples may be calculated by subtracting Equations (20) and (21) with the term (t) being wiped out as
2.4. Film Thickness Measurement
The phase shift Δ is generally obtained by 2πnd/λ when the light with the wavelength λ travels with the distance d in the medium with refractive index n. Hence, the thin film thickness d can be determined by Δλ/(2πn), where n here is a refractive index of the deposited film. Each transparent film processes a different n, resulting in a variable phase shift. Since the Δ in Equation (22) is an arctan function that forms the 180-degree periodic function, the Δ can be defined in terms of an integer number ‘m’ as Δm = Δ + mπ. The value of Δ can be adjusted to match the measured Δ by adding integer multiples of π, represented as mπ. This m is the cumulative integer chosen when the sign changes from negative to positive. It defines the number of periods of the arctan function of Δ. The cutoff thickness, , at the point where the second cycle begins (Δ = π) is obtained by λ/2n [23], so that the values of for film deposition are 155.90 nm and 148.17 nm for film coating. Thus, in order to have the correct Δ, the proper value of m must be established, and it can be obtained by [15]
where is an approximate deposition rate and is a deposition time. Therefore, the measured thickness d can only be achieved if the above conditions are satisfied as [15,23]
3. Results
The stability of the proposed system can be considered into two factors: external and internal. The external factor is the ambient temperature as the material refractive index is a function of temperature. Consequently, the temperature and humidity were meticulously maintained to be 25 °C and 55–60%, respectively. For the internal factor consideration, the beams travelled through different optomechanical elements (e.g., mirrors and wave plates) with probably different vibrational properties. This could induce an additional relative phase apart from one generated by a PZT. Fortunately, all optical components in a Sagnac interferometer act in the same way on all beams, so no additional relative phases are created. Thus, the only imbalances are due to localized changes in phase length during the time the light traverses the paths. In addition, the Sagnac configuration’s path lengths are naturally matched. As a result, light traveling in two arms in the proposed interferometer produces more stable results than other interferometric ones. Furthermore, the tests were conducted in a dark room to avoid any unwanted external light, and the system was let at least 40 min to stabilize before data were collected. To ensure that the collected data were feasible and repeatable, over 20 rounds of experiments were conducted.
The thin films were prepared by a commercial UHV sputtering system (AJA International Inc., ATC2000-F, Massachusetts, USA). The transparent thin films of (n = 1.98) and (n = 2.03) were deposited on the BK-7 substrate (n = 1.5168) using a pulsed DC reactive magnetron sputtering system for 32 and 103 min, respectively. The double layers of the / were deposited as follows: the first layer of film was deposited on the BK-7 for 32 min. Then, the second layer of was grown on top of the layer for 103 min. The UHV sputtering system used in this work acheived deposition rates of 9.2 nm/min and 1.1 nm/min for coating and films on BK-7 substrate, respectively. A monochromatic HeNe laser source (JDSU, 1508P-2, California, USA) with a wavelength of 632.8 nm was used as a light source. The balanced photodetectors (Thorlabs, PDB210A/M, New Jersey, USA) were used to acquire all output intensities.
3.1. Degree of Polarization of Generated Linearly Rotating Polarized Lights
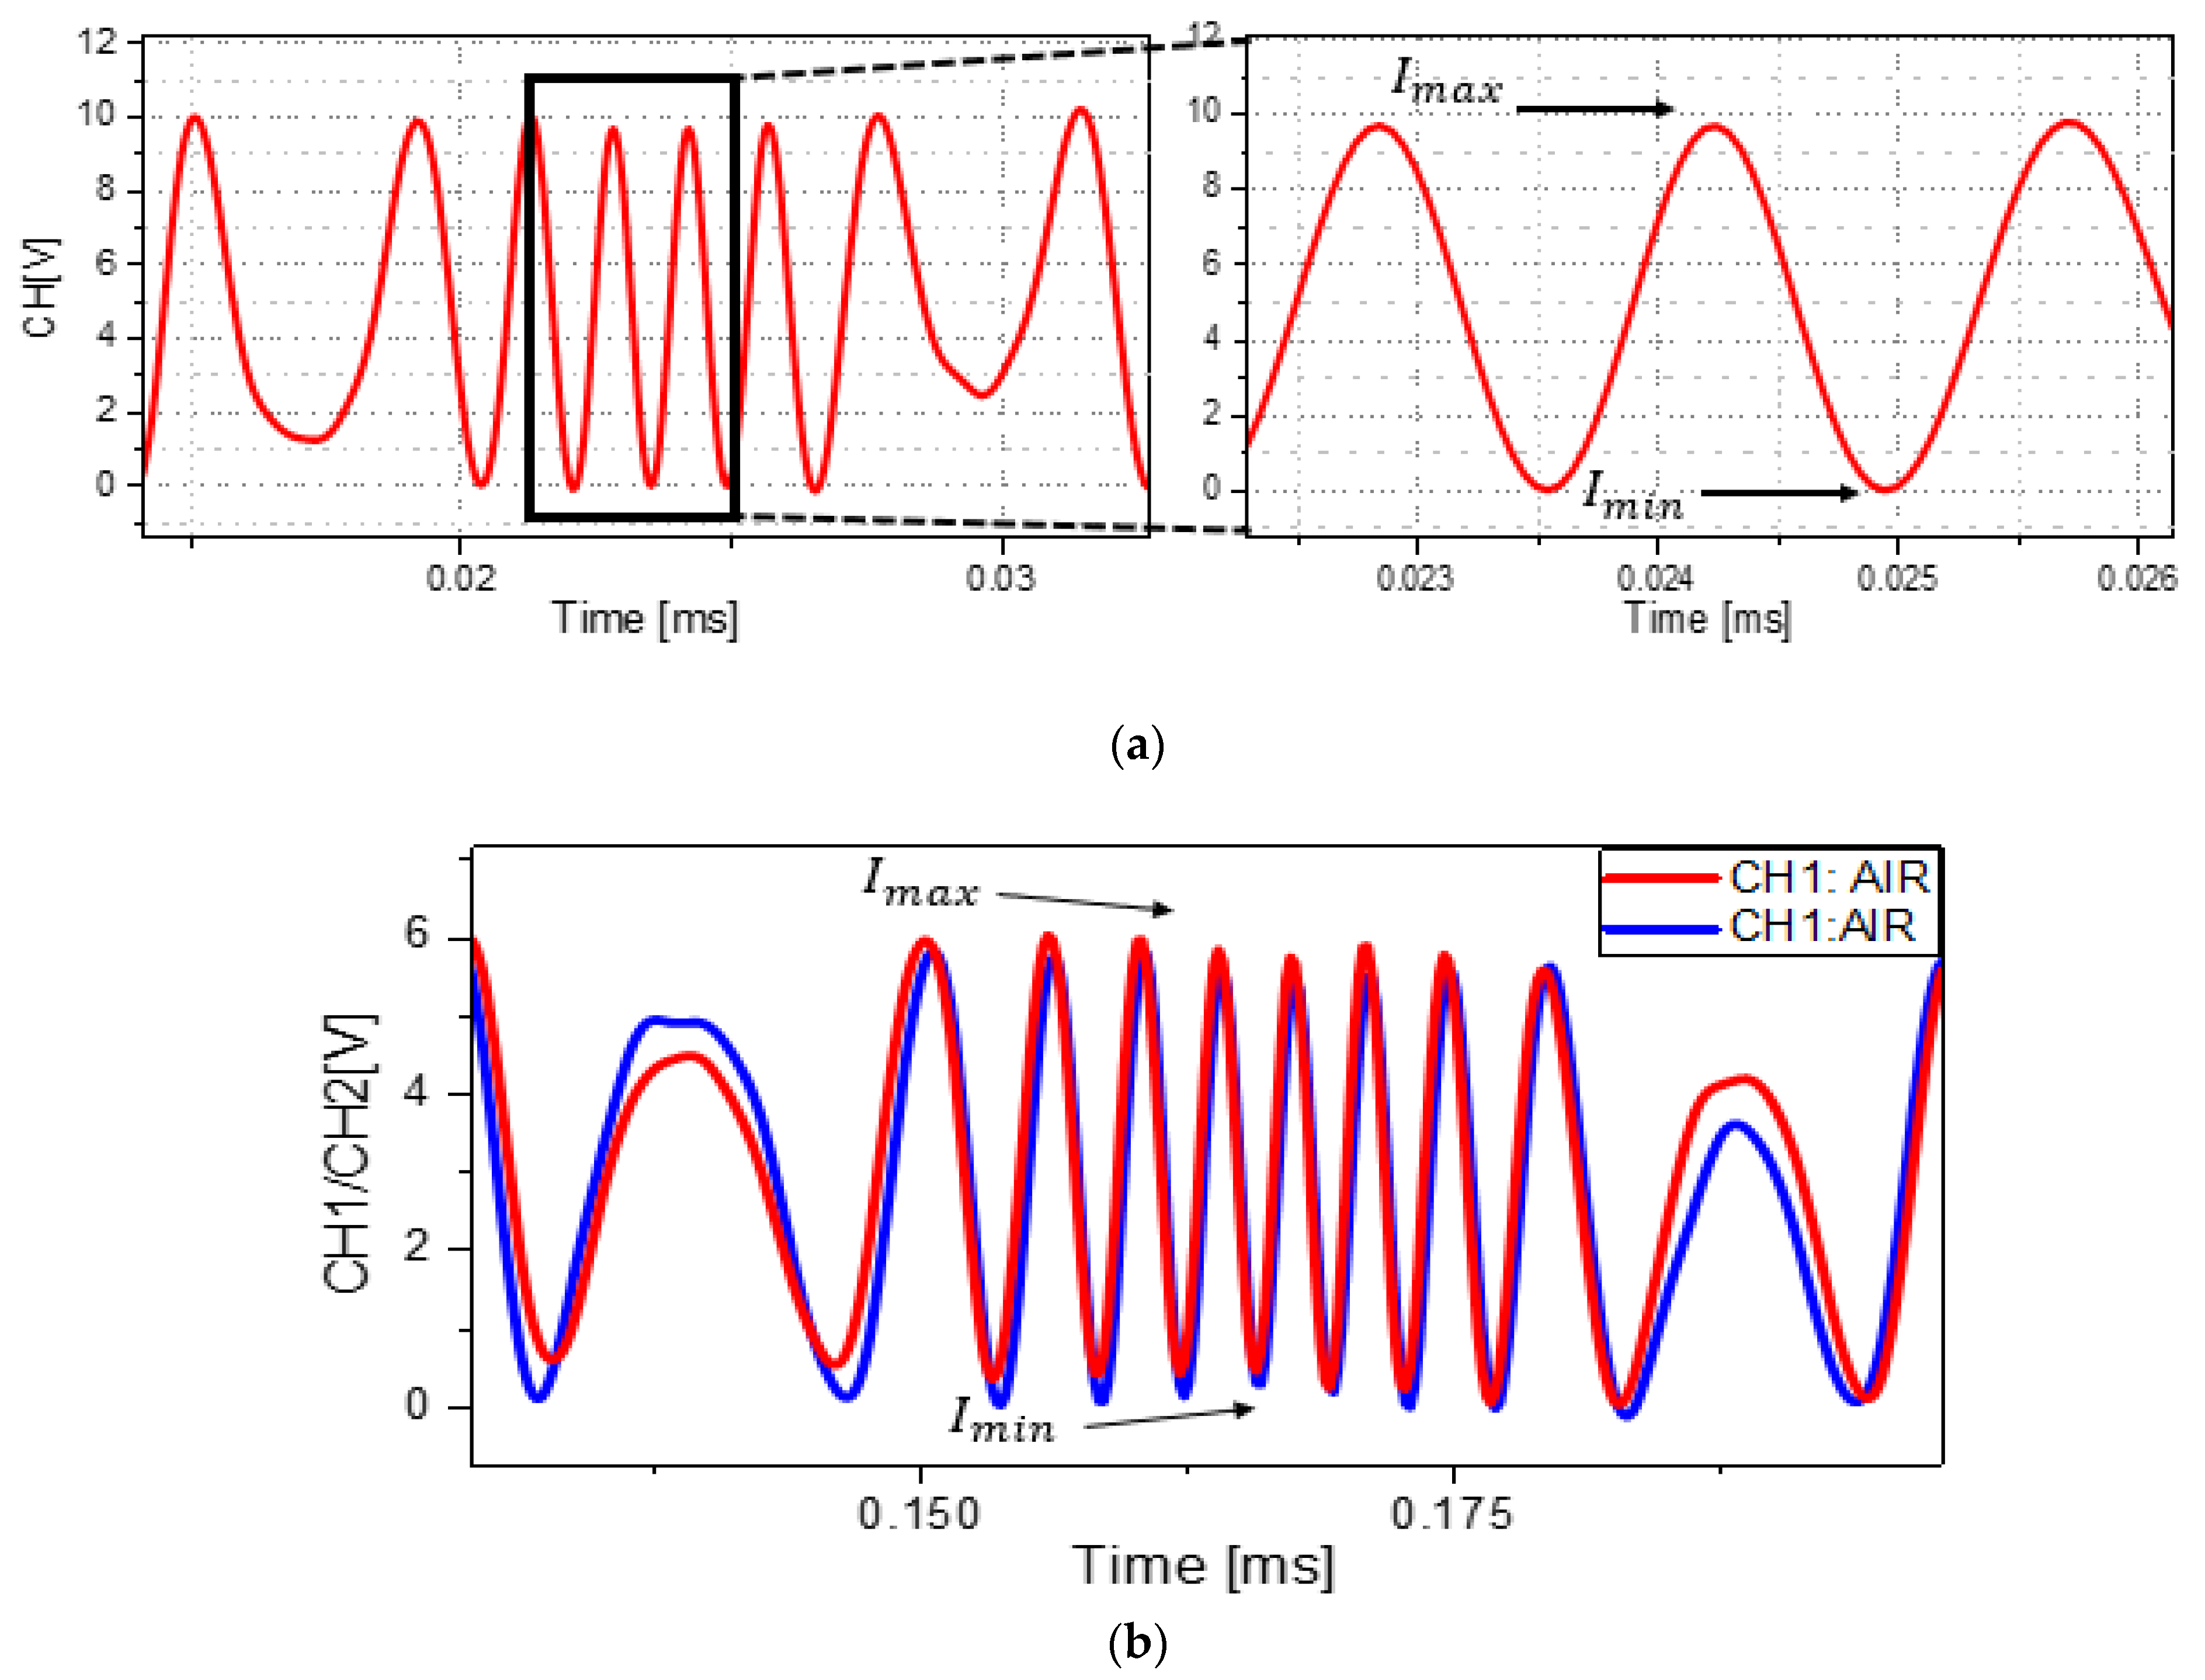
Prior to the presence of the sample, the quality of the generated rotating polarized lights from the proposed interferometric system was evaluated. The graph of the measured light intensities in terms of voltage was illustrated in Figure 4. The average minimum and maximum intensity values of the reference beam could be determined from Figure 4a as 0.06 V and 10.06 V, respectively. Consequently, the DOPs of 99.40 percent for both lights were attained using Equation (11) as both beams were almost perfectly identical as shown in Figure 4b.
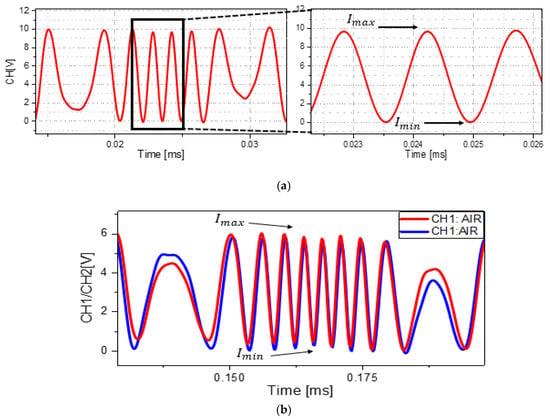
Figure 4.
Experimental waveforms taken from an oscilloscope displaying the minimum and maximum intensities of (a) single beam and (b) dual beams without a sample.
3.2. Phase Shift Determination
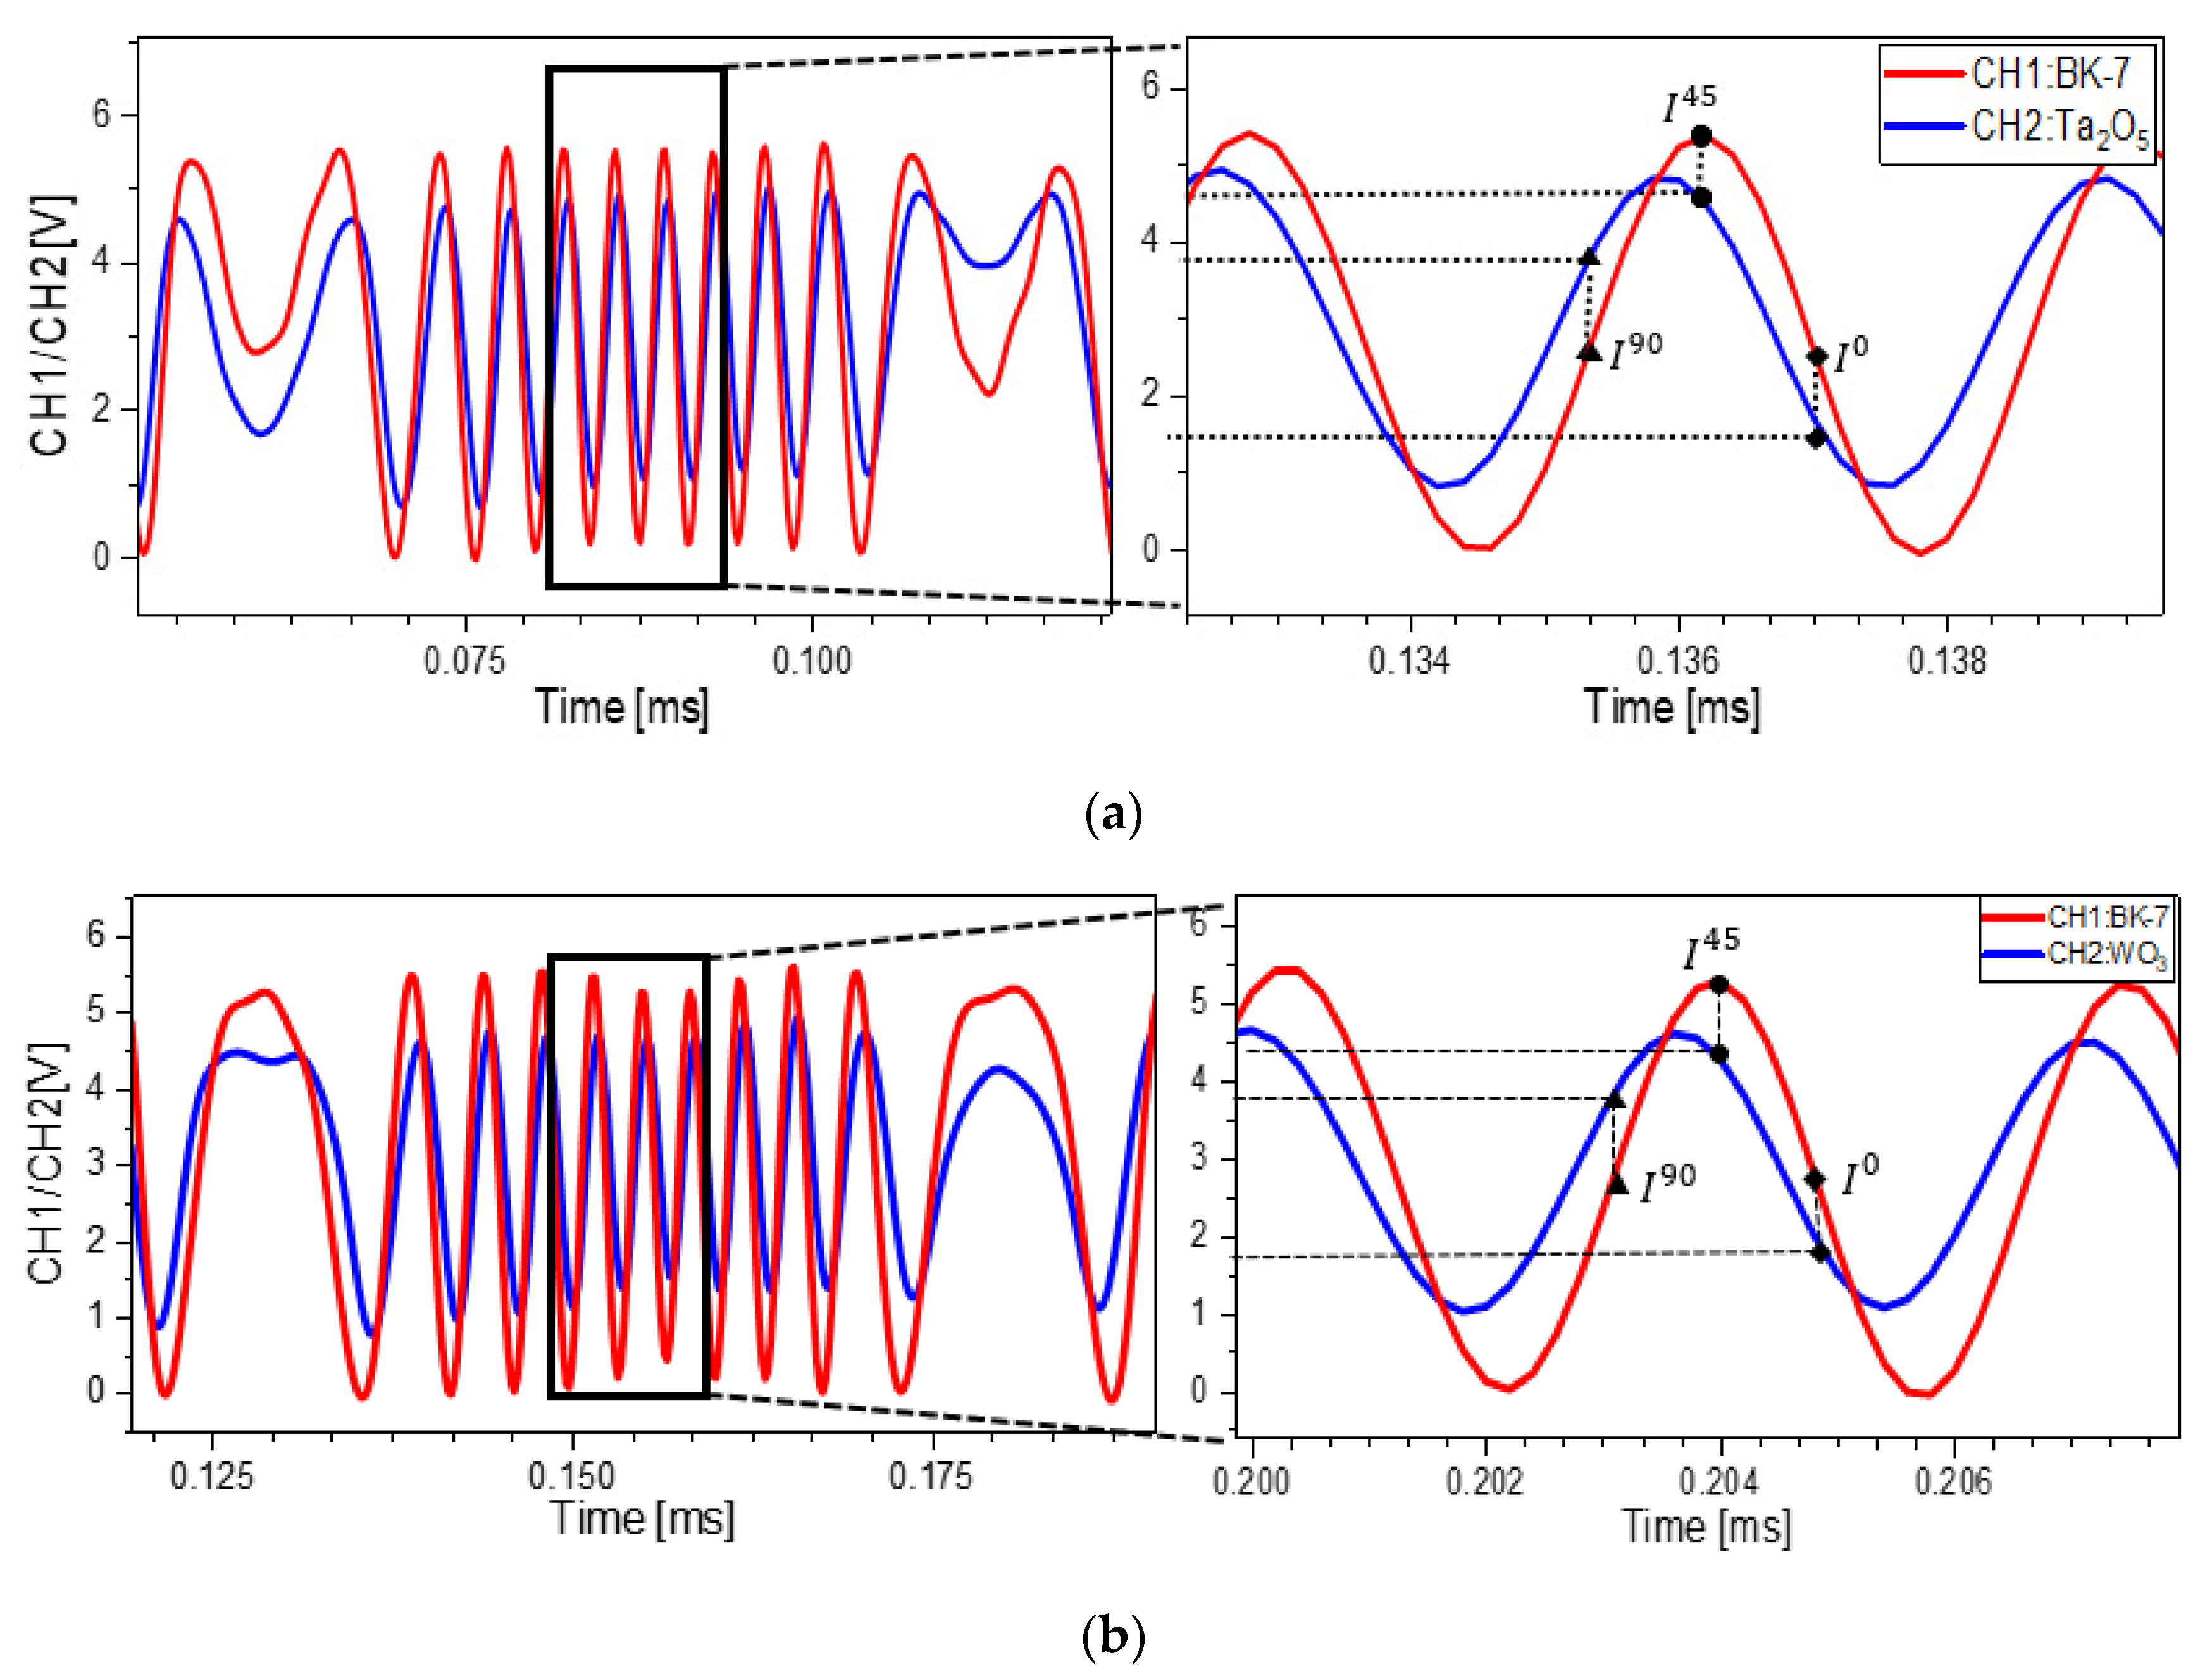
The real-time determination of the phase retardation introduced by the samples was achieved. All of the substrates (FOCtek, Fujian, China) used in the tests were pure and identical, and they came from the same batch. They were spherical in shape, with a diameter of 25.0 mm and a thickness of 1.0 mm. As a result, all of the BK-7 samples utilized in the experiments had the same thickness. Three samples, with coated film, film, and / films on BK-7 substrates, were prepared for this work. The sample placement in the system was depicted in Figure 3. The signals acquired from both interferometer arms were shown in Figure 5. For each film deposition scenario, the average intensity values at the three polarizations (0°, 45°, and 90°) were used as numerical data placed in Equations (20) and (21). It is worth noting that all of the requisite intensities were achieved without the use of any moving parts in the polarizing devices. This was possible through the time-dependent orientation of the rotating polarized light.
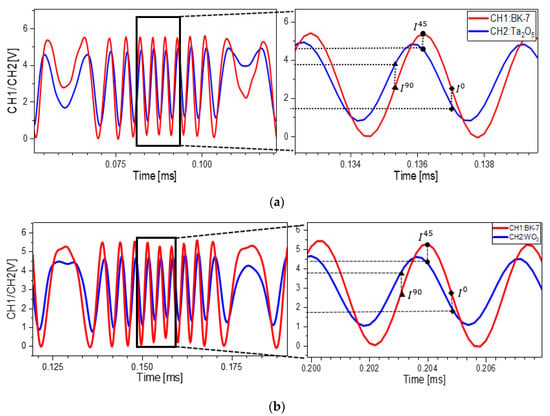
Figure 5.
Output light intensities of the reference and sensing arms with single-layer deposited films of (a) and (b) placed in the proposed system.
For single-layer deposited film sample, desire intensities were obtained by measuring intensities at various polarizations of the reference and sensing arms, as illustrated in Figure 5. The data were meticulously collected, and the phase shift in each case was properly investigated. Table 1 showed the average output light intensities obtained from Figure 5a,b under different polarizations. Consequently, with the help of Equations (20)–(22), the phase shifts, produced by - and -coated samples, were found to be 0.38 and 0.50 radians, respectively.

Table 1.
Output light intensities with BK-7 and single-layer samples placed in the proposed system.
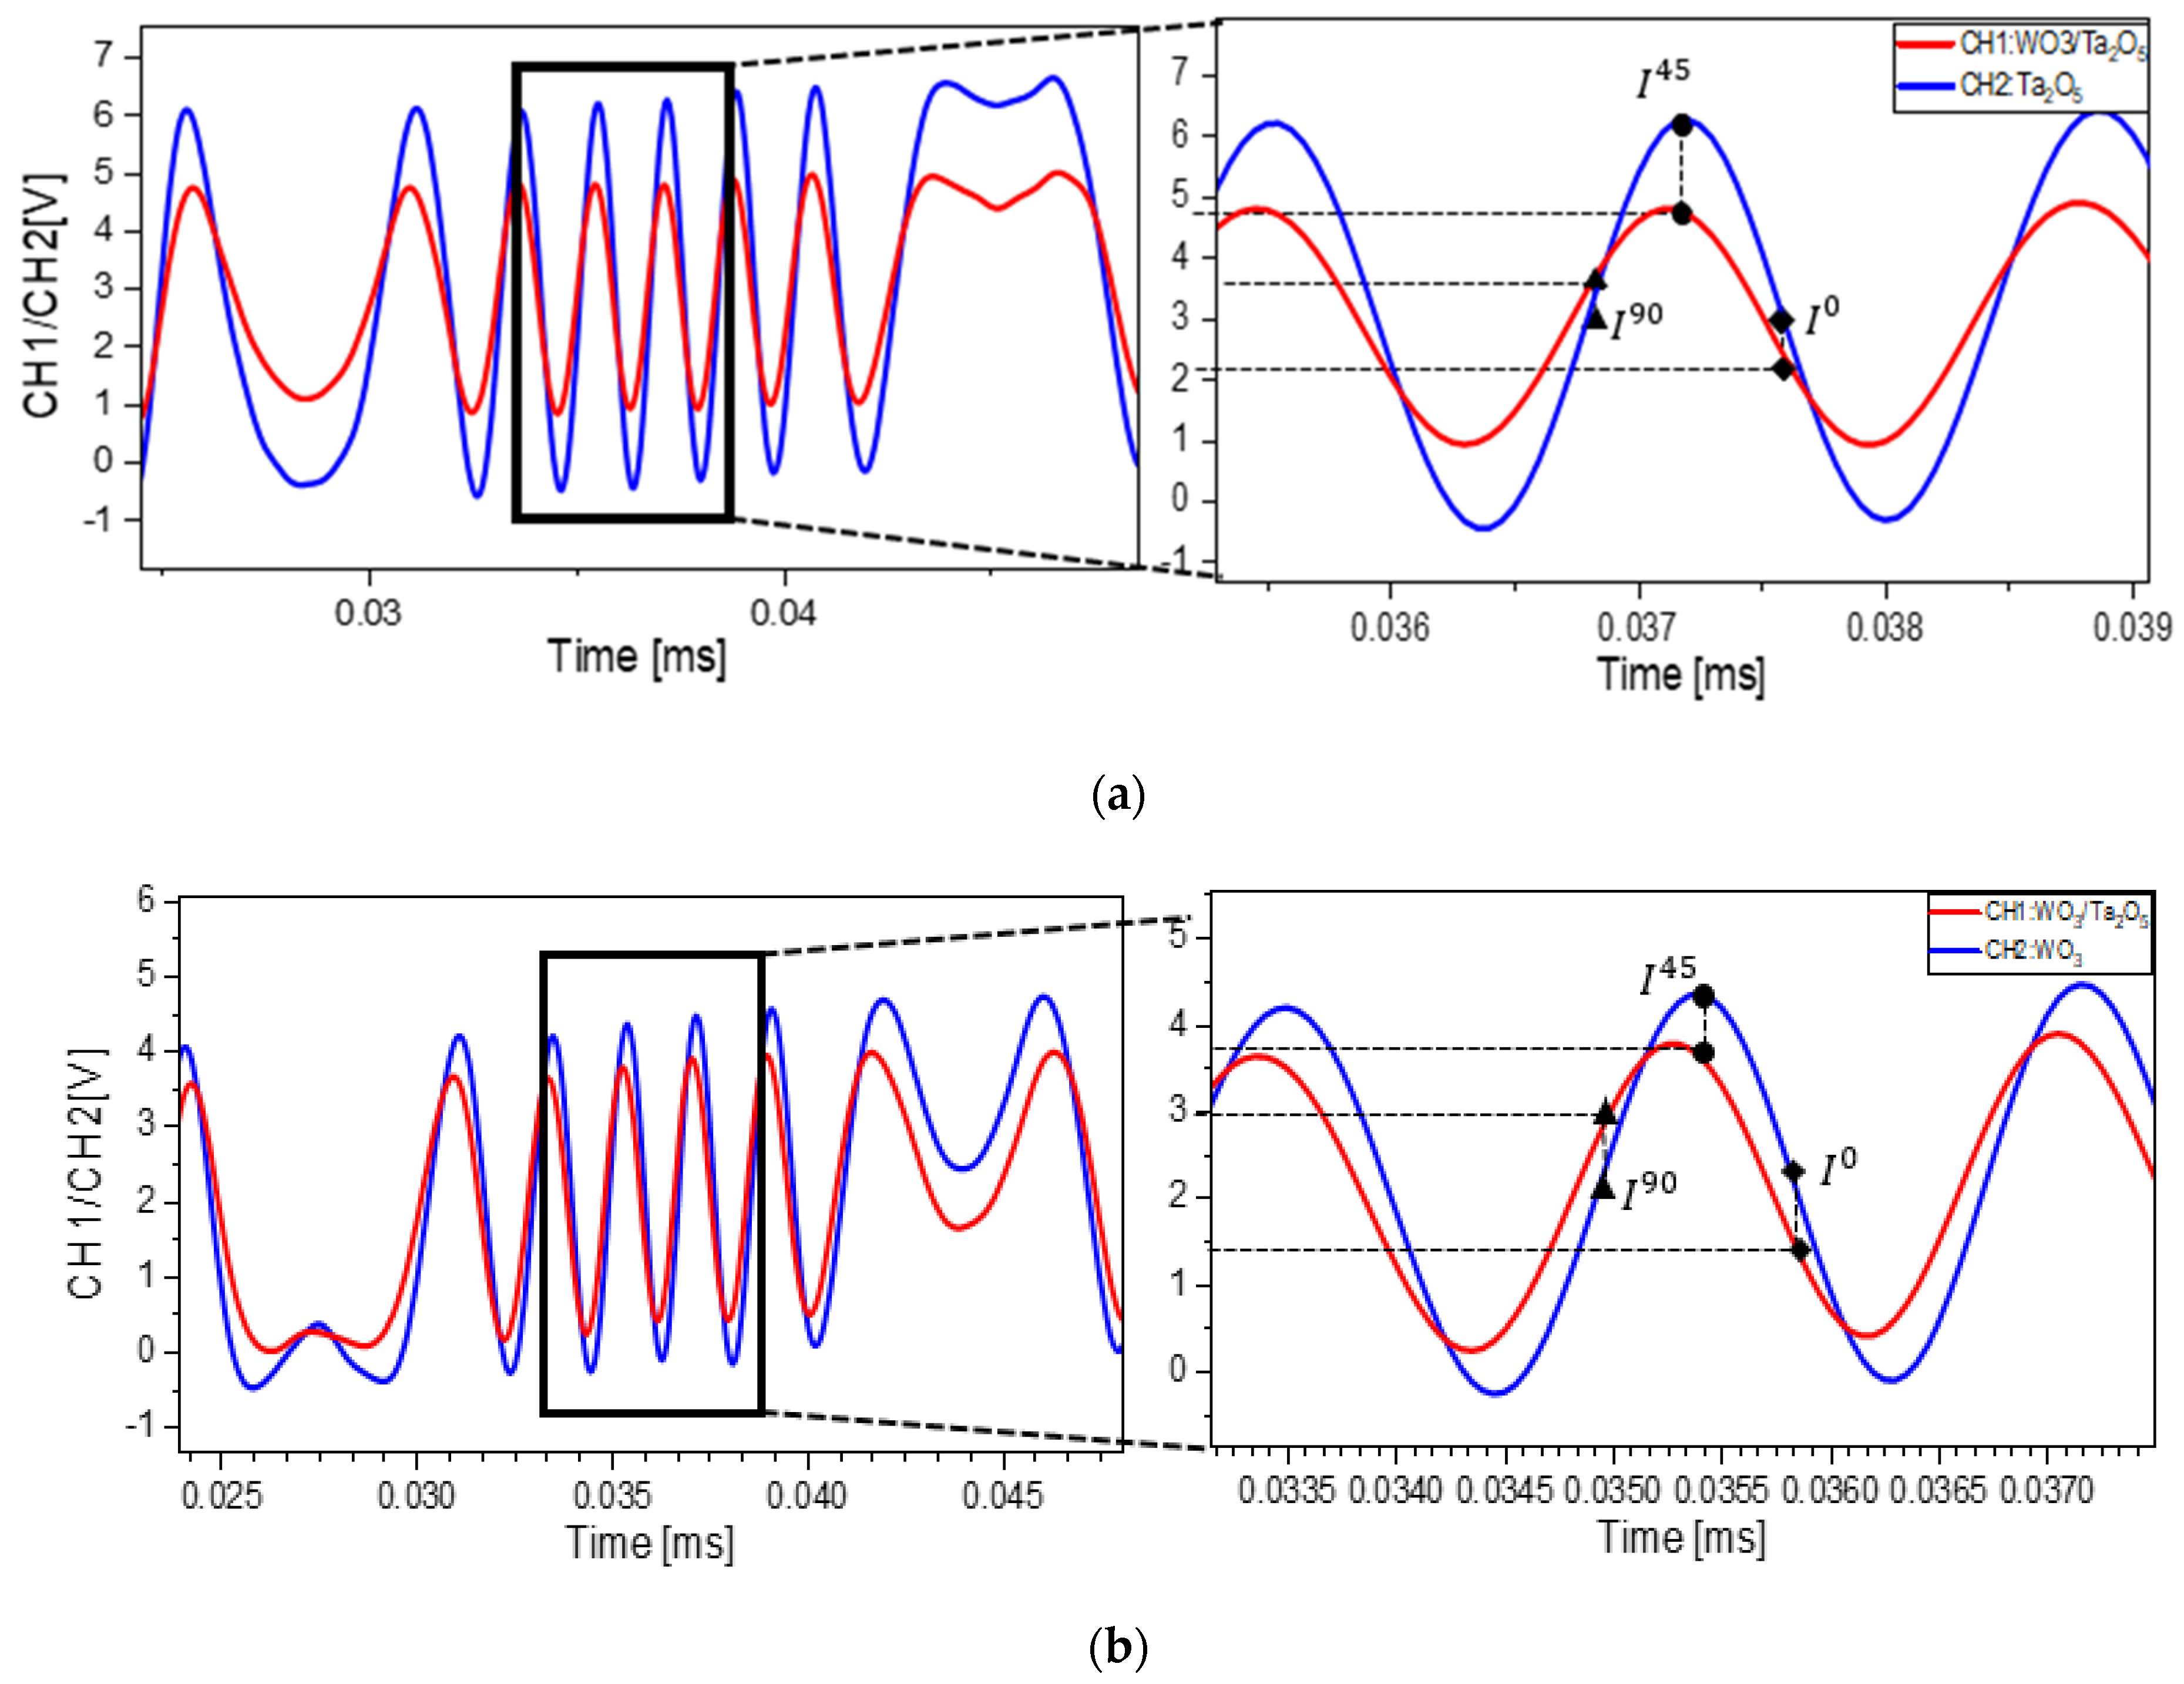
Three samples, consisting of a single-layer of sample, a single-layer of sample, and a double-layer of sample, were prepared under the same condition and thickness for the same kind of deposited film. The measurements were performed twice to attain each layer thickness. First, the sample was placed at the reference arm and the sample was put in the sensing arm to obtain the thickness of layer. To determine the thickness of the film, the sample was then placed in the reference arm and the sample was placed in the sensing arm. Again, the data were carefully collected, and the phase shift in each case was thoroughly analyzed. The required intensities were achieved by measuring intensities at three polarizations of the reference and sensing arms in each case, as depicted in Figure 6. The average output light intensities obtained from Figure 6a,b under different polarizations were concluded in Table 2. The middle layer () and the outer layer () introduced phase changes of 0.48 and 0.35 radians, respectively.
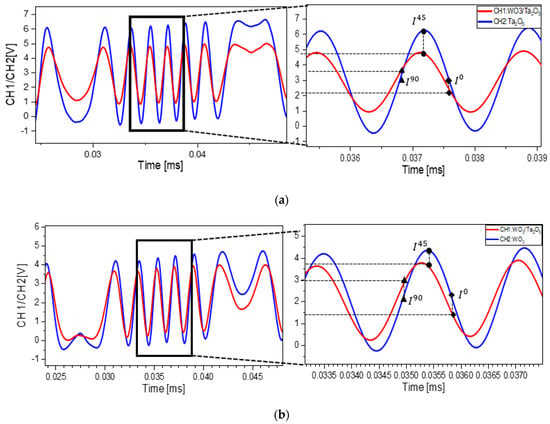
Figure 6.
Output light intensities of the reference and sensing arms with double-layer deposited films of (a) and (b) placed in the proposed system.

Table 2.
Output intensities with BK-7 and double-layers thin-films placed in the proposed system.
3.3. Thickness Measurement
Figure 7 depicts a cross-section of all samples’ film thickness measurements taken using commercial field emission scanning electron microscopy or FE-SEM (Hitachi High Tech., SU8030, Tokyo, Japan). The observed phase shifts were then converted to the film thickness values using Equation (24). These yielded the film thickness of 297.7 nm and 114.2 nm for - and -samples, respectively, whereas the thickness of the double layer sample of / was given as 298.1/118.9 nm. To validate these results, the measured results from our proposed system were compared to those from the commercial FE-SEM. Table 3 summarizes the thin film analysis and comparison findings between the proposed system and FE-SEM.

Figure 7.
Cross-sections of and / films taken by FE-SEM.

Table 3.
Summary of the thin film analysis and comparison results between the proposed system and FE-SEM.
4. Discussion
The proposed approach offers a few advantages over our previous works, [15] and [23]. In both reports, an extra wave plate was inserted in the interferometric system to induce phase retardation via its fast and slow axes, which it is not required in the current arrangement. The measurements were made at different times and not in real time, therefore, a high-end and expensive oscilloscope was needed to capture the output light waveforms in order to provide the precise data needed for phase-shift determination in [23]. With the proposed setup, the measurements of reference and sensing arms were simultaneously taken in real-time and the typical oscilloscope could be employed to collect the data. Furthermore, due to samples being placed inside the interferometric system in [15], extra caution was required not to disrupt or interfere with the well-organized interferometry. Unlike the proposed method, in which the samples were placed outside, the sample location had no effect on the well-setup system.
The three-step algorithm of acquiring three light intensities from 0°, 45°, and 90° polarizations is crucial as those intensities are later used to obtain the phase retardation, which, eventually, is converted to the film thickness. The presented mode is mathematically proven to be effective for thin-film thickness measurement in real-time film deposition. The same model and schemes may be implemented using a CCD camera for the microscopic measurement. The analysis for the multiple reflections on the mirror attached to PZT will also be considered in the next phase of our work for sensitivity improvement and incident angle measurement. The main contribution of this system is a simultaneous measurement of the two-arm interferometers through an automatic phase shift determination with the help of a PZT with less components, low processing time, and finally achieved the thickness of a single- and double-layer transparent thin films. The proposed setup processes a good potential for applications in non-contact film thickness measuring in real-time. With further development, it could be used to evaluate optical properties such as material refractive index, or it might also be expanded to detect the deformation of microscopic samples with a CCD camera.
5. Conclusions
The measurement of thin film thickness using a modified Sagnac interferometer based on the polarization phase-shifting method is given here. At the interferometer output, rotating linearly polarized light was generated and divided into two beams. One beam served as a reference, while the other acted as a sensing arm. To assure the quality of the rotating polarized signal, the DOP was examined and yielded 99.40%, which is exceptionally satisfied. The three-step algorithm was used to achieve light intensities at various polarizations of 0°, 45°, and 90° to a reference plane. These intensities were then translated to a sample-induced phase shift. The acquired phase retardation could finally be converted into the film thickness. The experimental results of thickness readings of -, -, and / films on BK-7 substrates errors of 1.3%, 0.2%, and 1.3/2.5%, respectively, when compared to FE-SEM commercial measured values. As a result, the proposed method has a lot of potential for real-time, multi-layer, non-contact thickness measurement without changing the orientations of polarizing devices.
Author Contributions
All of the authors discussed the experiment design and contents of the manuscript. Under the supervision of A.B., Y.J., and R.K., A.U. was in charge of the test setup and the experiments. The experimental results were primarily evaluated and discussed by all authors. A.U. created the mathematical model, while A.B., R.K., Y.J., and C.P. verified it. The paper was mainly written by A.U. and A.B., with assistance from the remaining authors for advice and proofreading. All authors have read and agreed to the published version of the manuscript.
Funding
This research received no external funding.
Data Availability Statement
The research did not report any data.
Acknowledgments
The first author is supported by the Petchra Pra Jom Klao Doctoral Scholarship from King Mongkut’s University of Technology Thonburi” (Scholarship No. 46/2562). The authors would like to thank the National Electronics and Computer Technology Center (NECTEC), Thailand for providing film samples.
Conflicts of Interest
The authors declare no conflict of interest.
References
- Glebov, V.; Lashmanov, O. Modelling of interference pattern produced by michelson interferometer. Opt. Model. Des. IV 2016, 9889, 98891G. [Google Scholar]
- García-Lechuga, L.; Perez-luna, P.; Flores, V.H.; Montes-Perez, A.; Quiroz-Rodriquez, A.; Islas-Islas, J.M.; Toto-Arellano. Parallel phase shifting radial shear interferometry with complex fringes and unknown phase shift. Appl. Opt. 2020, 59, 2128–2134. [Google Scholar] [CrossRef] [PubMed]
- Toto Arellano, N.I. Radial polarizing phase shifting interferometry with applications to single-shot n interferogram measurements and potential usage for white light interferogram analysis. Appl. Opt. 2020, 59, 3246. [Google Scholar] [CrossRef] [PubMed]
- Kumar, Y.P.; Chatterjee, S. Measurement of longitudinal displacement using lateral shearing cyclic path optical configuration setup and phase shifting interferometry. Appl. Opt. 2011, 50, 1350–1355. [Google Scholar] [CrossRef] [PubMed]
- Tang, G.; Huang, H.; Liu, Y.; Wang, H. Compact photonic crystal polarization beam splitter based on the self-collimation effect. Photonics 2021, 8, 198. [Google Scholar] [CrossRef]
- Arai, Y. Microshape measurement method using speckle interferometry based on phase analysis. Photonics 2021, 8, 112. [Google Scholar] [CrossRef]
- García Lechuga, L.; Toto-Arellano, N.I.; Muñoz, F.V.H.; Martínez-García, A.; Zurita, R. Phase shifting interferometry using a coupled cyclic path interferometer. In Emerging Challenges for Experimental Mechanics in Energy and Environmental Applications, Proceedings of the 5th International Symposium on Experimental Mechanics and 9th Symposium on Optics in Industry (ISEM-SOI), Guanajuato, Mexico, 17–21 August 2015; Martínez-García, A., Furlong, C., Barrientos, B., Pryputniewicz, R.J., Eds.; Springer: Cham, Switzerland, 2017; Volume 1, pp. 75–83. [Google Scholar]
- Toto-Arellano, N.I.; Serrano-García, D.I.; Martínez-García, A. Parallel two-step phase shifting interferometry using a double cyclic shear interferometer. Opt. Express 2013, 21, 31983. [Google Scholar] [CrossRef] [PubMed][Green Version]
- López-Ortiz, B.; Toto-Arellano, N.I.; Muñoz, V.H.F.; García, A.M.; Tellez, Y.A.C. Measurement of the slope of transparent micro-structures using two-steps parallel phase shifting interferometry. Optik 2015, 126, 5928–5931. [Google Scholar] [CrossRef]
- Pretheesh Kumar, V.C.; Ganesan, A.R.; Joenathan, C.; Somasundaram, U. Effect of beam quality on tilt measurement using cyclic interferometer. In Proceedings of the SPIE Interferometry XVIII, San Diego, CA, USA, 30 August–1 September 2016; Creath, K., Burke, J., Gonçalves, A.A., Jr., Eds.; Volume 9960, pp. 99600H-1–99600H-7. [Google Scholar]
- Joenathan, C.; Naderishahab, T.; Bernal, A.; Krovetz, A.B.; Pretheesh Kumar, V.C.; Ganesan, A.R. Nanoscale tilt measurement using a cyclic interferometer with polarization phase stepping and multiple reflections. Appl. Opt. 2018, 57, B52–B58. [Google Scholar] [CrossRef] [PubMed]
- Pretheesh Kumar, V.C.; Ganesan, A.R. Nano scale tilt measurement using a polarizing phase shifting cyclic interferometer. Opt. Laser Technol. 2019, 120, 105691. [Google Scholar] [CrossRef]
- Su, H.; Ye, R.; Cheng, F.; Cui, C.; Yu, Q. A straightness error compensation system for topography measurement based on thin film interferometry. Photonics 2021, 8, 149. [Google Scholar] [CrossRef]
- Flores Muñoz, V.H.; Arellano, N.-I.T.; Serrano García, D.I.; Martínez García, A.; Rodríguez Zurita, G.; García Lechuga, L. Measurement of mean thickness of transparent samples using simultaneous phase shifting interferometry with four interferograms. Appl. Opt. 2016, 55, 4047–4051. [Google Scholar] [CrossRef] [PubMed]
- Kaewon, R.; Pawong, C.; Chitaree, R.; Lertvanithphol, T.; Bhatranand, A. Utilization of the cyclic interferometer in polarization phase-shifting technique to determine the thickness of transparent thin-films. Opt. Appl. 2020, 50, 69–81. [Google Scholar] [CrossRef]
- Flores Muñoz, V.H.; Toto-Arellano, N.I.; López-Ortiz, B.; Martínez García, A.; Rodríguez-Zurita, G. Measurement of red blood cell characteristic using parallel phase shifting interferometry. Optik 2015, 126, 5307–5309. [Google Scholar] [CrossRef]
- Usman, A.; Bhatranand, A.; Jiraraksopakun, Y.; Kaewon, K.; Pawong, C. Thickness measurement of double layer transparent material using triangular path cyclic interferometer. In Proceedings of the 2021 International Electrical Engineering Congress (iEECON2021), Pattaya, Thailand, 10–12 March 2021; pp. 233–236. [Google Scholar]
- Kanseri, B.; Kandpal, H.C. Mathematical formulation for verification of the Fresnel and Arago interference laws using a Mach-Zehnder interferometer. Optik 2010, 121, 1019–1026. [Google Scholar] [CrossRef]
- Keawon, R.; Bhatranand, A.; Jiraraksopakun, Y.; Siwapornsathain, E.; Chitaree, R. Generation of the rotating linearly polarized light using the triangular cyclic interferometer. In Proceedings of the 29th International Technical Conference on Circuit/Systems Computers and Communications (ITC-CSCC), Phuket, Thailand, 1–4 July 2014; pp. 546–549. [Google Scholar]
- Pawong, C.; Kaewon, R.; Chitaree, R.; Bhatranand, A. Measurement of phase retardation in a liquid crystal variable wave retarder using a polarizing triangular interferometer. In Proceedings of the 15th International Conference on Optical Communications and Networks, Hangzhou, China, 24–27 September 2016; Volume 2, pp. 2–4. [Google Scholar]
- Sengupta, C.; Sarkar, S.; Bhattacharya, K. Common path polarization phase-shifting interference microscope for surface profilometry. Opt. Eng. 2020, 59, 073102-1–073102-8. [Google Scholar] [CrossRef]
- Sarkar, S.; Ghosh, N.; Chakraborty, S.; Bhattacharya, K. Self-referenced rectangular path cyclic interferometer with polarization phase shifting. Appl. Opt. 2012, 51, 126–132. [Google Scholar] [CrossRef] [PubMed]
- Kaewon, R.; Pawong, C.; Chitaree, R.; Bhatranand, A. Polarization phase-shifting technique for the determination of a transparent thin film’s thickness using a modified Sagnac interferometer. Curr. Opt. Photonics 2018, 2, 474–481. [Google Scholar]
Publisher’s Note: MDPI stays neutral with regard to jurisdictional claims in published maps and institutional affiliations. |
© 2021 by the authors. Licensee MDPI, Basel, Switzerland. This article is an open access article distributed under the terms and conditions of the Creative Commons Attribution (CC BY) license (https://creativecommons.org/licenses/by/4.0/).

