Article

Proposal for a Skin Layer-Wise Decomposition Model of Spatially-Resolved Diffuse Reflectance Spectra Based on Maximum Depth Photon Distributions: A Numerical Study

1
CRAN, BioSiS Department, Université de Lorraine-CNRS, F-54000 Nancy, France
2
Department of Plastic, Aesthetic and Reconstructive Surgery, Metz-Thionville Regional Hospital, F-57530 Ars-Laquenexy, France
*
Author to whom correspondence should be addressed.
Photonics 2021, 8(10), 444; https://doi.org/10.3390/photonics8100444
Submission received: 27 August 2021 / Revised: 25 September 2021 / Accepted: 12 October 2021 / Published: 14 October 2021
(This article belongs to the Special Issue Tissue Optics)

Abstract

:
In the context of cutaneous carcinoma diagnosis based on in vivo optical biopsy, Diffuse Reflectance (DR) spectra, acquired using a Spatially Resolved (SR) sensor configuration, can be analyzed to distinguish healthy from pathological tissues. The present contribution aims at studying the depth distribution of SR-DR-detected photons in skin from the perspective of analyzing how these photons contribute to acquired spectra carrying local physiological and morphological information. Simulations based on modified Cuda Monte Carlo Modeling of Light transport were performed on a five-layer human skin optical model with epidermal thickness, phototype and dermal blood content as variable parameters using (i) wavelength-resolved scattering and absorption properties and (ii) the geometrical configuration of a multi-optical fiber probe implemented on an SR-DR spectroscopic device currently used in clinics. Through histograms of the maximum probed depth and their exploitation, we provide numerical evidence linking the characteristic penetration depth of the detected photons to their wavelengths and four source–sensor distances, which made it possible to propose a decomposition of the DR signals related to skin layer contributions.

1. Introduction

Diffuse Reflectance Spectroscopy (DRS) applied to biological tissues is a widely studied [1,2,3,4], non-destructive optical characterization technique. It consists of measuring back-reflected intensity spectra carrying information from light–tissue interactions, from which the optical and structural properties of the probed medium can then be extracted and analyzed. By illuminating the tissue with a broadband light, photons propagating in the medium undergo wavelength-dependent absorption and scattering events, before some of them may move back towards the surface and potentially be captured by a spectrometric detection system. An analysis of the amplitude and shape features of the latter intensity spectrum thus gives access to information of interest such as absorption bands and elastic scattering properties related to tissue-specific chromophores and structures. Its non-invasive nature, its sensitivity to metabolic and structural changes in tissues and its clinical applicability are very well suited to in vivo biomedical diagnostics.
Spatially Resolved DRS (SR-DRS) refers to fibered systems of DRS featuring several Detection Fibers (DF) located at different distances from the Source Fiber (SF) allowing for depth-resolved acquisitions. Indeed, photons detected at a short/large source–detector (SD) distance will be associated with shallower/deeper trajectories into the biological tissues under evaluation. The literature on this subject points to numerous applications of SR-DRS such as the measurement of blood glucose levels [5,6], hemoglobin oxygen saturation [7] and for pre-cancer and cancer diagnosis: lung [8], cervix [9], colon [10], bladder [11], brain [12], breast [13], oesophagus [14] or pancreas [15]. There are also a large number of applications of SR-DRS for the in vivo characterization of cutaneous pathological states, including melanoma [16,17,18] and carcinoma [19,20], and more generally for the characterization of skin layer optical properties [21,22].
In this context of skin optical biopsy, point spectroscopy devices exploiting light–tissue interactions have been designed and used in several clinical studies [11,23,24]. The estimation of diagnostically relevant optical parameters from in vivo SR-DR spectra, and especially their evolution around the lesion, can be linked to the tissue pathological state. As the metabolic modifications associated with carcinogenesis are local, the quantitative estimation of the penetration depth of the photons detected using point spectroscopy is at stake, as reported by Breslin et al. [25], who studied the sensitivity of DR spectra to elastosis (accumulation of elastotic material in the papillary dermis located underneath epidermis). Cancer growth is also related to the enzymatic degradation of collagen fibers in the dermis leading to collagen fluorescence decrease [26] and to the decrease of Nicotinamide Adenine Dinucleotide Hydrogen (NADH) fluorescence in the epidermis [27]. Finally, morphological changes may be significant for part of skin carcinomas such as ulceration and hyperkeratosis, which are respectively characterized by a thinning or skin thickening (∼×10) of the stratum corneum superficial layer.
The need to explain DR signals acquired on the surface, resulting from light–tissue interactions in all skin layers, justifies the use of numerical simulation as a tool to interpret the acquired signals. The literature reports work by several teams using photon transport simulation in a multi-layer skin model to extract features that describe the propagation of the acquired photons [28,29]. First, in a very visual way, absorption density maps of detected photons in a three-layer skin model [30] provide information on a photon’s trajectories. In a more quantitative manner, teams have presented their results on the penetration depth of photons. In a two-layer model, histograms of probed depths have been created at 450 and 650 nm to extract the average penetration depth [31], while the interrogation depth (mean depth of all detected photon scattering events) [32] or measurement depth (median of the cumulative absorption on fluence absorption maps) [30] can also be extracted from simulation to characterize the photon’s penetration depth. Other quantities of interest are exploited to know more about the subcutaneous behavior of backscattered photons, such as the path length distribution with increasing SD distance [33,34]. This quantity was even declined in the mean partial path length [35,36], which consists of dividing the total path length into layer path contributions.
Although these approaches have made it possible to study the behavior of photons (path, depth) in different multi-layer skin models, none of them, to our knowledge, has led to the analytical formulation of an explicit decomposition of the “global” DR spectra, as a function of the SD distances and of the modeled skin layers. This is an essential issue to (i) directly interpret the measured spectra, especially in the case of clinical application and patients’ inter-individual variability in terms of epidermal thicknesses, skin type (healthy, carcinoma), phototype and blood dermal content and to (ii) indirectly estimate the optical properties of the different layers in an efficient way. In order to address this gap, the present contribution deals with the acquisition of simulated DR spectra for a multi-layer medium considering (i) the absorption and scattering of the five main endogenous chromophores (ii) on the near UV-visible range and (iii) for a geometrical model of the probe adapted to the previous wavelengths, namely SD distances smaller than a millimeter. Histograms of the maximal probed depth for photons detected at several SD distances were created and analyzed to quantify light penetration in the media. The study was led for skin media with varying parameters: epidermal thickness, phototype, dermal blood concentration and health status of the tissue (ulcerated and hyperkeratosed carcinomas). Finally, a DR signal decomposition according to the deepest layer probed is offered.

2. Materials and Methods

Section 2.1 describes the geometrical and spectral configuration of the probe, Section 2.2 provides an explanation of the numerical skin model developed, and Section 2.3 refers to the simulation description.

2.1. SR-DRS Probe—Geometrical and Spectral Features Implemented for Simulations

The geometrical and optical features of source and detection fibers implemented in our SR-DRS simulations were based on the technical characteristics of an existing device developed by our team [37], whose purpose is to assist a surgeon in establishing surgical margins during skin carcinoma resection [38]. Work with a similar goal has already been presented in the literature using DR [39] (elastic scattering) or Raman [40] (inelastic scattering) spectra. The multiple fiber optical probe of the clinical device consists of (i) one central 600 μ m-core diameter Source Fiber (SF) and numerical aperture N A S F = 0.22 delivering broadband 365–765 nm white light illumination to the tissue in contact and (ii) 24,200 μ m core diameter detection fibers (DF) of N A D F = 0.22 each, equally distributed on 4 concentric circles corresponding to the 4 SD center-to-center distances D n ( n { 1 , . . . , 4 } ) from 400 to 1000 μ m by 200 μ m steps. The photons reaching each of the six collection fibers of the D n distance are merged to constitute the diffuse reflectance signal D R D n ( λ ) . To maximize the signal to noise ratio in the simulation, cylindrical symmetry was exploited using a ring detection surface before multiplying the quantity by a factor that ensures the geometrical correspondence with the clinical device. Complementary simulations were conducted to quantify the error related to this geometric approximation (detailed results not shown). In the “worst” case—i.e., for small SD distances—the relative error was less than 0.5%. A schematic representation of the acquisition geometry is shown in Figure 1, while the numerical values of the different parameters used are summarized in Table 1. The optical probe geometrical configuration considered in our simulation does not take into account the epoxy resin and the polished stainless steel in which optical fibers (whose core and cladding are made of silica) are embedded in the clinical device. As mentioned by Zelinskyi et al., this may limit the accuracy of the results obtained [41].

2.2. Skin Five-Layered Model

2.2.1. Layer Thicknesses and Skin Types Modeled

The numerical model mimicking the skin was designed following a five planar multi-layered medium, representing (from superficial to deepest layers) the stratum corneum (1-SC), the living epidermis (2-LE), the papillary dermis (3-PD), the reticular dermis (4-RD) and the subcutaneous fat (5-SF). The total thickness was fixed to z t o t = 6120 μ m, while the total radius of the simulation medium was set to r t o t = 3000 μ m. The results presented hereafter are valid under the assumption that the optical properties of each of the skin layers are homogeneous in the cylinder thus described (cf. Figure 1). Considering the order of magnitude of skin optical properties and the position of the the farthest collecting fiber ( D 4 = 1000 μ m), edge effects (i.e., photons that would be collected by DF after reflection on the side or bottom border of the medium) were negligible. This was verified numerically with absorption maps of detected photons: none of them reached the bottom (in the worst case—i.e., a wavelength in near IR, great SD distance and fair phototype—only 1% of detected photons were scattered in the SF), while less than 0.1% were collected after having reached the side border.
Consequently, five combinations of SC and LE thicknesses were defined, among which three featured a thin, medium and thick healthy epidermis and two represented some specific values encountered in carcinoma. SC and LE thicknesses may significantly vary according to age, gender, and body location [42,43,44] and also for different skin physiological states. For instance, the stratum corneum can either completely disappear or thicken 10-fold [45] in the case of ulceration or hyperkeratosis, respectively. Indeed, other epidermal layers are also affected by cell proliferation due to skin carcinoma. However, for the sake of comparison with healthy conditions, only SC thickness was varied to model these two sub-types of skin carcinomas; i.e., in the case of ulceration, the absence of SC was modeled through the removal this superficial layer. As shown in Figure 1, the thickness values of middle layers PD and RD were fixed (200 and 1800 μ m, respectively), while those of the top layers (SC and LE) were varied to simulate different tissue conditions. The thickness of the underlying SF layer was consequently adjusted to keep the total thickness z t o t of our simulation model constant. We considered the range of values of SC and LE thicknesses as well as their approximate ratio (∼1/4) reported for sun-exposed skin sites only (head including face, scalp, ear, cheek and shoulders, back, arms, back of hand and legs), which are 10–30 μ m and 60–120 μ m for SC and LE layers, respectively. The numerical values associated with the elaboration of these three healthy and two other pathological epithelium (carcinoma) simulation media configurations are summarized in Table 2.

2.2.2. Skin Optical Properties

The optical properties defined for each skin layer in terms of absorption and scattering are synthesized in the following paragraphs. Complementary details can also be found in [46].

Absorption Properties

Absorption coefficients μ a k ( λ ) were defined for each layer k { 1 , . . . , 5 } of the numerical skin model taking into account the contribution of the five main endogenous absorbers i of human skin, which are blood (decomposed in oxygenated hemoglobin H b O 2 , deoxygenated hemoglobin H b , and bilirubin contributions), water, melanin (decomposed in eumelanin and pheomelanin), lipids and β -caroten, respectively, as well as their volume fraction f v , i k , in the mixture. A residual absorption baseline was also added according to [47] (cf. μ a , b a s e in Equation (1)). Thus, the total absorption coefficient of a skin layer was defined as the sum of the latter baseline and the contributions μ a , i k of each of the five chromophores, weighted by their respective volume fraction, in accordance with [48]:
μ a k ( λ ) = μ a , b a s e ( λ ) + f v , b l o o d k [ γ μ a , H b O 2 k ( λ ) + ( 1 γ ) μ a , H b k ( λ ) + μ a , b i l i r u b i n k ( λ ) ] + f v , w a t e r k μ a , w a t e r k ( λ ) + f v , m e l k [ μ a , e u m k ( λ ) + μ a , p h e k ( λ ) ] + f v , l i p i d s k μ a , l i p i d s k ( λ ) + f v , β c a r o t e n k μ a , β c a r o t e n k ( λ )
where μ a , i k are all expressed in cm 1 , μ a , b a s e ( λ ) = 7.84× 10 8 × λ 3225 ( λ in nm), and γ is the ratio between H b O 2 and H b , set to γ = 0.9 in our simulations. Lipids and water absorption spectra as well as extinction coefficients of the other compounds were directly implemented in our model from [49]. It is noticeable that, for β -caroten and blood (namely both hemoglobins and bilirubin), molar extinction coefficient ϵ i m o l ( λ ) (in cm 1 /mol·L 1 ) was given, while for melanin, the mass extinction coefficients ϵ i m a s s ( λ ) (in cm 1 /g·L 1 ) of eu- and pheo-melanin were provided. These are linked to absorption coefficients according to the following formulas:
μ a , i k ( λ ) = ϵ i m o l ( λ ) M i c i k μ a , i k ( λ ) = ϵ i m a s s ( λ ) c i k
where c i k is the mass concentration (in g/L) of chromophore i in the mixing model and M i the respective molar weight with the following values implemented in our simulations:
M β C a r o t e n = 587 g · mol 1 M b i l i r u b i n = 585 g · mol 1 M H b O 2 , H b = 66 , 500 g · mol 1
In order to take into account skin pigmentation-related absorption variations, four different melanosome volume fraction values in the LE layer were used to simulate very light skin (phototype I) to dark skin (phototype IV) types. Considering our targeted clinical application of interest, it was chosen to firstly consider a melanosome volume fraction f v , m e l 2 = 0.01 , corresponding to phototype I, which is much more prone to the development of skin carcinomas. In Section 3.2.3, darker skins are considered. The correspondence between phototypes and volume fractions of melanosome, adapted from [50], is summarized in Table 3.
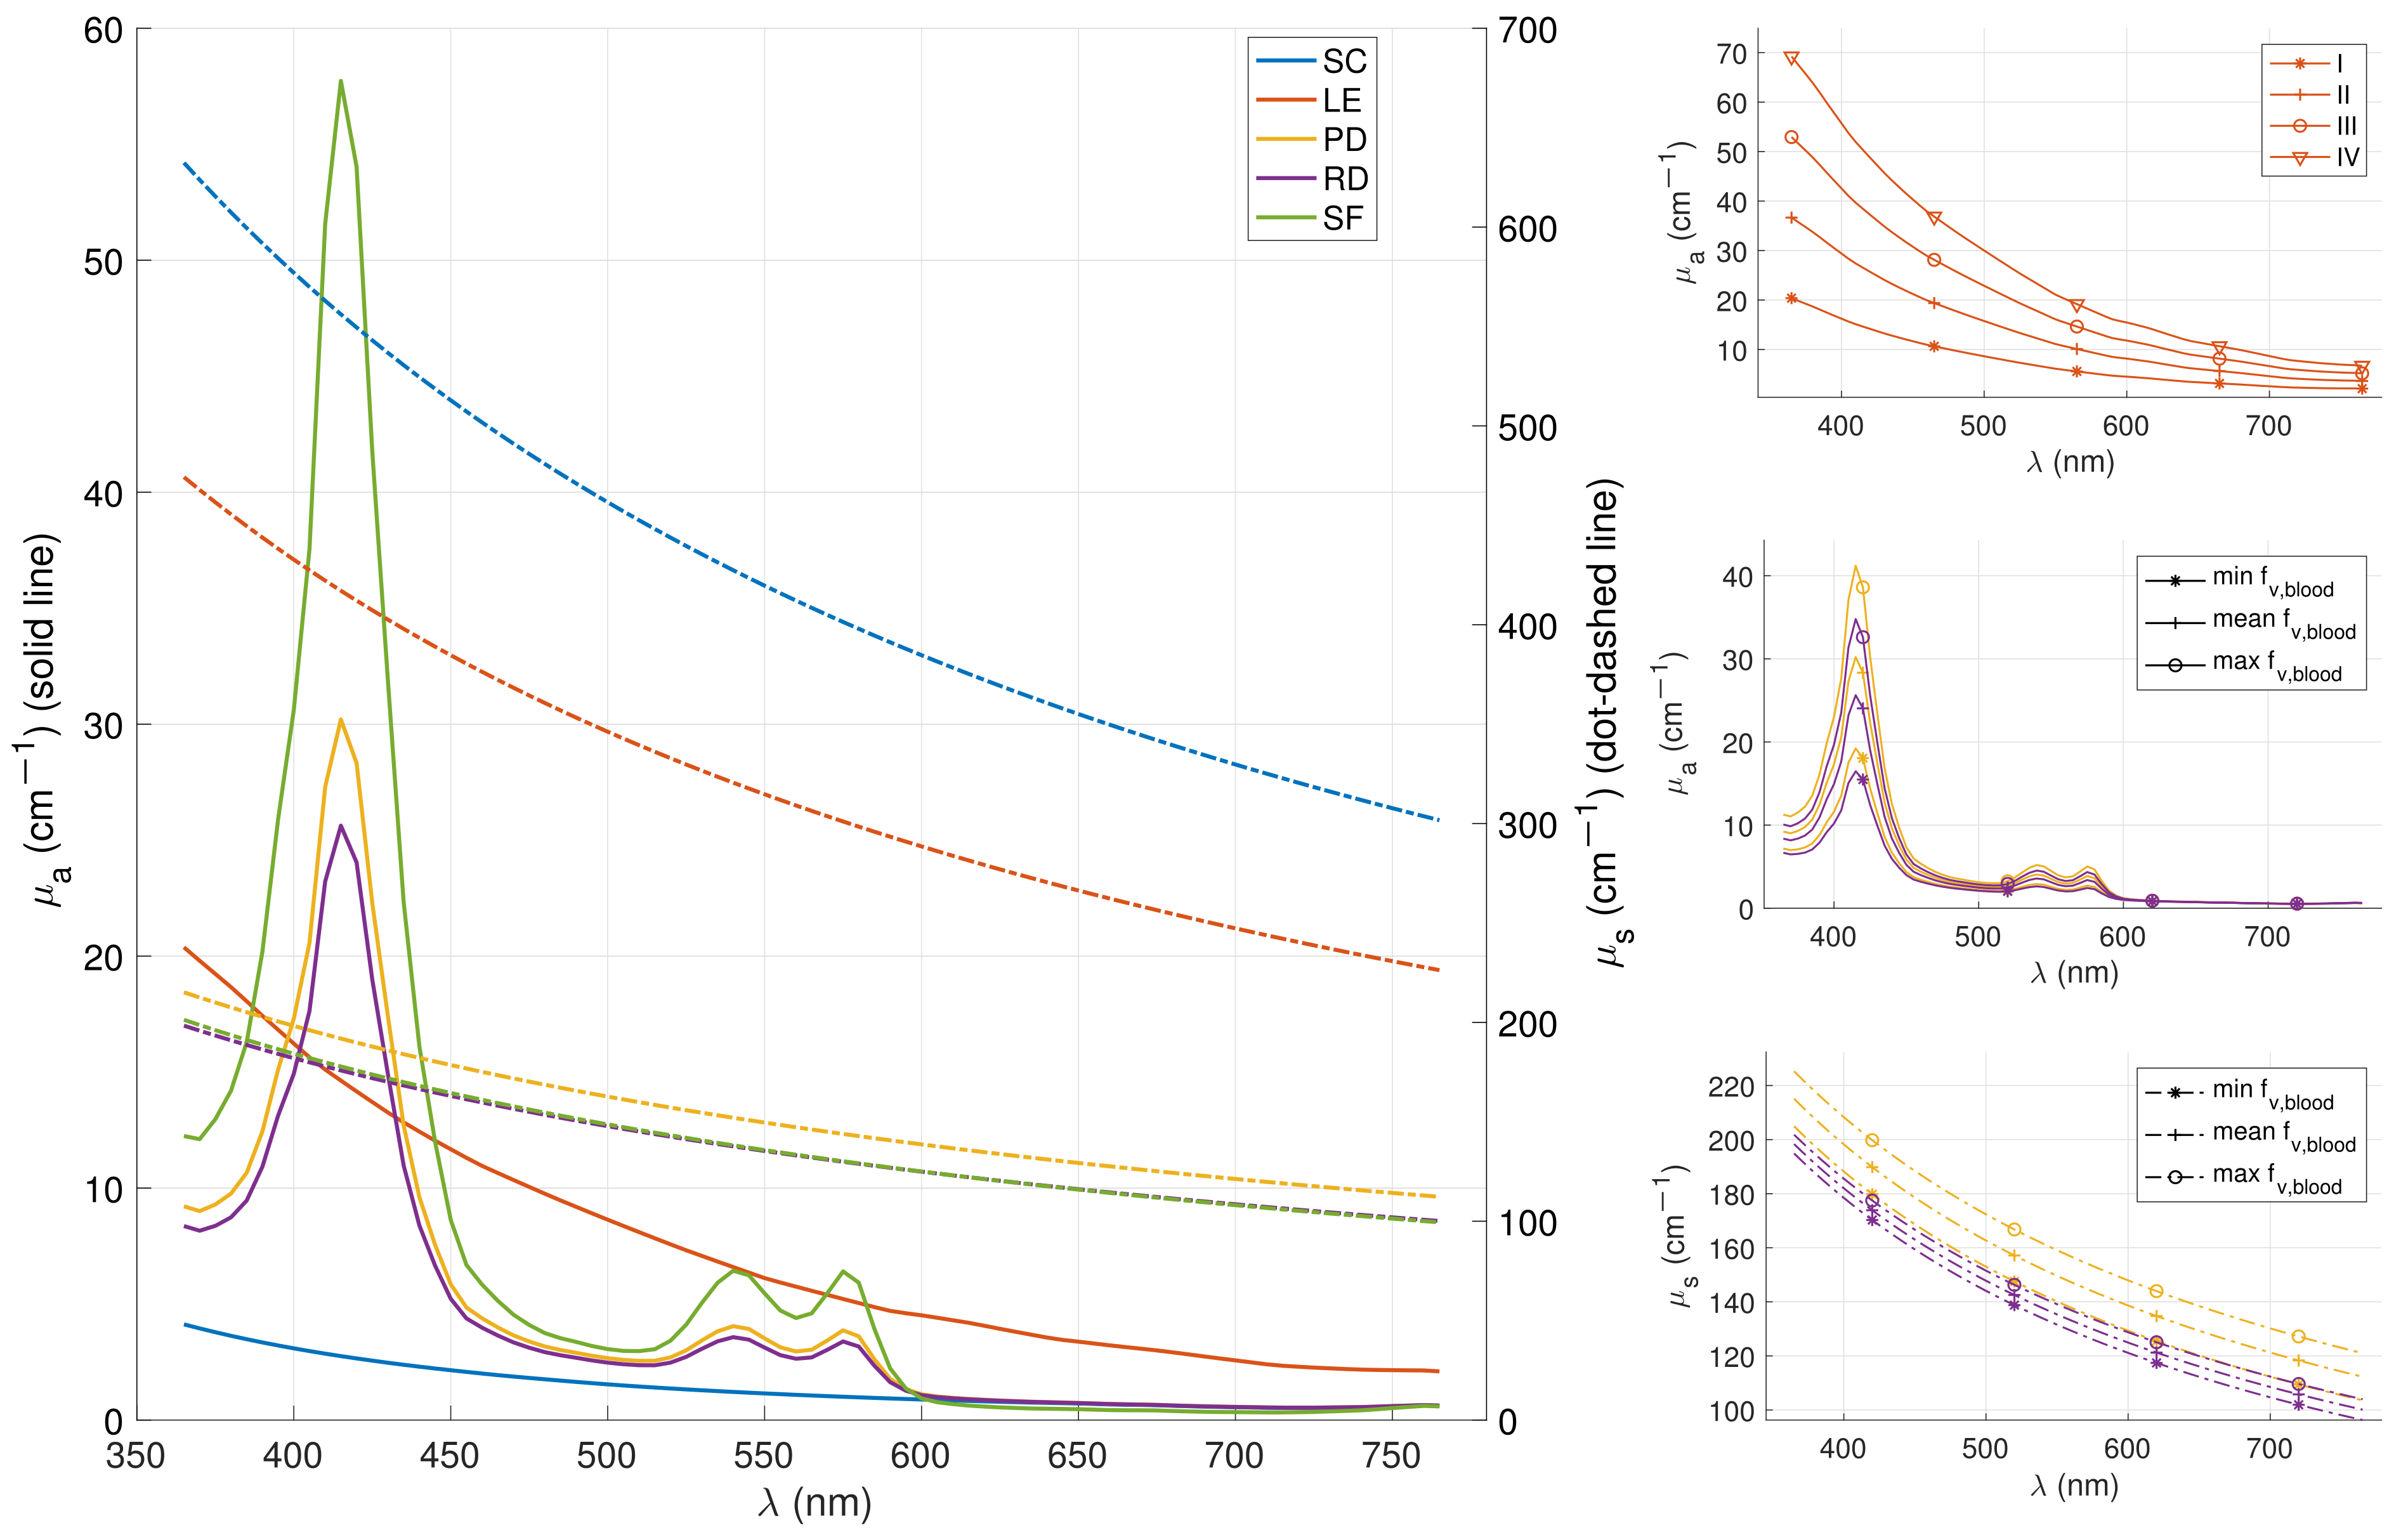
In our skin model, this parameter only influences the LE absorption coefficient, but its impact is significant. The absorption spectra resulting from the different calculations are finally shown in Figure 2. The top right subplot focuses on the absorption coefficient of LE.
Similarly, the impact of the amount of blood in the dermal layers, modified by the volume fraction of blood f v , b l o o d 3 and f v , b l o o d 4 , was considered as an additional parameter of interest [51]. Simulations were then conducted for three pairs of blood volume fractions to represent three media; respectively, weakly, moderately and strongly vascularized. The numerical values of these configurations are shown in Table 4. Here again, the couple of mean values—i.e., f v , b l o o d 3 = 0.024 and f v , b l o o d 4 = 0.02 —was used for all simulations, except in Section 3.2.4, which focuses on this blood amount effect.
This variation influences mainly the absorption coefficient of the two dermal layers (cf. Equation (1)) but slightly influences the scattering coefficient (cf. Equation (3)). The optical parameters of these three couples are then isolated in the middle-right ( μ a 3 and μ a 4 ) and bottom-right ( μ s 3 and μ s 4 ) subplot of Figure 2.
The values of the volume fraction and mass concentration of each chromophore applied in every layer of our numerical model are summarized in Table 5. They were chosen following (i) a literature review [47,49,52,53] and (ii) comparisons between simulated spectra and experimental data acquired in clinics [38] (see Figure 3) using our SR-DRS device [37].

Scattering Properties

The values of skin scattering coefficients μ s k ( λ ) , expressed in cm 1 in the various layers of our model, were obtained with Equation (3) given from [53] featuring two contributions: a blood scattering component and a bloodless “base” scattering component, such that
μ s k ( λ ) = ( 1 f v , b l o o d k ) μ s , 577 k 577 λ + f v , b l o o d k μ s , b l o o d ( λ ) ( 1 + a ( 0.5 μ s , b l o o d ( λ ) d v e s s e l s k ) b
In this first term, μ s , 577 k stands for the scattering coefficient value at 577 nm of the kth layer, and λ in the denominator is in nm. For the second term, μ s , b l o o d ( λ ) is the scattering coefficient of pure blood in cm 1 [49]. Moreover, we set a = 1.007 and b = 1.228 [53], while d v e s s e l s k is the mean vessel diameter of the layer, expressed in cm. The numerical values of the parameters implemented in our simulation are summarized in Table 5, and the corresponding scattering spectra μ s k ( λ ) used in our model are presented for each layer in Figure 2.

Other Optical Parameters

Both the anisotropy factor g and refractive index n were considered as wavelength-independent in our spectral range of study. For example, concerning near UV wavelengths, this assumption results in a maximum relative error of respectively 3% and 1.5% for the LE and two dermis layers [54]. The values of the former were set to g 1 = 0.92 , g 2 = 0.75 , g 3 = 0.72 , g 4 = 0.72 and g 5 = 0.9 for each of the five layers [55], while the second values were set to n 1 = 1.55 , n 2 = 1.44 , n 3 = 1.39 , n 4 = 1.38 and n 5 = 1.34 in each of the five layers, respectively [52].

2.3. Simulation Configuration, Method and Tools

2.3.1. Simulation Parameters Description

The simulation algorithm developed was based on the CudaMCML code from Alerstam et al. [56]. It was modified to consider the probe geometrical configuration mentioned in Section 2.1. Multi-thread calculations were performed on a DELL T630 device using the Intel Xeon E5-2683v4 2.1 GHz, AVX CPU and the GEFORCE GTX 1080 Ti GPU card cluster available within the High Performance Computing resources center “Explor” at the University of Lorraine. Technical aspects of the simulation are summarized in Table 6. The computation time Δ T s i m was different for the media simulated within an interval of 900–1500 s. This duration corresponds to the launch of the 10 8 photons repeated for each of the 81 wavelengths used to build a DR spectrum between 365 and 765 nm with a spectral step of Δ λ = 5 nm. This value was chosen to satisfy the best compromise between calculation time and the spectrum appearance. Ten simulations with 10 8 photons were performed to quantify the trial by trial fluctuation for the the healthy mean epidermal thickness medium of phototype I (see Section 3.1). This led to the conclusion that the relative error in DR spectra compared to the average of the 10 simulations was less than 0.5% in the worst case; i.e., when the least photons are detected, in the hemoglobin absorption peak (415 nm) at the D 4 SD distance. The spatial resolutions according to radial distance and depth were respectively set to d z = 5 μ m and d r = 10 μ m. Finally, concerning the photon packet stopping criteria, the weight threshold was set to w t h = w 0 × 10 4 , with w 0 the initial photon packet weight, while the time of flight threshold was established at t t h = 1 s.
Details of the photon propagation algorithm and detection conditions are presented in our previous work [46]. The changes introduced to the original code [56] allow for the acquisition of simulated spectra D R D n ( λ ) , the unit of which is the photon ratio, comprised of photons that have reached the DF located at distance D n .

2.3.2. Probed Depth Histograms

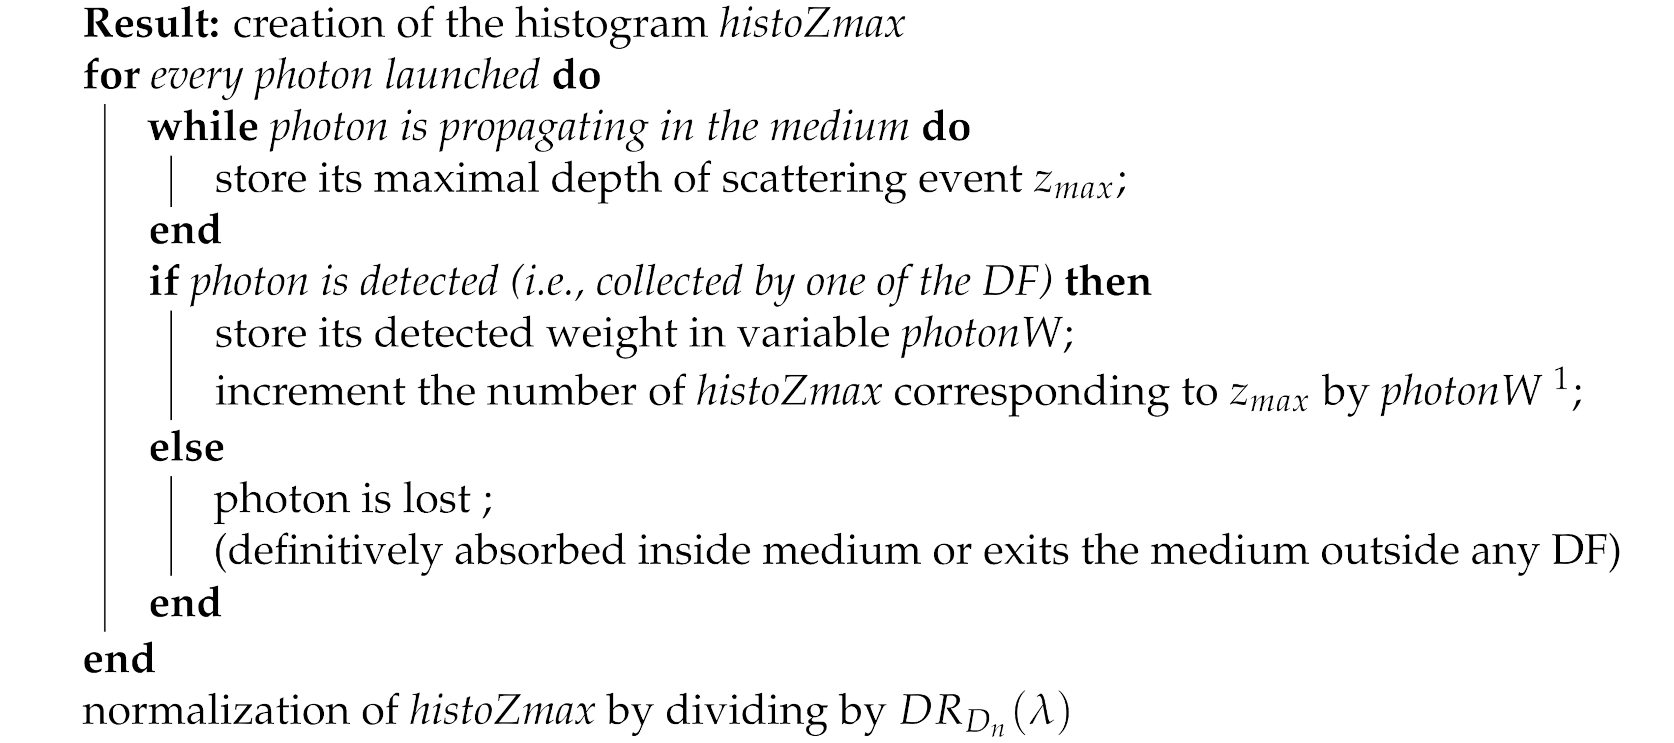
Probed depth histograms were determined to enable the quantitative analysis of the detected photon penetration depth. The algorithm that allowed us to obtain the latter data set is presented below. It can be applied at a given D n distance and at a given wavelength λ .
The normalization line in Algorithm 1 was implemented to eliminate the signal level and thus allow for a proper comparison between histograms of different SD distances. The occurrence of histograms is then relative. A very similar approach was presented by Arifler et al. [31] and applied to resolve spectral information from epithelium and stroma layers in SR-DR spectra. The histogram created here has the particularity of considering the deepest coordinate of the trajectory of the detected photon. This can be associated with the deepest scattering event or to a reflection event between two consecutive layers.
Algorithm 1: Maximum depth histogram of weighted detected photons
Photonics 08 00444 i001
1 Here, the maximal depth z m a x is discretized to allow the design of the histogram. The width of the length interval is the spatial resolution in depth i.e., d z = 5 μ m.

3. Results and Discussion

Results of DR spectra and probed maximum depth distribution graphs are detailed in Section 3.1 for the healthy skin model with an intermediate thickness, mean dermal blood content and very fair phototype. Then, Section 3.2 focuses on the effect of the epidermis thickness, pathological state, phototype and dermal blood content on photon propagation. Based on these results and their analysis, a quantitative decomposition of the DR signal is then proposed in Section 3.3.

3.1. Detailed Results for Healthy Skin Model with Intermediate Thicknesses

3.1.1. SR-DR Simulated Spectra

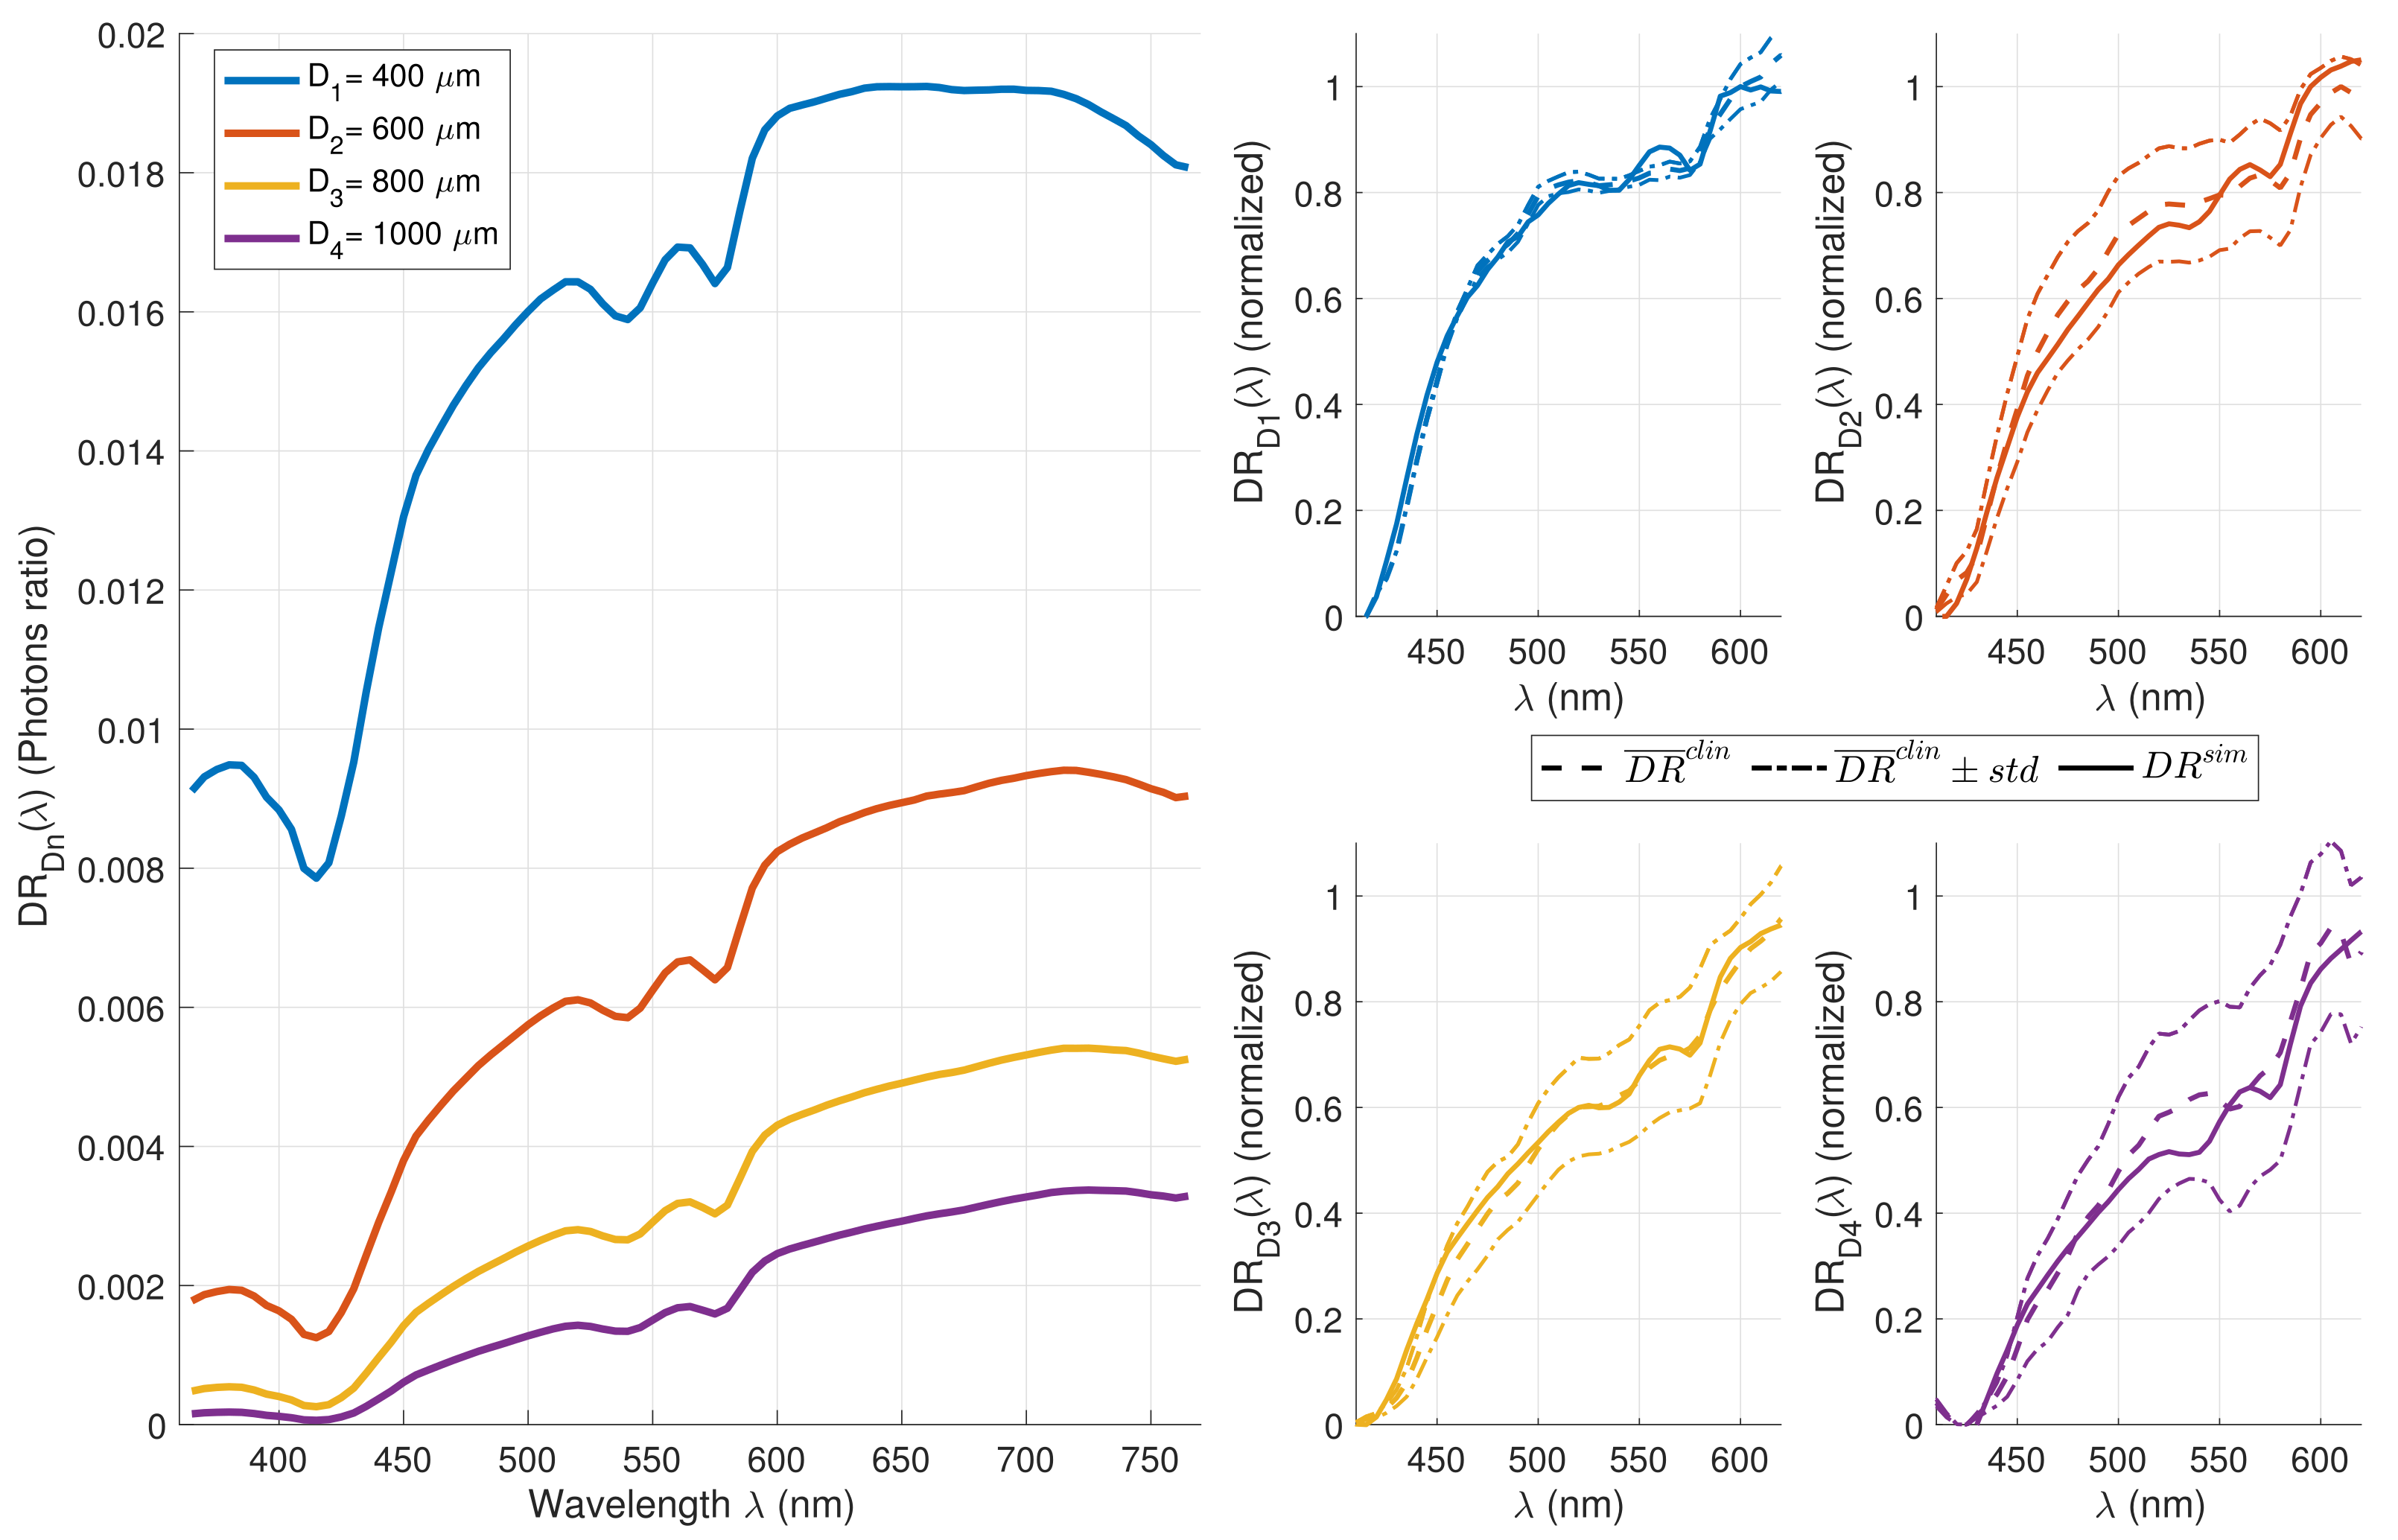
Figure 3 (left) shows the DR spectra simulated for a model configuration corresponding to healthy skin of intermediate thickness (cf. Table 2), intermediate blood content (cf. Table 4) and phototype I (cf. Table 3) at each SD distance. DR intensity tends to increase toward the red spectral range due to the lower opacity of the near-infrared (near IR) wavelengths. Local minimums at 415, 540 and 575 nm correspond to hemoglobin absorption.
Figure 3 (right) shows the superposition of the normalized simulated spectra and the clinical spectra for each SD distance. Each of the subplots is composed of the the average clinical spectrum of three acquisitions D R ¯ c l i n (dashed line) of this same quantity, to which we added the standard deviation (dash-doted line) and finally the simulated spectrum (continuous line), for which model parameters (epidermal thickness, phototype, dermal blood content) were determined by inverse problem solving to fit clinical data. Those experimental DR spectra was acquired on the anterior skin surface of a patient’s wrist. This skin site was clinically considered as healthy by the plastic surgeon in charge of the patient’s inclusion in the SpectroLive clinical trial (ClinicalTrials.gov Identifier: NCT02956265) approved by the Institutional Board for Ethics and Patients Safety (CPP Est III authorization: 16.06.03) and by the French National Agency for Medicines and Health Products Safety (ANSM authorization: DMDPT-RIAL/MM/2016-A00608-43). Comparing spectra from a MC simulation with clinical spectra is not an easy task [57]; thus, both sets of spectra were normalized (i.e., we set the minimum value to 0 and the maximum value to 1 in the 400–650 nm exploitable spectral band). The fitting between acquired and simulated spectra partly asserts the validity of the numerical skin model and more generally the fidelity of the simulation. A more complex skin model including skin intrinsic fluorophore absorption and emission would be interesting to increase the level of media accuracy, even if, for the considered spectral band, their influences seems to be negligible in comparison with other considered chromophores.

3.1.2. Depth Histogram and Exploitation

Depth Histogram

Quantitative information is presented in Figure 4 to describe and analyze the maximum penetration depth of the detected photons. The normalized y-axis of the histograms is the percentage of occurrence of detected photons for a given SD distance. The presence of abrupt transitions is noticeable in the histograms corresponding to a refractive index mismatch (i.e., reflection) between consecutive layers, represented by a black vertical line. Finally, a box-plot approach was chosen to extract a characteristic probed depth associated with the couple ( λ , D n ) . Thus, the three vertical colored lines for each of the histograms represent, from left to right, the first quartile (dotted) z q 1 , the median (solid line) z m e d and the third quartile (dotted) z q 3 . The colored area under the histogram, between the two quartiles, then represents 50% of the total area. In other words, half of the photons contributing to the D R D n ( λ ) value have reached at most a depth between z q 1 and z q 3 . For the considered wavelength—i.e., λ = 565 nm—a large part of the detected photons traveled through LE and RD for the shortest and the longest distance, respectively. For the second and third distance, the maximum penetration depths of detected photons are distributed between those layers; i.e., in the PD layer. A shorter distance would be of interest for this wavelength to focus on superficial SC and LE layers.

Extraction of a Typical Probed Depth and Spectral Behavior

The histograms presented in Figure 4 are available at all wavelengths and for each of the four SD distances, from which the median and quartiles of the maximal penetration depth can be calculated. The choice to synthesize our depth histograms using a box-plot approach rather than the mean penetration depth [31] of these histograms is justified by its simplicity of interpretation from the point of view of the resulting DR signal. Indeed, by considering the signal captured for the pair ( λ , D n ) , we can decompose it into four equal contributions of different depths, for which the quartiles and medians represent the boundaries. Moreover, the interquartile range gives a good idea of the depth spread of the photons around the median, thus illustrating the enlargement of the probed volume in the three-dimensional medium.
Other alternatives were developed to extract a penetration depth for collected photons in SR-DR spectroscopy. In their study [32], Tseng et al. introduce a quantity called “interrogation depth”, defined as the z average of all detected photon scattering events in a two-layer skin model. The photon penetration was not the main focus of their study, but the paper revealed that their SD distances in a range of 1440–2880 μ m allow researchers to probe between 293–949 μ m within the 550–860 nm wavelength region. Other teams have adopted an original and experimentally transposable technique to extract a sampling depth Z S in a mono-layer medium defined by its thickness Z 0 and its optical coefficients μ a and μ s = μ s ( 1 g ) . This approach consists of varying Z 0 from 0 to a sufficiently large thickness so that it no longer has any impact on the DR signal. For a very thin thickness, photons escape through the bottom of the layer, which is responsible for a very weak signal. Thickening the medium allows more photons to reach the DF, until it becomes wide enough to converge to a maximum (semi-infinite medium). Z S is then defined as the thickness at which the DR signal reaches 50% of its final maximum value [58,59]. Unfortunately, this method can not be employed for multi-layered tissue. Finally, the depth measurement can be defined as the median of the cumulative absorption of fluence absorption maps. This was applied in the study by Arimoto et al. [30] for a three-layer skin medium considering the water absorption and scattering in the near IR spectral range.
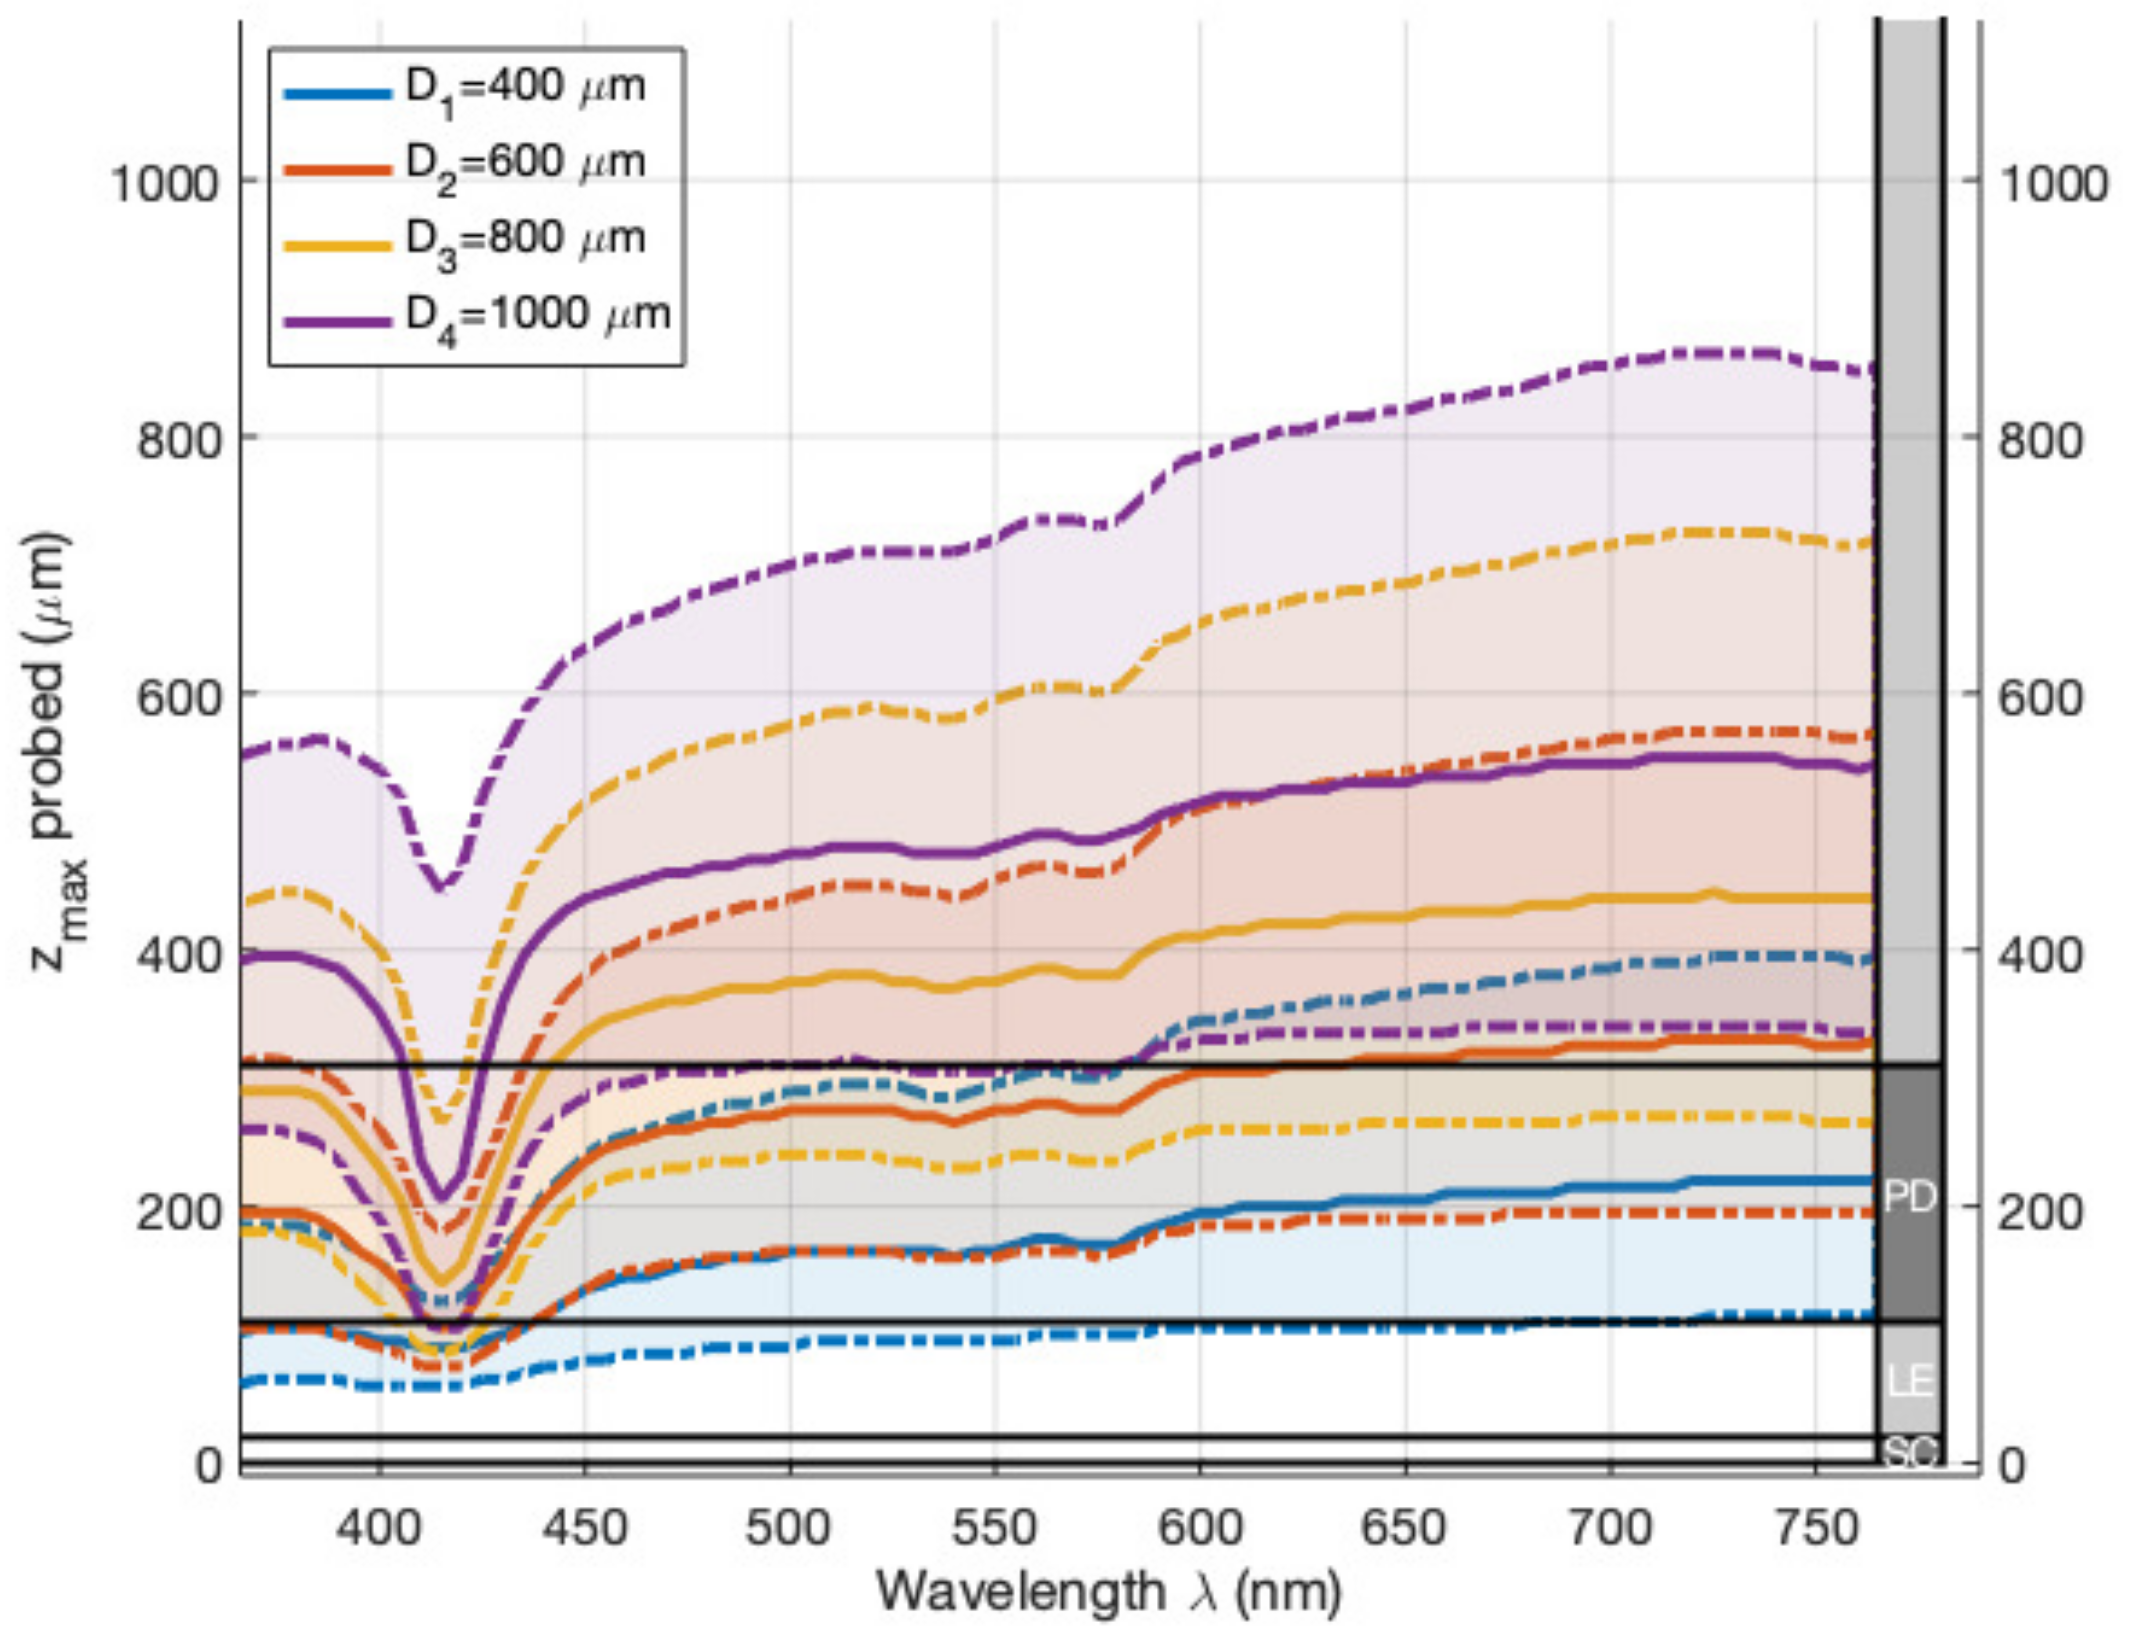
The results obtained from our box-plot approach from maximum depth histograms are presented in Figure 5, with the same graphic conventions (cf. Figure 4). The quasi-linearity of the probed depth can be seen as a function of the two varying parameters—i.e., the SD distance and the wavelength—except at the first hemoglobin absorption peak (415 nm). More importantly, it can be noticed that by choosing a couple ( λ , D n ) , it is possible to probe depths in a range of values covering the interval 50–900 μ m. Moreover, one can read in that work that the photons that contributed to the spectrum D R D 4 ( λ ) and verified λ > 450 nm mostly visited the RD layer. On the other hand, it is visible that the photons of D R D 1 ( λ ) satisfying λ < 450 nm remained globally confined in SC, LE and PD layers. One can also observe that the inter-quartile range widens when λ increases for all distances D n . Indeed, the probed volume is very localized for the near UV wavelengths and spreads when it approaches the near IR.

3.2. Analysis of Spectral and Probed Depth Data Related to Medium Configuration

3.2.1. Epidermis Thickness Modifications in Healthy Skin Model

Some studies have focused on the impact of the thickening of the most superficial skin layer on DR spectra acquisition in a skin multi-layered medium [60]. Among them, six levels of epidermis thickness in the range of 0–500 μ m have been tested in the three-layer model (epidermis and two dermal layers) [36], leading to the conclusion that its impact on the simulated spectra is very significant. In [61], the authors quantified the accuracy of estimating the optical properties of the upper and lower layers in a bi-layer medium when the thickness of the most superficial layer varies. Thus, they showed that the accuracy of estimation of the upper (respectively lower) layer increases (decreases) when the thickness of the surface layer increases over the range 0–1000 μ m. However, those studies do not show an evolution of the probed depth with the thickening of the superficial layer(s). The skin model configurations considered in this section are those described in Table 2. For the sake of conciseness and clarity, only the DR spectra and the graphs of probed depths are presented (see Figure 6), where only the median of the maximum depth value is shown for each of the media (quartiles are not shown).
By looking at the DR spectra, it is noteworthy to state that (i) at D 1 , the amplitude of the DR spectrum for the maximum thickness of the epidermis is (for 365–450 nm and 650–765 nm spectral ranges) greater than that for the minimum thickness of the epidermis, while (ii) along with longer SD distances, the amplitude of the DR spectra for the maximum thickness of the epidermis tends to be lower than the one for the minimum thickness of the epidermis. If we observe the probed depth at D 1 for the thickest epidermis model, we notice that most of the photons verify λ < 550 nm, wgucg contributes to D R D 1 ( λ ) remaining confined in SC and LE layers. For the thinnest epidermis model, those photons largely visited the PD layer. The D R D 1 ( λ ) spectra evolution for the different thicknesses may be related to the high scattering capacity of the SC and LE layers at the origin of a short path length return of many photons to the surface (and thus captured at D 1 ). Indeed, the figure of the probed depths shows the well-known fact [62] that, in general, the increase of the SD distance forces photons to dive deeper in the medium: the superficial back-scattering effect is no longer observed. Finally, we can notice that the wide spectral range of the excitation light and the geometry of the device (SD distances available) allow us to probe different depths without redundancy, and this is true for every epidermal thickness.
As indicated in Section 2.2, both dermal layers (PD and RD) were considered of fixed thickness. This choice results from a preliminary study in which the impact of the dermal thickness was considered secondary in comparison with the other parameters that we vary in this paper. As we have treated the impact of the epidermal thickness, we obtained results for three pairs ( z 3 = 150 ; z 4 = 1600 ) , ( z 3 = 200 ; z 4 = 1800 ) , ( z 3 = 250 ; z 4 = 2000 ) μ m of PD and RD thicknesses, respectively, representing minimum, mean and maximum dermal thicknesses. The DR and maximal probed depth appear in Figure 7. It can be noticed that the impact of this parameter on the signal (left) and on the detected photon penetration (right) is very small (variations smaller than 2% in DR for D 1 and for λ > 600 nm).

3.2.2. Epidermis Modifications in Healthy and Pathological Skin Models

We present in Figure 8 the DR spectra obtained for skin models simulating two types of cutaneous carcinoma: ulcerated and hyperkeratosed (cf. Table 2). By way of comparison, the healthy medium of average thickness also appears in the various results.
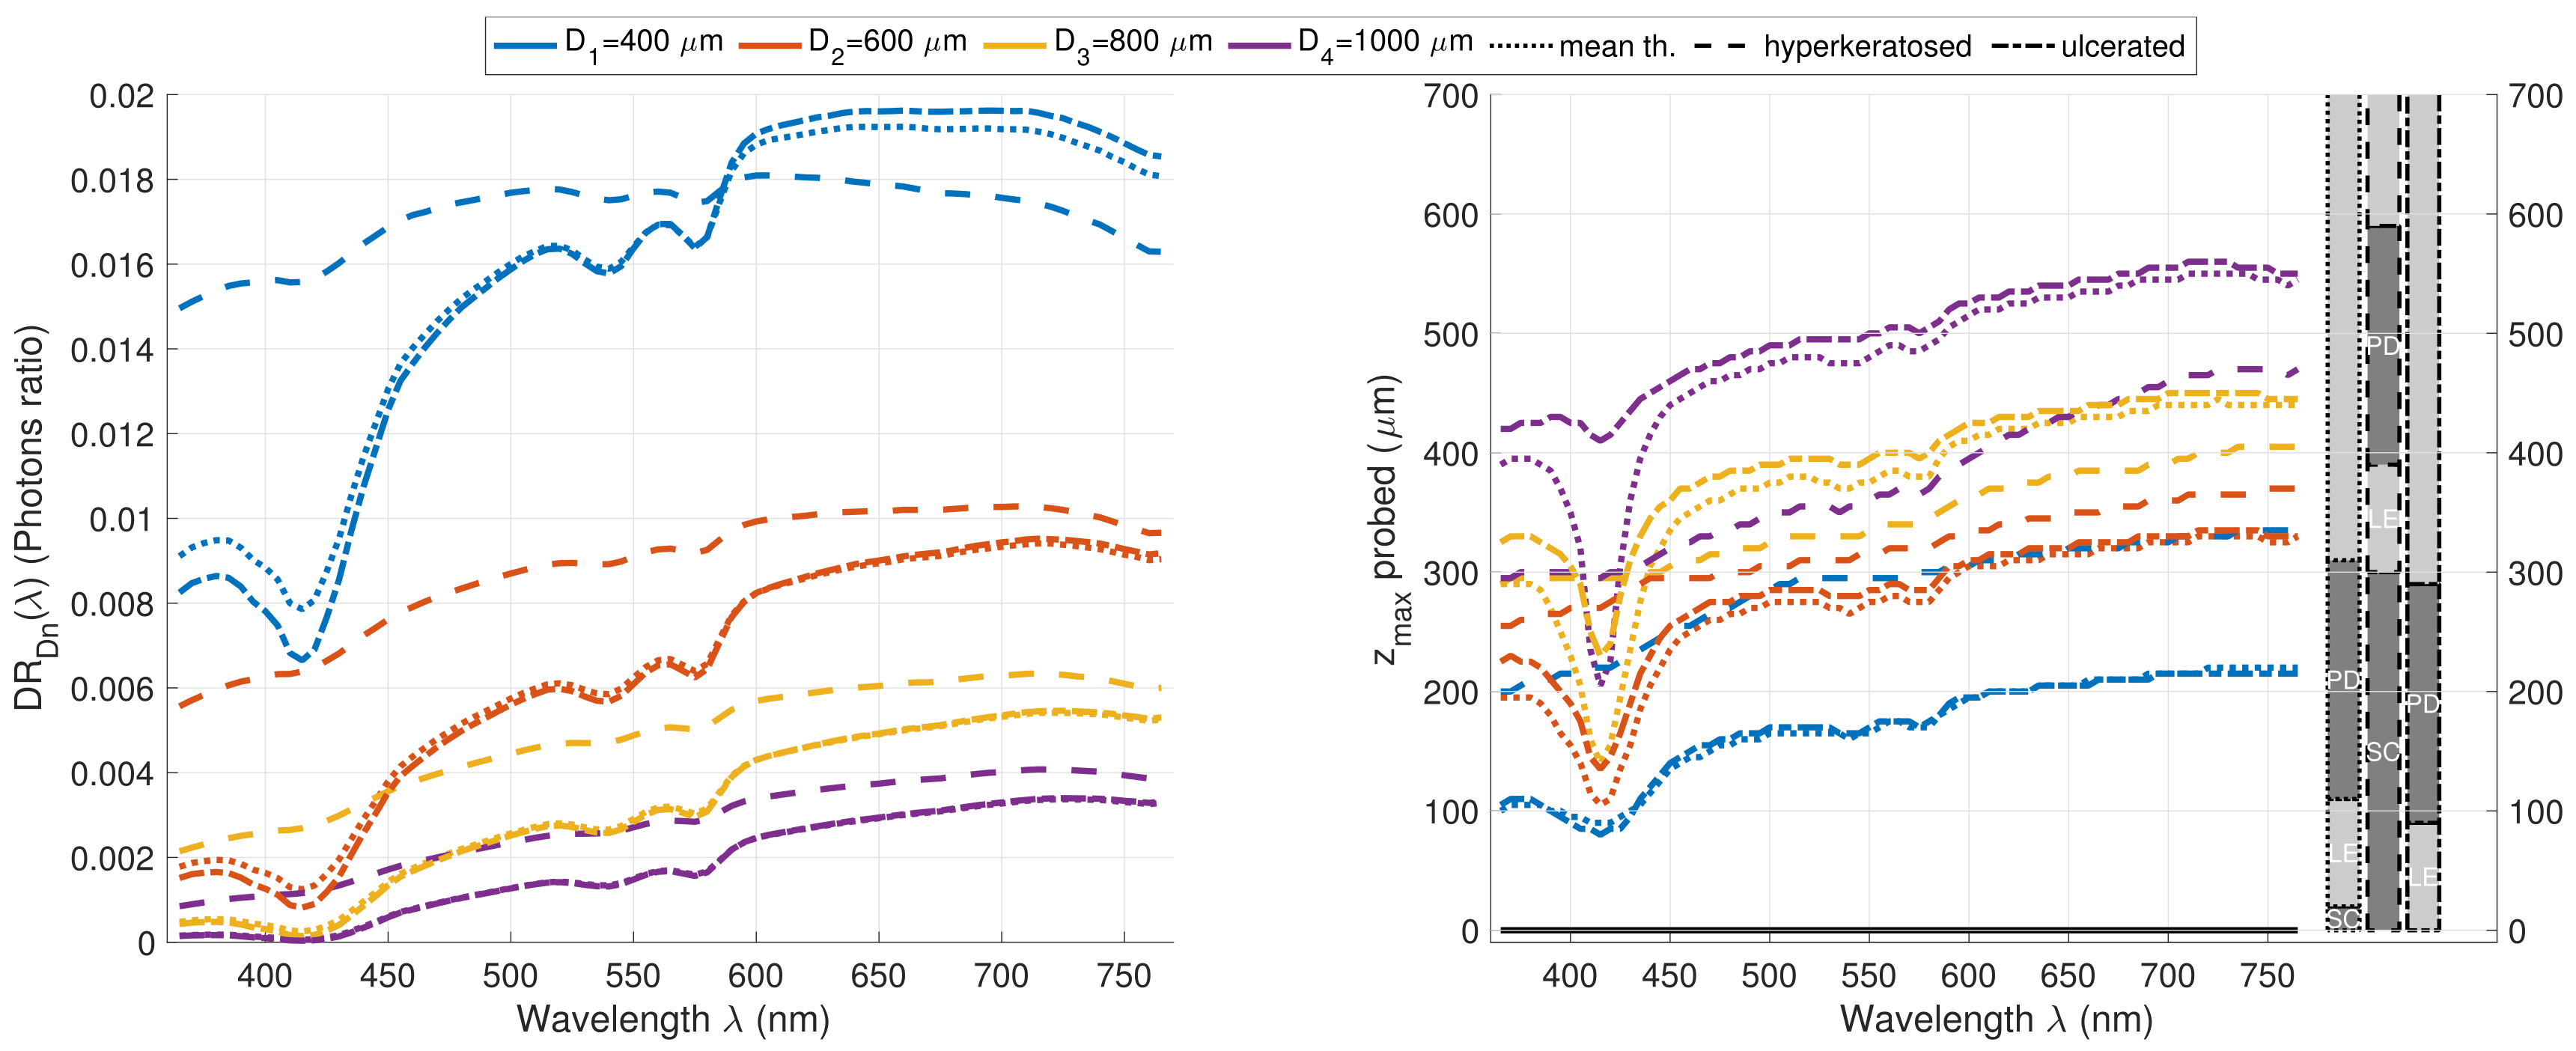
DR spectra for healthy and ulcerated skin models are very similar; i.e., they are identical for D 2 , D 3 and D 4 . Slight distinct amplitudes are observed at D 1 but with a globally identical spectral shape. Indeed, the disappearance of the SC layer, which differs from both, can be seen as an overall decrease in the thickness of the epidermis z E p i = z 1 + z 2 . The back-scattering effect for D 1 is thus more important when z E p i is greater (healthy medium) than when it decreases (ulcerated medium). The associated signal increases and then fades when the SD distance increases.
Unlike healthy as well as ulcerated skin models, the results obtained for the hyperkeratosis model show that the majority of photons detected, whatever the SD distance, remained confined in SC (for D 1 and D 2 ) and LE (for D 3 and D 4 ). This information is confirmed by the shape of the DR spectra, since the dermal hemoglobin signature (pits at 415, 540 and 575 nm) appears only slightly. One can again notice the superficial back-scattering effect responsible for much larger amplitudes for every D n , except for D 1 for the near IR wavelengths. Such results emphasize the importance of taking into account the skin layer thickness of each pathological case to properly diagnose it.

3.2.3. Phototype Modifications in Healthy Skin Model

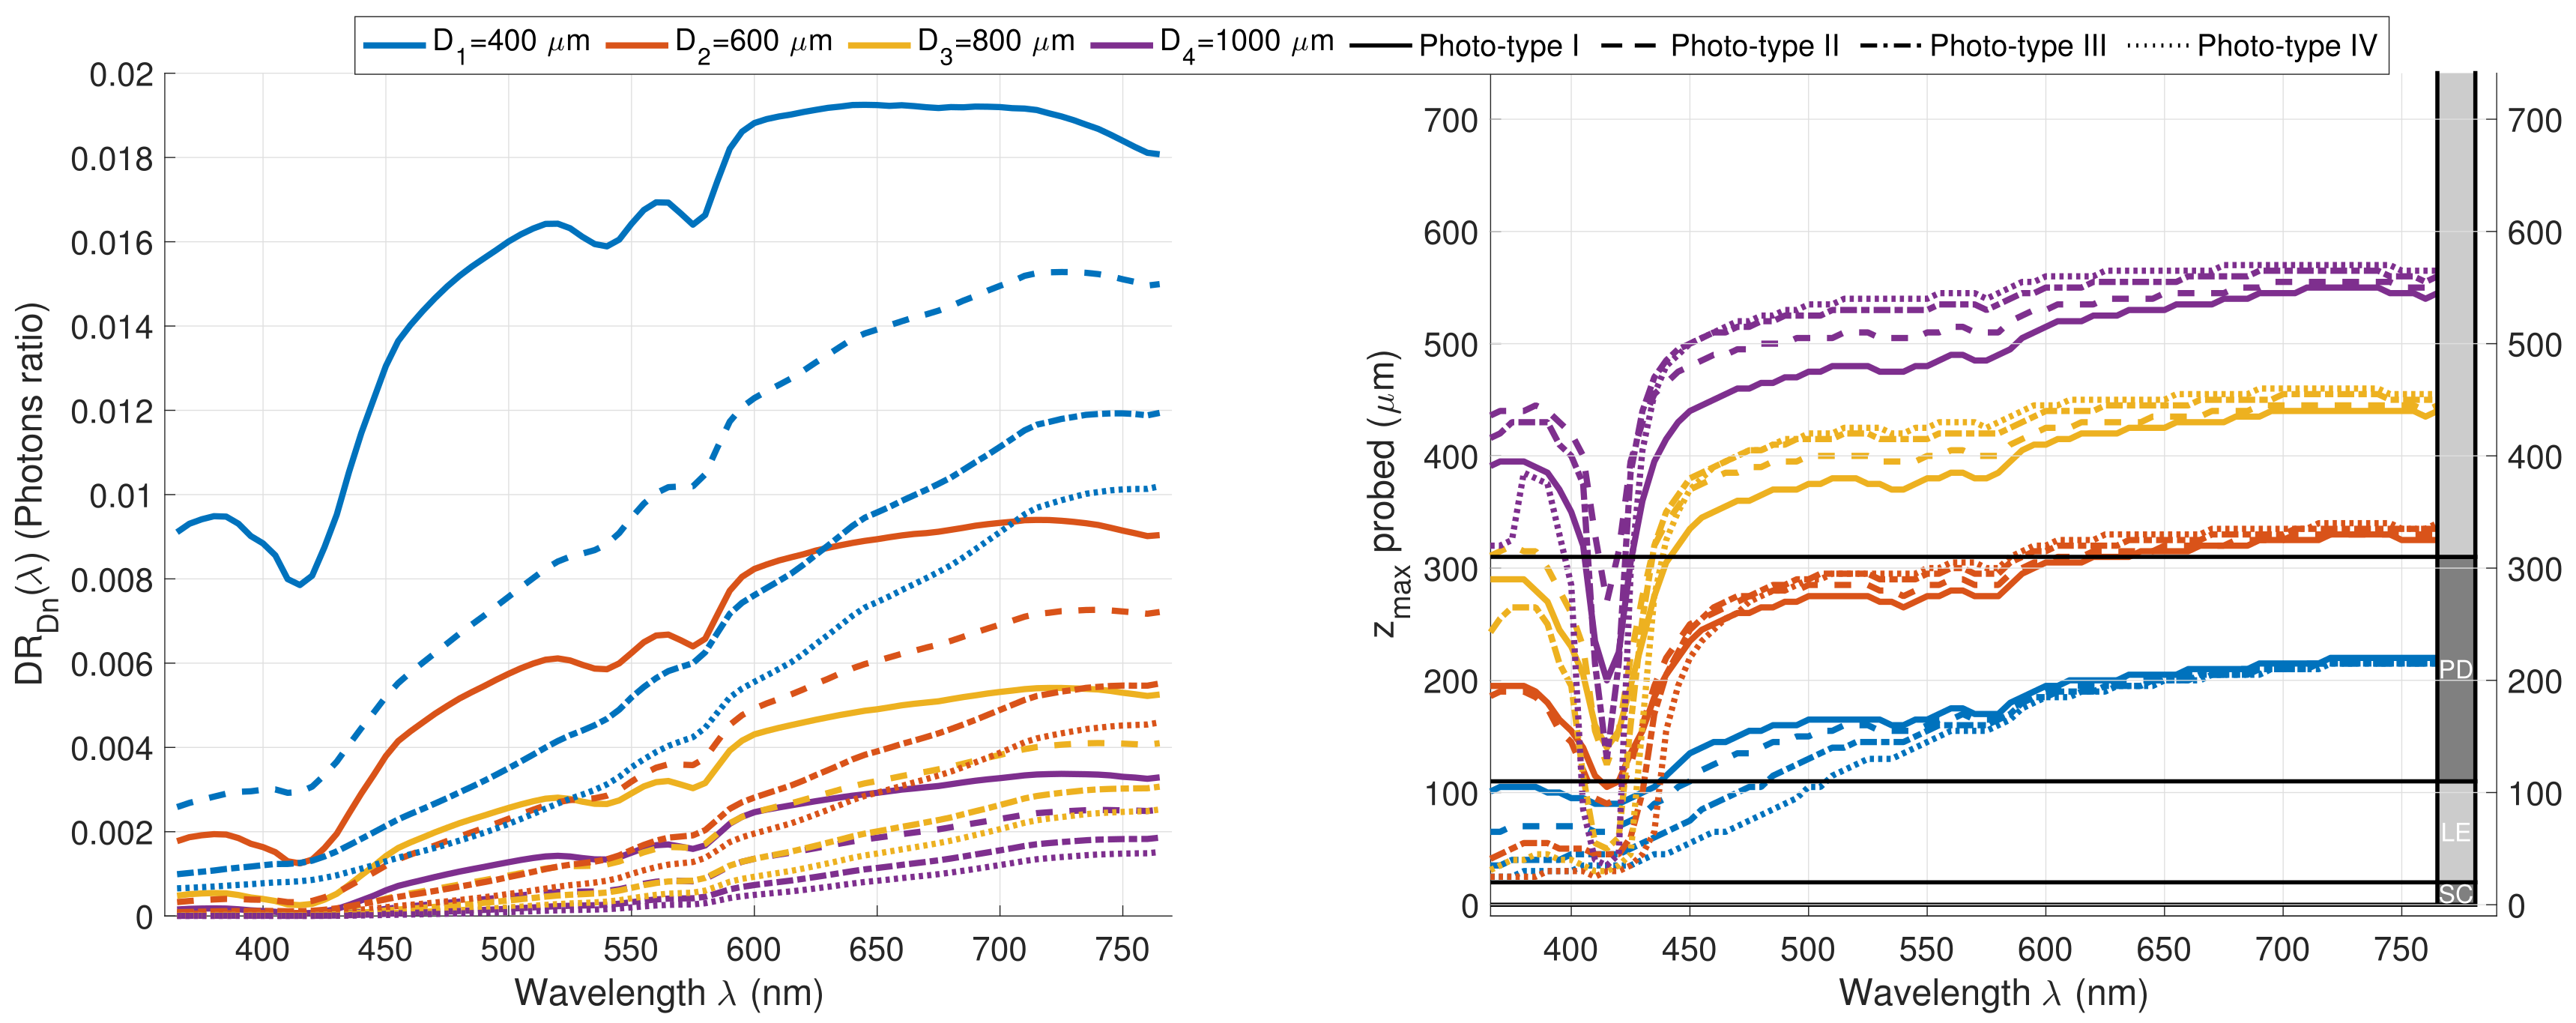
Figure 9 shows the DR spectra and probed depth graphs obtained for the healthy skin medium of intermediate thickness (cf. Table 2), mean dermal blood content (cf. Table 4) and for the four skin phototypes considered (cf. corresponding values of volume fraction of melanosome f v , m e l 2 in Table 3 and LE absorption coefficient μ a 2 in Figure 2, top right insert).
The decay of the signal in the near UV and the beginning of the visible light spectrum, when the skin darkens, was expected and is the most obvious characteristic. Rather than simply diffusing, the LE becomes more absorbent with increasing pigmentation. The optical barrier of the epidermis (including SC+LE) becomes increasingly difficult to penetrate for photons verifying λ < 450 nm. For D 1 (shortest paths), the maximum depth probed by the detected photons decreases when f v , m e l 2 increases. The information carried by D R D 1 ( λ < 450 ) appears thus to be very superficial with z m a x confined in LE layer. The very weak signature of the hemoglobin peak in the spectra for the dark phototypes confirms the previous assertion, since photons that reach the vascularized layers are rare. However, for this same distance and for the rest of the spectrum ( λ > 500 nm), it is interesting to note that the probed depth, in the PD, is virtually unchanged with the phototype. The path (i.e., the trajectory) traveled by these photons seems then to be globally identical, and only the absorption during the forward passage—the way back in the LE—justifies the signal drop in the DR spectrum. This is partly explained by the fact that the change in phototype in our model is simply considered by an increase in the melanosome volume fraction. A more complex model taking into account the volume distribution and shape of melanosomes varying with phototype would probably have more impact on the reduced scattering coefficient and thus on the photon trajectories in the medium. This specific behavior observed at short distances ( D 1 ), which is different for short ( λ < 450 nm) and long ( λ > 500 nm) wavelengths, might be of particular interest, namely to improve the robust and precise estimation of the absorption coefficient μ a 2 ( λ ) (and thus by extension a value for the volume fraction of melanosome) of the LE layer, specifically when solving the complex inverse problem of multiple optical properties in multilayer skin models.
For the other, longer SD distances, one can notice that all the detected photons reach at least the RD layer for D 2 , D 3 , D 4 and λ > 500 nm, and it is possible to observe the sensitivity of z m a x to the hemoglobin absorption peak (at 415 nm), especially for D 2 and D 3 . The increasing probed depth with phototype, for all longer SD distances D n (n > 1), can be explained by considering two complementary behaviors during the photon penetrating trajectory from SC to RD layers. The first is to dive as little as possible into the medium and thus reduce the optical path traveled. The second is to quickly reach the PD in order to escape the LE with its high absorbing capacity. For fair phototypes, where the LE absorption is moderate, the first behavior seems to have more impact; that is, detected photons resulted from shallower paths. On the other hand, for dark phototypes, it is more probable to detect photons that cross the LE layer with the shortest path lengths; i.e., paths that are as vertical or straight as possible. These photons thus need more time to make their way back towards the detection fiber: the probed depth is then more important.

3.2.4. Blood Content in Dermal Layer Modifications in Healthy Skin Model

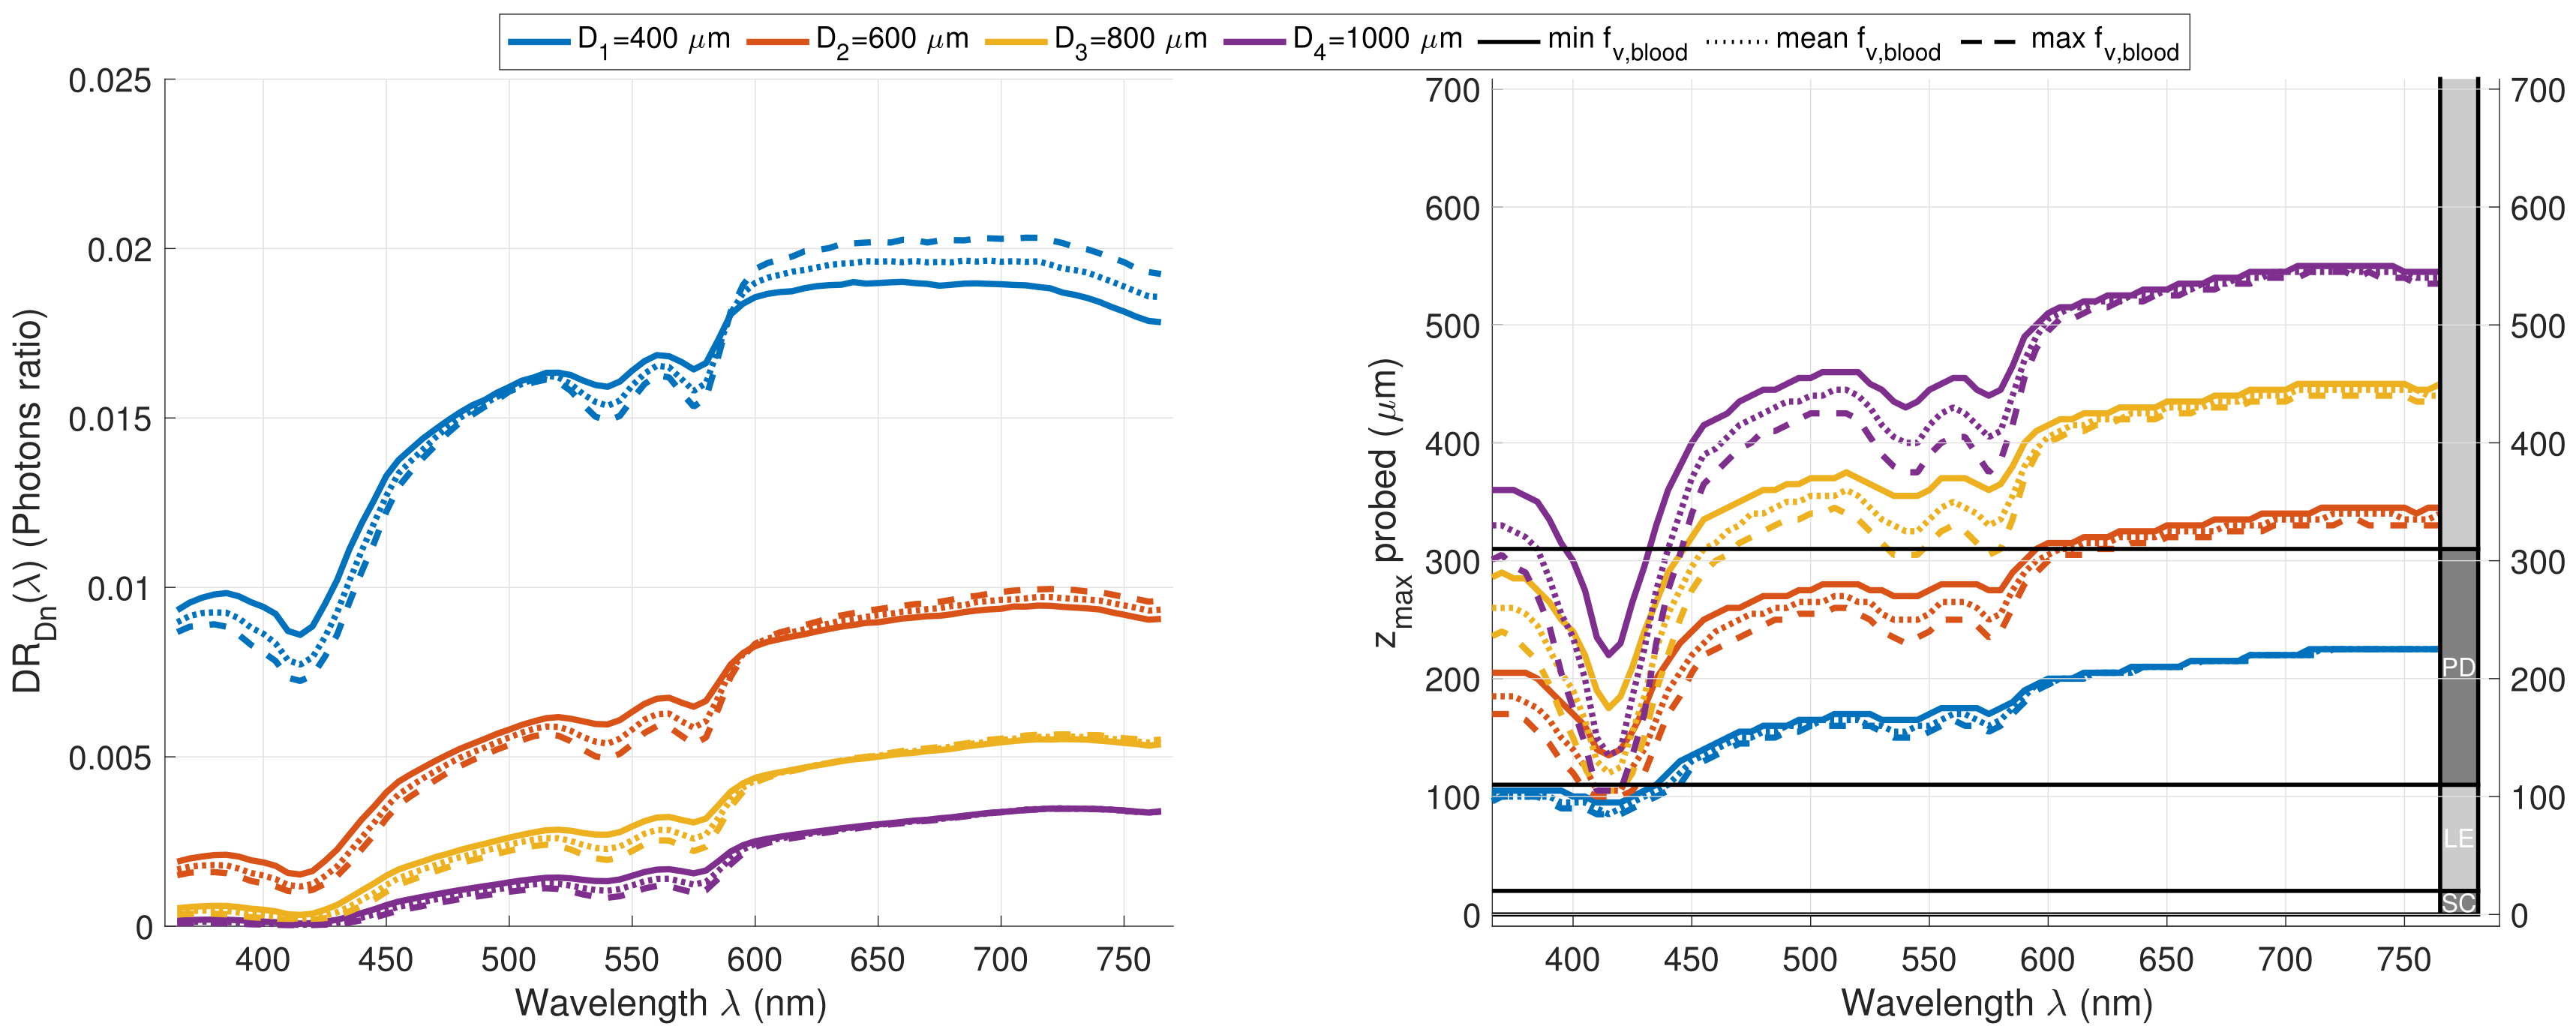
Figure 10 shows the DR spectra and probed depth graphs obtained for the healthy skin medium of intermediate thickness (cf. Table 2) for the fair phototype I (cf. Table 3) and for the three media representing dermal layers with more or less blood content (cf. Table 4), for which absorption and scattering coefficients of the two concerned layers (PD and RD), respectively, appear on the middle-right and bottom-right subplots of Figure 2. The most remarkable and expected observation is the relative signal decrease in the three hemoglobin absorption peaks (415, 540 and 575 nm). This can be linked to the probed depth plot where, for distances D 2 to D 4 , the spectral region where hemoglobin is absorbed (i.e., 365–630 nm) is affected by a decrease in the detected photon penetration with increasing blood concentration.
Concerning D 1 , the interpretation is even simpler, because of the quasi-non-influence of the quantity of blood on the path of the detected photons. In D R D 1 ( λ ) , we notice that for the first part of the spectrum (365–600 nm), the blood concentration is responsible for an attenuation of the signal, while it is associated with a gain of intensity for the rest of the spectrum (600–765 nm). The analysis of the optical properties on these spectral bands leads us to the interpretation that the first phenomenon is caused by the absorption of hemoglobin in the dermal layers. For the second phenomenon, the absorption of blood becomes negligible, and only the scattering coefficients remain significantly different (about 15% between the two extremes maximum and minimum f v , b l o o d ). This means then that the scattering power caused by the increase of the blood concentration of the dermal layers (particular PD for this shorter distance D 1 ) is at the origin of many short optical paths between SF and DF and therefore responsible for this non-obvious signal increase.

3.3. A Proposal of a Model for DR Signal Decomposition by Skin Layer

In order to more quantitatively determine the content of the global DR signal in terms of layer contributions, we propose to exploit the results of analysis of the aforementioned developed maximum probed depth histograms and spectra to decompose the total signal D R D n ( λ ) , as a sum of the DR contributions related to each of the five skin layers considered, such that for each SD distance D n ,
D R D n ( λ ) = D R D n S C ( λ ) + D R D n L E ( λ ) + D R D n P D ( λ ) + D R D n R D ( λ ) + D R D n S F ( λ )
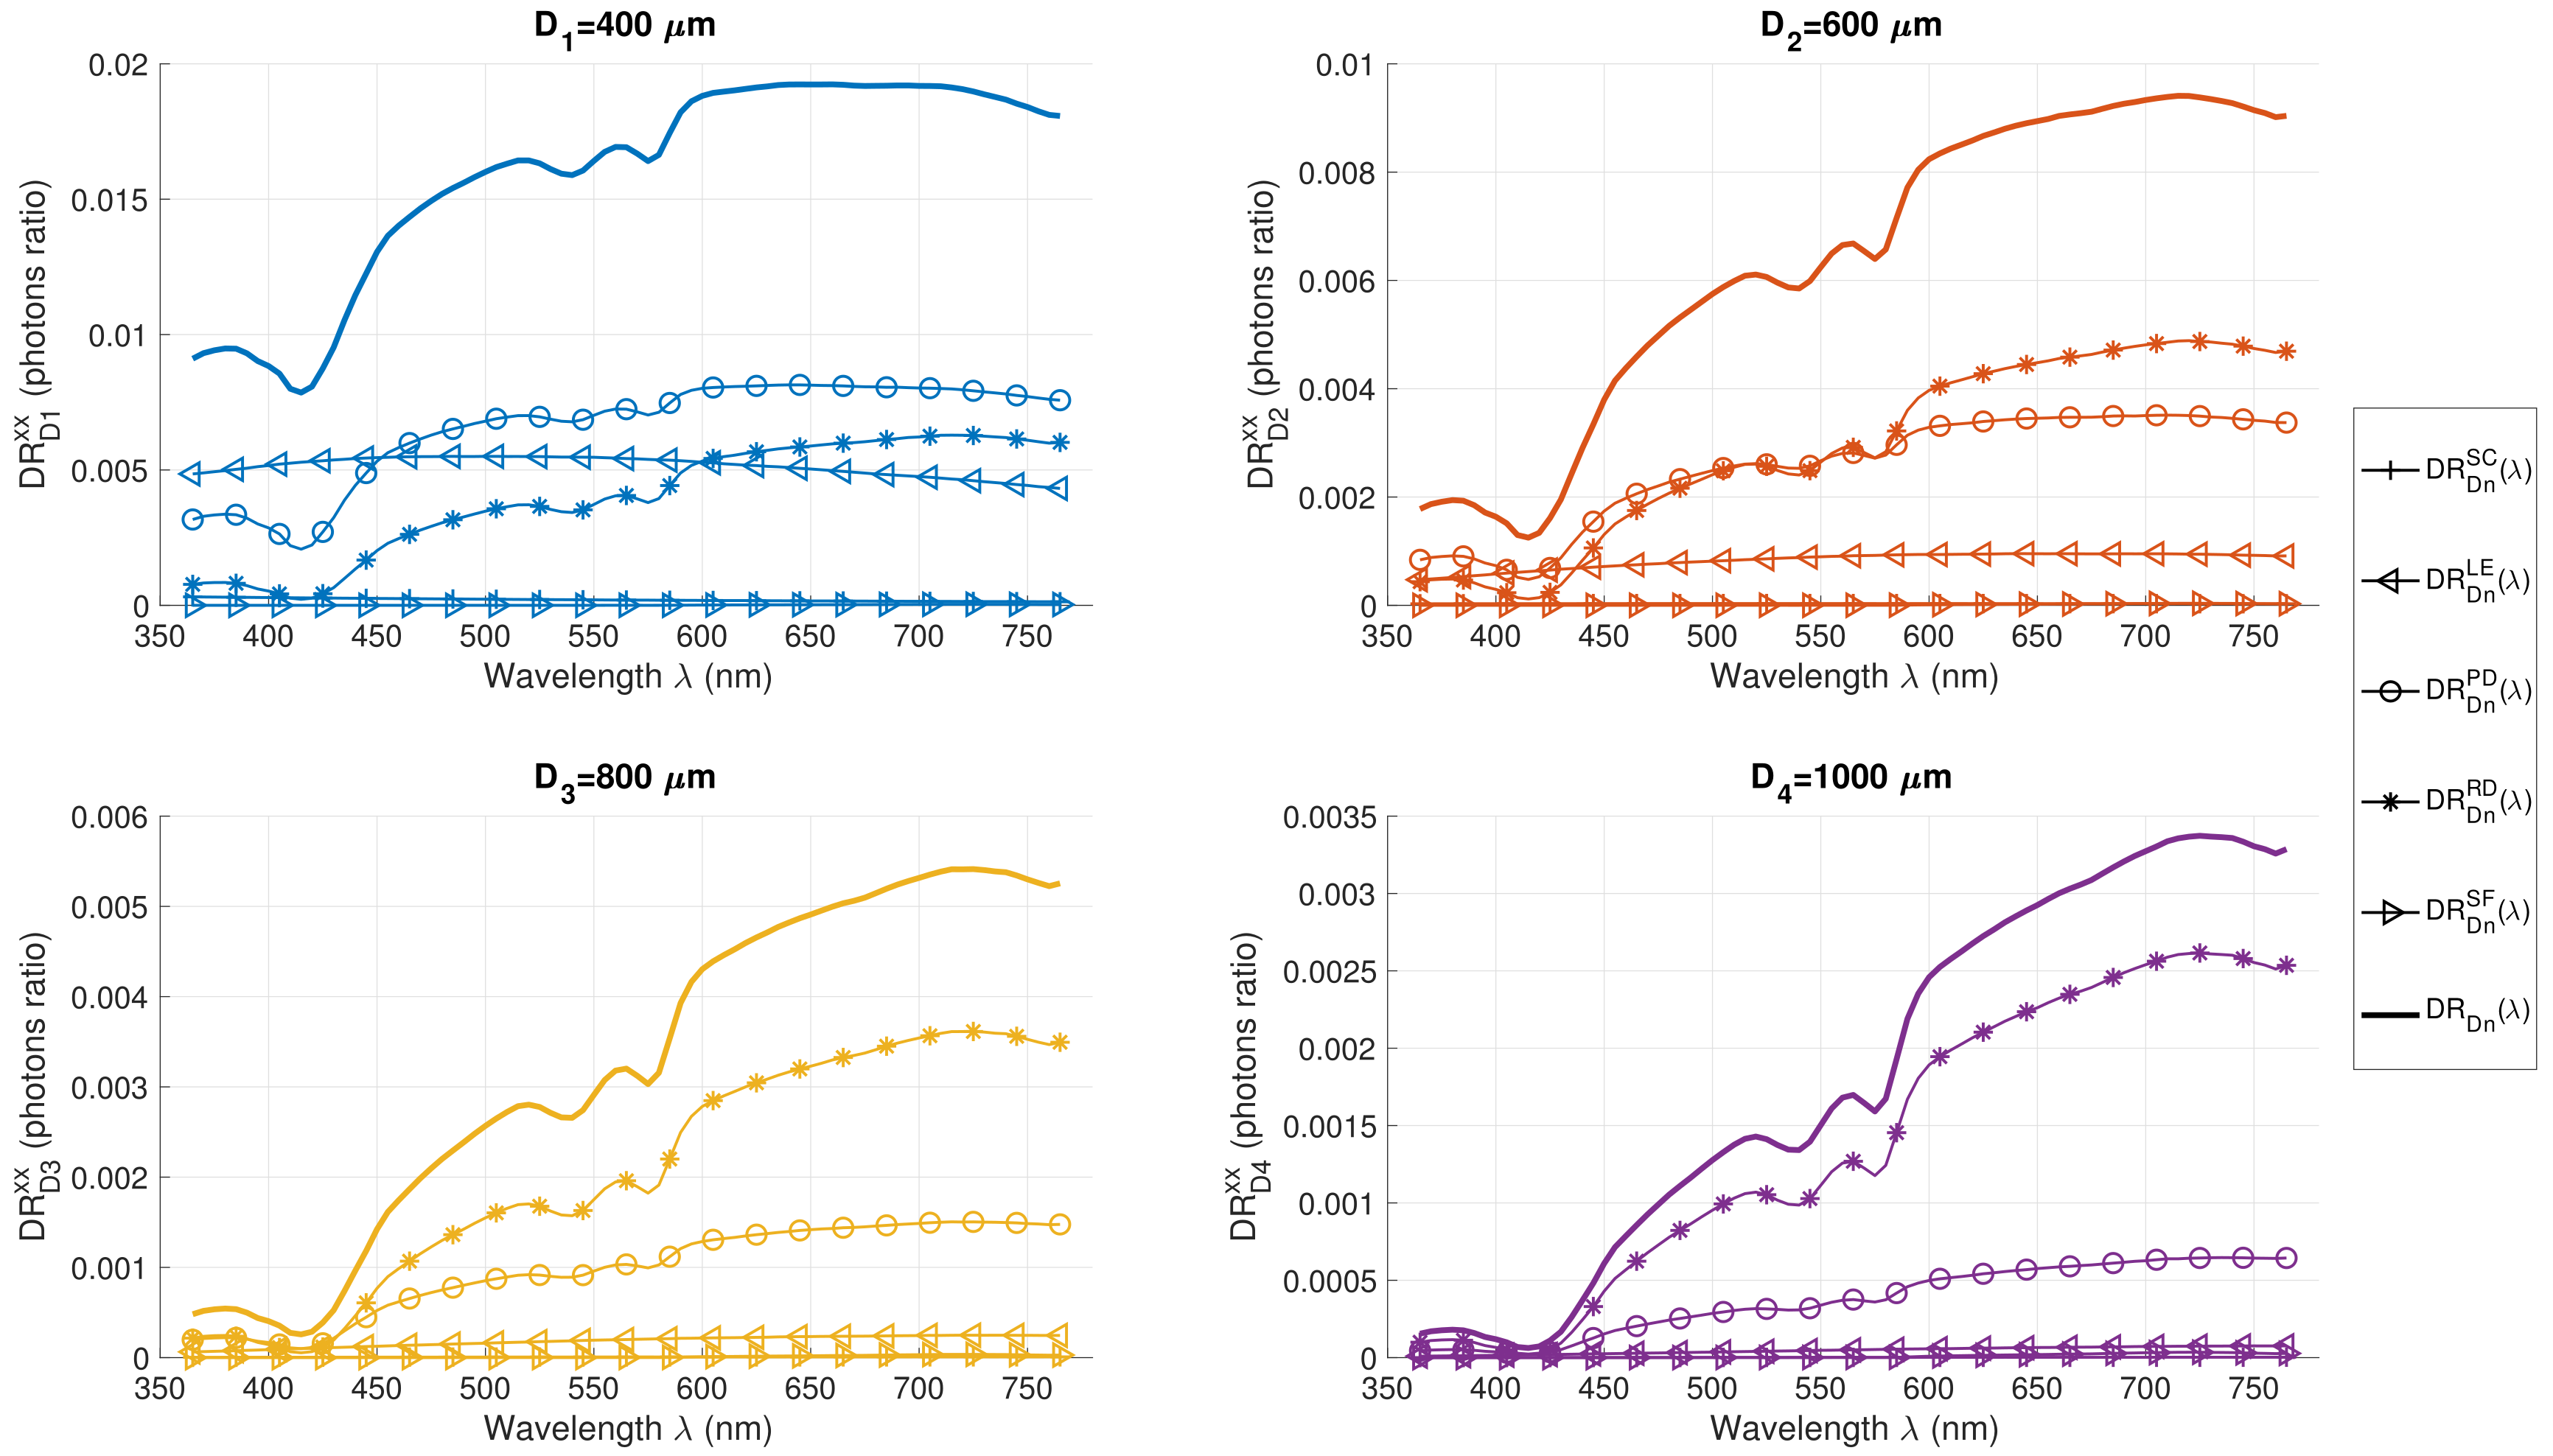
where D R D n l a y e r ( λ ) is composed of photons that reached at deepest the l a y e r appearing in exponent verifying d m i n l a y e r < z m a x < d m a x l a y e r with d m i n l a y e r and d m a x l a y e r , respectively, the minimum and maximum depth coordinates of the l a y e r . In practice, this decomposition was obtained by integrating the histograms of probed depths (cf. Section 3.1.2 and Figure 4) between the upper and lower border of each skin layer. Figure 11 illustrates this decomposition for the four SD distances and the healthy skin model with intermediate thicknesses, mean dermal blood content for SC and LE layers and phototype I. This “deepest layer probed” separation criterion has already been proposed in the literature. In [36], Fredriksson and his team studied the path length distributions for detected photons in a three-layered skin model, although they did not propose any decomposition approach. However, a different “layer”-based approach of DR signal decomposition has been proposed in a few studies. In [31], the contribution of the detected photon associated with the k-layer was defined as the quotient of the number of scattering events undergone in this layer on the total number of scattering events between SF and DF. In [35], the authors proposed to explain the skin layer sensitivity by the mean partial path length, which consists of assigning to the layer k the relative weight l k / l t o t in the DR signal, with l k the path length in the layer k and l t o t the total path length between SF and DF.
The approach proposed in the present contribution differs from the latter by the following points. First, our proposed decomposition provides a straightforward and simple interpretation regarding the layer reached by the detected photons making the global DR signal, compared to less non-trivial interpretations linking the mean path length or the ratio of scattering events to the layer’s weight in the DR signal. Second, as a consequence, the proposed decomposition should help in designing a method to estimate sequential optical properties by studying the layers from the shallowest to the deepest and by providing new, a priori knowledge on the selection of the sensitive distances and wavelength range. This approach will bring a physical and anatomical sense to the estimation and should be less time consuming due to the successive isolation of the parameters.
The analysis to be drawn from Figure 11 is in accordance with that performed qualitatively in the Section 3.1 but allows us to better explain the DR signal in layer decomposition. To further compare the proportion of a signal from a layer, for a fixed couple ( λ , D n ) , we defined the weight fraction of the layer contribution in percentage, as follows:
w D n l a y e r ( λ ) = 100 × D R D n l a y e r ( λ ) D R D n ( λ ) ( % )
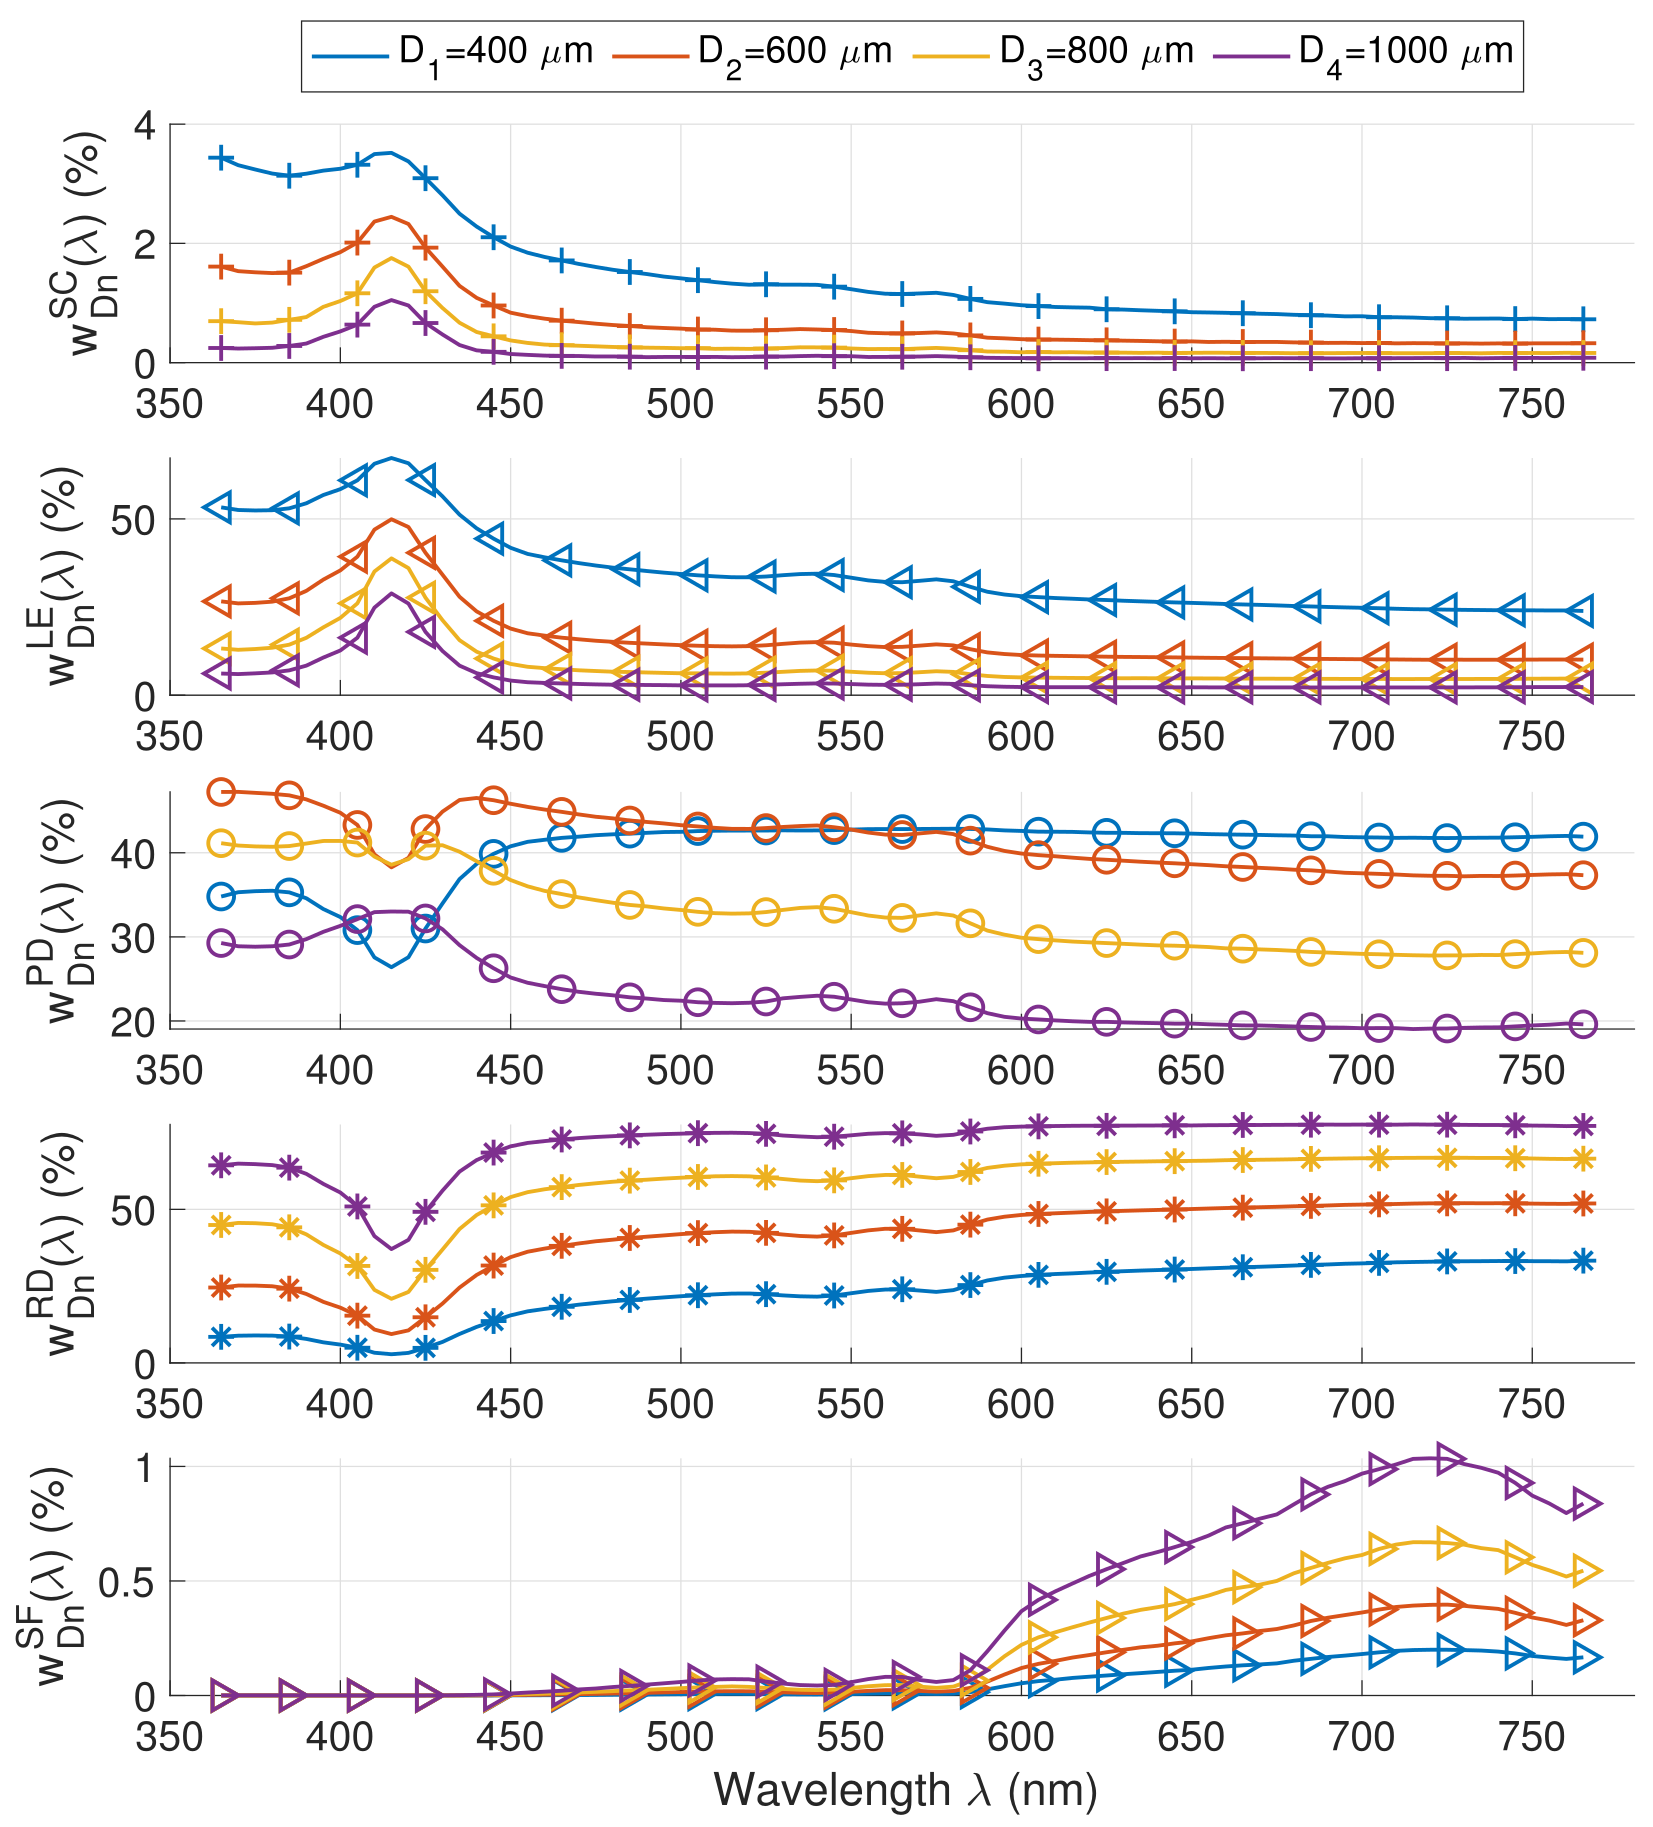
Finally, Figure 12 shows the associated evolution of w D n l a y e r ( λ ) defined in Equation (5) as a function of the wavelength and the SD distance. This decomposition turns out to be very useful to extract the spectral band and SD distance of a DR signal that is susceptible to carry information associated with local depth information. For instance, the spectral “signature” of elastosis (accumulation of disordered elastic tissue in the PD due to carcinogenesis) should be looked for in the UV range (365 < λ < 400 nm) at the D 2 distance, where more than 40% of the DR signal is constituted of photons that have visited the concerned layer.
It is worth noting that all the geometrical and optical parameters considered in the model described above were chosen within standard ranges of values, accounting for anatomical and physiological variability. The aim of the present work was not to perform a complete variation study taking into account those variability intervals but rather to investigate the variation of the dependence of epidermal thickness (see Section 3.2.1), pathological state (see Section 3.2.2), phototype (see Section 3.2.3) and dermal blood content (see Section 3.2.4) considering a unique set of basic but representative values for all other parameters of the model. A possible extended study could be led with other parameters, such as the individually variable scattering coefficient [63], the blood oxygen saturation [60] or the average blood vessel diameter [64], even if those parameter have a more limited impact on the layers’ optical coefficients and thus on the penetration of photons in depth. It would also be interesting to consider 3D tumor models, since the assumption of semi-infinite layers imposed by CudaMCML is a limitation. A study shows that the validity of this assumption depends on the type of tumor simulated (squamous cell carcinoma in epithelium or a basal cell carcinoma in upper dermis), the angular incidence of the exciting fiber, the height of the tumor and its width relative to the SD distance at which the signal is acquired [65].
All the results established so far allow us to extend our discussion towards the targeted clinical application of SR-DRS devices. Firstly, the in-depth elements characterizing the path of the detected photons within the various skin layers allow us to assert that the geometrical layout of the probe and its spectral configuration provide access to the different layers of the skin with a sensitivity depending on the chosen couple ( λ , D n ) and on the physiological and morphological skin configuration. In particular, the results showed that the photons contributing to the DR spectra were likely to carry the discriminating local information that distinguishes healthy and pathological tissues. It should be noted, however, that the results presented here are valid for the case of fiber-based contact-type DRS configurations, and under the assumption that the optical properties of each of the skin layers do not significantly vary laterally within the ∼2 mm diameter circular region covered by the multi-fiber optics probe tip. Moreover, for the estimation of diagnostically relevant optical parameters from in vivo SR-DRS measurements through an inverse problem solving method [66,67], such results should be useful to understand this iterative process better by defining a cost function adapted to the layer structure of the skin.

4. Conclusions and Prospects

In order to learn more about the depth behavior of detected photons and thus allow for a better interpretation of the simulated and measured diffuse reflectance signals, we decided to carry out the current numerical study. A photon propagation algorithm was adapted to match the measurement features of the SpectroLive device, which is a spatially-resolved diffuse reflectance spectroscopy device used in clinical applications. To do so, a numerical five-layered skin model, including realistic absorption and scattering properties from main intrinsic chromophores, was defined in order to reach a certain fidelity between the simulation and the experimental acquisition. The histograms of probed depths allowed us to extract the typical depths at which the photons took the return path to the collection fiber. The results dependent on the skin type placed under examination and the fate of photon behavior in terms of depth penetration for different physiological and pathological states were investigated. Indeed, diffuse reflectance spectra and probed depth graphs were analyzed for different sites on the body (by varying the thicknesses of the stratum corneum and the living epidermis), for different pathological states (ulcerated and hyperkeratosed carcinoma) and finally for different phototypes (by varying the volume fraction of melanosome in living epidermis).
Finally, to further the understanding of the diffuse reflectance signal, a layer decomposition model of the latter was proposed and applied to a healthy medium of intermediate thickness, mean dermal blood content and phototype I (most carcinomas occur in the fair-skinned population). By providing quantitative layer contributions in the resulting signal, these results refine the existing relationships between the wavelength, source–detector distance and probed skin layer. This relationship will be further used to interpret spectra recorded during a clinical trial that aims at evaluating the SR-DRS diagnostic accuracy for the differential diagnosis of skin carcinomas. More specifically, the exposed numerical evidence may facilitate the development of analytical photon propagation models that enable the inverse estimation of diagnostically relevant optical parameters or allow researchers to distinguish a healthy from a pathological tissue using spectral criteria, from in vivo clinical spectra. Such a numerical study may also be used to standardize measured spectra taking into account intra- and inter-individual variability. Currently, ratios of measured spectra are proposed to eliminate this variability, but such calculation methods can sometimes be impaired by artifacts of measurements.

Author Contributions

Conceptualization, V.C.; Data curation, V.C., G.K. and M.A.; Formal analysis, V.C., W.B. and M.A.; Funding acquisition, W.B. and M.A.; Investigation, V.C. and W.B.; Methodology, V.C. and W.B.; Project administration, W.B.; Resources, G.K.; Supervision, W.B., C.D. and M.A.; Validation, V.C.; Writing—original draft, V.C.; Writing—review and editing, V.C., W.B., C.D. and M.A. All authors have read and agreed to the published version of the manuscript.

Funding

The authors would like to thank the French Région Grand-Est, the CNRS and the Metz-Thionville Regional Hospital (2016 clinical research award) in the frame of the SpectroLive project, the Contrat de Plan Etat—Région Grand Est 2015–2020 (CPER IT2MP, plateforme IMTI) including the European Regional Development Fund FEDER and the Ligue Contre le Cancer for their financial support; and the Lorraine Université d’Excellence (LUE) Doctorate 2019 under the PhD grant R01PJYRX-PHD19-COLA-CRAN (Victor Colas, 2019–2022).

Institutional Review Board Statement

Not applicable.

Informed Consent Statement

Not applicable.

Data Availability Statement

Pure chromophore spectra mentioned in Section 2.2.2 were downloaded from OMLC database [49]. The basic version (CudaMCML) of the photon transport simulation that we have adapted is available on the Lund University website.

Acknowledgments

The authors want to express their gratitude for the high-performance computing resources provided by the EXPLOR centre hosted by the Université de Lorraine (project 2018AM2IX0877).

Conflicts of Interest

The authors declare no conflict of interest.

References

  1. Bydlon, T.M.; Nachabé, R.; Ramanujam, N.; Sterenborg, H.J.C.M.; Hendriks, B.H.W. Chromophore based analyses of steady-state diffuse reflectance spectroscopy: Current status and perspectives for clinical adoption. J. Biophotonics 2015, 8, 9–24. [Google Scholar] [CrossRef] [PubMed]
  2. Bashkatov, A.N.; Genina, E.A.; Tuchin, V.V. Optical properties of skin, subcutaneous, and muscle tissues: A review. J. Innov. Opt. Health Sci. 2011, 04, 9–38. [Google Scholar] [CrossRef]
  3. Kollias, N.; Seo, I.; Bargo, P.R. Interpreting diffuse reflectance for in vivo skin reactions in terms of chromophores. J. Biophotonics 2010, 3, 15–24. [Google Scholar] [CrossRef]
  4. Wilson, R.H.; Nadeau, K.P.; Jaworski, F.B.; Tromberg, B.J.; Durkin, A.J. Review of short-wave infrared spectroscopy and imaging methods for biological tissue characterization. J. Biomed. Opt. 2015, 20, 030901. [Google Scholar] [CrossRef]
  5. Bruulsema, J.T.; Essenpreis, M.; Heinemann, L.; Hayward, J.E.; Berger, M.; Gries, F.A.; Koschinsky, T.; Sandahl-Christiansen, J.; Orskov, H.; Farrell, T.J.; et al. Detection of Changes in Blood Glucose Concentration in vivo with Spatially Resolved Diffuse Reflectance. In Biomedical Optical Spectroscopy and Diagnostics; Optical Society of America: Orlando, FL, USA, 1996. [Google Scholar]
  6. Hjalmarsson, P.; Thennadil, S.N. Determination of glucose concentration in tissue-like material using spatially resolved steady-state diffuse reflectance spectroscopy. In Complex Dynamics and Fluctuations in Biomedical Photonics V; Tuchin, V.V., Wang, L.V., Eds.; International Society for Optics and Photonics: San Jose, CA, USA, 2008; Volume 6855, pp. 48–56. [Google Scholar]
  7. Finlay, J.; Foster, T. Hemoglobin oxygen saturations in phantoms and in vivo from measurements of steady-state diffuse reflectance at a single, short source-detector separation. Med. Phys. 2004, 31, 1949–1959. [Google Scholar] [CrossRef] [PubMed]
  8. Spliethoff, J.W.; Evers, D.J.; Klomp, H.M.; van Sandick, J.W.; Wouters, M.W.; Nachabe, R.; Lucassen, G.W.; Hendriks, B.H.; Wesseling, J.; Ruers, T.J. Improved identification of peripheral lung tumors by using diffuse reflectance and fluorescence spectroscopy. Lung Cancer 2013, 80, 165–171. [Google Scholar] [CrossRef] [PubMed]
  9. Arifler, D.; MacAulay, C.E.; Follen, M.; Richards-Kortum, R.R. Spatially resolved reflectance spectroscopy for diagnosis of cervical precancer: Monte Carlo modeling and comparison to clinical measurements. J. Biomed. Opt. 2006, 11, 064027. [Google Scholar] [CrossRef]
  10. LaRiviere, B.; Garman, K.S.; Ferguson, N.L.; Fisher, D.A.; Jokerst, N.M. Spatially Resolved Diffuse Reflectance Spectroscopy of Tumor and Normal Excised Human Colon with Thin Film Si Sensors. In Proceedings of the Optical Sensors and Sensing Congress (ES, FTS, HISE, Sensors), San Jose, CA, USA, 25–27 June 2019; Optical Society of America: San Jose, CA, USA, 2019; p. STu2D.5. [Google Scholar] [CrossRef]
  11. Pery, E.; Amouroux, M.; Diaz-Ayil, G.; Blondel, W.C.P.M.; Bourg-Heckly, G.; D’Hallewin, M.; Leroux, A.; Guillemin, F. Multi-modality point spectroscopy: Interests, development and application to in vivo diagnosis of bladder and skin cancers. In Proceedings of the 2008 16th Mediterranean Conference on Control and Automation, Ajaccio, France, 25–27 June 2008; pp. 1353–1358. [Google Scholar] [CrossRef]
  12. Nie, Z.; Du Le, V.N.; Cappon, D.; Provias, J.; Murty, N.; Hayward, J.E.; Farrell, T.J.; Patterson, M.S.; McMillan, W.; Fang, Q. Integrated Time-Resolved Fluorescence and Diffuse Reflectance Spectroscopy Instrument for Intraoperative Detection of Brain Tumor Margin. IEEE J. Sel. Top. Quantum Electron. 2016, 22, 49–57. [Google Scholar] [CrossRef]
  13. Evers, D.J.; Nachabe, R.; Peeters, M.J.V.; van der Hage, J.A.; Oldenburg, H.S.; Rutgers, E.J.; Lucassen, G.W.; Hendriks, B.H.W.; Wesseling, J.; Ruers, T.J.M. Diffuse reflectance spectroscopy: Towards clinical application in breast cancer. Breast Cancer Res. Treat. 2013, 137, 155–165. [Google Scholar] [CrossRef]
  14. Georgakoudi, I.; Jacobson, B.C.; Van Dam, J.; Backman, V.; Wallace, M.B.; Müller, M.G.; Zhang, Q.; Badizadegan, K.; Sun, D.; Thomas, G.A.; et al. Fluorescence, reflectance, and light-scattering spectroscopy for evaluating dysplasia in patients with Barrett’s esophagus. Gastroenterology 2001, 120, 1620–1629. [Google Scholar] [CrossRef] [Green Version]
  15. Garcia-Uribe, A.; Chang, C.C.; Zou, J.; Banerjee, B.; Kuczynski, J.; Wang, L.V. Pancreatic tumor margin detection by oblique incidence diffuse reflectance spectroscopy. In Proceedings of the Optical Biopsy IX, San Francisco, CA, USA, 16 February 2011; Alfano, R.R., Ed.; International Society for Optics and Photonics: San Francisco, CA, USA, 2011; Volume 7895, pp. 110–114. [Google Scholar]
  16. Garcia-Uribe, A.; Wang, L.V.; Zou, J.; Smith, E.B.; Duvic, M.D.; Prieto, V. In-vivo characterization of optical properties of pigmented skin lesions including melanoma using oblique incidence diffuse reflectance spectrometry. J. Biomed. Opt. 2011, 16, 020501. [Google Scholar] [CrossRef] [Green Version]
  17. Pires, L.; Demidov, V.; Vitkin, I.A.; Bagnato, V.S.; Kurachi, C.; Wilson, B.C. Optical clearing of melanoma in vivo: Characterization by diffuse reflectance spectroscopy and optical coherence tomography. J. Biomed. Opt. 2016, 21, 081210. [Google Scholar] [CrossRef] [PubMed] [Green Version]
  18. Amouroux, M.; Blondel, W.; Granel-Brocard, F.; Marchal, F.; Guillemin, F. A preliminary study on skin phantoms to test spatially resolved-Diffuse Reflectance Spectroscopy as a tool to help diagnose cutaneous melanoma: A non-invasive measurement of Breslow index. Bio-Med. Mater. Eng. 2008, 18, 339–343. [Google Scholar] [CrossRef]
  19. Khairallah, G.; Blondel, W.; Rakotomanga, P.; Soussen, C.; Delconte, A.; Plenat, F.; Marchal, F.; Amouroux, M. Impact of standardization of autofluorescence and diffuse reflectance spectra on diagnosis accuracy of optical spectroscopy used for skin carcinomas diagnosis. In Proceedings of the Saratov Fall Meeting SFM’18 International Symposium”Optics and Biophotonics-V, Saratov, Russia, 24–29 September 2018. [Google Scholar]
  20. Amouroux, M.; Díaz-Ayil, G.; Blondel, W.C.P.M. Classification of ultraviolet irradiated mouse skin histological stages by bimodal spectroscopy: Multiple excitation autofluorescence and diffuse reflectance. J. Biomed. Opt. 2009, 14, 14011. [Google Scholar] [CrossRef] [PubMed]
  21. Koenig, A.; Roig, B.; Digabel, J.L.; Josse, G.; Dinten, J.M. Accessing deep optical properties of skin using diffuse reflectance spectroscopy. In Clinical and Biomedical Spectroscopy and Imaging IV; Brown, J.Q., Deckert, V., Eds.; International Society for Optics and Photonics: Munich, Germany, 2015; Volume 9537, pp. 42–49. [Google Scholar]
  22. Naglič, P.; Pernuš, F.; Likar, B.; Bürmen, M. Estimation of optical properties by spatially resolved reflectance spectroscopy in the subdiffusive regime. J. Biomed. Opt. 2016, 21, 095003. [Google Scholar] [CrossRef]
  23. Sharma, M.; Marple, E.; Reichenberg, J.; Tunnell, J.W. Design and characterization of a novel multimodal fiber-optic probe and spectroscopy system for skin cancer applications. Rev. Sci. Instruments 2014, 85, 083101. [Google Scholar] [CrossRef] [PubMed]
  24. Koenig, A.; Grande, S.; Dahel, K.; Planat-Chrétien, A.; Poher, V.; Goujon, C.; Dinten, J.M. Diffuse reflectance spectroscopy: A clinical study of tuberculin skin tests reading. In Biomedical Applications of Light Scattering VII; Wax, A.P., Backman, V., Eds.; International Society for Optics and Photonics: San Francisco, CA, USA, 2013; Volume 8592, pp. 98–105. [Google Scholar] [CrossRef]
  25. Breslin, T.M.; Ramanujam, N. Autofluorescence and Diffuse Reflectance Properties Malignant and Benign Breast Tissues. Ann. Surg. Oncol. 2003, 11, 65–70. [Google Scholar] [CrossRef]
  26. Ye Yuan, P.R. Enzymatic degradation of human skin dermis revealed by fluorescence and reflectance spectroscopy. Opt. Exp. 2008, 16, 9857–9868. [Google Scholar]
  27. Borisova, E.G.; Angelova, L.P.; Pavlova, E.P. Endogenous and Exogenous Fluorescence Skin Cancer Diagnostics for Clinical Applications. IEEE J. Sel. Top. Quantum Electron. 2014, 20, 211–222. [Google Scholar] [CrossRef]
  28. Zhang, H.; Salo, D.C.; Kim, D.M.; Komarov, S.; Tai, Y.C.; Berezin, M.Y. Penetration depth of photons in biological tissues from hyperspectral imaging in shortwave infrared in transmission and reflection geometries. J. Biomed. Opt. 2016, 21, 126006. [Google Scholar] [CrossRef]
  29. Martelli, F.; Binzoni, T.; Pifferi, A.; Spinelli, L.; Farina, A.; Torricelli, A. There’s plenty of light at the bottom: Statistics of photon penetration depth in random media. Sci. Rep. 2016, 6, 27057. [Google Scholar] [CrossRef]
  30. Hidenobu Arimoto, M.E.; Yamada, Y. Depth profile of diffuse reflectance near-infrared spectroscopy for measurement of water content in skin. Skin Res. Technol. 2005, 11, 27–35. [Google Scholar] [CrossRef]
  31. Arifler, D.; Schwarz, R.A.; Chang, S.K.; Richards-Kortum, R. Reflectance spectroscopy for diagnosis of epithelial precancer: Model-based analysis of fiber-optic probe designs to resolve spectral information from epithelium and stroma. Appl. Opt. 2005, 44, 4291–4305. [Google Scholar] [CrossRef] [Green Version]
  32. Tseng, S.H.; Tzeng, S.Y.; Liaw, Y.K.; Hsu, C.K.; Lee, J.; Chen, W.R. Noninvasive evaluation of collagen and hemoglobin contents and scattering property of in vivo keloid scars and normal skin using diffuse reflectance spectroscopy: Pilot study. J. Biomed. Opt. 2012, 17, 077005. [Google Scholar] [CrossRef] [PubMed] [Green Version]
  33. Nilsson, H.; Larsson, M.; Nilsson, G.; Strömberg, T. Photon pathlength determination based on spatially resolved diffuse reflectance. J. Biomed. Opt. 2002, 7, 475–485. [Google Scholar] [CrossRef] [Green Version]
  34. Larsson, M.; Nilsson, H.; Strömberg, T. In vivo determination of local skin optical properties and photon path length by use of spatially resolved diffuse reflectance with applications in laser Doppler flowmetry. Appl. Opt. 2003, 42, 124–134. [Google Scholar] [CrossRef]
  35. Liebert, A.; Wabnitz, H.; Steinbrink, J.; Obrig, H.; Möller, M.; Macdonald, R.; Villringer, A.; Rinneberg, H. Time-resolved multidistance near-infrared spectroscopy of the adult head: Intracerebral and extracerebral absorption changes from moments of distribution of times of flight of photons. Appl. Opt. 2004, 43, 3037–3047. [Google Scholar] [CrossRef]
  36. Fredriksson, I.; Larsson, M.; Strömberg, T. Inverse Monte Carlo method in a multilayered tissue model for diffuse reflectance spectroscopy. J. Biomed. Opt. 2012, 17, 047004. [Google Scholar] [CrossRef] [PubMed]
  37. Blondel, W.; Delconte, A.; Khairallah, G.; Marchal, F.; Gavoille, A.; Amouroux, M. Spatially-Resolved Multiply-Excited Autofluorescence and Diffuse Reflectance Spectroscopy: SpectroLive Medical Device for Skin In Vivo Optical Biopsy. Electronics 2021, 10, 243. [Google Scholar] [CrossRef]
  38. Khairallah, G.; Amouroux, M.; Plénat, F.; Rakotomanga, P.; Soussen, C.; Marchal, F.; Delconte, A.; Chen, H.; Blondel, W. Spatially resolved spectroscopy for guiding margin delineation during human skin carcinomas resection: First clinical results on diffuse reflectance and autofluorescence spectra and in vivo skin optical properties. In Biophotonics: Photonic Solutions for Better Health Care VI; Popp, J., Tuchin, V.V., Pavone, F.S., Eds.; International Society for Optics and Photonic: Strasbourg, France, 2018; Volume 10685, pp. 200–206. [Google Scholar]
  39. Dahlstrand, U.; Sheikh, R.; Nguyen, C.D.; Hult, J.; Reistad, N.; Malmsjö, M. Identification of tumor margins using diffuse reflectance spectroscopy with an extended-wavelength spectrum in a porcine mode. Skin Res. Technol. 2018, 24, 667–671. [Google Scholar] [CrossRef] [Green Version]
  40. Feng, X.; Fox, M.C.; Reichenberg, J.S.; Lopes, F.C.P.S.; Sebastian, K.R.; Markey, M.K.; Tunnell, J.W. Biophysical basis of skin cancer margin assessment using Raman spectroscopy. Biomed. Opt. Express 2019, 10, 104–118. [Google Scholar] [CrossRef]
  41. Zelinskyi, Y.; Naglič, P.; Pernuš, F.; Likar, B.; Bürmen, M. Fast and accurate Monte Carlo simulations of subdiffusive spatially resolved reflectance for a realistic optical fiber probe tip model aided by a deep neural network. Biomed. Opt. Express 2020, 11, 3875–3889. [Google Scholar] [CrossRef] [PubMed]
  42. Maiti, R.; Duan, M.; Danby, S.G.; Lewis, R.; Matcher, S.J.; Carré, M.J. Morphological parametric mapping of 21 skin sites throughout the body using optical coherence tomography. J. Mech. Behav. Biomed. Mater. 2020, 102, 103501. [Google Scholar] [CrossRef]
  43. Chopra, K.; Calva, D.; Sosin, M.; Tadisina, K.; Banda, A.; Cruz, C.D.L.; Chaudhry, M.; Legesse, T.; Drachenberg, C.; Manson, P.; et al. A comprehensive examination of topographic thickness of skin in the human face. Aesthet. Surg. J. 2015, 35, 1007–1013. [Google Scholar] [CrossRef] [PubMed] [Green Version]
  44. Robertson, K.; Re, J.L. Variation in Epidermal Morphology in Human Skin at Different Body Sites as Measured by Reflectance Confocal Microscopy. Med. J. Ltd. 2010, 90, 368–373. [Google Scholar]
  45. Amouroux, M. Caractérisation de la Transformation Néoplasique de la peau par Spectroscopies Optiques sur Fantôme de Mélanome et Carcinome Epidermoïde murin Photo-Induit. Ph.D. Thesis, Université Henri Poincaré, Nancy, France, 2008. [Google Scholar]
  46. Colas, V.; Daul, C.; Khairallah, G.; Amouroux, M.; Blondel, W. Spatially resolved diffuse reflectance and autofluorescence photon depth distribution in human skin spectroscopy: A modeling study. In Optics in Health Care and Biomedical Optics X; Luo, Q., Li, X., Gu, Y., Zhu, D., Eds.; International Society for Optics and Photonics: Bellingham, Washington, USA, 2020; Volume 11553, pp. 82–96. [Google Scholar] [CrossRef]
  47. Meglinski, I.V.; Matcher, S.J. Quantitative assessment of skin layers absorption and skin reflectance spectra simulation in the visible and near-infrared spectral regions. Physiol. Meas 2002, 23, 741. [Google Scholar] [CrossRef]
  48. Jacques, S.L. Optical properties of biological tissues: A review. Phys. Med. Biol. 2013, 58, R37–R61. [Google Scholar] [CrossRef]
  49. Prahl, S. A Compendium of Tissue Optical Properties. Available online: http://omlc.ogi.edu/spectra/ (accessed on 1 December 2020).
  50. Karsten, A.E.; Smit, J.E. Modeling and Verification of Melanin Concentration on Human Skin Type. Photochem. Photobiol. 2012, 88, 469–474. [Google Scholar] [CrossRef] [Green Version]
  51. Nishidate, I.; Maeda, T.; Aizu, Y.; Niizeki, K. Visualizing depth and thickness of a local blood region in skin tissue using diffuse reflectance images. J. Biomed. Opt. 2007, 12, 054006. [Google Scholar] [CrossRef] [Green Version]
  52. Krishnaswamy, A.; Baranoski, G. Light and Skin Interactions, 1st ed.; Elsevier: Burlington, MA, USA, 2010. [Google Scholar]
  53. Altshuler, G.; Smirnov, M.; Yaroslavsky, I. Lattice of optical islets: A novel treatment modality in photomedicine. J. Phys. D Appl. Phys. 2005, 38, 2732. [Google Scholar] [CrossRef]
  54. Ding, H.; Lu, J.; Wooden, W.; Kragel, P.; Hu, X. Refractive indices of human skin tissues at eight wavelengths and estimated dispersion relations between 300 and 1600 nm. Phys. Med. Biol. 2006, 51, 1479–1489. [Google Scholar] [CrossRef] [Green Version]
  55. Tsui, S.Y.; Wang, C.Y.; Huang, T.H.; Sung, K.B. Modelling spatially-resolved diffuse reflectance spectra of a multi-layered skin model by artificial neural networks trained with Monte Carlo simulations. Biomed. Opt. Express 2018, 9, 1531–1544. [Google Scholar] [CrossRef] [Green Version]
  56. Alerstam, E.; Svensson, T.; Andersson-Engels, S. CUDAMCML: User Manual and Implementation Notes. 2009. Available online: http://www.lth.se/fileadmin/atomfysik/Biophotonics/Software/CUDAMCML.pdf (accessed on 1 October 2019).
  57. Sun, C.; Aernouts, B.; Saeys, W. Bridging the gap between measurement-based and simulation-based metamodels for deriving bulk optical properties from spatially-resolved reflectance profiles: Effect of illumination and detection geometry. Opt. Express 2021, 29, 15882–15905. [Google Scholar] [CrossRef]
  58. Hennessy, R.; Goth, W.; Sharma, M.; Markey, M.K.; Tunnell, J.W. Effect of probe geometry and optical properties on the sampling depth for diffuse reflectance spectroscopy. J. Biomed. Opt. 2014, 19, 107002. [Google Scholar] [CrossRef] [PubMed] [Green Version]
  59. Greening, G.; Mundo, A.; Rajaram, N.; Muldoon, T.J. Sampling depth of a diffuse reflectance spectroscopy probe for in-vivo physiological quantification of murine subcutaneous tumor allografts. J. Biomed. Opt. 2018, 23, 085006. [Google Scholar] [CrossRef] [PubMed] [Green Version]
  60. Yudovsky, D.; Pilon, L. Rapid and accurate estimation of blood saturation, melanin content, and epidermis thickness from spectral diffuse reflectance. Appl. Opt. 2010, 49, 1707–1719. [Google Scholar] [CrossRef] [PubMed] [Green Version]
  61. Sharma, M.; Hennessy, R.; Markey, M.K.; Tunnell, J.W. Verification of a two-layer inverse Monte Carlo absorption model using multiple source-detector separation diffuse reflectance spectroscopy. Biomed. Opt. Express 2014, 5, 40–53. [Google Scholar] [CrossRef] [PubMed] [Green Version]
  62. Feng, S.; Zeng, F.A.; Chance, B. Photon migration in the presence of a single defect: A perturbation analysis. Appl. Opt. 1995, 34, 3826–3837. [Google Scholar] [CrossRef]
  63. Jonasson, H.; Fredriksson, I.; Bergstrand, S.; Östgren, C.J.; Larsson, M.; Strömberg, T. In vivo characterization of light scattering properties of human skin in the 475- to 850-nm wavelength range in a Swedish cohort. J. Biomed. Opt. 2018, 23, 121608. [Google Scholar] [CrossRef] [Green Version]
  64. Jacques, S.L. Optical assessment of cutaneous blood volume depends on the vessel size distribution: A computer simulation study. J. Biophotonics 2010, 3, 75–81. [Google Scholar]
  65. Zhu, C.; Liu, Q. Validity of the semi-infinite tumor model in diffuse reflectance spectroscopy for epithelial cancer diagnosis: A Monte Carlo study. Opt. Express 2011, 19, 17799–17812. [Google Scholar] [CrossRef] [PubMed]
  66. Palmer, G.M.; Ramanujam, N. Monte Carlo-based inverse model for calculating tissue optical properties. Part I: Theory and validation on synthetic phantoms. Appl. Opt. 2006, 45, 1062–1071. [Google Scholar] [CrossRef] [PubMed]
  67. Cen, H.; Lu, R.; Dolan, K. Optimization of inverse algorithm for estimating the optical properties of biological materials using spatially-resolved diffuse reflectance. Inverse Probl. Sci. Eng. 2010, 18, 853–872. [Google Scholar] [CrossRef]
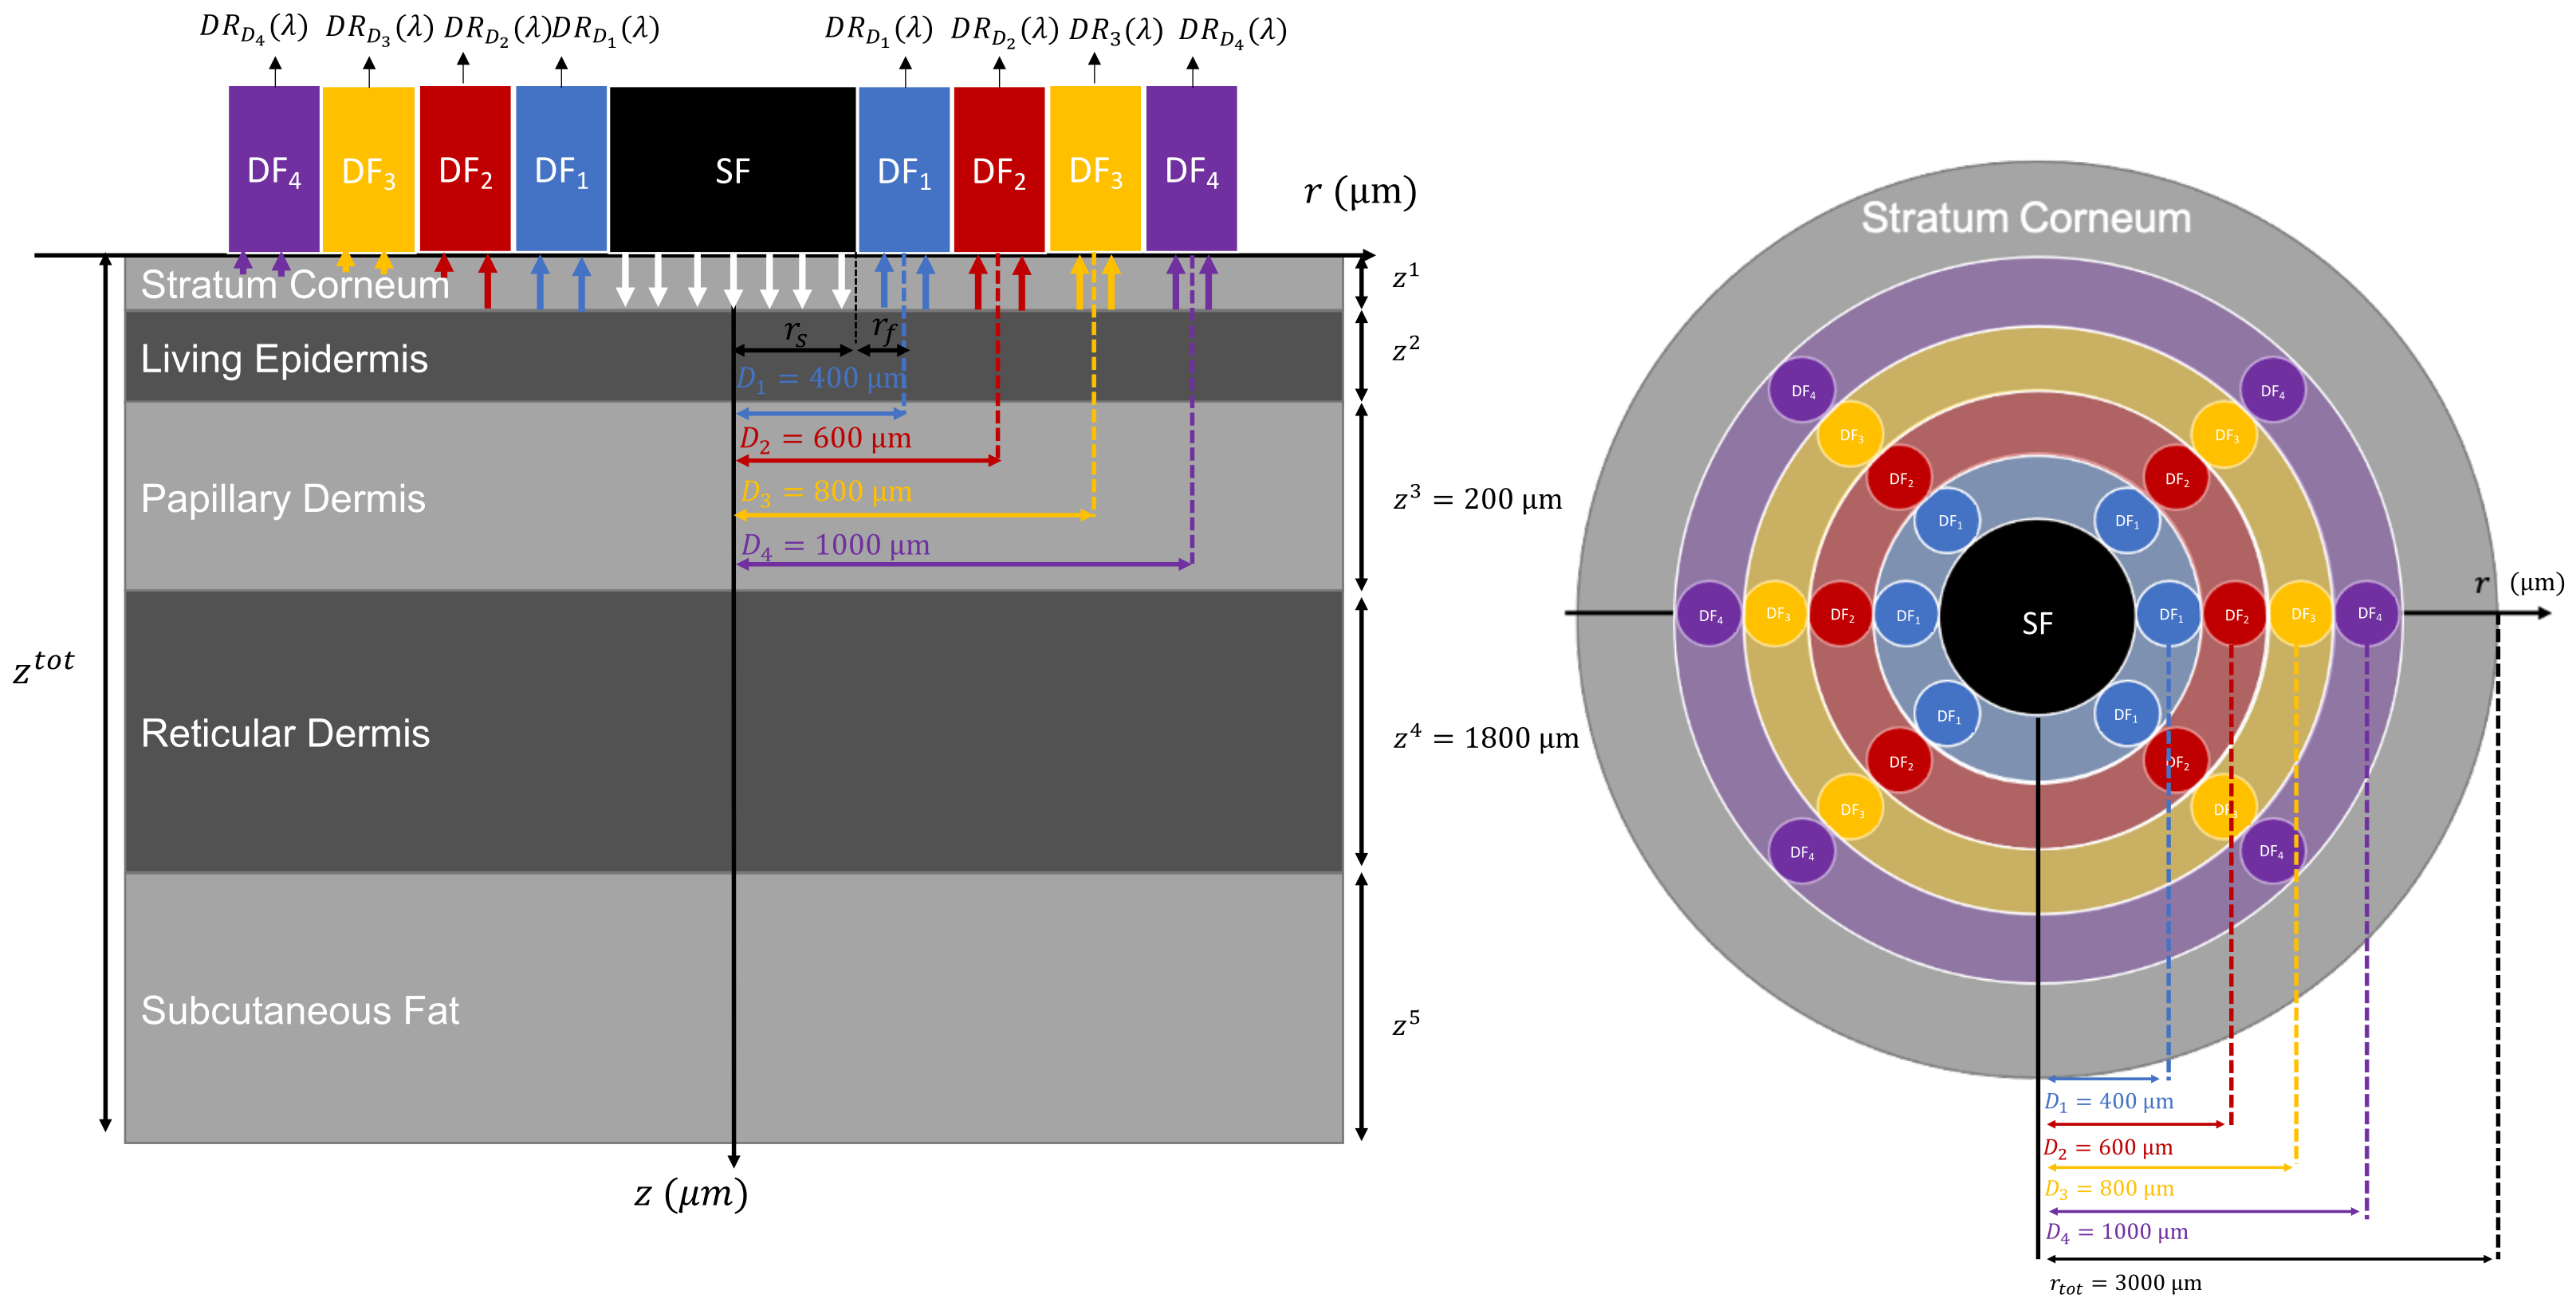
Figure 1. Schematic representation of the SR-DRS fiber probe geometry and of the five-layer skin implemented for simulations: vertical section view (left) and top view (right). SF, DF and D R D n ( λ ) stand for Source Fiber, Detection Fiber and Diffuse Reflectance spectrum at the distance D n ( n { 1 , 2 , 3 , 4 } ), respectively.
Photonics 08 00444 g001
Figure 2. Absorption ( μ a solid line) and scattering ( μ s dashed-dot line) coefficients of each layer (SC, LE, PD, RD and SF in blue, red orange, violet and green, respectively) of the designed numerical medium set for skin phototype I and mean dermal blood volume fraction. The spectral curves of the LE absorption coefficient μ a 2 as a function of skin phototypes I, II, III and IV appear in the top-right subplot, while middle-right and bottom-right subplots focus on the dermal blood volume fraction impact over the PD and RD absorption coefficient μ a 3 and μ a 4 , as well as their scattering coefficient μ s 3 and μ s 4 . LE: living epidermis; SC: stratum corneum; PD: papillary dermis; RD: reticular dermis; SF: subcutaneous fat.
Photonics 08 00444 g002
Figure 3. DR spectra simulated for the four SD distances (left). The considered medium is the healthy skin model with intermediate thicknesses, mean dermal blood content and phototype I. The four other figures (right) show the superposition of the normalized D R ¯ c l i n (dashed line) clinical spectra from SpectroLive acquisition on a patient’s wrist, within a confidence interval calculated as D R ¯ c l i n ± s t d (dash-dotted line), as well as the estimated D R s i m (continuous line) from our simulation.
Photonics 08 00444 g003
Figure 4. Normalized probed depth histograms of weighted detected DR photons at λ = 565 nm (central wavelength of the spectrum 365–765 nm) for the four SD distances. Vertical black lines represent the borders between layers. Colored vertical lines represent, from left to right, the first quartile (dashed-dot), the median (solid) and the third quartile (dashed-dot). The considered medium is the healthy skin model with intermediate thicknesses, phototype I and mean blood dermal content.
Photonics 08 00444 g004
Figure 5. Maximal probed depth values of detected photons in the healthy skin model with intermediate thicknesses of SC and LE layers and mean dermal blood content, as a function of wavelength and SD distances. Solid and dashed-dot lines represent median and quartiles values, respectively. The right column and the black horizontal lines illustrate the position of the border between the layers (SC: stratum corneum; LE: living epidermis; PD: papillary dermis; RD: reticular dermis; SF: subcutaneous fat (not represented here)).
Photonics 08 00444 g005
Figure 6. DR spectra (left) and maximum probed depth (right) for the thin (dotted line), mean (dashed) and thick epidermal thickness media (dashed-dot). The SD distance D n is indicated by the color code. The three right columns represent the position of the border between the layers of each skin model (thin, mean, thick).
Photonics 08 00444 g006
Figure 7. DR spectra (left) and maximum probed depth (right) for the thin (dotted line), mean (dashed) and thick dermal thickness media (dashed-dot). The SD distance D n is indicated by the color code. The three right columns represent the position of the border between the layers of each skin model (thin, mean, thick).
Photonics 08 00444 g007
Figure 8. DR spectra (left) and maximum probed depth (right) for the simulated skin models: healthy (dotted line), hyperkeratosed (dashed) and ulcerated (dashed-dot). The SD distance D n is indicated by the color code. The three right columns represent the position of the border between the layers of each skin model (healthy, hyperkeratozed, ulcerated).
Photonics 08 00444 g008
Figure 9. DR spectra (left) and maximum probed depth (right) for the four phototypes: I (line), II (dashed), III (dashed-dot) and IV (dotted). The SD distance D n is indicated by the color code. The right column represents the position of the border between the layers for the common geometrical configuration.
Photonics 08 00444 g009
Figure 10. DR spectra (left) and maximum probed depth (right) for the three medium configurations of minimum (line), mean (dotted) and maximal (dashed) dermal blood contents. The SD distance D n is indicated by the color code. The right column represent the position of the border between the layers for the common geometrical configuration.
Photonics 08 00444 g010
Figure 11. DR signal decomposition according to Equation (4) for the distances D 1 D 4 in the healthy skin model with intermediate thicknesses of SC and LE layers, mean dermal blood content and phototype I. The correspondence between symbols and layers considered is indicated in the legend on the right.
Photonics 08 00444 g011
Figure 12. Weight of each layer (from SC at the top to SF at the bottom) in DR signal according to Equation (5) for distances D 1 D 4 in the healthy skin model with intermediate thicknesses of SC and LE layers, mean dermal blood content and phototype I. The correspondence between symbols and layers is still the same as indicated in Figure 11.
Photonics 08 00444 g012
Table 1. Values of the geometrical and spectral source–detector features for the SR-DRS simulation. S F : source fiber; D F : detection fiber; D n : SD distance; r S F / D F : fiber radius.
[ λ min , λ max ] (nm) D n ( μ m) NA SF / DF r SF ( μ m) r DF ( μ m)
[ 365 , 765 ] 400, 600, 800, 10000.22300100
Table 2. Values of the SC (stratum corneum) and LE (living epidermis) layer thicknesses implemented in our skin model to simulate five different healthy skin and carcinoma conditions.
Skin CategoriesSC Thickness z 1 ( μ m)LE Thickness z 2 ( μ m)
HealthySmallest thicknesses1060
Mean thicknesses2090
Highest thicknesses30120
CarcinomaUlcerated090
Hyperkeratosed30090
Table 3. Values of the volume fraction of melanosome in the living epidermis used for simulating skin phototypes I to IV.
Skin TypeVery FairFairModerately FairDark Skin
PhototypeIIIIIIIV
Melanosome volume fraction f v , m e l 2 0.010.040.080.11
Table 4. Values of the volume fraction of blood in the papillary dermis (PD) and reticular dermis (RD) used for simulating a dermis with more or less blood content.
Blood ContentWeakMeanStrong
PD blood volume fraction f v , b l o o d 3 0.01440.0240.0336
RD blood volume fraction f v , b l o o d 4 0.0120.020.028
Table 5. Values of the geometrical and optical parameters of our five layer skin model. SC, LE and SF thickness ranges, f v , m e l k melanosome fraction range in LE and f v , b l o o d k blood fraction in dermis layers refer to Table 2, Table 3 and Table 4, respectively.
Name (Unit)SymbolSCLEPDRDSF
Absorption parameters
Volume fraction
(dimensionless)
f v , w a t e r k 0.350.60.50.70.05
f v , l i p i d s k 0.20.150.1730.1730.753
f v , β c a r o t e n k 0.450.240.3030.1250.141
f v , m e l k 0See Table 3000
f v , b l o o d k 00See Table 4See Table 40.005
Concentration
(g/L)
c β c a r o t e n k 2.1× 10 4 2.1× 10 4 7.0× 10 5 7.0× 10 5 0
c e u m k 080000
c p h e k 012000
c b i l i r u b i n k 000.050.050.05
c H b O 2 / H b k 00150150150
Scattering parameters
Volume fraction f v , b l o o d k 00See Table 4See Table 40.05
Vessel diam. (cm) d v e s s e l s k // 6.0× 10 4 1.5× 10 3 7.5× 10 3
Scat. coeff. (cm 1 ) μ s , 577 k 400300120120130
Other optical properties and medium geometry
Layer thick. ( μ m) z k See Table 2See Table 22001800See Table 2
Anisotropy factor g k 0.920.750.720.720.9
Refractive index n k 1.551.441.391.381.34
Table 6. Technical characteristics of the GPU-based parallel computing and MC simulation configurations.
Photon NumberBlock NumberThreads per Block Δ T sim (s) w th t th (s)
81 × 10 8 28320[900–1500] w 0 × 10 4 1
Publisher’s Note: MDPI stays neutral with regard to jurisdictional claims in published maps and institutional affiliations.