Integrated Ammonia Sensor Using a Telecom Photonic Integrated Circuit and a Hollow Core Fiber

 , , ,
, , , 
Abstract
1. Introduction
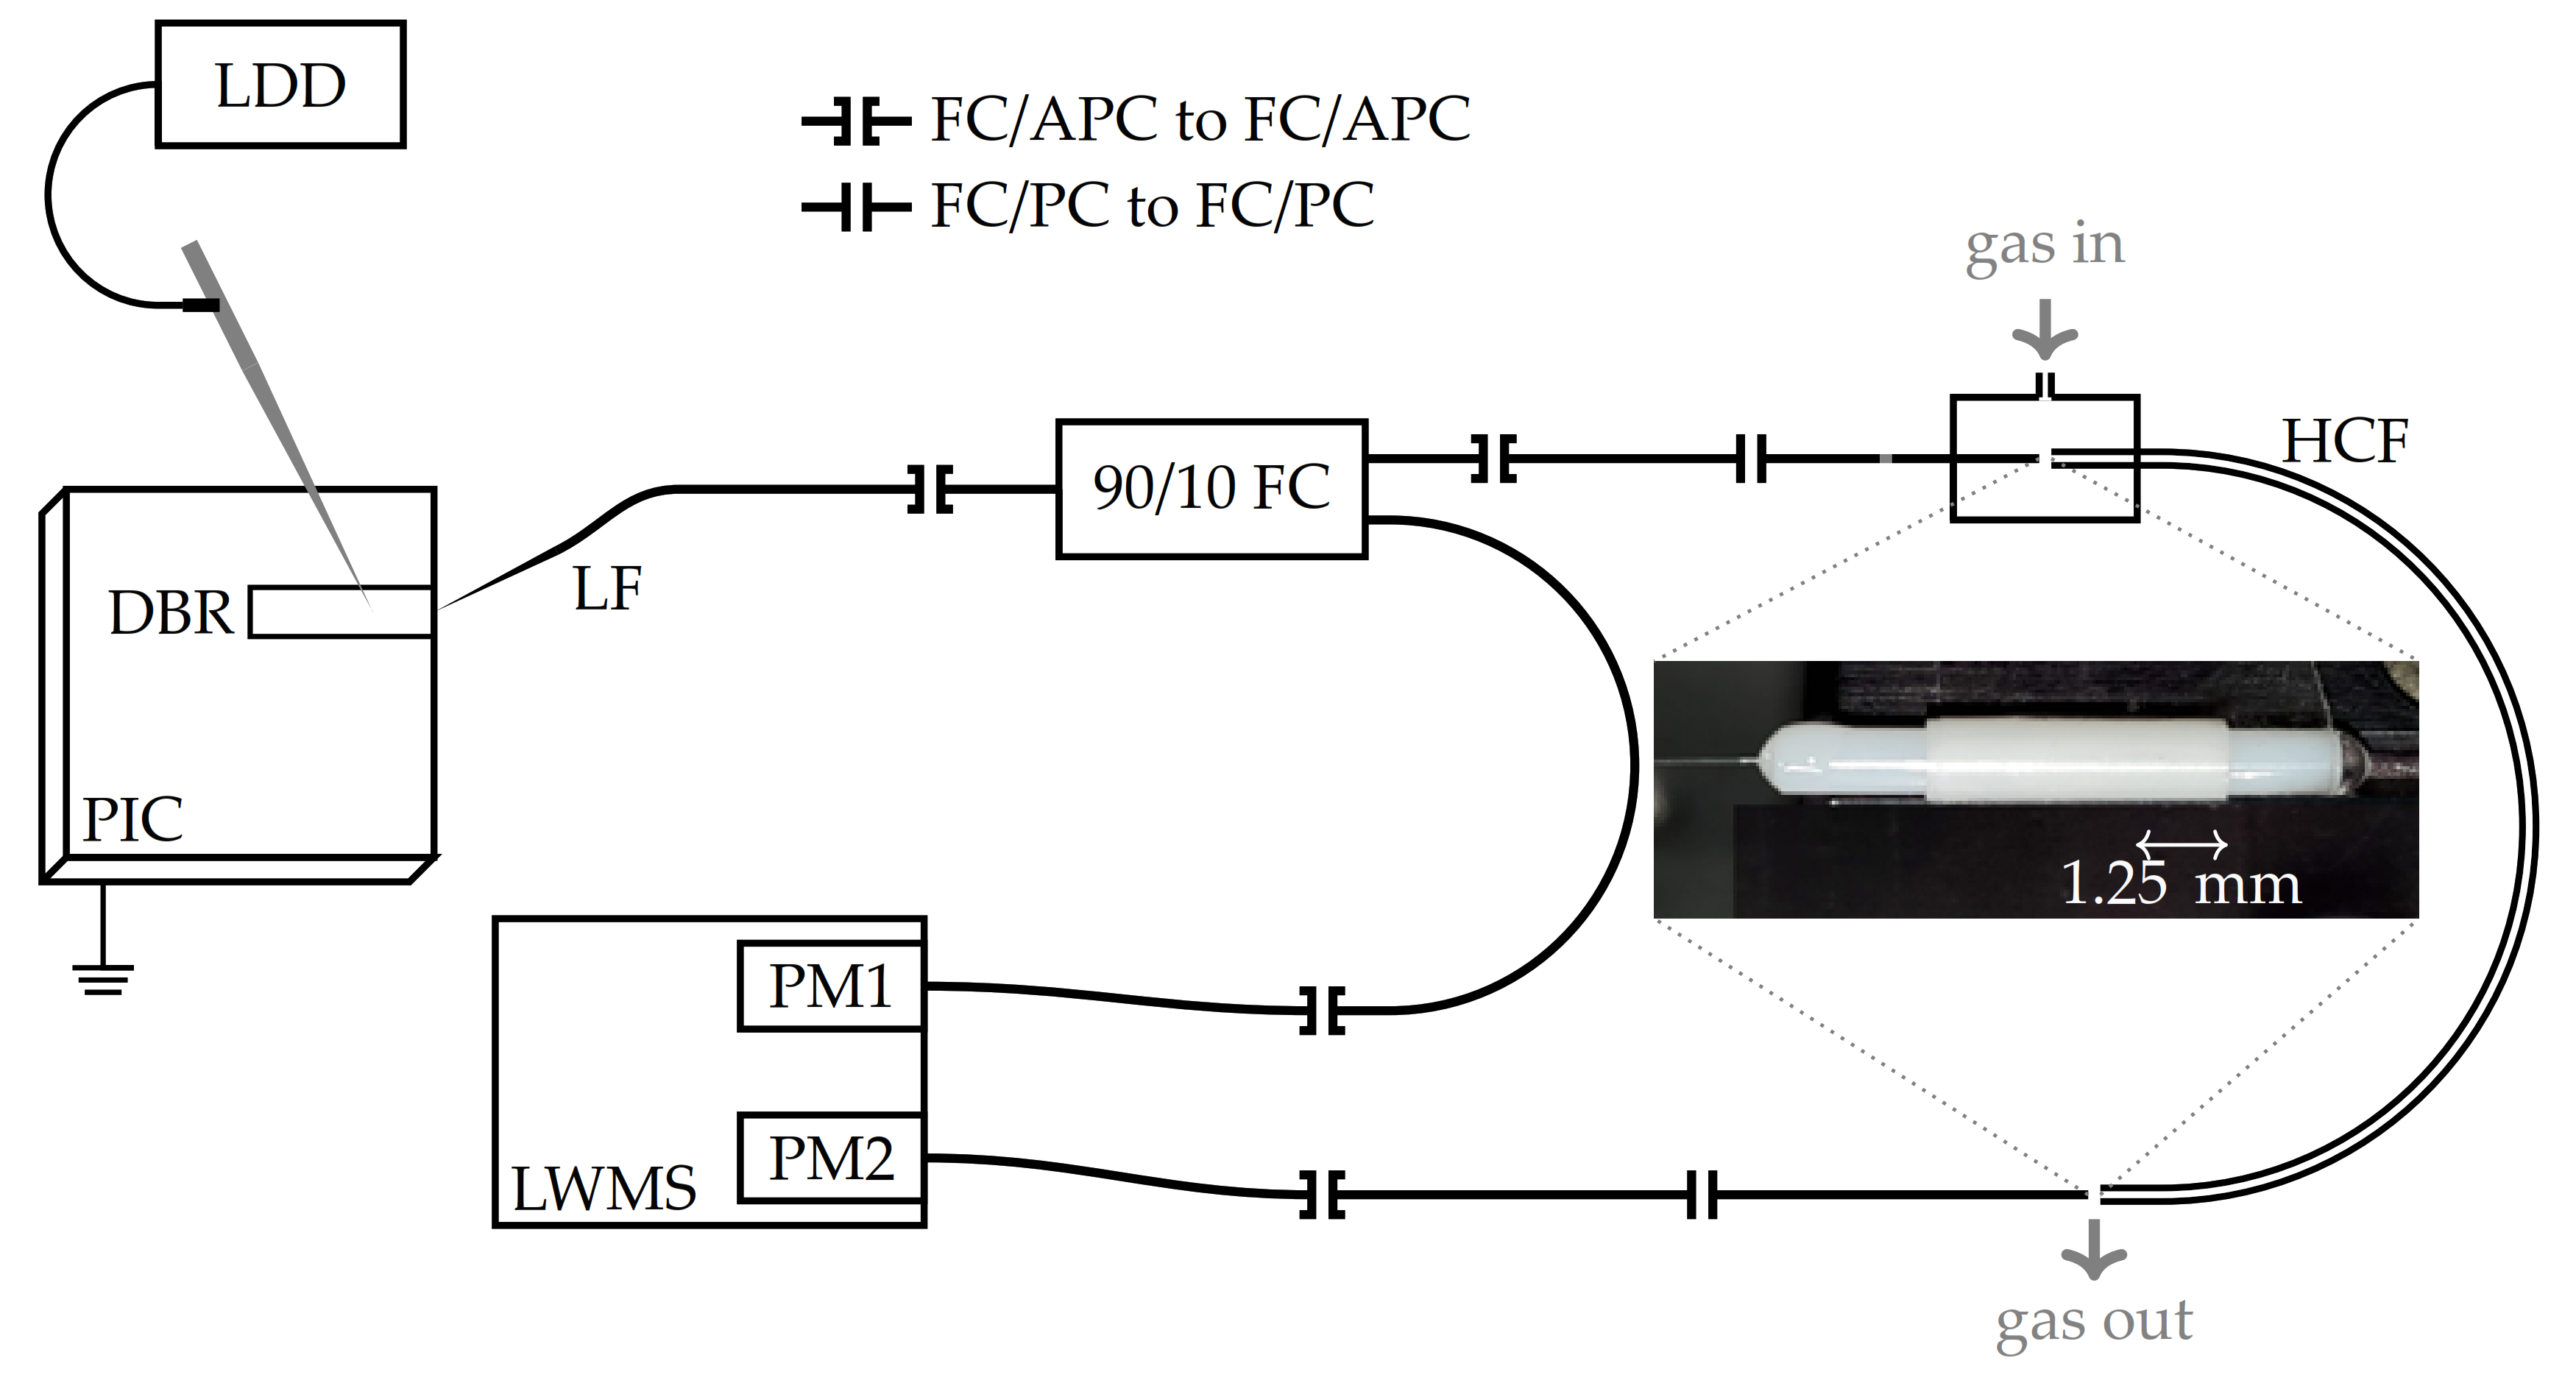
2. Setup and Components
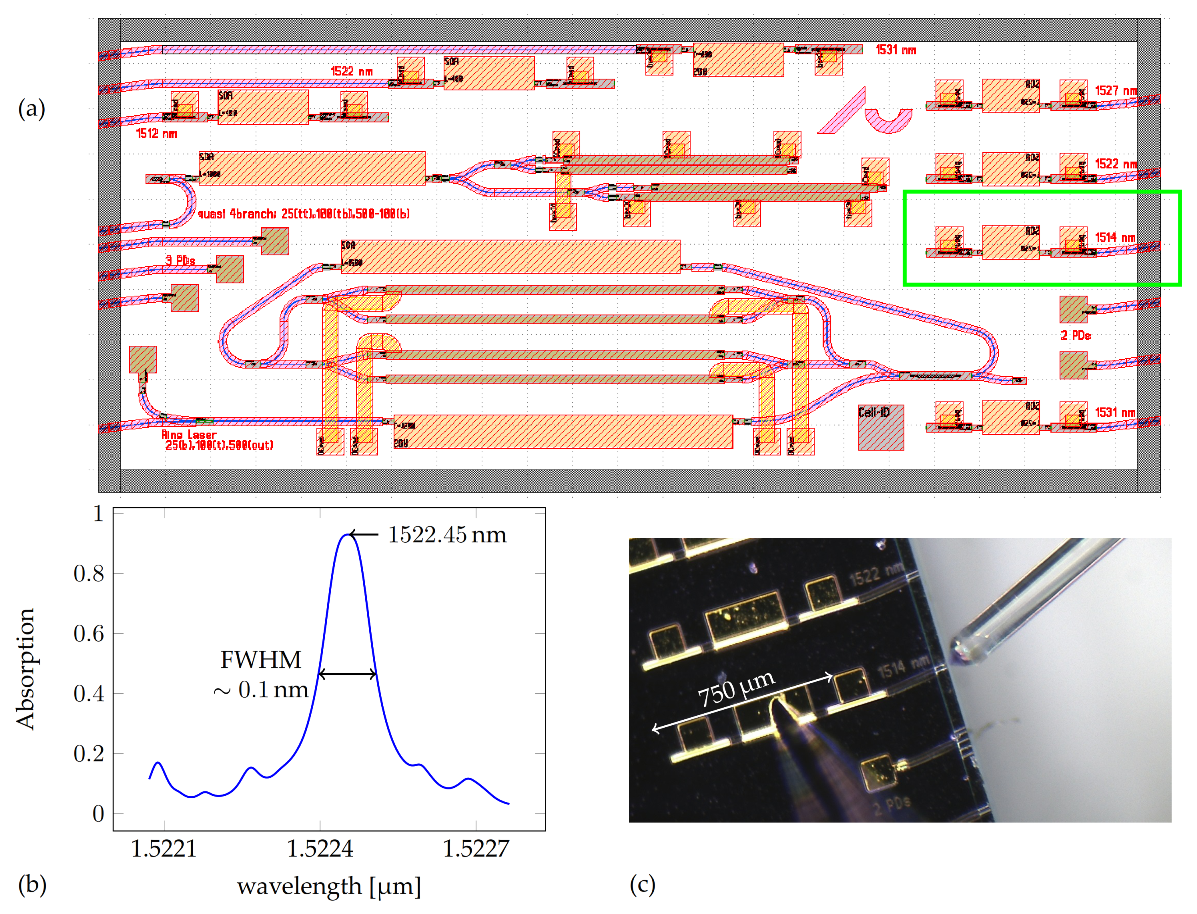
2.1. PIC
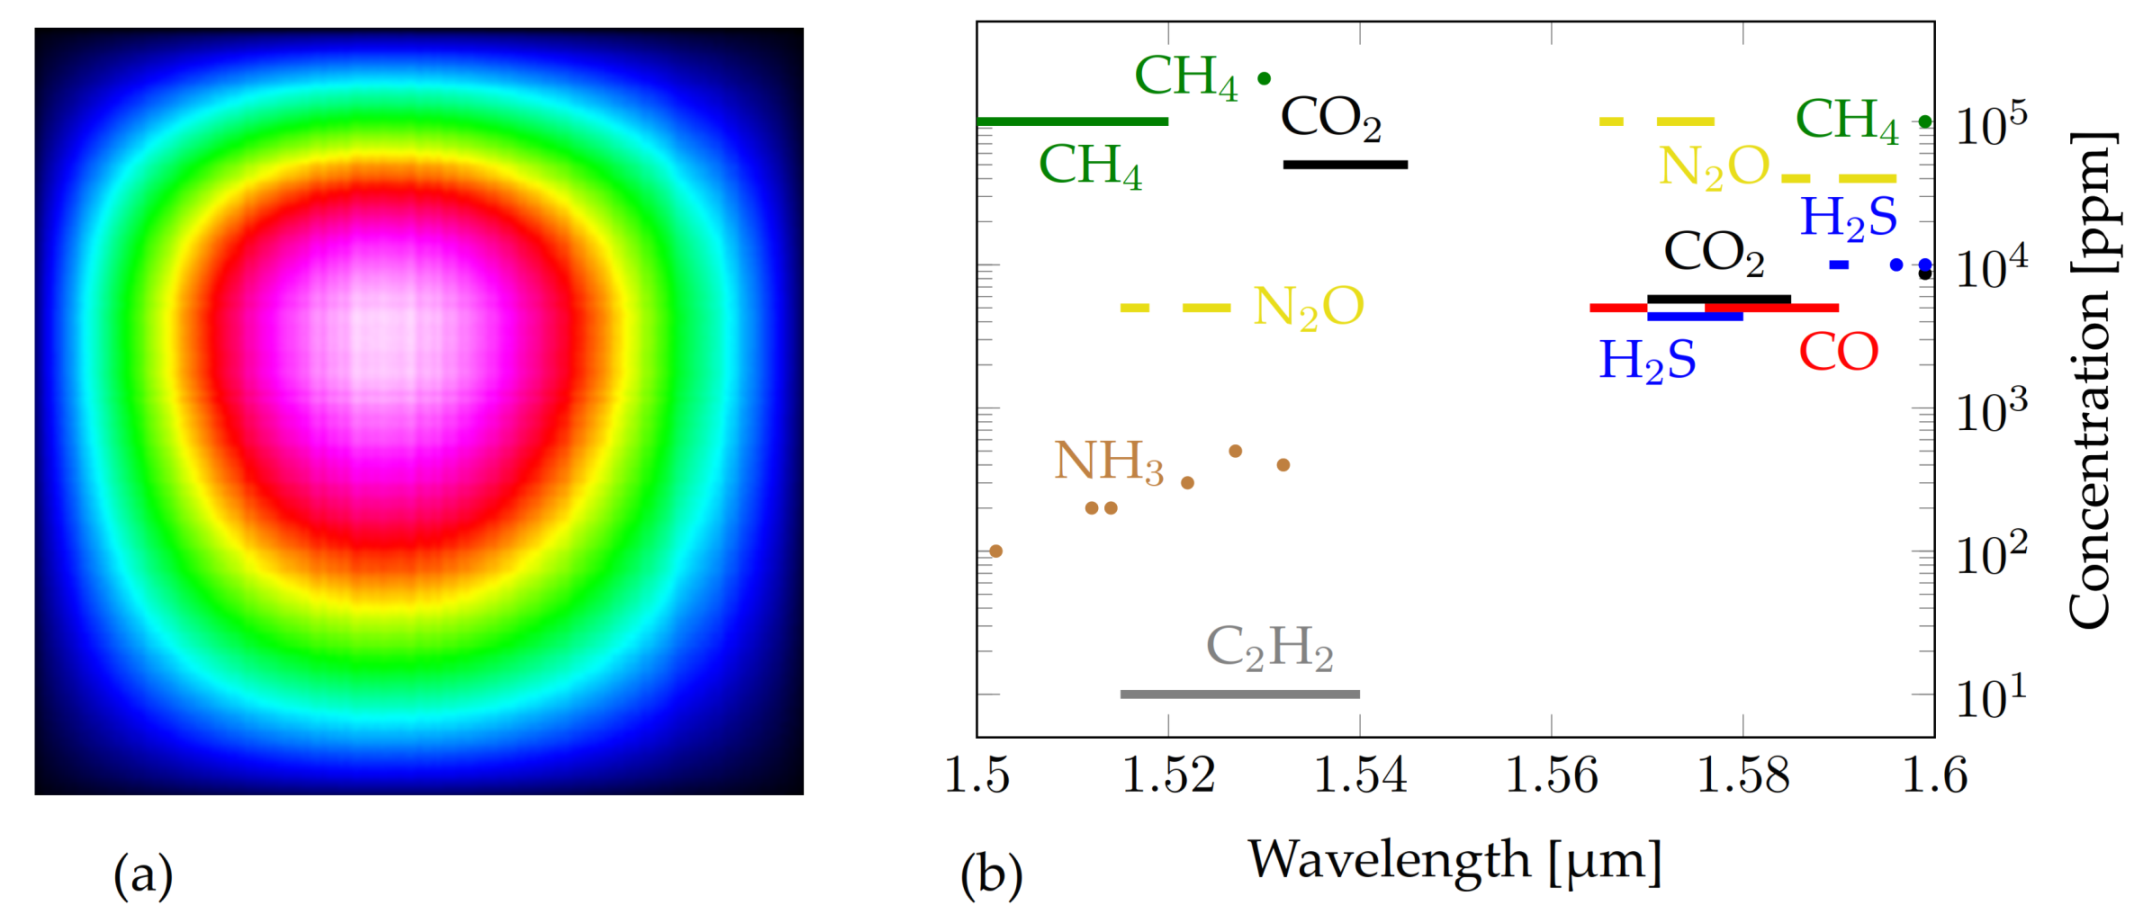
2.2. HCF
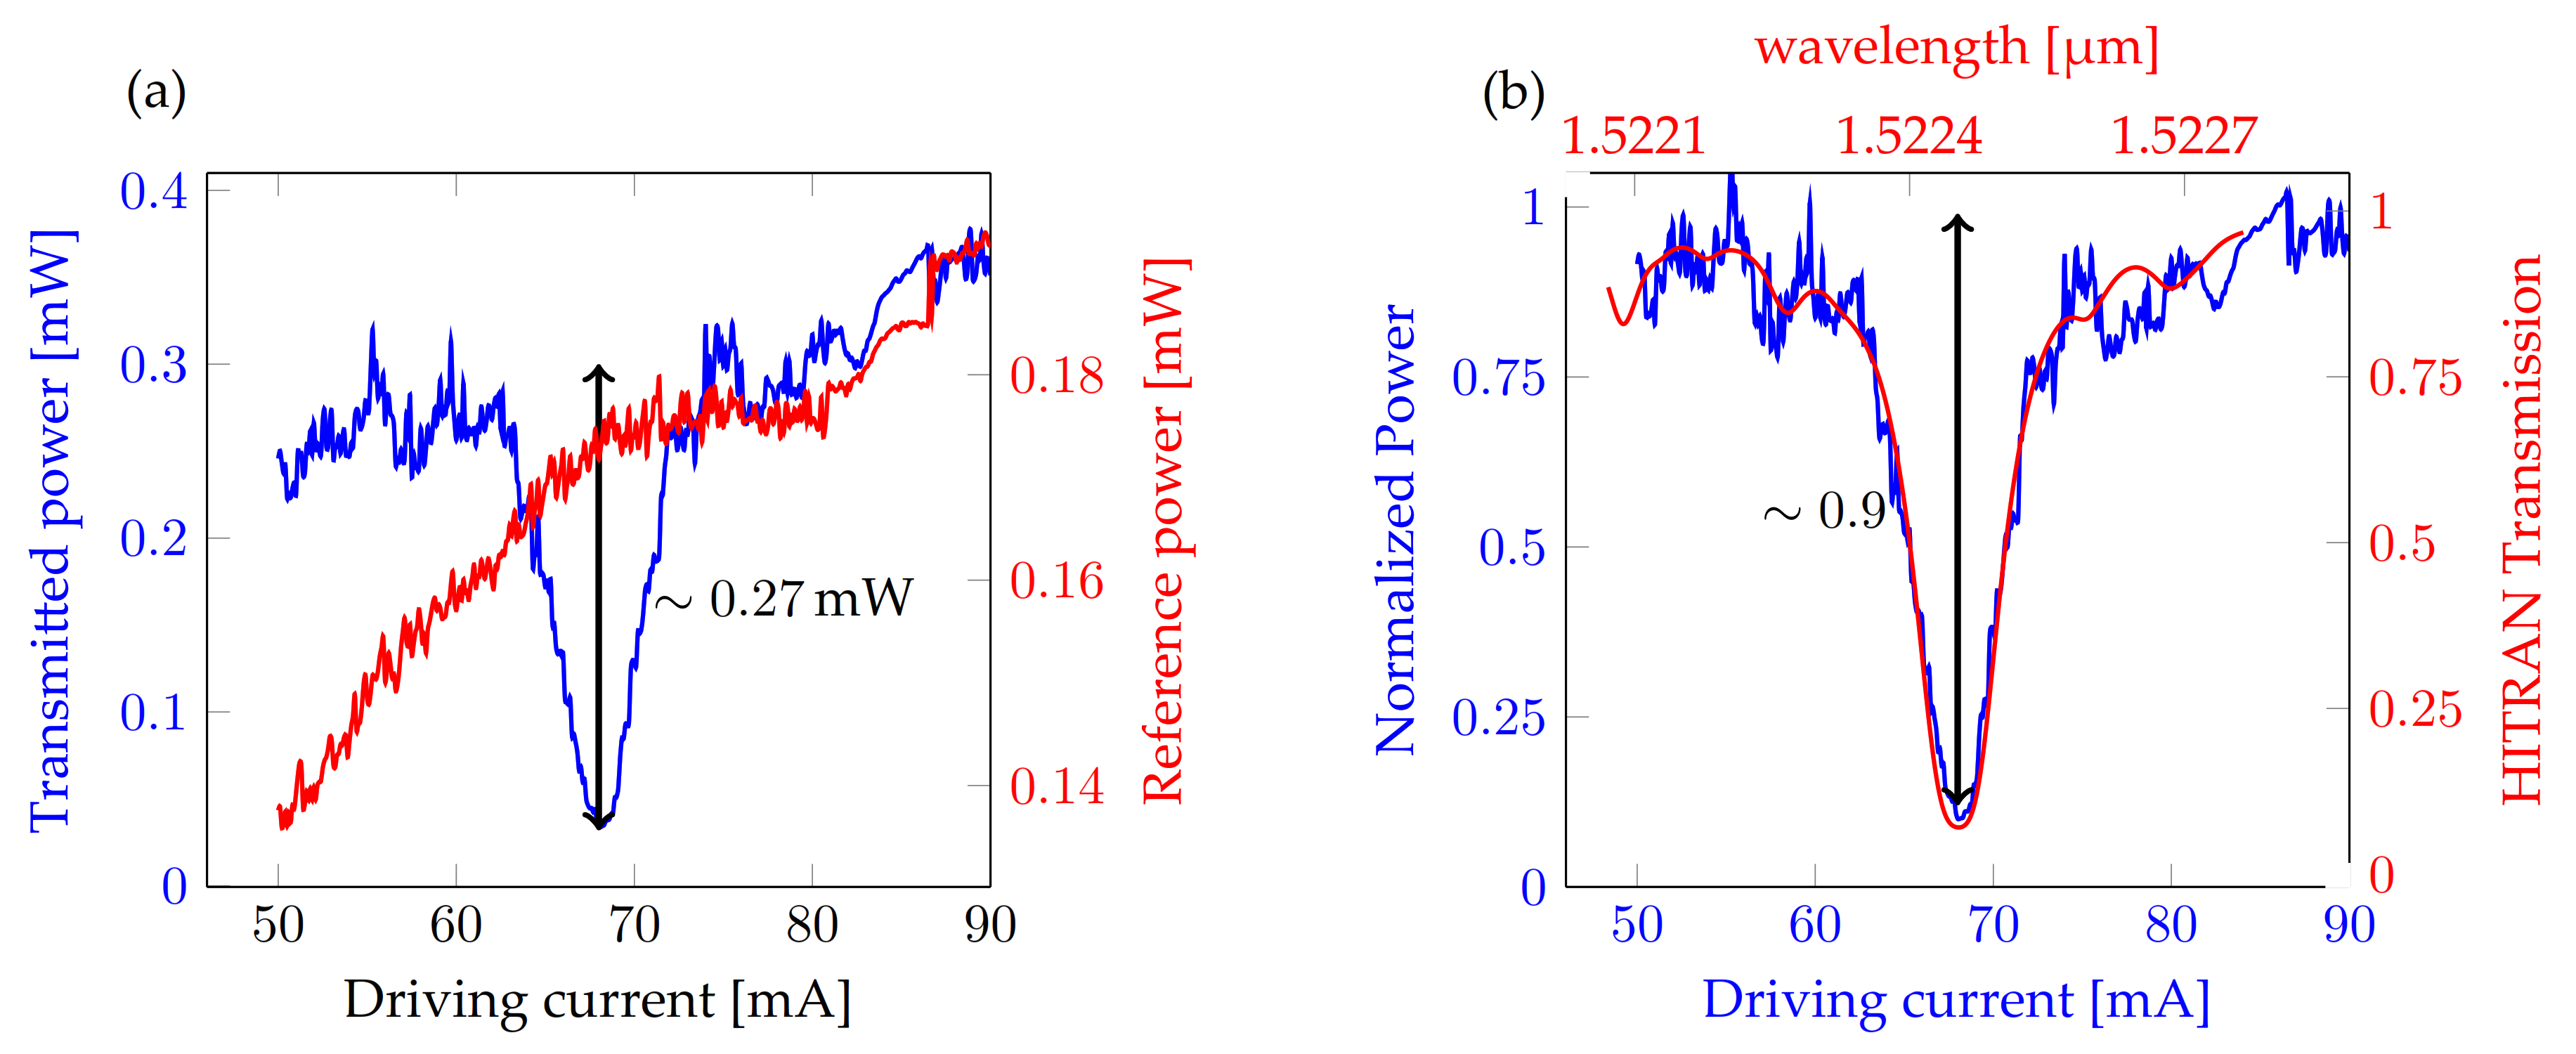
3. Results
4. Conclusions
Author Contributions
Funding
Conflicts of Interest
Abbreviations
| PIC | photonic integrated circuit |
| HCF | hollow-core fiber |
| SMF | single-mode fiber |
| LMWS | lightwave measurement system |
| DBR | distributed Bragg reflector |
| SOA | semiconductor optical amplifier |
| PD | photodetector |
| FWHM | full width at half-maximum |
| HCPBG | hollow core photonic band gap |
| SMSR | side mode suppression ratio |
| RAM | residual amplitude modulation |
| SNR | signal to noise ratio |
| WTL | widely tunable laser |
References
- Aneja, V.P.; Schlesinger, W.H.; Erisman, J.W. Effects of agriculture upon the air quality and climate: Research, policy, and regulations. Environ. Sci. Technol. 2009, 43, 4234–4240. [Google Scholar] [CrossRef] [PubMed]
- Claps, R.; Englich, F.V.; Leleux, D.P.; Richter, D.; Tittel, F.K.; Curl, R.F. Ammonia detection by use of near-infrared diode-laser-based overtone spectroscopy. Appl. Opt. 2001, 40, 4387–4394. [Google Scholar] [CrossRef] [PubMed]
- Timmer, B.; Olthuis, W.; van den Berg, A. Ammonia sensors and their applications—A review. Sens. Actuators B 2005, 107, 666–677. [Google Scholar] [CrossRef]
- Liu, X.; Cheng, S.; Liu, H.; Hu, S.; Zhang, D.; Ning, H. A survey on gas sensing technology. Sensors 2012, 12, 9635–9665. [Google Scholar] [CrossRef] [PubMed]
- Yu, R.; Chen, Y.; Shui, L.; Xiao, L. Hollow-core photonic crystal fiber gas sensing. Sensors 2020, 20, 2996. [Google Scholar] [CrossRef] [PubMed]
- Hänsel, A.; Heck, M. Feasibility of telecom-wavelength photonic integrated circuits for gas sensors. Sensors 2018, 18, 2870. [Google Scholar] [CrossRef] [PubMed]
- Hänsel, A.; Heck, M.J.R. Opportunities for photonic integrated circuits in optical gas sensors. J. Phys. Photonics 2020, 2, 012002. [Google Scholar] [CrossRef]
- Tombez, L.; Zhang, E.J.; Orcutt, J.S.; Kamlapurkar, S.; Green, W.M.J. Methane absorption spectroscopy on a silicon photonic chip. Optica 2017, 4, 1322–1325. [Google Scholar] [CrossRef]
- Hänsel, A.; Heck, M.J.R. Widely tunable laser on an InP photonic integrated circuit. IEEE Photonics Technol. Lett. 2020, 32, 105–108. [Google Scholar] [CrossRef]
- Latkowski, S.; Hänsel, A.; Bhattacharya, N.; de Vries, T.; Augustin, L.; Williams, K.; Smit, M.; Bente, E. Novel widely tunable monolithically integrated laser source. IEEE Photonics J. 2015, 7, 1–9. [Google Scholar] [CrossRef]
- Latkowski, S.; Hänsel, A.; van Veldhoven, P.J.; D’Agostino, D.; Rabbani-Haghighi, H.; Docter, B.; Bhattacharya, N.; Thijs, P.J.A.; Ambrosius, H.P.M.M.; Smit, M.K.; et al. Monolithically integrated widely tunable laser source operating at 2 µm. Optica 2016, 3, 1412–1417. [Google Scholar] [CrossRef]
- Harvard-Smithsonian Center for Astrophysics (CFA) and V.E. Zuev Institute of Atmospheric Optics (IAO). HITRAN on the web. Available online: http://hitran.iao.ru (accessed on 18 June 2020).
- Fan, Y. Semiconductor-Glass Waveguide Hybrid Lasers with Ultra-High Spectral Purity. Ph.D. Thesis, University of Twente, Enschede, The Netherlands, 2017. [Google Scholar] [CrossRef]
- Jaworski, P.; Kozioł, P.; Krzempek, K.; Wu, D.; Yu, F.; Bojęś, P.; Dudzik, G.; Liao, M.; Abramski, K.; Knight, J. Antiresonant hollow-core fiber-based dual gas sensor for detection of methane and carbon dioxide in the Near- and Mid-Infrared regions. Sensors 2020, 20, 3813. [Google Scholar] [CrossRef] [PubMed]
- Photonics, N. Hollow Core Photonic Crystal Fibers. Available online: https://www.nktphotonics.com/lasers-fibers/product/hollow-core-photonic-crystal-fibers/ (accessed on 18 June 2020).
- Jin, W.; Ho, H.; Cao, Y.; Ju, J.; Qi, L. Gas detection with micro-and nano-engineered optical fibers. Opt. Fiber Technol. 2013, 19, 741–759. [Google Scholar] [CrossRef]
- Adamu, A.I.; Dasa, M.K.; Bang, O.; Markos, C. Multi-species continuous gas detection with supercontinuum laser at telecommunication wavelength. IEEE Sens. J. 2020, 20, 10591–10597. [Google Scholar] [CrossRef]
- Adamu, A.I.; Dasa, M.K.; Habib, M.S.; Amezcua-Correa, R.; Bang, O.; Markos, C. Towards an all-fiber system for detection and monitoring of ammonia. In Proceedings of the Frontiers in Biological Detection: From Nanosensors to Systems XI, San Francisco, CA, USA, 2–7 February 2019; p. 1089506. [Google Scholar] [CrossRef]
- Hieta, T.; Merimaa, M. Spectroscopic Measurement of Air Temperature. Int. J. Thermophys. 2010, 31, 1710–1718. [Google Scholar] [CrossRef]
- Hänsel, A.; Reyes-Reyes, A.; Persijn, S.T.; Urbach, H.P.; Bhattacharya, N. Temperature measurement using frequency comb absorption spectroscopy of CO2. Rev. Sci. Instrum. 2017, 88, 053113. [Google Scholar] [CrossRef] [PubMed]
- Triches, M.; Michieletto, M.; Hald, J.; Lyngsø, J.; Lægsgaard, J.; Bang, O. Optical frequency standard using acetylene-filled hollow-core photonic crystal fibers. Opt. Express 2015, 23, 11227–11241. [Google Scholar] [CrossRef] [PubMed]
- Augustin, L.M.; Santos, R.; den Haan, E.; Kleijn, S.; Thijs, P.J.A.; Latkowski, S.; Zhao, D.; Yao, W.; Bolk, J.; Ambrosius, H.; et al. InP-based generic foundry platform for photonic integrated circuits. IEEE J. Sel. Top. Quantum Electron. 2018, 24, 1–10. [Google Scholar] [CrossRef]


| Element | Loss [dB] | Occurence | Total [dB] |
|---|---|---|---|
| FC/PC-FC/PC | 0.3 | 2 | 0.6 |
| FC/APC-FC/APC | 0.3 | 3 | 0.9 |
| SMF-HCF | 2.1 | 2 | 4.2 |
| chip-fiber | 5 | 1 | 5 |
| 90/10 FC excess loss | 0.15 | 1 | 0.15 |
| Total | 10.85 |
Publisher’s Note: MDPI stays neutral with regard to jurisdictional claims in published maps and institutional affiliations. |
© 2020 by the authors. Licensee MDPI, Basel, Switzerland. This article is an open access article distributed under the terms and conditions of the Creative Commons Attribution (CC BY) license (http://creativecommons.org/licenses/by/4.0/).
Share and Cite
Hänsel, A.; Adamu, A.I.; Markos, C.; Feilberg, A.; Bang, O.; Heck, M.J.R. Integrated Ammonia Sensor Using a Telecom Photonic Integrated Circuit and a Hollow Core Fiber. Photonics 2020, 7, 93. https://doi.org/10.3390/photonics7040093
Hänsel A, Adamu AI, Markos C, Feilberg A, Bang O, Heck MJR. Integrated Ammonia Sensor Using a Telecom Photonic Integrated Circuit and a Hollow Core Fiber. Photonics. 2020; 7(4):93. https://doi.org/10.3390/photonics7040093
Chicago/Turabian StyleHänsel, Andreas, Abubakar Isa Adamu, Christos Markos, Anders Feilberg, Ole Bang, and Martijn J.R. Heck. 2020. "Integrated Ammonia Sensor Using a Telecom Photonic Integrated Circuit and a Hollow Core Fiber" Photonics 7, no. 4: 93. https://doi.org/10.3390/photonics7040093
APA StyleHänsel, A., Adamu, A. I., Markos, C., Feilberg, A., Bang, O., & Heck, M. J. R. (2020). Integrated Ammonia Sensor Using a Telecom Photonic Integrated Circuit and a Hollow Core Fiber. Photonics, 7(4), 93. https://doi.org/10.3390/photonics7040093