Characterization of Absorption Losses and Transient Thermo-Optic Effects in a High-Power Laser System

 , , ,
, , ,
Abstract
1. Introduction
2. Experiments
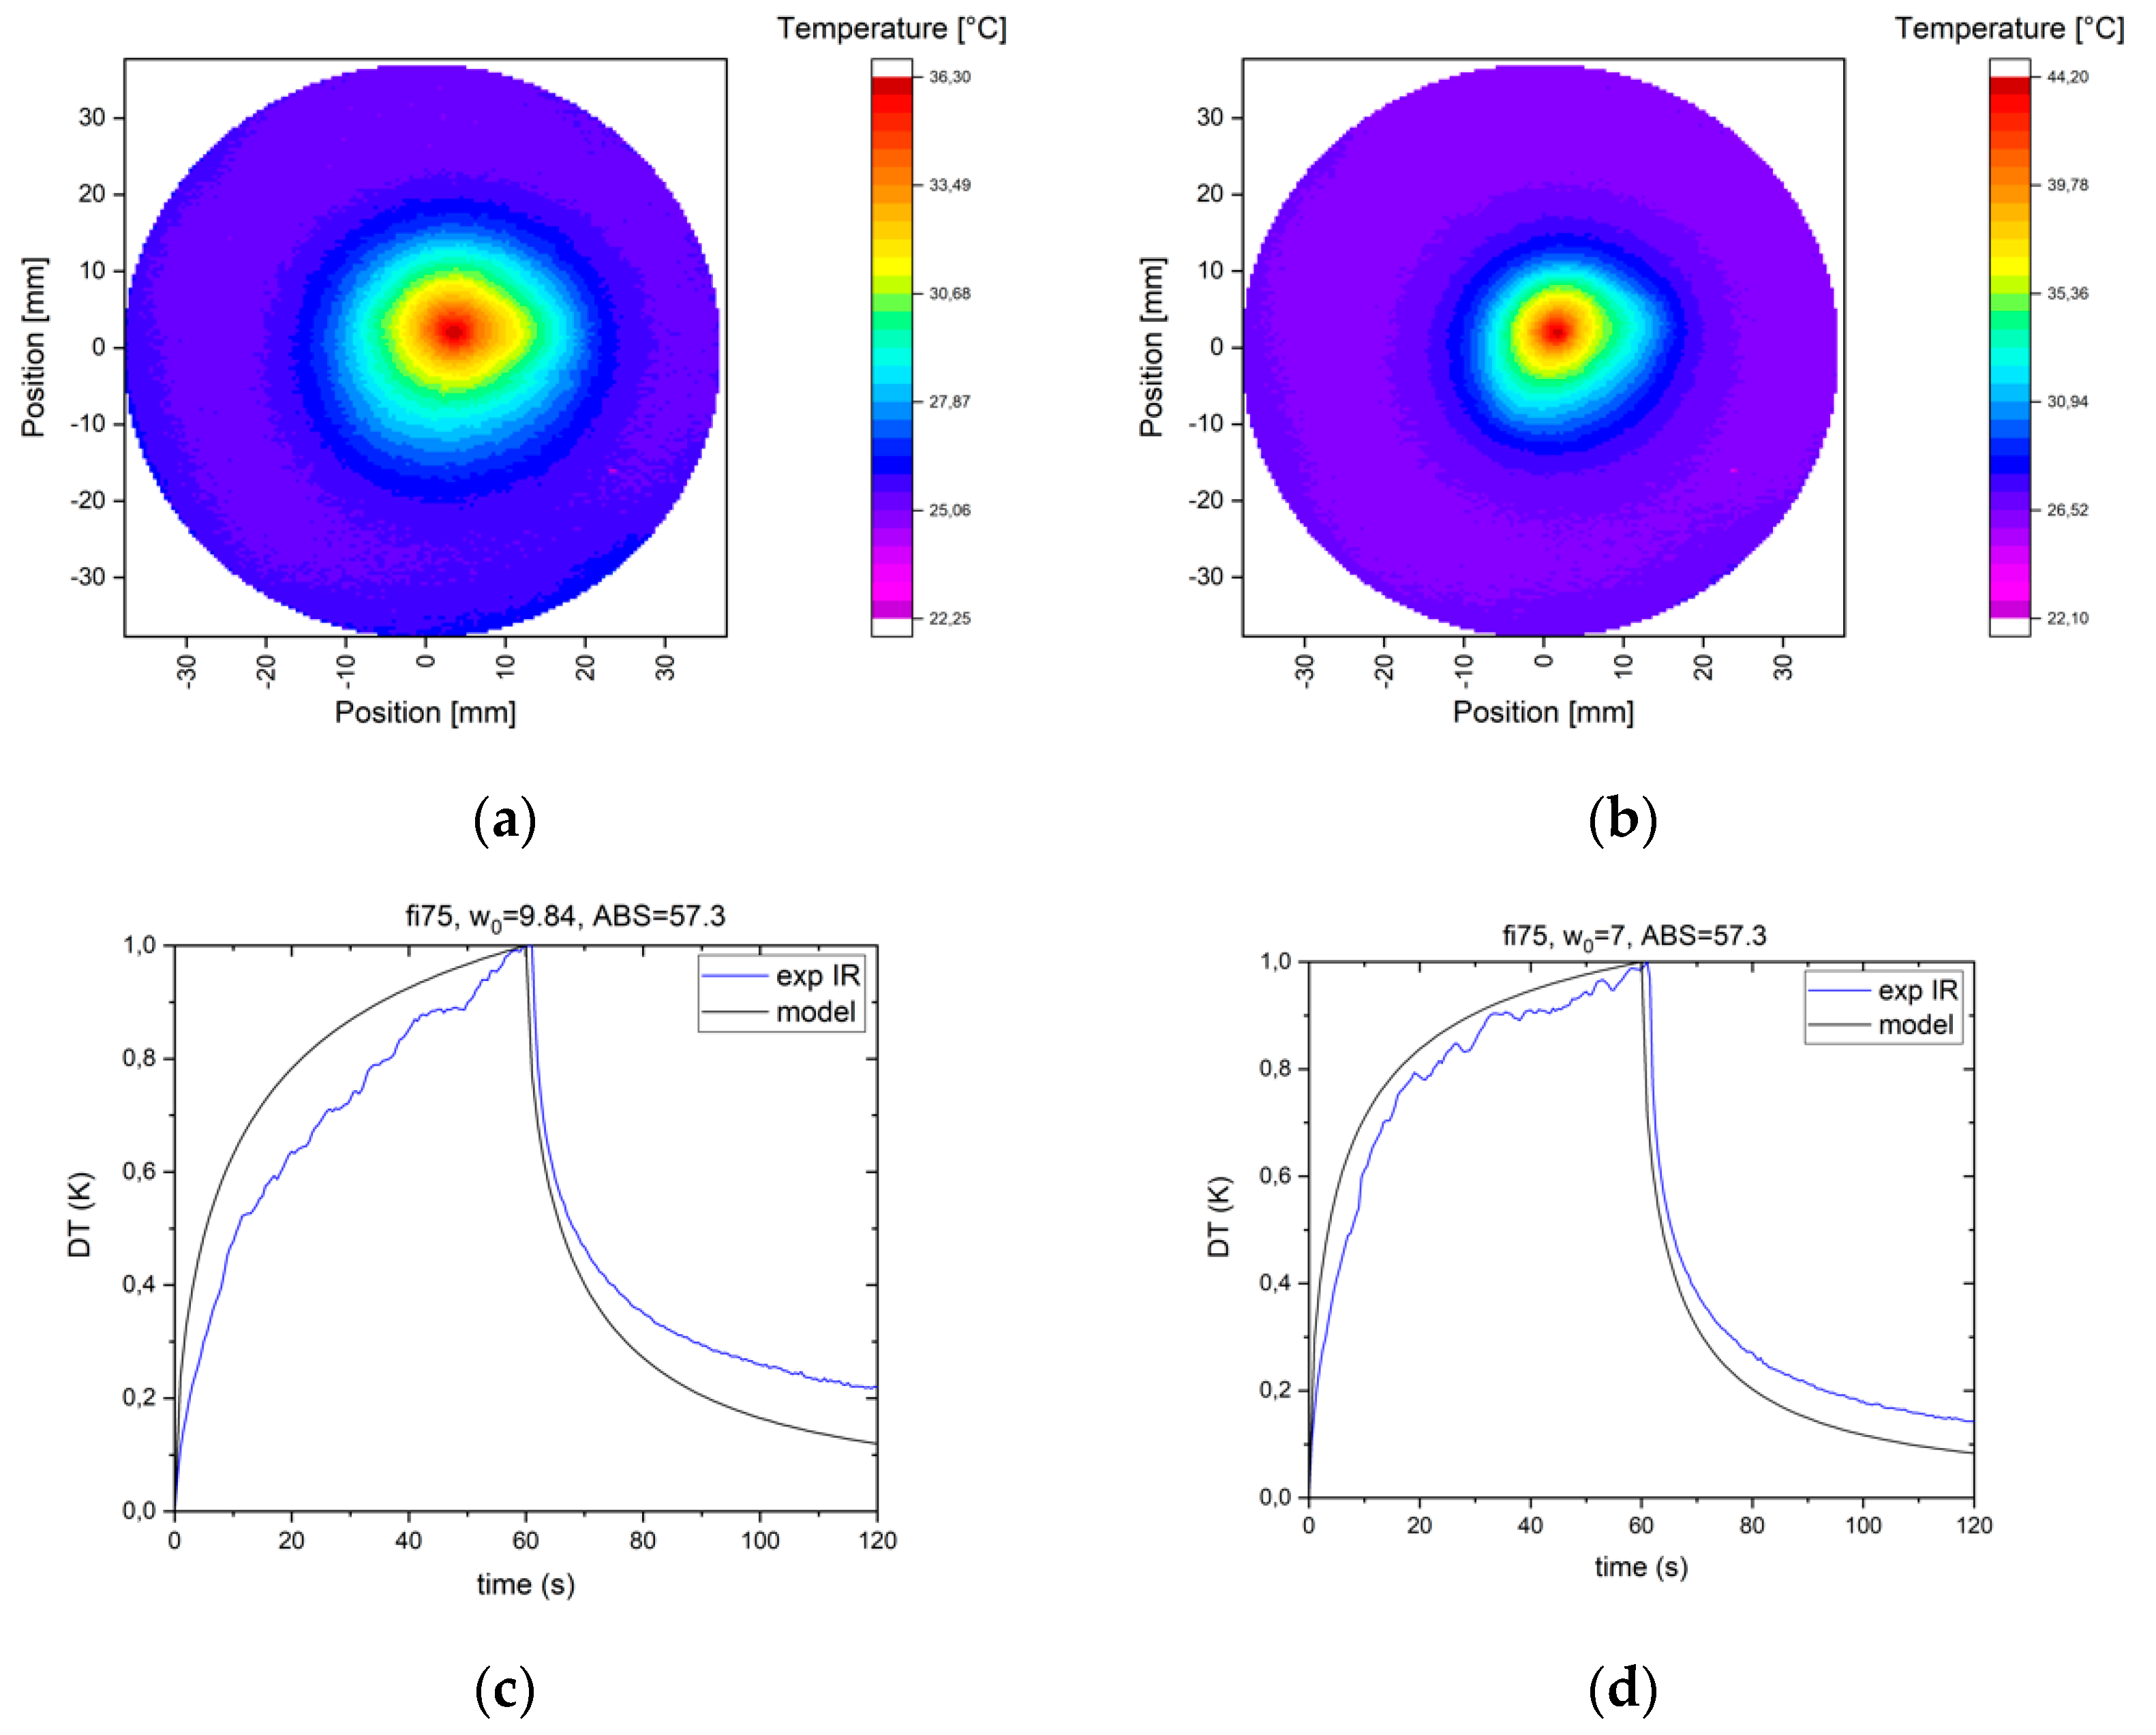
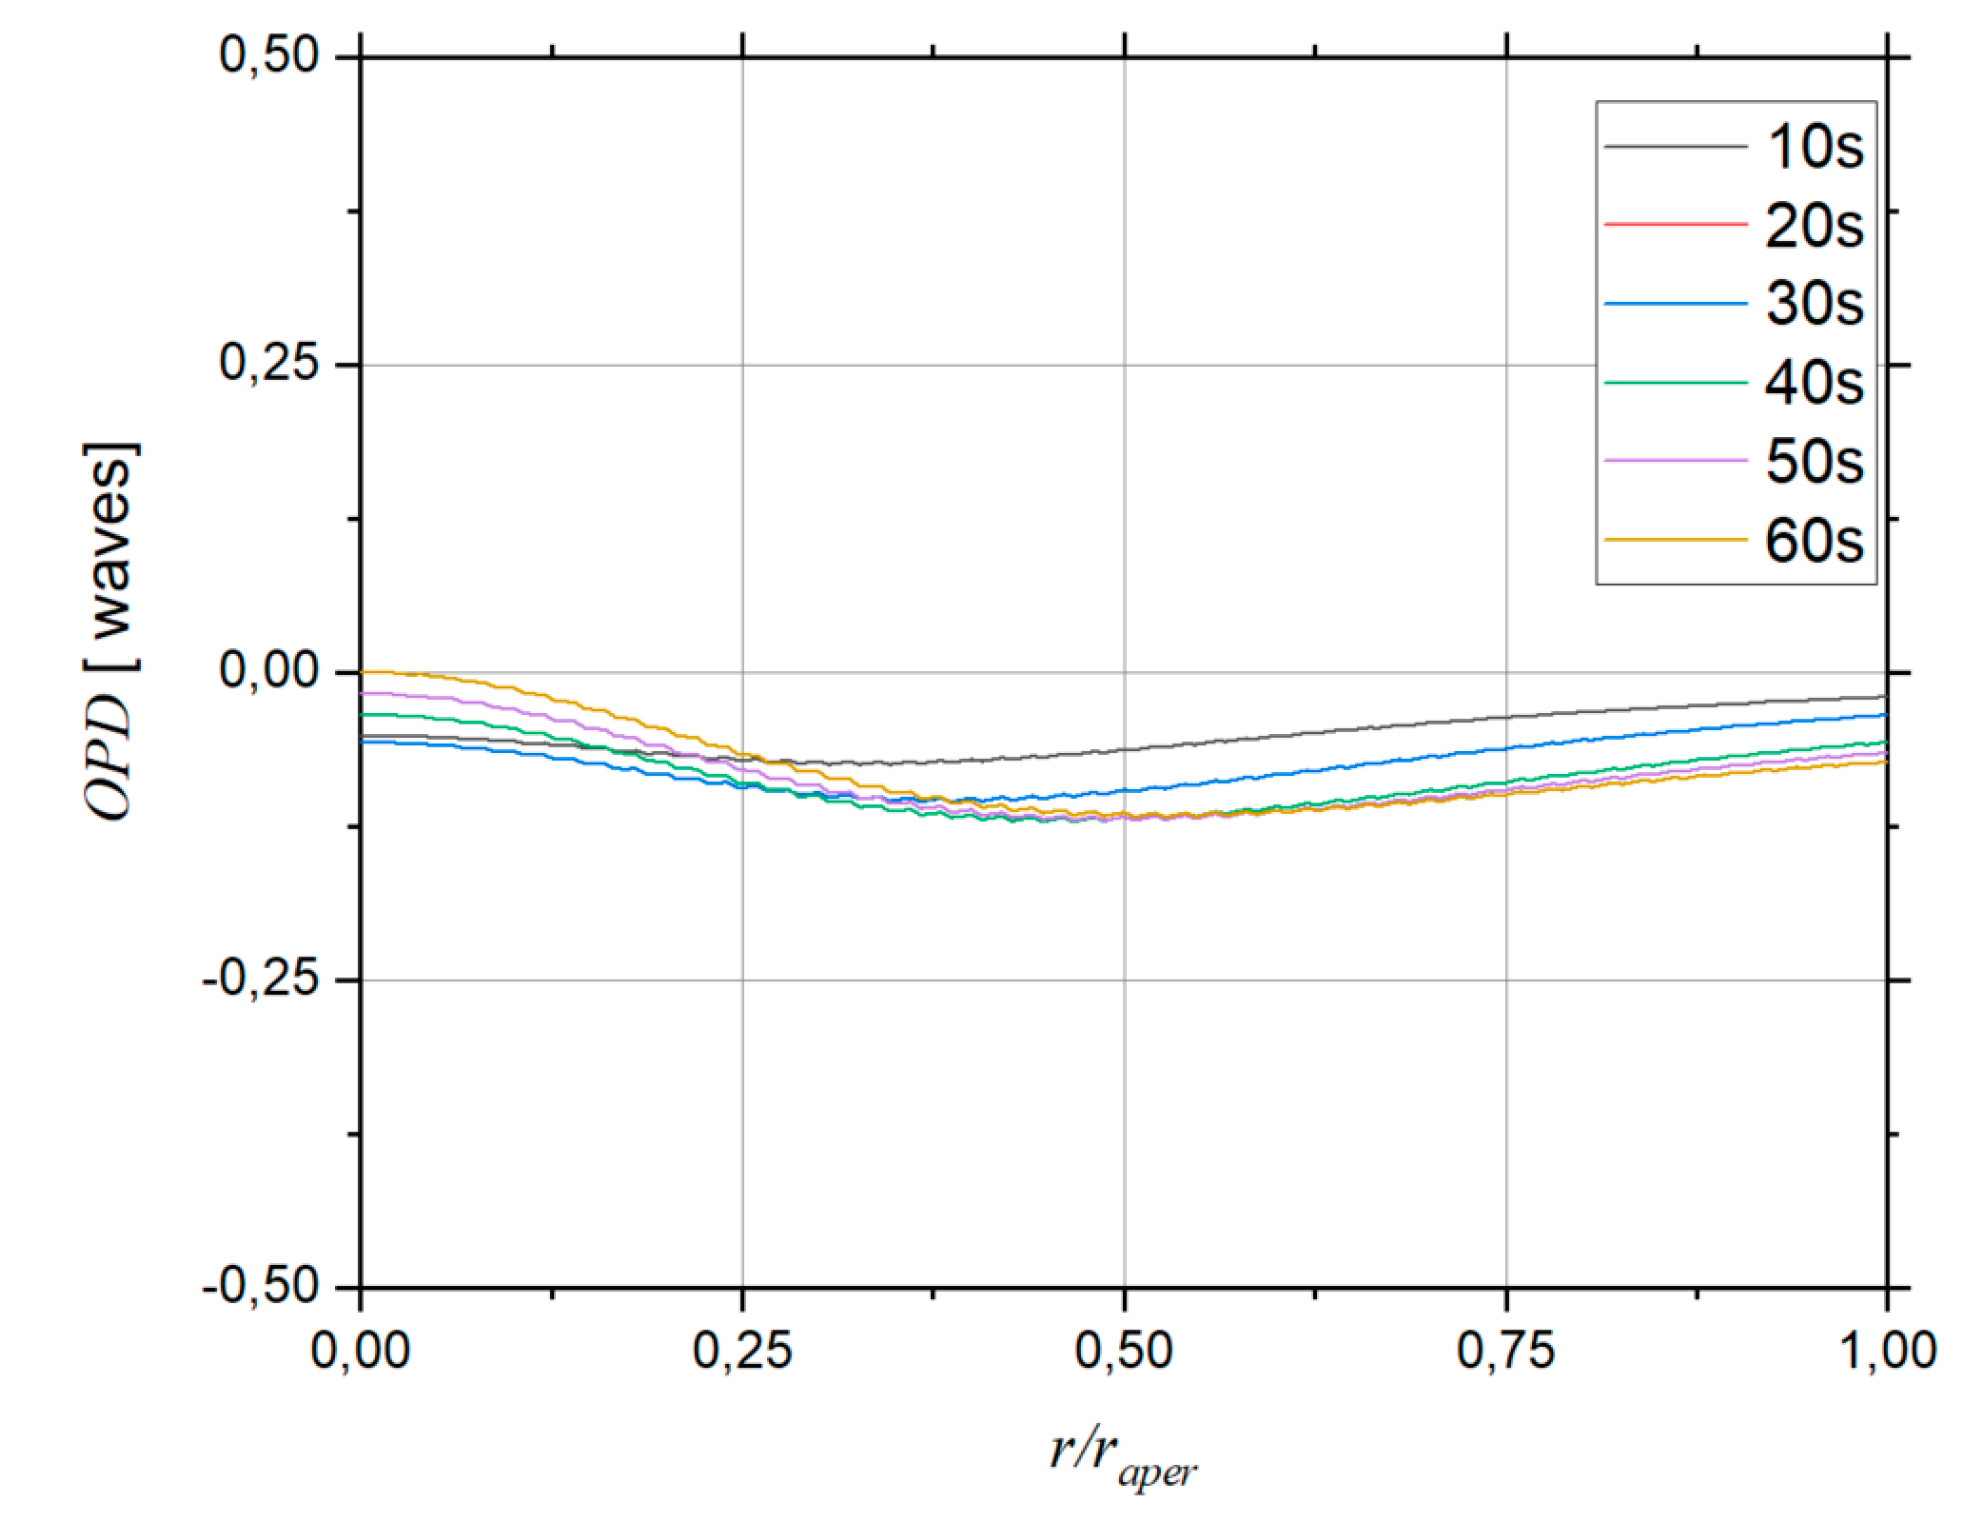
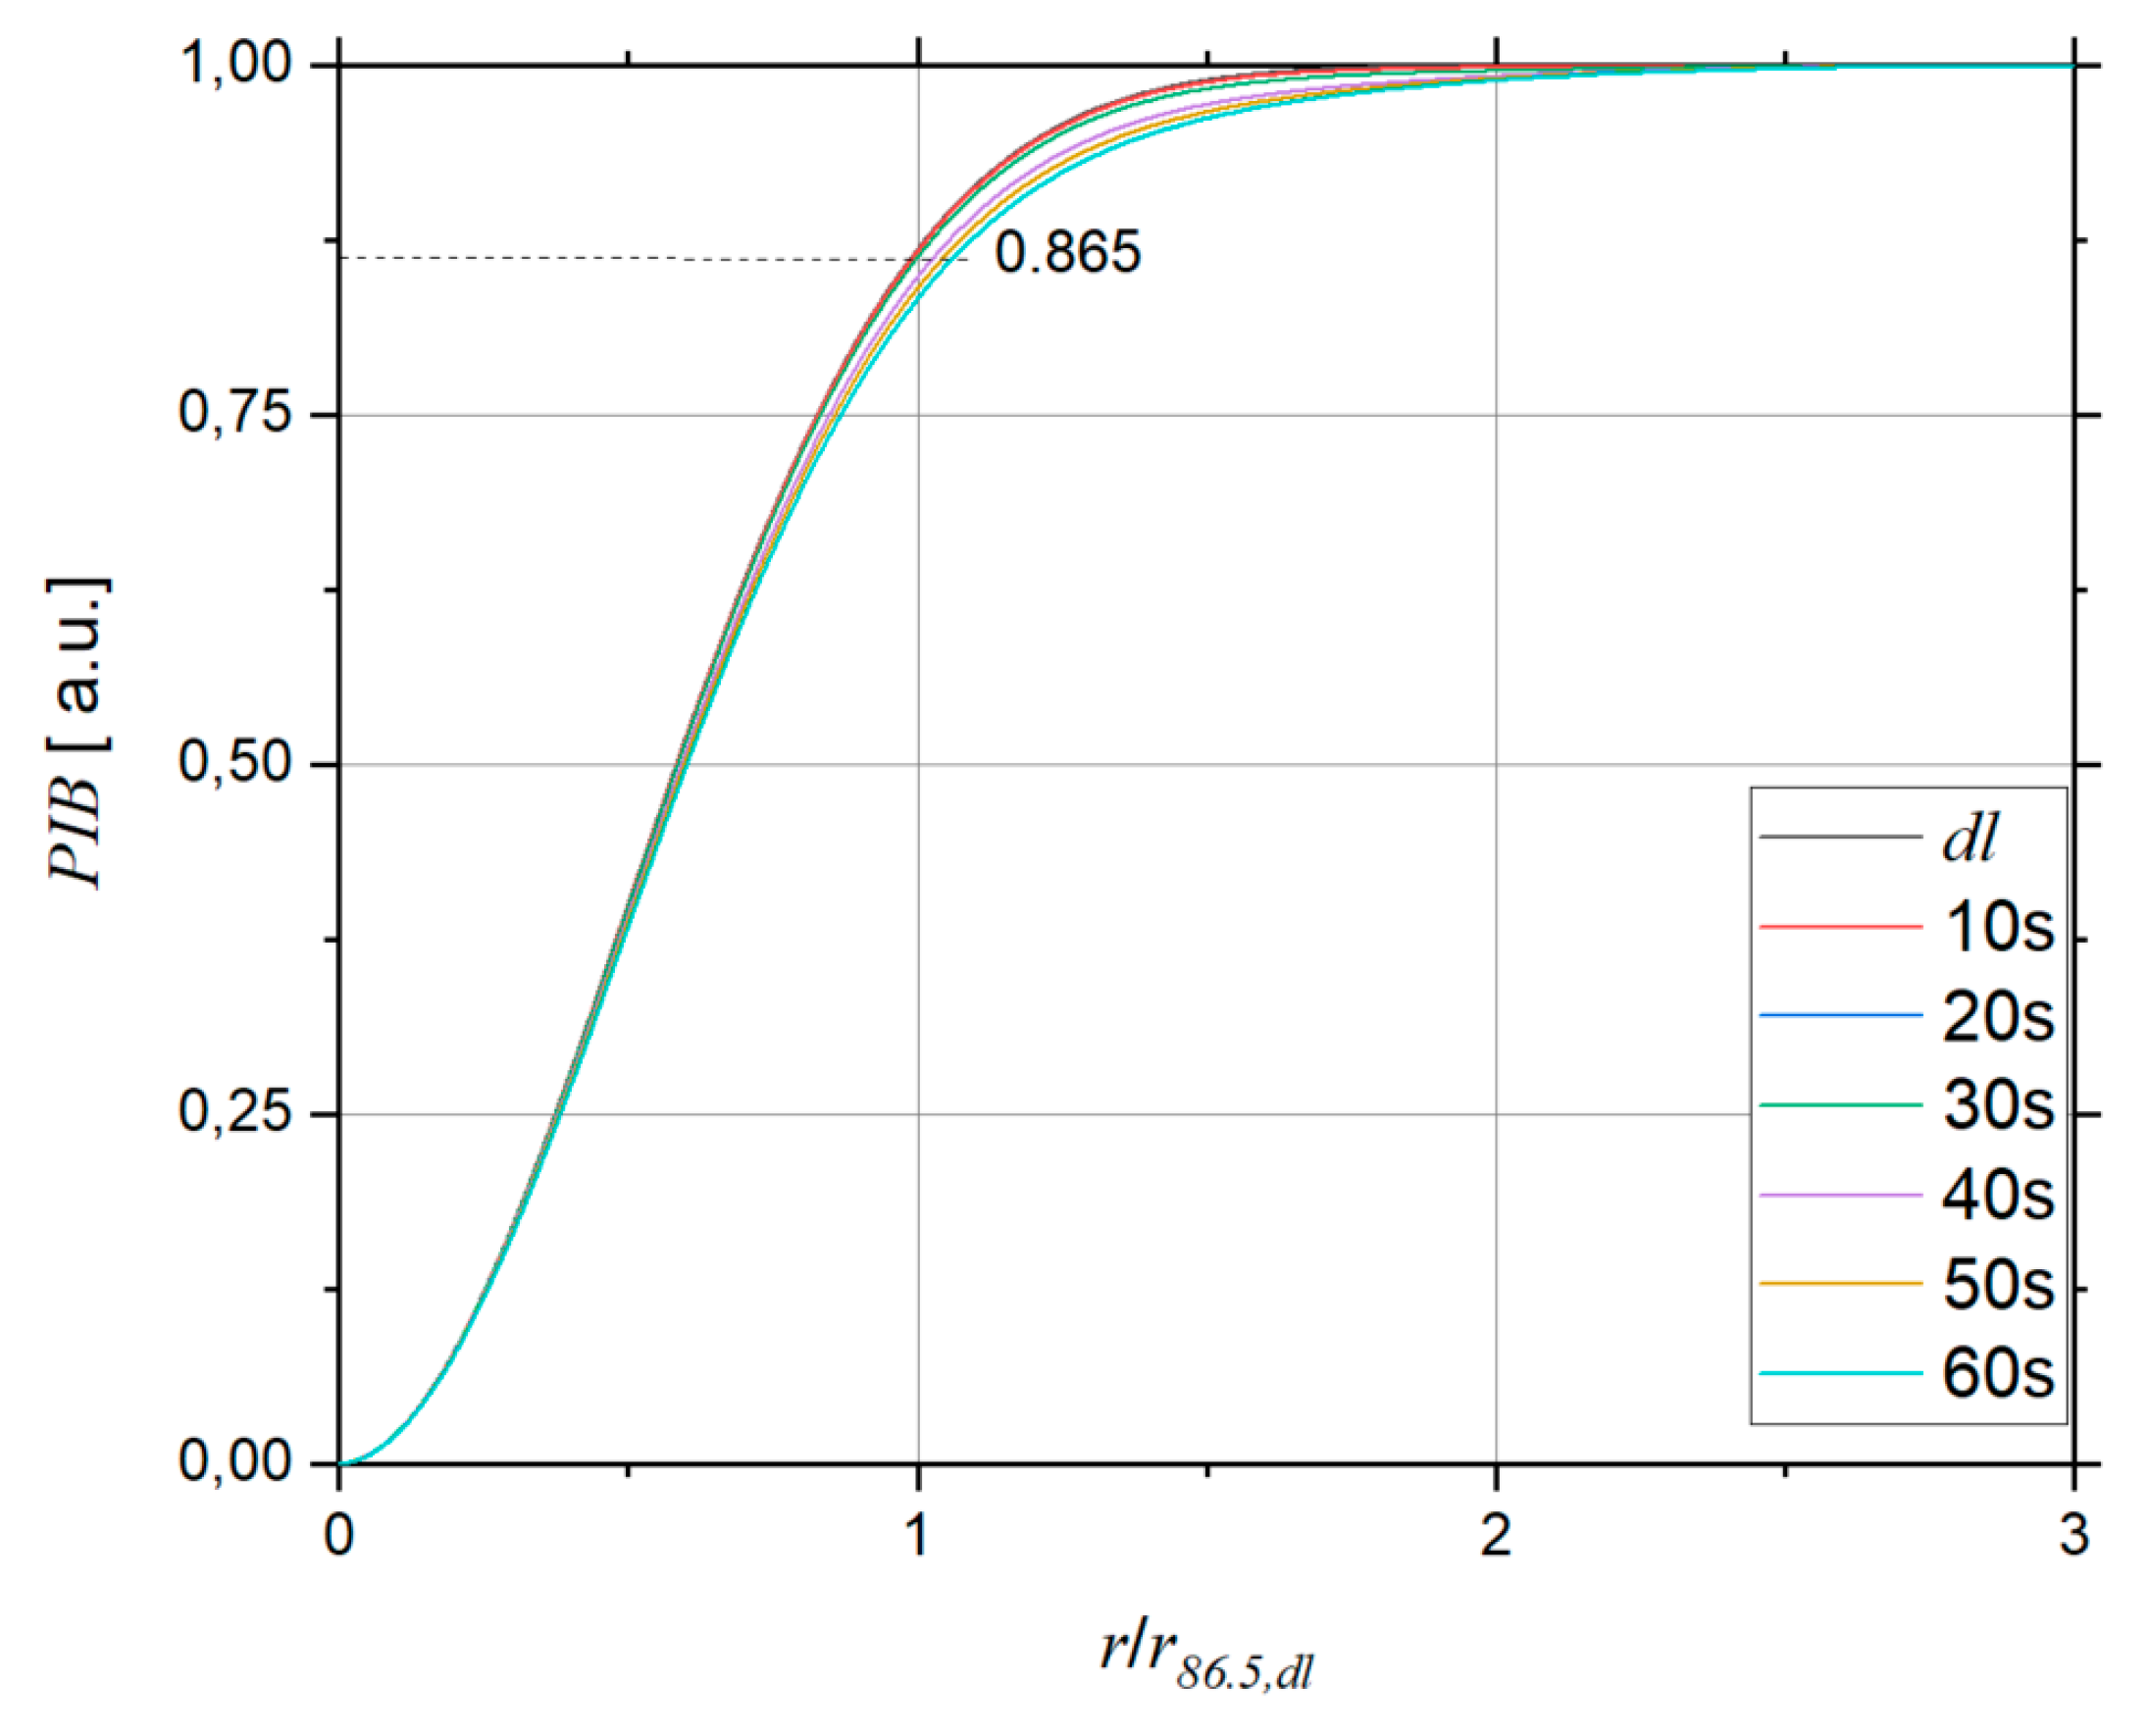
3. Modeling of Transient Thermo-Optic Effects
4. Discussion
5. Conclusions
Author Contributions
Funding
Acknowledgments
Conflicts of Interest
References
- Sprangle, P.; Hafizi, B.; Tino, A.; Fischer, R. High-power lasers for directed-energy applications. AOpt 2015, 54, F201–F209. [Google Scholar] [CrossRef] [PubMed]
- Ludweigt, K.; Riesbeck, T.; Graf, A.; Jung, M. 50 kW laser weapon demonstrator of Rheinmetall Waffe munition. Proc. SPIE 2013, 8898, 88980N. [Google Scholar]
- Dawson, J.W.; Messerly, M.J.; Beach, R.J.; Shverdin, M.Y.; Stappaerts, E.A.; Sridharan, A.K.; Pax, P.H.; Heebner, J.E.; Siders, C.W.; Barty, C.P.J. Analysis of the scalability of-diffraction-limited fiber lasers and amplifiers to high average power. Opt. Express 2008, 16, 13240–13266. [Google Scholar] [CrossRef] [PubMed]
- Zervas, M.N.; Codemard, C.A. High power fiber lasers: A review. J. Sel. Top. Quantum Electron. 2014, 20, 0904123. [Google Scholar] [CrossRef]
- McNaught, S.J.; Komine, H.; Weiss, S.B.; Simpson, R.; Johnson, A.M.; Machan, J.; Asman, C.P.; Weber, M.; Jones, G.C.; Valley, M.M.; et al. 100 kW coherently combined slab MOPAs. In Proceedings of the Conference on Lasers and Electro-Optics/International Quantum Electronics Conference, OSA Technical Digest 2009, Baltimore, MD, USA, 31 May–5 June 2009; p. CThA1. [Google Scholar]
- Available online: https://www.ipgphotonics.com/en/products/lasers/high-power-cw-fiber-lasers/1-micron/yls-sm-1-10-kw (accessed on 1 January 2012).
- Honea, E.; Afzal, R.S.; Savage-Leuchs, M.; Hennie, J.; Brar, K.; Kurz, N.; Jander, D.; Gitkind, N.; Hu, D.; Robin, C.; et al. Advances in fiber laser spectral beam combining for power scaling. Proc. SPIE 2016, 9730, 97300Y. [Google Scholar]
- Mueller, M.; Aleshire, C.; Stark, H.; Buldt, J.; Steinkopff, A.; Klenke, A.; Tünnermann, A.; Limpert, J. 10.4 kW coherently-combined ultrafast fiber laser. Proc. SPIE 2020, 45, 3083–3086. [Google Scholar]
- Sun, L.; Guo, Y.; Shao, C.; Li, Y.; Zheng, Y.; Sun, C.; Wang, X.; Huang, L. 10.8 kW, 2.6 times diffraction limited laser based on a continuous wave Nd:YAG oscillator and an extra-cavity adaptive optics system. Opt. Lett. 2018, 43, 4160–4163. [Google Scholar] [CrossRef]
- Penano, J.; Sprangle, P.; Ting, A.; Gordon, D.F.; Fisher, R.F.; Fakizi, B.; Serafin, P. Optical quality of high-power laser beams in lenses. J. Opt. Soc. Am. B 2009, 26, 503–510. [Google Scholar] [CrossRef]
- Fakizi, B.; Ting, A.; Gordon, D.F.; Sprangle, P.; Penano, J.R.; Fisher, R.F.; DiComo, G.P.; Colombat, D.C. Laser heating of uncoated optics in a convective medium. Appl. Opt. 2012, 51, 2573–2580. [Google Scholar]
- Mühlig, M.; Bublitz, S.; Paa, W. Enhanced laser-induced deflection measurements for low absorbing highly reflecting mirrors. Appl. Opt. 2014, 53, A16–A20. [Google Scholar]
- Hao, C.; Bincheng, L.; Shilei, X.; Yanling, H.; Jing, W.; Chunmimg, G.; Yafei, W. Simultaneous mapping of reflectance, transmittance and optical loss of highly reflective and anti-reflective coatings with two-channel cavity ring-down technique. Opt. Express 2017, 25, 5807–5820. [Google Scholar]
- Mueller, C.L.; Fulda, P.; Adhikari, R.X.; Arai, K.; Brooks, A.F.; Chakraborty, R.; Frolov, V.V.; Fritschel, P.; King, E.J.; Tanner, D.B.; et al. In-situ characterization of the thermal state of resonant optical interferometers via tracking of their higher-order mode resonances. Class. Quantum Gravity 2015, 32, 135018. [Google Scholar] [CrossRef]
- Klein, C.A. Materials for high-power laser optics: The thermal lensing issue. Proc. SPIE 1996, 10286, 10286D. [Google Scholar]
- Kupinski, P. Advances in Optical Systems: Laser mirror design tradeoffs impact optical system performance. Laser Focus World 2019, 55, 29–34. [Google Scholar]
- Pinard, L.; Michel, C.; Sassolas, B.; Bazarini, L.; Degallaix, J.; Dolique, V.; Flamino, R.; Forest, D.; Granata, M.; Lagrange, B.; et al. Mirrors used in the LIGO interferometers for first detection of gravitational waves. Appl. Opt. 2017, 56, C11–C15. [Google Scholar] [CrossRef]
- Gontar, P.; Gorajek, L.; Kopczyński, K.; Jabczyński, J. Characterization of beam quality of 10-kW class laser demonstrator. Proc. SPIE 2019, 11162, 54–60. [Google Scholar] [CrossRef]
- Jabczynski, J.; Gontar, P.; Gorajek, L. Wigner transform approach to dynamic-variable partially coherent laser beam characterization. Bull. Pol. Acad. Tech. 2020, 68, 141–146. [Google Scholar]
- Dooley, K.L.; Arain, M.A.; Feldbaum, D.; Frolov, V.V.; Heintze, M.; Hoak, D.; Khazanov, E.A.; Lucianetti, A.; Martin, R.M.; Mueller, G. Thermal effects in the input optics of the enhanced laser interferometer gravitational-wave observatory interferometers. Rev. Sci. Instr. 2012, 83, 033109. [Google Scholar] [CrossRef]
- Mueller, C.L.; Arain, M.A.; Ciani, G.; DeRosa, R.T.; Effler, A.; Feldbaum, D.; Frolov, V.V.; Fulda, P.; Gleason, J.; Heintze, M.; et al. The advanced LIGO input optics. Rev. Sci. Instr. 2016, 87, 014502. [Google Scholar] [CrossRef]
- Hello, P. Compensation for thermal effects in mirrors of gravitational wave interferometers. Eur. Phys. J. D 2001, 15, 373–383. [Google Scholar] [CrossRef][Green Version]
- Arain, M.A.; Mueller, G.; Quetschke, V.; Reitze, D.H.; Tanner, D.B. A Note on Substrate Thermal Lensing Compensation Using Negative Thermo-Optic Coefficient Material. Available online: https://dcc.ligo.org/LIGO-T060077/publicLIGO-T060077-00-Z (accessed on 14 April 2006).
- Cousins, A.K. Temperature and thermal stress scaling in finite-length end-pumped laser rods. IEEE J. Quantum Electron. 1992, 28, 1057–1068. [Google Scholar] [CrossRef]
- Innocenzi, M.E.; Yura, H.T.; Fincher, C.L.; Fields, R.A. Thermal modeling of continuous-wave end-pumped solid-state lasers. Appl. Phys. Lett. 1990, 56, 1831–1833. [Google Scholar] [CrossRef]
- Hello, P.; Vivet, J.-Y. Analytical models of thermal aberrations in massive mirrors heated by high power laser beams. J. Phys. 1990, 51, 1267–1282. [Google Scholar] [CrossRef]
- COMSOL Multiphysics v. 5.3. Available online: https://www.comsol.com/products (accessed on 1 October 2015).
- Rempe, G.; Thompson, R.J.; Kimble, H.J. Measurement of ultralow losses in an optical interferometer. Opt. Lett. 1992, 17, 363–365. [Google Scholar] [CrossRef]
- Hordvik, A. Measurement techniques for small absorption coefficients: Recent advances. Appl. Opt. 1977, 16, 2827–2833. [Google Scholar] [CrossRef]


| Parameter | HR1 | HR2 | HR3 | DCH1 | DCH2* | L1 | S4 |
|---|---|---|---|---|---|---|---|
| ϕ (mm) | 50 | 50 | 100 | 75 | 75 | 140 | 140 |
| l (mm) | 10 | 10 | 15 | 15 | 15 | 25 | 25 |
| τTR (s) | 49.2 | 49.2 | 110 | 110 | 110 | 307 | 307 |
| texp (s) | 60 | 60 | 60 | 60 | 18 | 80 | 60 |
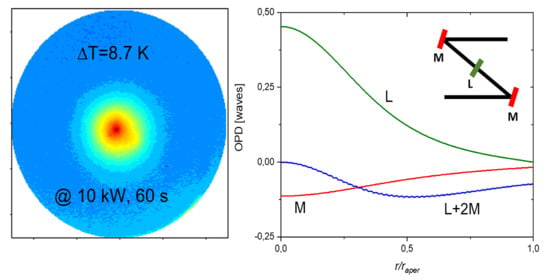
| ΔT @ 2wg = 19.6 mm | 3.3 | 10.3 | 8.7 | 11.4 | 90.4 | 2.3 | 1.5 |
| Asurf (ppm) | 16.3 | 50.5 | 44 | 57 | 670 | 8.5 | 5 |
| α (ppm/cm) | N/A | N/A | N/A | N/A | N/A | 5 | 5 |
| ΔT @ 2wg = 14 mm | 5.8 | 14.2 | 12.6 | 18.1 | N/A | N/A | N/A |
| Asurf (ppm) | 18.5 | 46 | 42 | 60 | N/A | N/A | N/A |
| Time (s) | rms (OPD) | SR | M2 | ||||||
|---|---|---|---|---|---|---|---|---|---|
| L | L + 2M | 2 × (CL + 2M) | L | L + 2M | 2 × (CL + 2M) | L | L + 2M | 2 × (CL + 2M) | |
| 10 | 0.027 | 0.007 | 0.016 | 0.982 | 0.999 | 0.997 | 1.029 | 1 | 1 |
| 20 | 0.045 | 0.012 | 0.022 | 0.953 | 0.995 | 0.993 | 1.058 | 1 | 1.014 |
| 30 | 0.058 | 0.017 | 0.022 | 0.926 | 0.991 | 0.993 | 1.101 | 1.014 | 1.022 |
| 40 | 0.068 | 0.022 | 0.026 | 0.903 | 0.985 | 0.979 | 1.145 | 1.029 | 1.043 |
| 50 | 0.075 | 0.026 | 0.03 | 0.884 | 0.98 | 0.969 | 1.159 | 1.029 | 1.058 |
| 60 | 0.082 | 0.03 | 0.036 | 0.868 | 0.975 | 0.959 | 1.188 | 1.029 | 1.072 |
| Loss Measurement Method | Surface Loss Sensitivity (ppm) | Volume Loss Sensitivity (ppm/cm) |
|---|---|---|
| Calorimetry (see, e.g., [28]) | 10–100 | 10–100 |
| Ring down technique [13] | <1 | <1 |
| Cavity mode eigen frequency change [14,17,20,29] | <1 | <1 |
| Thermal deflectometry [12] | <1 | <1 |
| Thermal imaging + model (our approach) | 2 | 5 |
Publisher’s Note: MDPI stays neutral with regard to jurisdictional claims in published maps and institutional affiliations. |
© 2020 by the authors. Licensee MDPI, Basel, Switzerland. This article is an open access article distributed under the terms and conditions of the Creative Commons Attribution (CC BY) license (http://creativecommons.org/licenses/by/4.0/).
Share and Cite
Gorajek, L.; Gontar, P.; Jabczynski, J.; Firak, J.; Stefaniak, M.; Dabrowski, M.; Orzanowski, T.; Trzaskawka, P.; Sosnowski, T.; Firmanty, K.; et al. Characterization of Absorption Losses and Transient Thermo-Optic Effects in a High-Power Laser System. Photonics 2020, 7, 94. https://doi.org/10.3390/photonics7040094
Gorajek L, Gontar P, Jabczynski J, Firak J, Stefaniak M, Dabrowski M, Orzanowski T, Trzaskawka P, Sosnowski T, Firmanty K, et al. Characterization of Absorption Losses and Transient Thermo-Optic Effects in a High-Power Laser System. Photonics. 2020; 7(4):94. https://doi.org/10.3390/photonics7040094
Chicago/Turabian StyleGorajek, Lukasz, Przemyslaw Gontar, Jan Jabczynski, Jozef Firak, Marek Stefaniak, Miroslaw Dabrowski, Tomasz Orzanowski, Piotr Trzaskawka, Tomasz Sosnowski, Krzysztof Firmanty, and et al. 2020. "Characterization of Absorption Losses and Transient Thermo-Optic Effects in a High-Power Laser System" Photonics 7, no. 4: 94. https://doi.org/10.3390/photonics7040094
APA StyleGorajek, L., Gontar, P., Jabczynski, J., Firak, J., Stefaniak, M., Dabrowski, M., Orzanowski, T., Trzaskawka, P., Sosnowski, T., Firmanty, K., Miczuga, M., Barela, J., & Kopczynski, K. (2020). Characterization of Absorption Losses and Transient Thermo-Optic Effects in a High-Power Laser System. Photonics, 7(4), 94. https://doi.org/10.3390/photonics7040094