Abstract
In the past, a two-dimensional aperture diffraction of light in the non-paraxial region could only be studied using the Huygens integral without functional forms. This work presents a special case—a one dimension slit where the functional form can be obtained. The monochromatic light intensity distributions are investigated in detail. Using the correspondence relationship, the diffracted spectra of polychromatic light in that region can be readily found. Three interesting spectral effects are described: spectral switches, multi-level data transmission, and optical wavelength ruler. Since the functional form is derived without approximation, it is applicable to a region very near to the slit, including the wavelength region or even sub-wavelength scale. Thus, for light with micron-order wavelength (visible to near infrared (NIR) band), these results are valuable to micro- or nano-optics, especially for studies of the spatial intensities or spectral characteristics in the non-paraxial region.
1. Introduction
Studies of spectra changes in free space propagation have been performed extensively over recent decades [1,2]. There is a scaling law (Wolf effect) stating that the spectral variations exist unless the degree of spectral coherence of the source meets that law [3]. Since then, other mechanisms causing spectral changes have been discussed, such as photorefractive material interactions [4], spectral correlation [5], and aperture diffraction [6]. Many interesting and valuable results were obtained through such studies, such as spectral switches [7], lattice spectroscopy [8], spectral anomalies [9], Fresnel zone spectra [10], Talbot spectra [11], spectra restoration [12], and manipulation [13]. An important relation called the spatial-spectral correspondence relationship for mono-polychromatic light diffraction was proposed by one of the authors [10], which has been used widely to derive those results. It states that, for aperture diffraction of fully coherent and uniform incident light, the space intensity distribution (in spatial domain) of monochromatic light corresponds to the spectrum distribution (in spectral domain) of polychromatic light. However, this relation is used mainly in the paraxial regime, i.e., the near-field zone (with Fresnel approximation) and far-field zone (with Fraunhoffer approximation). The reason is that, for ordinary two-dimensional aperture diffraction, the Huygens integral can only be reduced to a functional form with the above two approximations, leading to the Fresnel integral and Fourier optics, respectively. By doing so, the relation between the spatial and spectral domains is more direct and clearer. Some previous works used numerical methods to study two-dimensional apertures diffraction in non-paraxial regimes [14,15]. Single-slit focusing and its representation has been studied [16]. Nevertheless, it is known that there is a functional form in the non-paraxial region for the one-dimension slit, which makes the correspondence relation applicable again. This is of importance because, for visible-NIR light sources with micrometer-order wavelength, the non-paraxial regime is in the wavelength range or even sub-wavelength regions. The results derived in that regime are valuable to those who study micro- or nano-optics in the very near vicinity of the slit.
In this work, we first study the Fresnel-Kirchhoff integral functional form for slit diffraction. The space behind the slit is further divided into four zones, covering both paraxial and non-paraxial regions. Each zone’s diffraction form is given and the boundary between the two adjacent zones is described. Since we are mainly interested in the non-paraxial region (i.e., Zones 1 and 2), some numerical examples illustrate the characteristics of spatial intensities in those two zones. Following that is the usage of the correspondence relationship to transfer monochromatic intensity in spatial domain to polychromatic spectrum in spectral domain. In Zone 1, we can find three spectral effects: spectral switches, multi-level data transmission scheme, and optical wavelength ruler. These results are of value for spectrum control studies or applications in non-paraxial region.
2. Theory and Spatial Intensity
In the scalar wave optics regime, the aperture diffraction phenomena can be described satisfactorily with the Huygens–Fresnel principle as
where , is the wavelength, is the aperture and is the surface integration to it, the wavenumber is , is the distance from a point to the point with , and and are the field amplitude on the aperture plane and detected plane at , respectively. The coordinates system and symbols are denoted in Figure 1. For monochromatic light with constant amplitude over the aperture, i.e., , the diffracted field can be reduced to
where is the aperture function. In the paraxial regime and for two-dimensional aperture cases, functional form of Equation (2) such as the Fresnel integral or the Fourier optics can be obtained only after the near-field (Fresnel) approximation or the far-field (Fraunhofer) approximation is applied to Equation (2). That is why the correspondence relationship is discussed in the paraxial regime thus far. However, as shown below, in the one-dimensional slit case, the functional form can still be obtained without any approximation; thus, the correspondence relationship can also be presented in the non-paraxial regime. This is of great value for studying spatial intensity distribution and spectra manipulation of the mono/polychromatic diffracted light in the non-paraxial regime, especially in the region very close to the aperture, i.e., in the order of wavelength or even subwavelength regions.
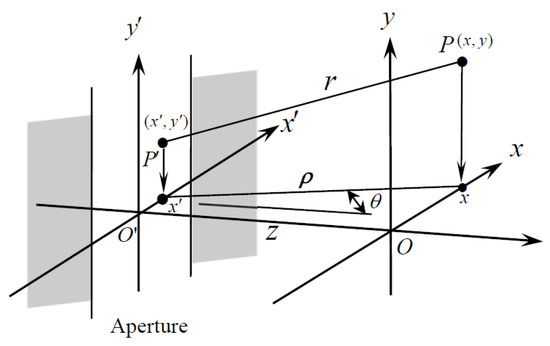
Figure 1.
The experimental procedures of this study.
As shown in Figure 1, the aperture now is a one-dimensional width slit along y’ and that reduces the aperture function into with , where is the rectangle function with = 1 for and = 0 otherwise. Using this one-dimensional situation, Equation (2) can be simplified as
The bracket in the Equation (3) integration can be derived as a functional form [17] as
where is the zero-order Hankel function of the first kind with and , as shown in Figure 1; is the zero-order Bessel function of the first kind; and is the zero-order Newman function of the first kind. Their properties are plotted in Figure 2. Note the oscillating and decaying behavior. In addition, the properties of and near the origin are quite different.
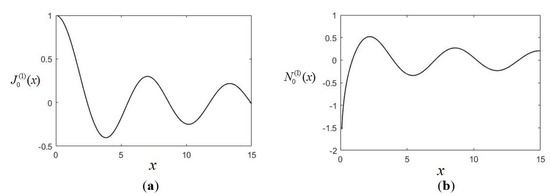
Figure 2.
Plots of Hankel function: (a) ; and (b) .
Substituting Equation (4) into Equation (3), we have the so-called one-dimensional Fresnel–Kirchhoff diffraction formula,
This functional form of is essentially valid in all the space behind the aperture because no approximations are used. However, it is customary to divide the space into two regions (non-paraxial and paraxial region) and four zones, as shown in Figure 3. For each zone, different conditions or approximations are employed, and the corresponding functional form can be derived. To facilitate the discussion of those circumstances, the space behind the aperture is divided into four zones, as illustrated in Figure 3, and all the physical quantiles derived in zone I (I = 1, 2, 3, 4) are indicated with a subscript (I). For example, is the field in Zone 1, and similar notations are adapted in other zones. The boundaries B1, B2, and B3 between adjacent zones are discussed in the following.
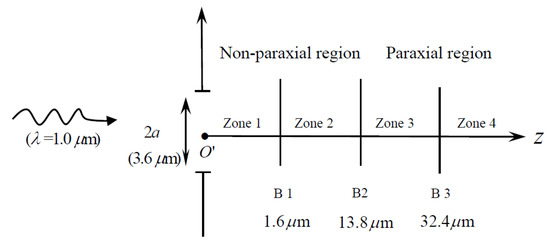
Figure 3.
Schematic of the four zones behind the slit and the notations. The numbers indicated in the figure are explained below.
(A) Zone 1
As explained above, in Zone 1, Equation (5) is used to calculate the diffracted field as
where is explicitly indicated as the up and down limit of the integral and
The diffracted intensity distribution is
The reason to use the symbols and is that the asymptotic behavior for and is similar to that of the cosine and sine functions, respectively, as shown in Figure 2. Actually, when , they can be approximated, respectively, as [18]
(B) Zone 2
We enter into Zone 2 when ; using Equation (7), the Hankel function can be approximated as
Substituting Equation (8) into Equation (5), we have
where
The diffracted intensity distribution is
(C) Zone 3 (Fresnel region)
When , where is the angle made between the vector and z axis (see Figure 1), we enter the paraxial region. There are two zones, near field (Zone 3) and far field (Zone 4). For Zone 3, the criterion is [19], where is the maximum angle and is the Fresnel number. In this slit case, , we have the condition from the above inequality. Under this condition, the variable can be approximated as (the Fresnel approximation) and the diffracted field is
where
The diffracted intensity distribution is
This corresponds to the one-dimensional slit near-field diffraction. The first line of Equation (10a) is related to the Fresnel integral as , where and are called the Fresnel cosine integral and sine integral, respectively. By plotting them in a complex plane, they form the curve of , the so-called Cornu spiral.
(D) Zone 4
Finally, when , i.e.,, it is in Zone 4 and can be further approximated as (the Fraunhofer approximation) and the diffracted field is
where the sinc function is defined as and is the Fourier transform of the aperture function with the spatial frequency . This corresponds to the one-dimensional far-field diffraction, or the Fourier optics. The intensity distribution is
Figure 3 illustrates the four zones, and the correct functional forms are provided above. Note that can be employed not only in Zone 1, but also in all subsequent zones, because no approximations are used. Likewise, can be used in Zones 2–4 but not Zone 1 because, when the approximation is used, degenerates into . However, if we use to calculate the field in Zone 1, it cannot give correct answer. Similar reasoning can be applied to and .
Since all the field representations are derived in each of the four zones, let us discuss more specific boundaries from the approximations used above. To estimate the proper boundary between zones, the following criterion is used: when an approximation requires “” (i.e., a is much larger than ), it is simply interpreted as is at least an order of magnitude larger than , i.e., . Here, two arbitrary symbols a and b are used to explain the condition ; do not be confused with a here and the slit width 2a. For example, the approximation used in Zone 2 is , which is ; thus, for the worst case when P and P’ have the same x component (i.e., ), the distance z still needs to satisfy the condition . Using the criterion above, means , thus the boundary between Zones 1 and 2 (B1 in Figure 3) is about 1.6 wavelengths. Using the same criterion, the approximation used in Zone 3 is , leading to boundary B2 being . The approximation used in Zone 4 is , thus boundary B3 is . To discuss the diffraction situations and boundaries more specifically, some practical numbers and numerical examples are helpful. A slit width and wavelength were arbitrarily chosen and are used in all of the following figures unless specified otherwise. Substituting and into above boundary estimations, we have the values of z at 1.6, 13.8, and 32.4 μm for B1, B2, and B3, respectively, as indicated in Figure 3. Since the slit diffraction in paraxial region was studied, we focus on the diffraction in the non-paraxial region, that is, Zones 1 and 2. Using Equation (6a) for and Equation (9a) for , Figure 4a,b plots , in red solid lines, and , in blue circles on a complex number plane in the interval of at two values of z. The horizontal axis and vertical axis represent the real and imaginary parts of the diffracted field . The magnitude of (or the square root of the intensity ) can be obtained by finding the distance between the two corresponding points [,] and [,] for the specified x value on the curve. The curves are plotted at two different locations of z: Figure 4a is at z = 0.1 μm (Zone 1) and Figure 4b is at z = (Zone 2). As mentioned above, in Zone 1, the blue curve fails to fit the correct red curve, because Equation (9a) for is not applicable in Zone 1. However, for Figure 4b in Zone 2, the two curves coincide nicely, because Equation (6a) for and Equation (9a) for both can be used in Zone 2. The situation is clarified when we plot the diffraction intensity directly, as shown in Figure 5, where Figure 5a is in Zone 1 (z = 0.1 μm), using Equation (6c) for (red line) and using Equation (9c) for (blue line). It is seen that is too large in the slit region and deviates from in Zone 1, because Equation (9c) is not applicable in Zone 1. This is clearer in Figure 5b where the same location z = 0.1 μm is picked but is used. We see that in Figure 5b not only deviates from but gives wrong local maximum as indicated by the arrows shown in the figure. The local maximum for is 1.082 at x = −0.864 um; the local maximum for is 1.236 at x = −0.585 um. Figure 5c is plotted at Zone 2 (z = 2.5 ); we see that the two intensities and coincide nicely, as expected.
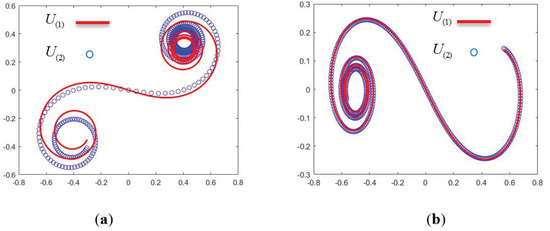
Figure 4.
The complex plane plot of and : (a) z = (Zone 1); and (b) z = (Zone 2).
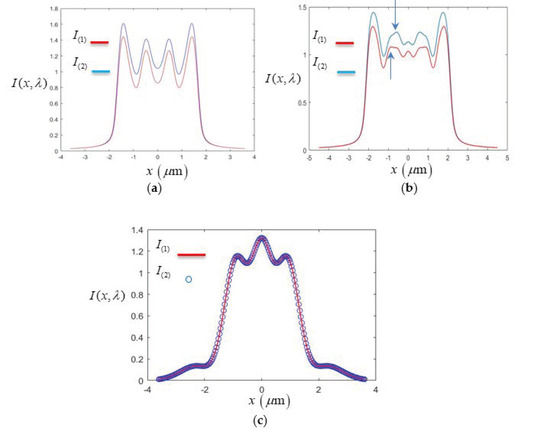
Figure 5.
Diffraction intensity of and : (a) z = (Zone 1) and ; (b) z = (Zone 1) and ; and (c) z = (Zone 2) and .
3. Polychromatic Spectra
According to the spatial-spectral for mono-poly chromatic light diffraction, the diffracted spectrum for an incident light fully spatially coherent and uniformly distributed in the aperture plane is directly related to the intensity distribution for the monochromatic situation. Because the diffracted spectral properties in Zones 3 and 4 were studied previously [20,21], we concentrate on spectra behavior in Zone 1. Using the correspondence relationship and Equation (6), the diffracted spectrum is
where is the incident spectrum, and is the modifier function, or simply the modifier. The modifier indicates how the incident spectrum is modified. Note that we intentionally use the symbols and with variables in reverse order. By doing this, it is easier to see the first variable in the parenthesis is the main variable and the second one is just a selected parameter. For example, in , we are interested in the spectral variation with at a picked location ; in contrast, focuses on the intensity distribution with at a selected . Of course, both and depend on the distance z, which is not shown explicitly. Note that the terms and of in Equation (12) are important because they are dependent. However, they are just constants in Equation (6) for or . Consider the incident spectrum as a rectangle function:
where is the center wavelength and is the wavelength bandwidth. Here, and are used for numerical calculations, which corresponds to a flat-top spectrum distribution ranging from to (from visible to near infrared bands), as shown in Figure 6. Some examples help illustrate valuable effects of as follows. For convenience of discussion, is normalized to 1 in all the following figures.
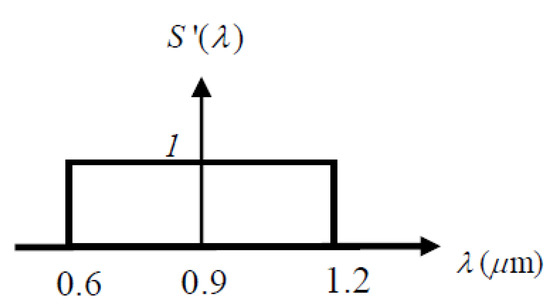
Figure 6.
The spectral distribution and rectangle function of the incident spectrum.
3.1. Spectral Switches
Figure 7 shows diffracted spectra at three close locations: x = for Figure 7a–c, respectively, with z = 0.1 μm. It is found that in Figure 7a has two peaks, one main peak at the right and one sub-peak at the left. The spectrum is red-shifted, because the peak wavelength () of is larger than the center wavelength () of . However, in Figure 7b, the two peaks reach the same height and, in Figure 7c, the main peak is at the left. The spectrum is blue-shifted, i.e., the peak wavelength () of is smaller than the center wavelength () of . The peak wavelength shift experiences a discontinuous transition from red-shift to blue-shift when the detected position moves continuously in a small interval, which is call a spectral switch. This phenomenon has been found in many situations and its potential application has been studied extensively [7]. It is noted that the spectra derived in Equation (12) are measured at only one point (i.e., an infinitesimal detector); in real situations, there is finite size for the detectors or photon channels and the spectra must be integrated and be averaged. However, if the size is small enough, in the order of 10 nm, the variations caused by the finite area are not noticeable and Equation (12) is still applicable. A nano-tip called plasmon fiber probe with an apex diameter about 10 nm can be achieved using Ohtsu’s etching procedure [22].
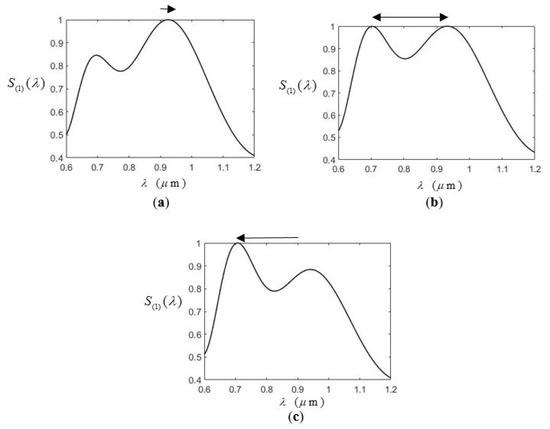
Figure 7.
The spectral switch of at three locations with z = : (a) x = ; (b) x = ; and (c) x = . The spectrum maximums used to normalize are 1.35, 1.26, and 1.34 in (a–c), respectively.
3.2. Multi-Level Data Transmission
We can now consider the effect of varying slit width a on . Figure 8 illustrates the modified spectrum along the optical axis (x = 0) with z = for three widths: a = 1.2, 2.4, and 3.6 in Figure 8a–c, respectively. There are one, two, and three peaks in each figure. This can be used as a multi-level digital data transmission. Considering a series, three-level digital data need to be transmitted in Zone 1 along z axis at z = , and the digital data are represented as 0, 1, and 2, as shown in the first and second rows of Figure 9. The data are then encoded by the number of peaks 1, 2, and 3, respectively, as shown in the third row. By varying the slit width a, different numbers of peaks can be produced, as indicated in the last row of Figure 9. Consequently, the data can be transmitted and received at the detection end. The feature of this transmission scheme is that the number of peaks is easy to count and does not depend on the absolute spectrum intensity detected at the receiving end. Here, a three-level coding method is introduced. Higher level can be achieved as long as the spacing between adjacent peaks is enough to make the peaks number recognizable. The speed of the transmission rate is limited by that of the control method for slit width. Spectral switch use for data transmission has been studied before, but only a two-level scheme is possible [23], using the red-shift and blue-shift as the encoding scheme.
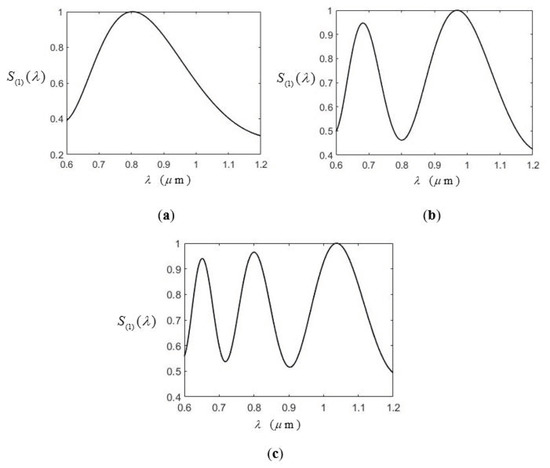
Figure 8.
The distribution for three slit width at z = : (a) a = 1.2; (b) a = 2.4; and (c) a = 3.6. The spectrum maximums used to normalize are 1.58, 1.44, and 1.37 in (a–c), respectively.

Figure 9.
Illustration for the data encoding and transmission by controlling the slit width. The three-level data 0, 1, and 2 are related to the spectrum with peak number 1, 2, and 3, which can be obtained by varying width a.
3.3. Optical Wavelength/Frequency Ruler
When the silt width increases, the number of spikes increases too, as shown in Figure 10 for a = 10 at z = . There are many peaks and valleys (denoted by red circles in the figure). These spectral valleys can be used as wavelengths reference, or the so-called optical frequency (or wavelength) ruler [24]. This kind of spectrum featuring with many specific peaks or valleys can be used as useful reference light sources. For example, it can be used to calibrate a spectrometer or to help estimating or determining the unknown wavelength of a quasi-monochromatic light. Although the spacing between adjacent valleys is not regular, they can be still used as the ticks of the ruler because their wavelength locations are exactly known numerically. Of course, there should be enough contrast between peaks and valleys for practical usage. In Figure 10, the contrast (the difference between the maximum and minimum intensity) is larger than 25%, which should be good enough.
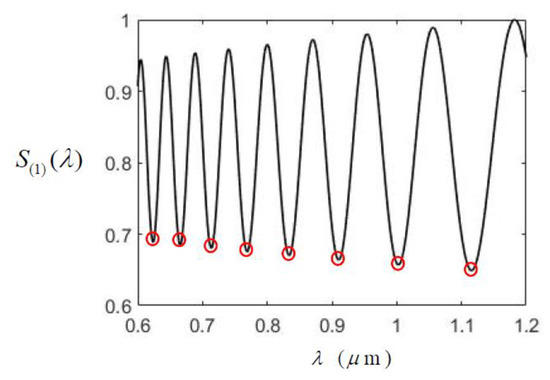
Figure 10.
Using the specific spectral valleys (red circles) as an optical wavelength ruler for a = 10. The spectrum maximum used to normalize is 1.23.
4. Conclusions
One dimensional slit diffraction behavior in non-paraxial region (Zones 1 and 2) is studied in detail in this work. The functional forms are first derived, which is otherwise not possible for 2D apertures. They are directly related to the Hankel function. In the super-near region of wavelength or subwavelength scale, Equation (6a–c) for Zone 1 should be used, instead of Equation (9a–c) for Zone 2. The intensity distribution differences between the two zones are illustrated by numerical examples. Especially, the misusage of Equation (9a–c) (for Zone 2) in Zone 1 gives incorrect results. The diffracted spectra in Zone 1 are studied via spatial–spectral correspondence relationship. There are three noticeable phenomena. The first is the spectral switch. When the spectrum is detected at three increasing transversal location, there is a discontinuous jump for the spectral shift. The second is the multi-level digital data transmission scheme, utilizing the feature that peak number can be controlled by the slit width to achieve the data encoding and transmitting. The third is the optical wavelength ruler. The number of peaks increase with the slit width. Consequently, the numerous maxima or minima can be used as ruler ticks for broadband light.
5. Discussion
This work is based on the scalar wave theory. More rigorous treatment of diffraction, vector wave, Maxwell’s equations, boundary conditions, and obstacle properties (dielectric constant and conductivity) should be considered [25]. For example, Kottler [26] extended the scalar theory to electromagnetic waves and proposed a reason for the discrepancy arising between the solutions and the boundary conditions chosen by Kirchhofffor [27]. In addition, Stratton and Chu [28] extended the scalar Kirchhoff diffraction theory to vector waves accounting for polarization. The vector wave and real material would have some effects on the validity of this work, and these effects will be studied in the future. Nevertheless, the scalar wave is still a very good approximation when the obstacle or aperture is assumed to be perfectly conducting, which is accepted to be true for some metals (e.g., silver or copper) if the frequency is not too high. Thus, the results obtained in this work are still of value for slit diffraction studies in the non-paraxial regime, especially for spectral manipulation and applications.
Author Contributions
Conceptualization, P.H.; methodology, H.-C.H. and P.H.; validation, H.-C.H.; data curation, H.-C.H.; writing—original draft preparation, H.-C.H.; writing—review and editing, P.H.; and funding acquisition, P.H. All authors have read and agreed to the published version of the manuscript.
Funding
This work was supported by the Ministry of Science and Technology (MOST) of Taiwan under contract number MOST 107-2221-E-005-059-MY3.
Acknowledgments
We would like to thank the support from National Chung Hsing University, Taiwan.
Conflicts of Interest
The authors declare no conflict of interest.
References
- Wolf, E. Invariance of the spectrum of light on propagation. Phys. Rev. Lett. 1986, 56, 1370–1372. [Google Scholar] [CrossRef]
- Rasouli, S.; Hamzeloui, S.; Hebri, D. Colorful radial Talbot carpet at the transverse plane. Opt. Express 2019, 27, 17435–17448. [Google Scholar] [CrossRef]
- Pu, J.; Korotkova, O.; Wolf, E. Invariance and noninvariance of the spectra of stochastic electromagnetic beams on propagation. Opt. Lett. 2006, 31, 2097–2099. [Google Scholar] [CrossRef]
- Hsu, H.C.; Han, P. Spectra manipulation with the photorefractive effect via the spatial–spectral correspondence relationship. J. Opt. Soc. Am. A 2020, 37, 219–224. [Google Scholar] [CrossRef]
- Wolf, E. Non-cosmological redshifts of spectral lines. Nature 1987, 326, 363–365. [Google Scholar] [CrossRef]
- Han, P. Spectral anomalies for a right triangle aperture with an adjustable hypotenuse slope. J. Opt. A Pure Appl. Opt. 2009, 11, 015708. [Google Scholar] [CrossRef]
- Pu, J.; Zhang, H.; Nemoto, S. Spectral shifts and spectral switches of partially coherent light passing through an aperture. Opt. Commun. 1999, 162, 57–63. [Google Scholar] [CrossRef]
- Han, P. Lattice spectroscopy. Opt. Lett. 2009, 34, 1303–1305. [Google Scholar] [CrossRef]
- Visser, T.D.; Wolf, E. Spectral anomalies near phase singularities in partially coherent focused wavefields. J. Opt. A Pure Appl. Opt. 2003, 5, 371–373. [Google Scholar] [CrossRef]
- Han, P. Spatial–Spectral Correspondence Relationship for Mono—Poly chromatic Light Diffraction. In Progress in Optics; Visser, T.D., Ed.; Elsevier: Amsterdam, The Netherlands, 2018; Volume 63, pp. 33–87. [Google Scholar]
- Han, P. Spectra restoration of a transmissive periodic structure in near-field diffraction (Talbot spectra). J. Opt. Soc. Am. A 2015, 32, 1076–1083. [Google Scholar] [CrossRef]
- Hsu, H.C.; Weng, J.H.; Han, P. Spectra restoration and image reconstruction of a J0 amplitude transmittance object with circular symmetry. J. Opt. Soc. Am. A 2019, 36, 270–276. [Google Scholar] [CrossRef]
- Kanseri, B.; Rathi, A.K. Broadband spectral shaping using nematic liquid crystal. Results Phys. 2019, 12, 531–534. [Google Scholar] [CrossRef]
- Lü, B.; Duan, K. Nonparaxial propagation of vectorial Gaussian beams diffracted at a circular aperture. Opt. Lett. 2003, 24, 2440–2442. [Google Scholar] [CrossRef]
- Wang, H.; Ding, C.; Zhao, Z.; Zhang, Y.; Pan, L. Nonparaxial propagation of spatially and spectrally partially coherent electromagnetic Cosh-Gaussian pulsed beams. Opt. Laser Technol. 2012, 44, 1800–1807. [Google Scholar] [CrossRef]
- Goncalves, M.R.; Case, W.B.; Arie, A.; Schleich, W.P. Single-slit focusing and its representations. Appl. Phys. B 2017, 123, 121. [Google Scholar] [CrossRef]
- Iizuka, K. Elements of Photonics; Wiley: New York, NY, USA, 2002; p. 68. [Google Scholar]
- Arfken, G. Mathematical Methods for Physics, 3rd ed.; Academic Press: Orlando, FL, USA, 1985; p. 619. [Google Scholar]
- Saleh, B.E.A.; Teich, M.C. Fundamentals of Photonics, 2nd ed.; John Wiley & Sons: New York, NY, USA, 2007; p. 47. [Google Scholar]
- Liu, Z.Y.; Fan, D.Y. Diffraction characteristics of an ultra-short pulsed beam in the far field. Pure Appl. Opt. 1997, 6, L43–L45. [Google Scholar] [CrossRef]
- Han, P. Spectral and Time-Space Intensity for Near-Field Diffraction of a Time Dependent Gaussian-Shaped Pulsed Beam from an Infinite Slit. Jpn. J. Appl. Phys. 2003, 42, 5575–5580. [Google Scholar] [CrossRef]
- Ashino, M.; Ohtsu, M. Fabrication and evaluation of a localized plasmon resonance probe for near-field optical microscopy/spectroscopy. Appl. Phys. Lett. 1998, 72, 1299–1301. [Google Scholar]
- Pu, J.P.; Cai, C.; Nemoto, S. Spectral anomalies in Young′s double-slit interference experiment. Opt. Exp. 2004, 12, 5131–5139. [Google Scholar] [CrossRef]
- Ding, P.F.; Hsu, H.C.; Han, P. Spectral manipulation and tunable optical frequency ruler using liquid crystal’s birefringence. Optik 2019, 179, 115–121. [Google Scholar] [CrossRef]
- Born, M.; Wolf, E. Principle of Optics, 7th ed.; Cambridge University Press: Cambridge, UK, 1999; p. 633. [Google Scholar]
- Kottler, F. Diffraction at a black screen: Part I: Electromagnetic theory. Prog. Opt. 1965, 4, 281–314. [Google Scholar]
- Kottler, F. Diffraction at a black screen: Part II: Electromagnetic theory. Prog. Opt. 1967, 6, 331–377. [Google Scholar]
- Stratton, J.A.; Chu, L.J. Diffraction theory of electromagnetic waves. Phys. Rev. 1939, 56, 99–107. [Google Scholar] [CrossRef]
Publisher’s Note: MDPI stays neutral with regard to jurisdictional claims in published maps and institutional affiliations. |
© 2020 by the authors. Licensee MDPI, Basel, Switzerland. This article is an open access article distributed under the terms and conditions of the Creative Commons Attribution (CC BY) license (http://creativecommons.org/licenses/by/4.0/).