Automated Nuclear Lamina Network Recognition and Quantitative Analysis in Structured Illumination Super-Resolution Microscope Images Using a Gaussian Mixture Model and Morphological Processing


Abstract
1. Introduction
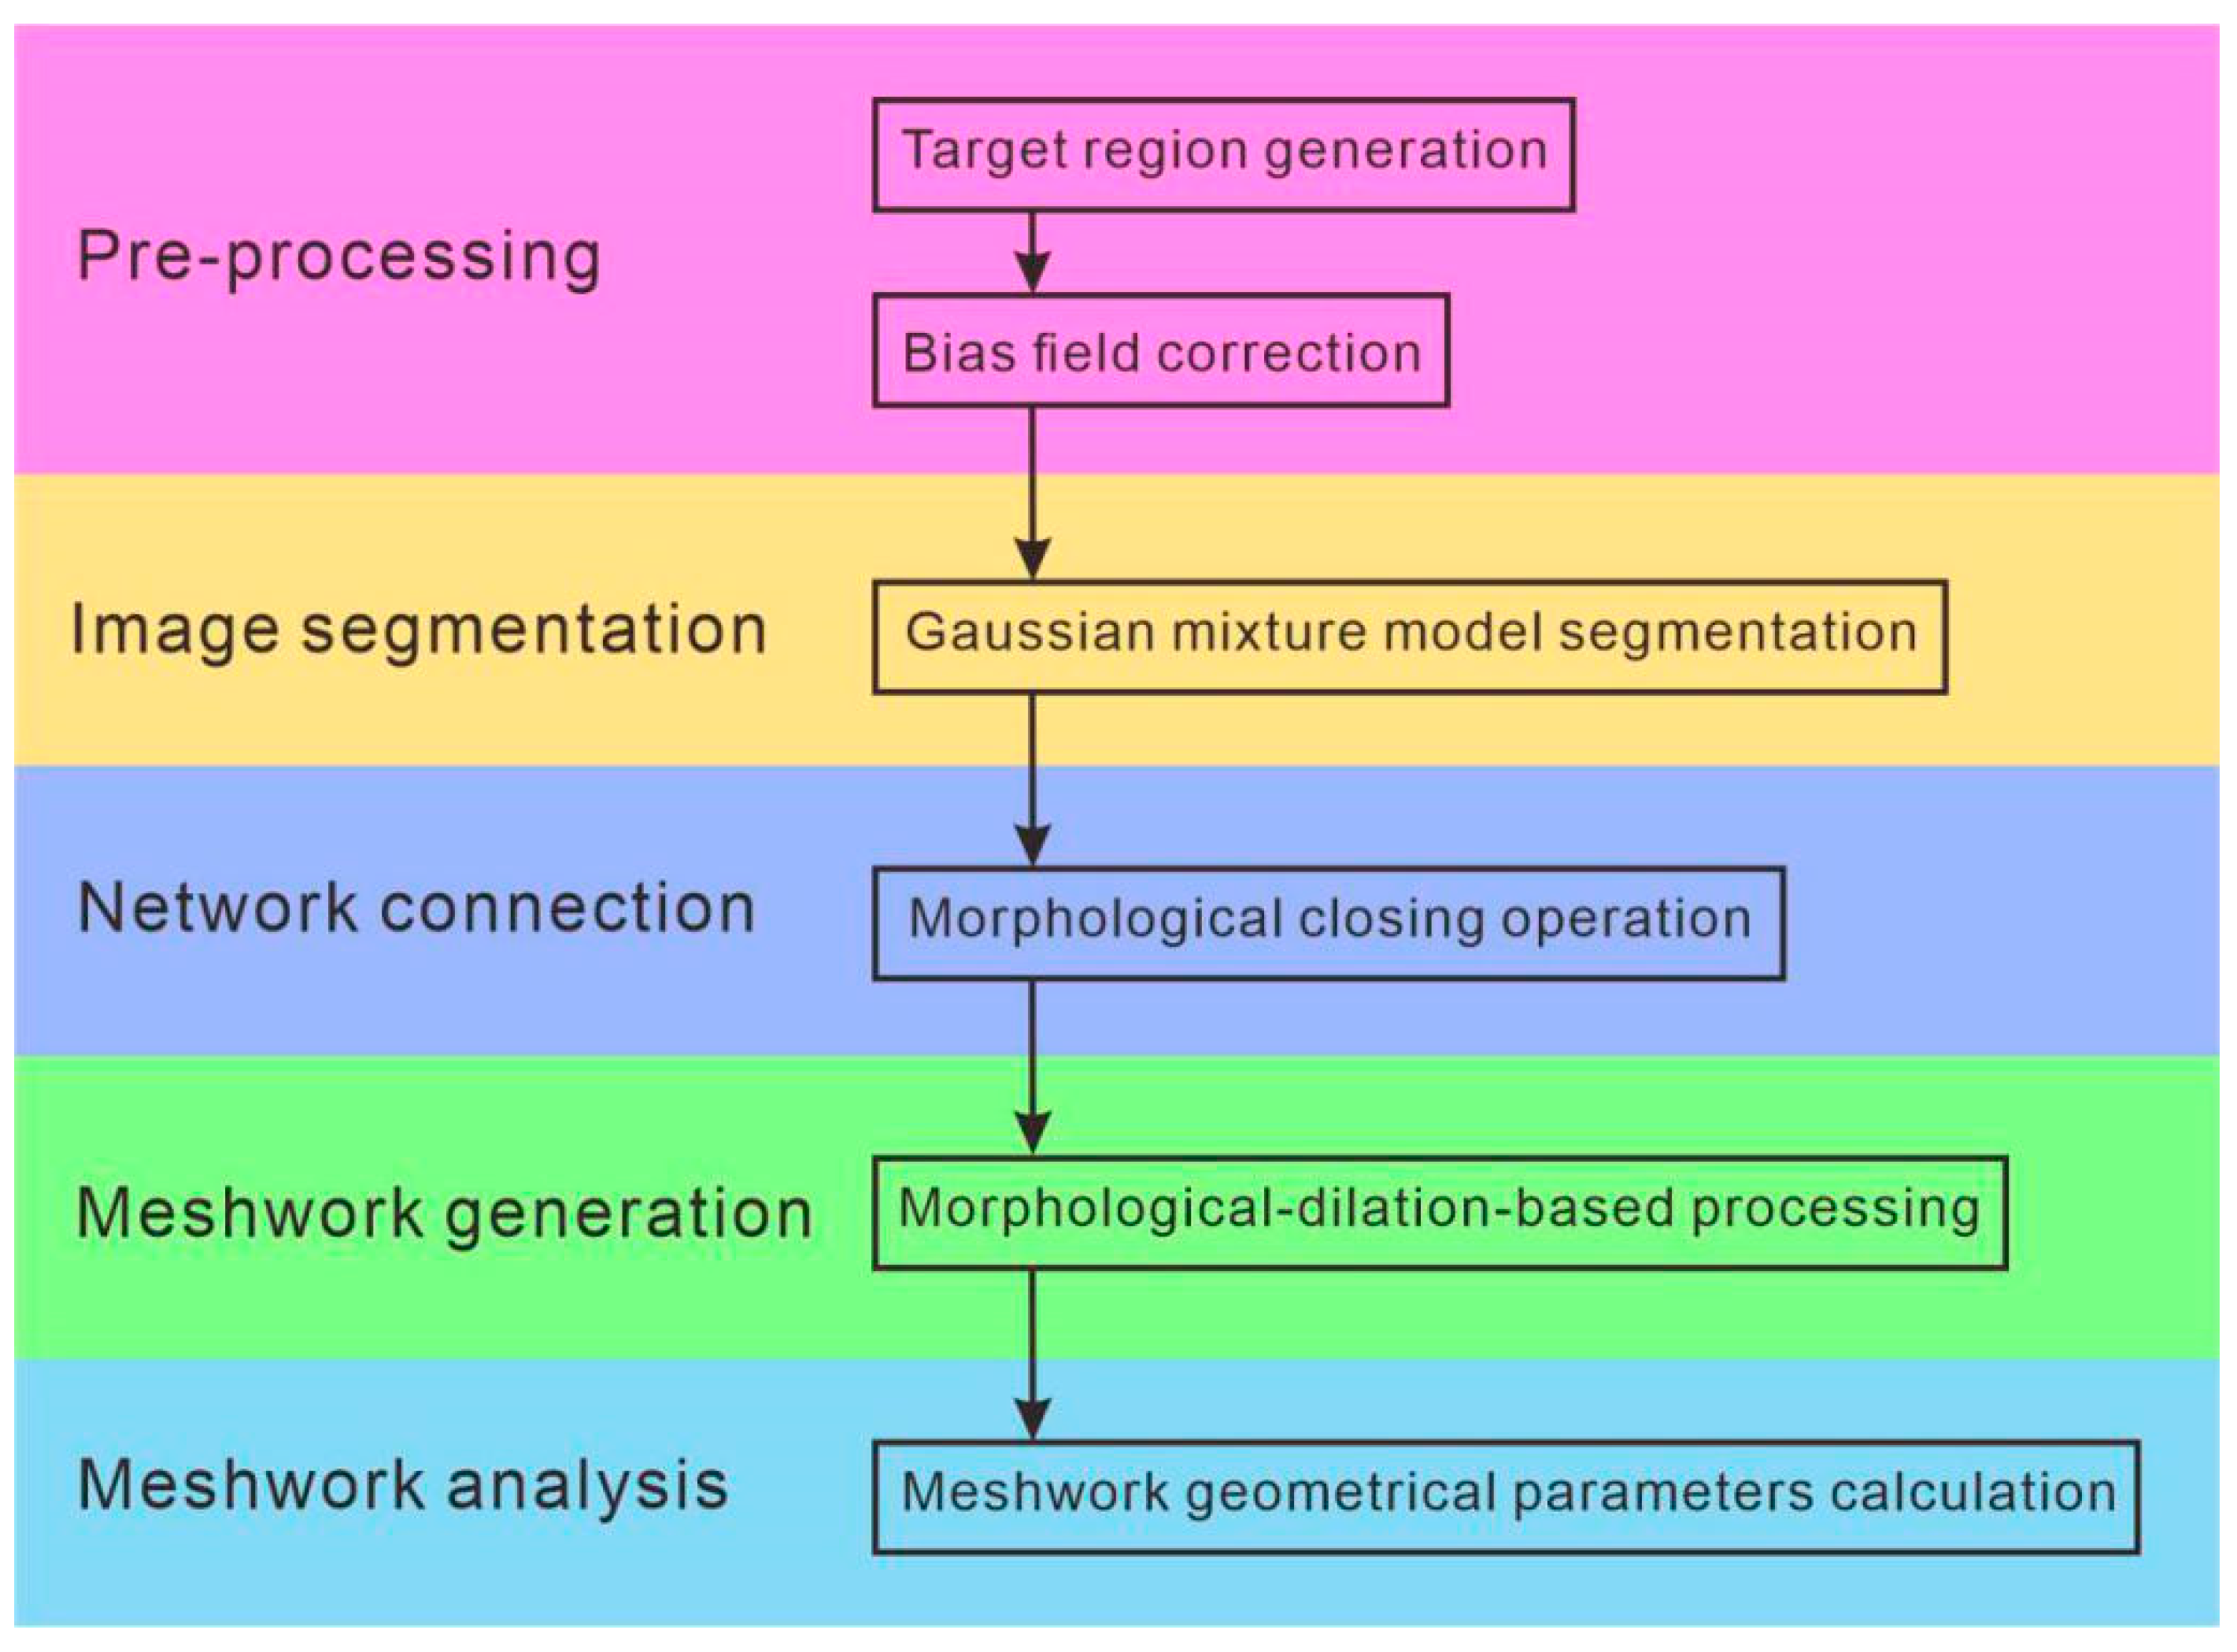
2. Methods
2.1. Preprocessing
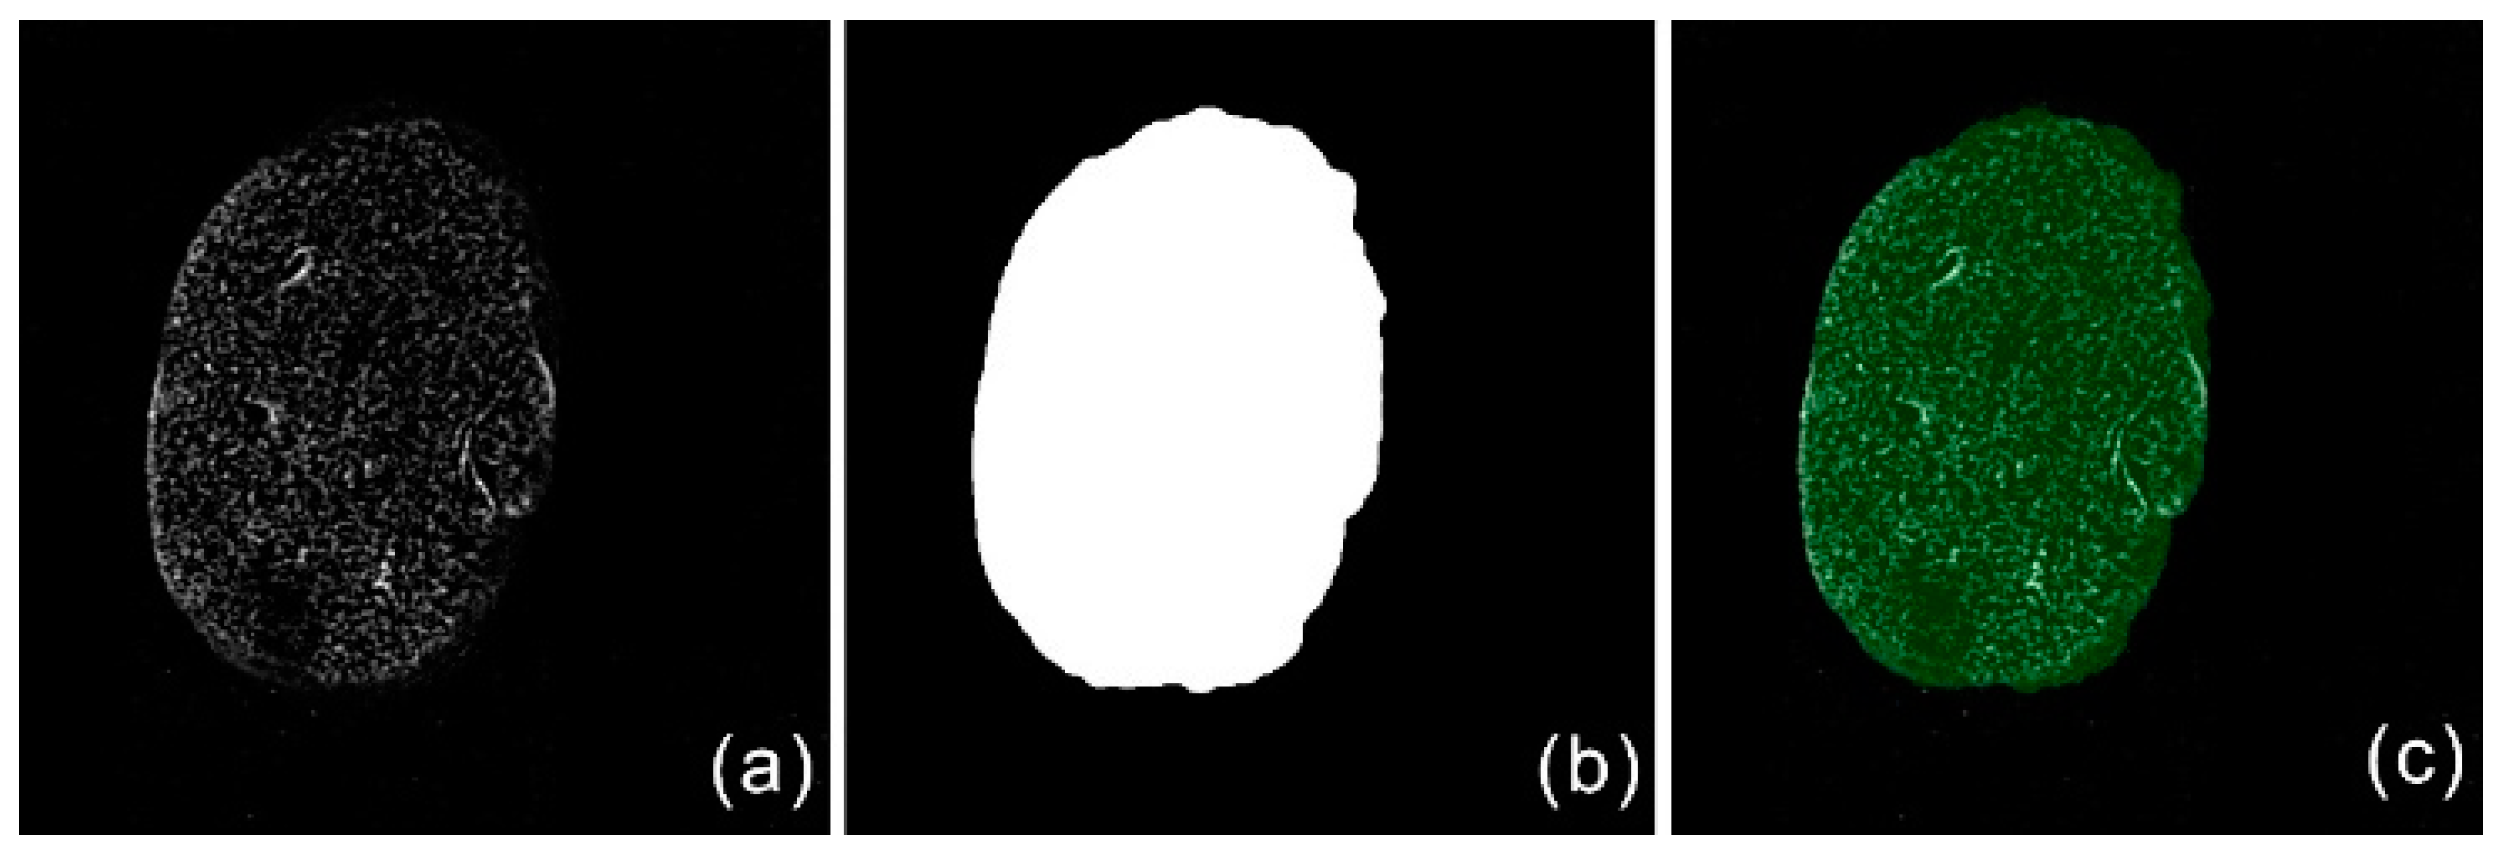
2.1.1. Target Region Generation
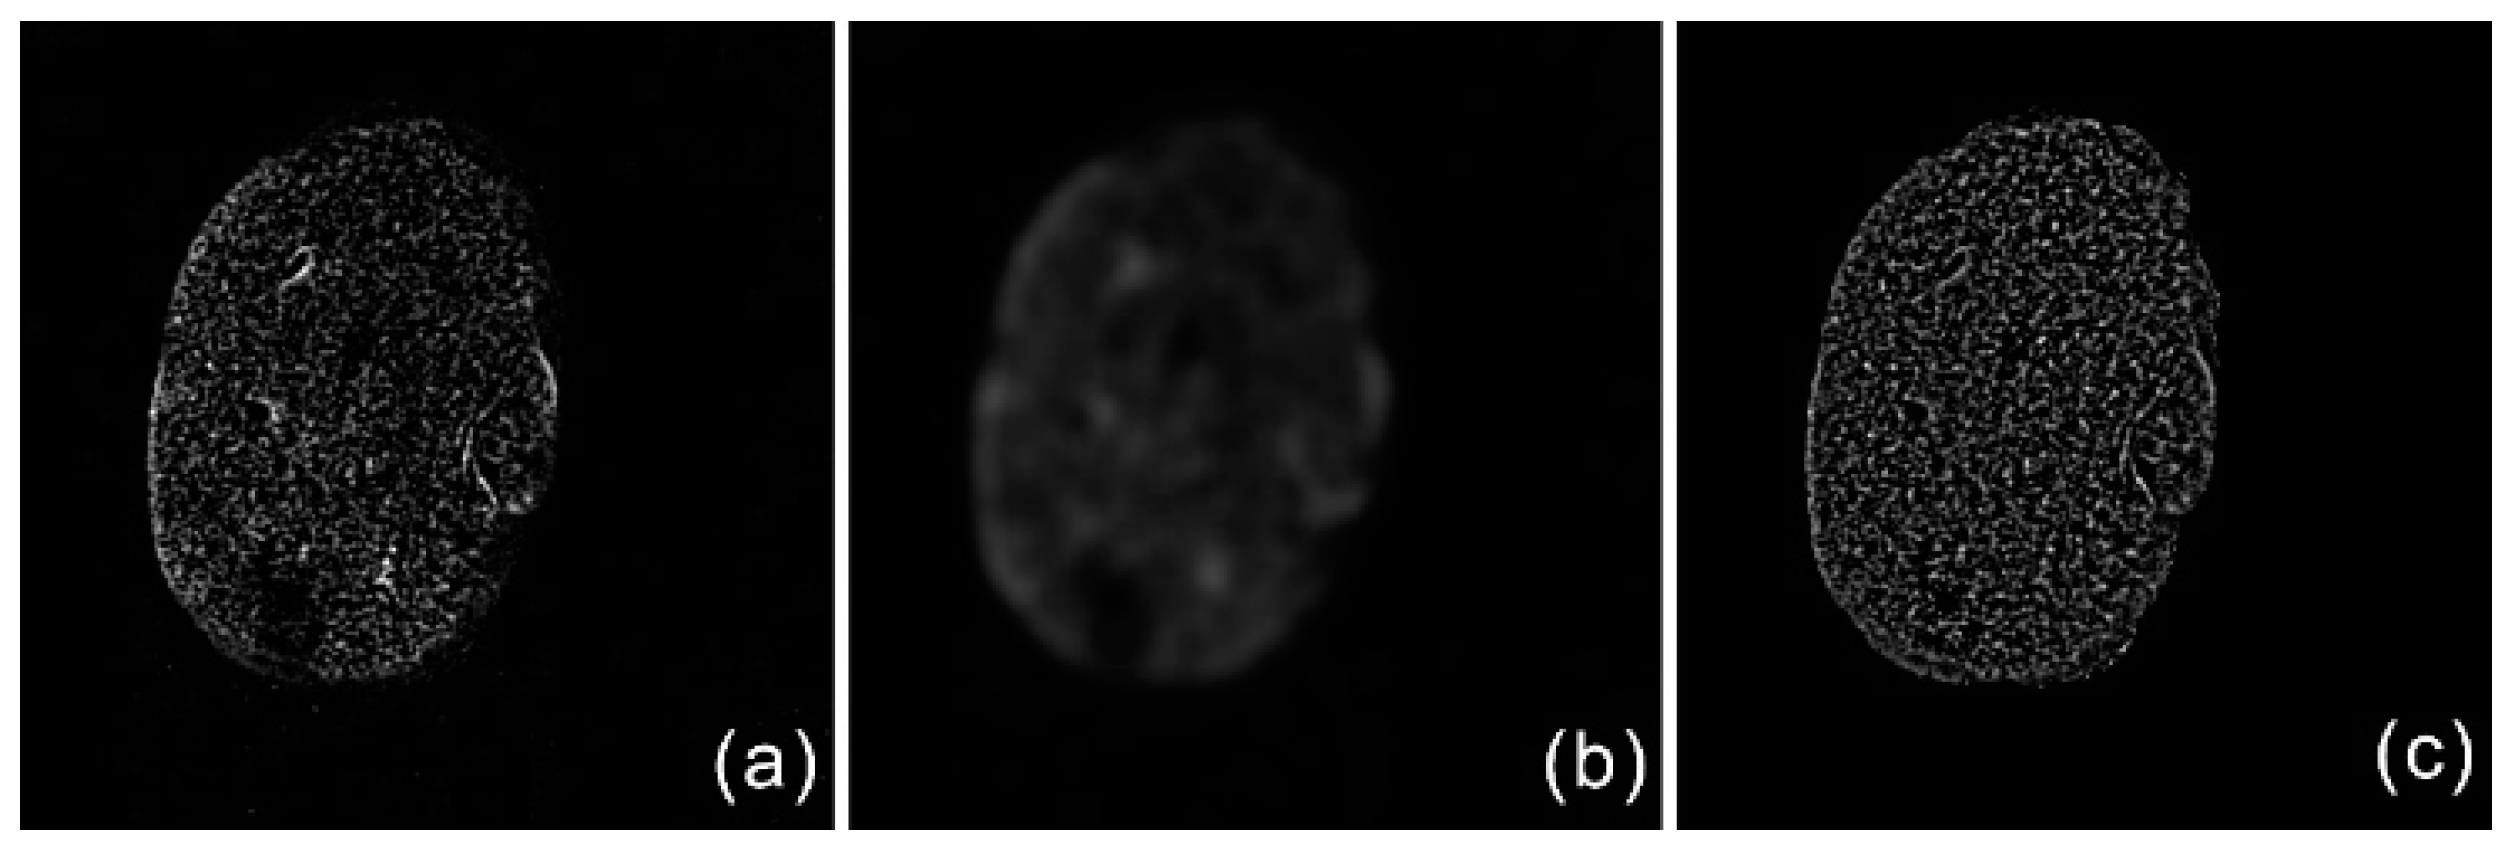
2.1.2. Bias Field Correction
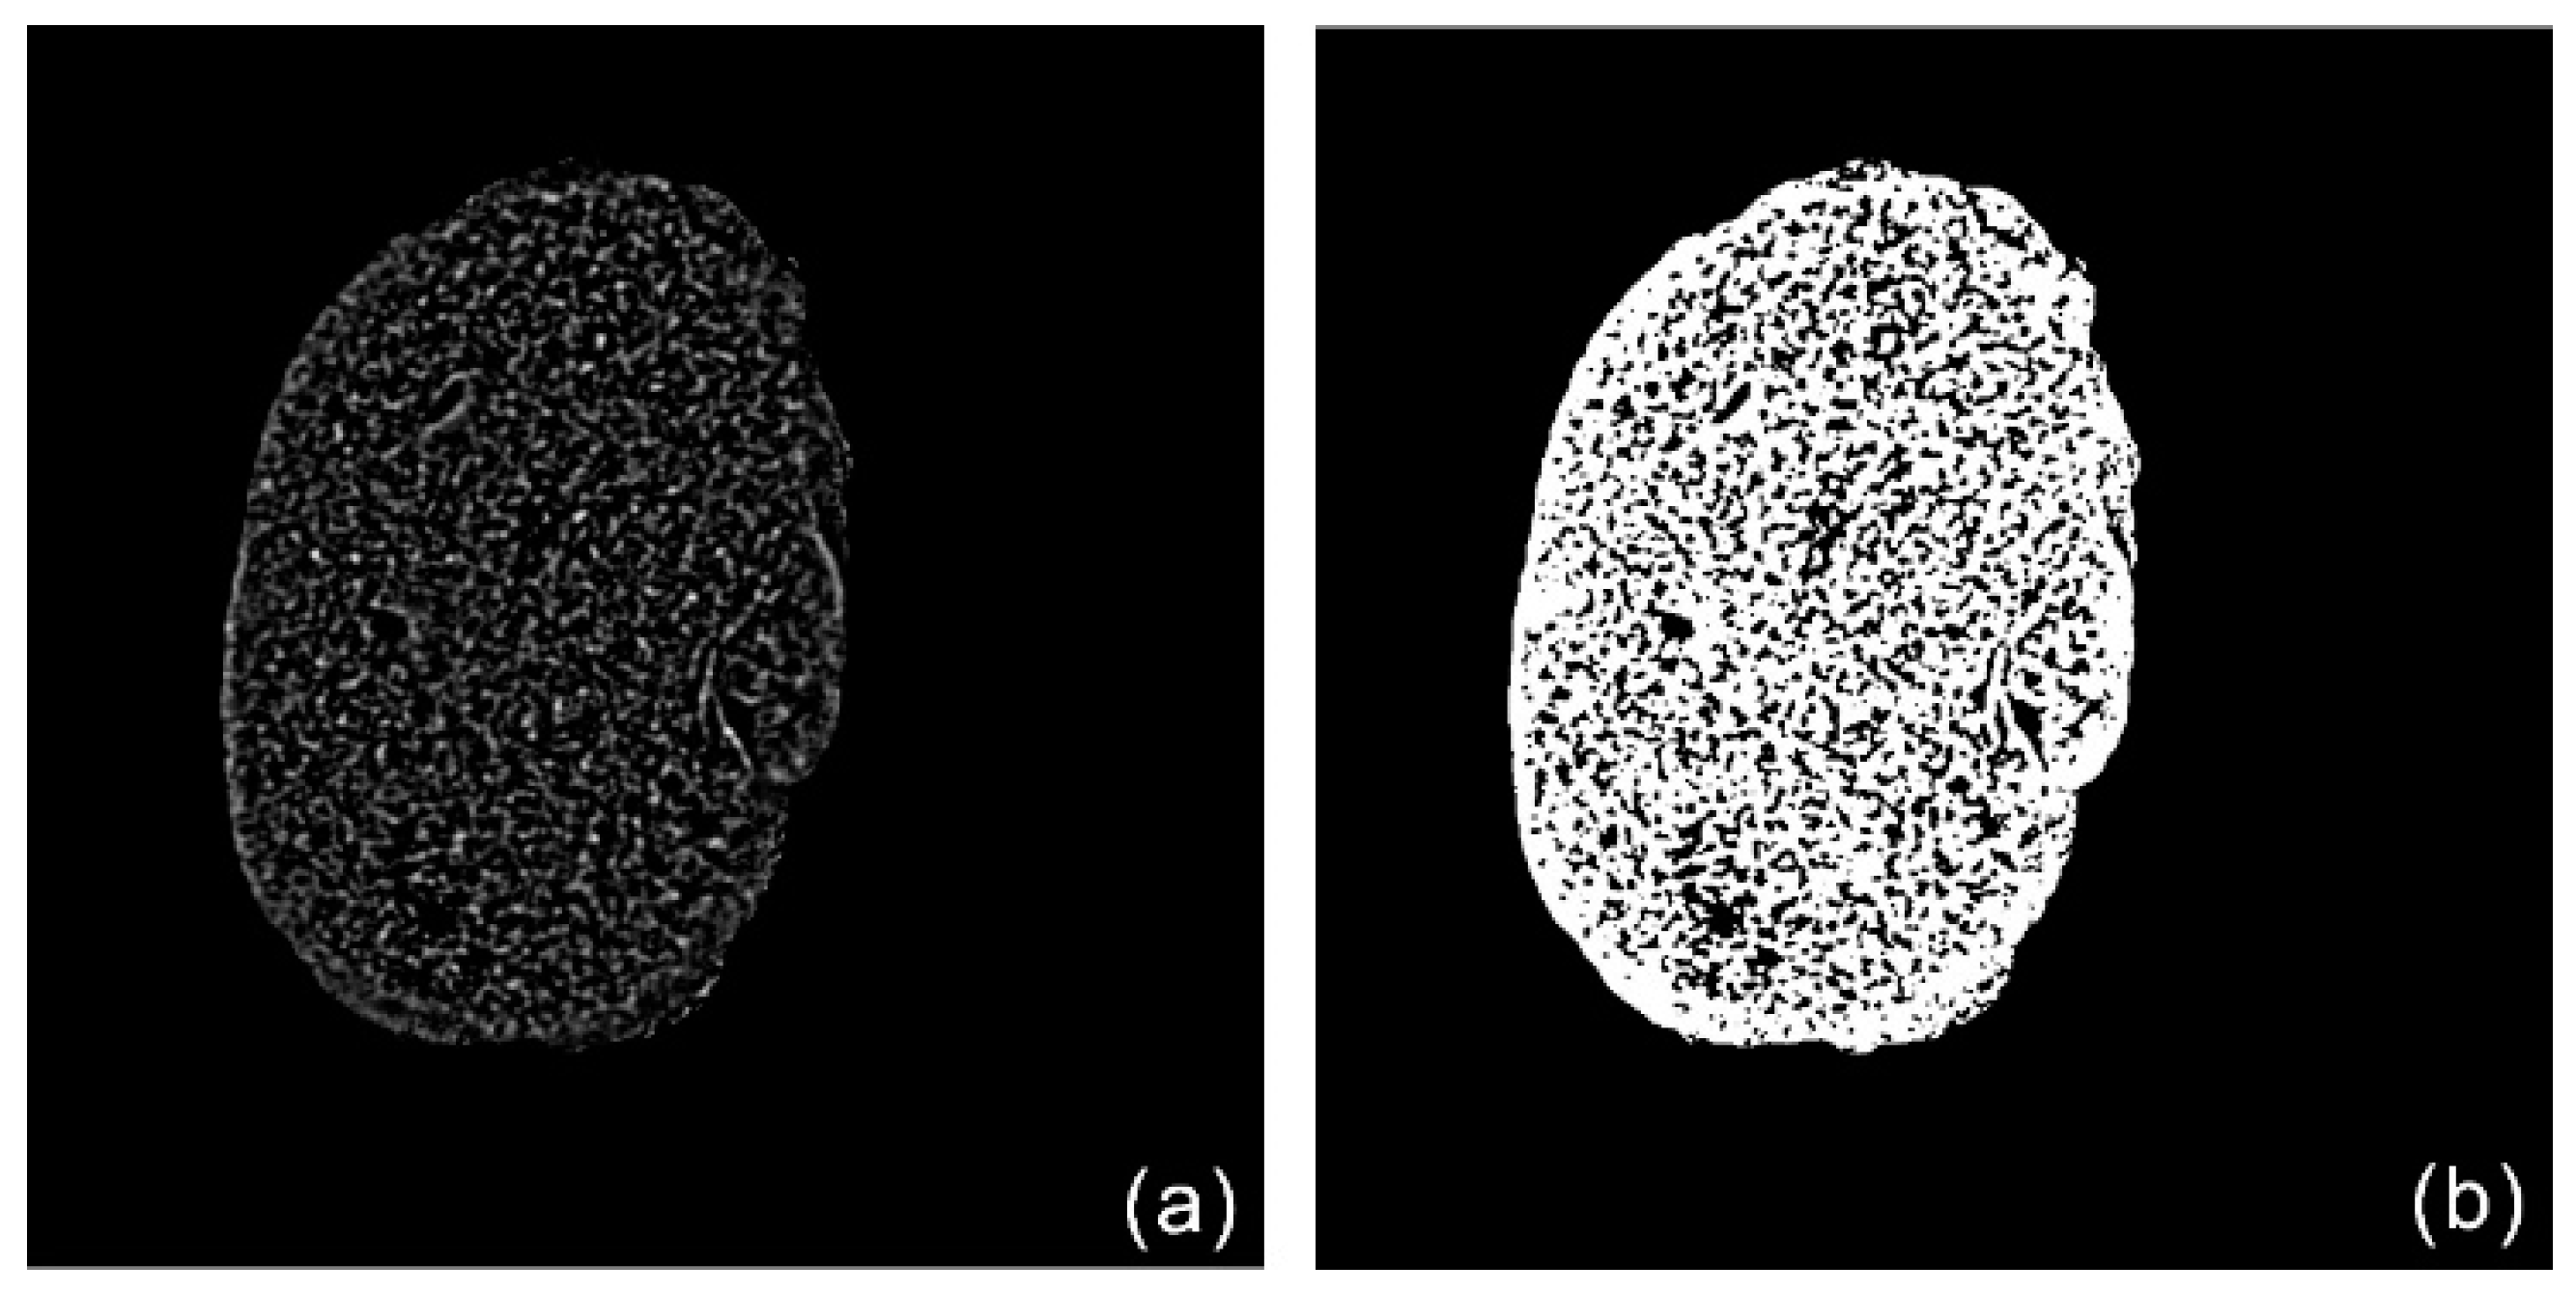
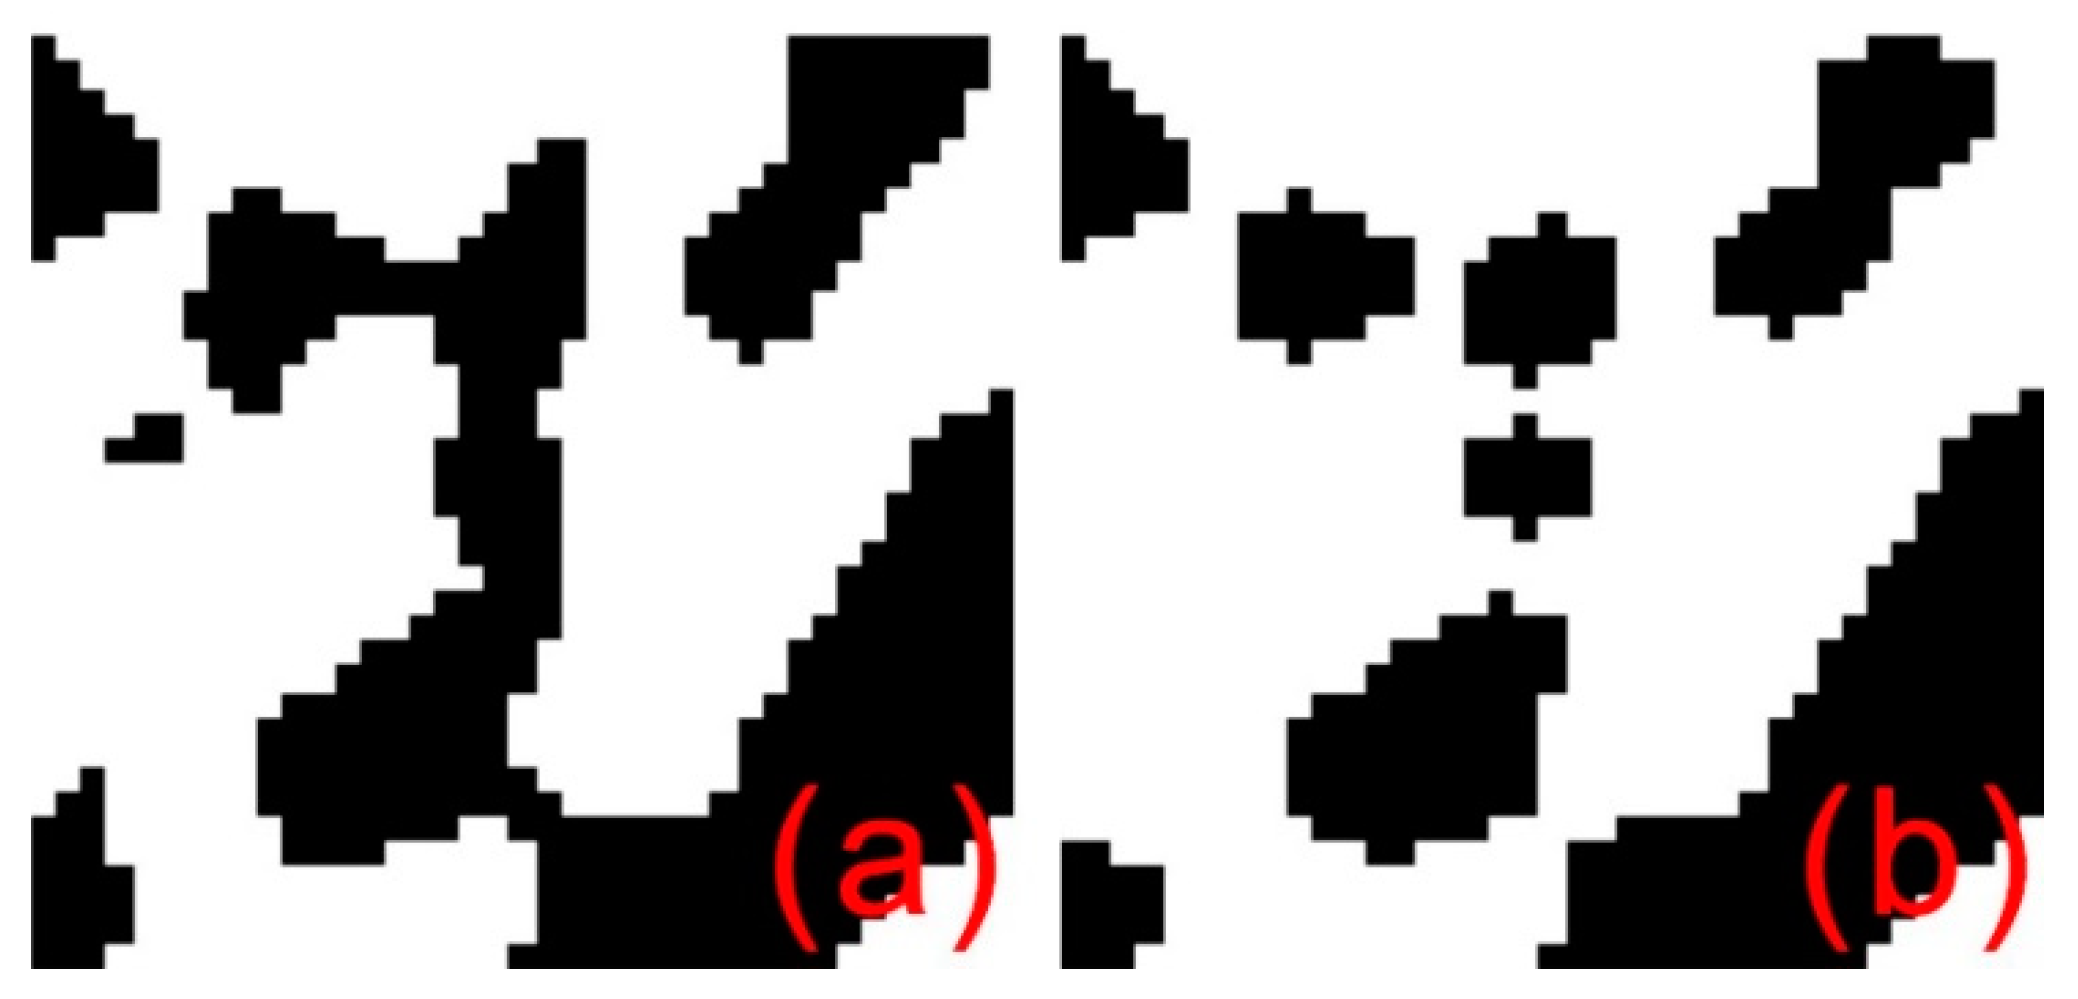
2.2. Image Segmentation
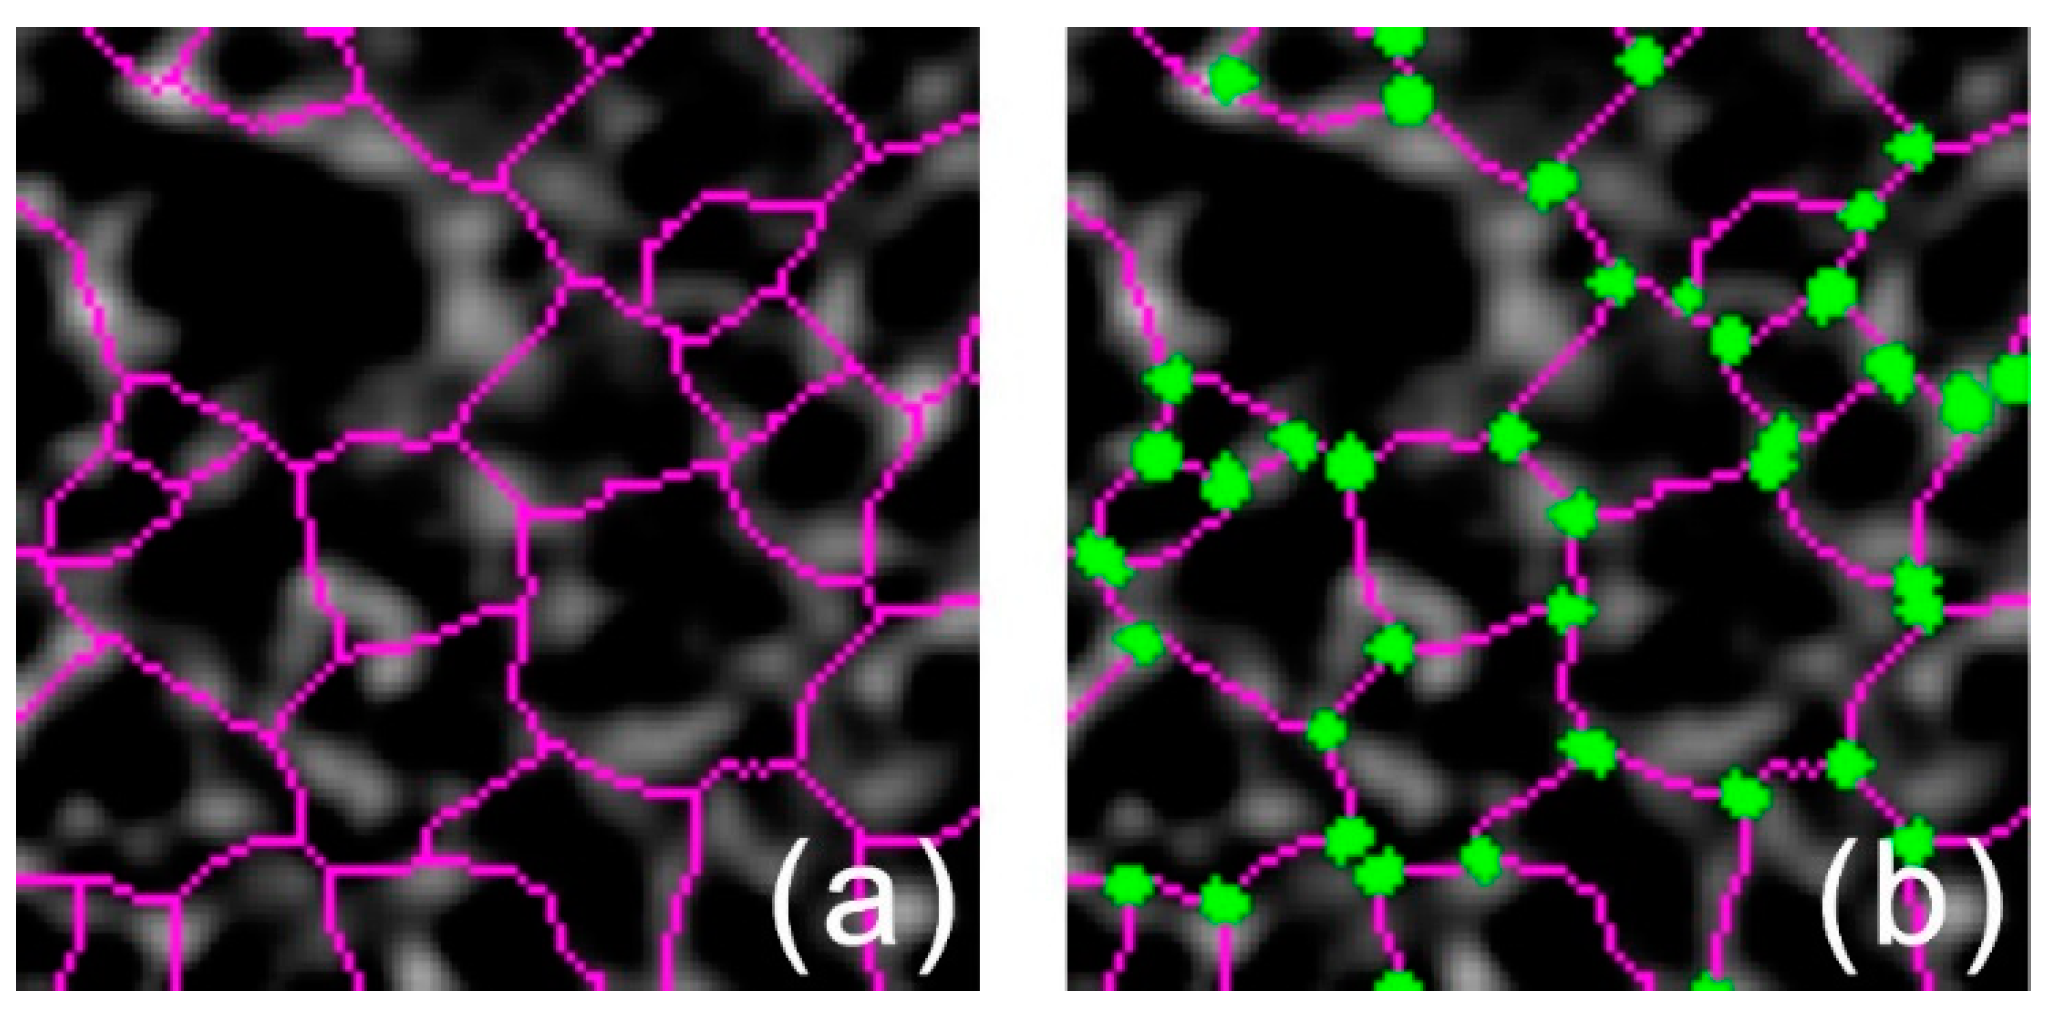
2.3. Network Connection
2.4. Meshwork Generation
2.5. Meshwork Geometrical Parameters Calculation
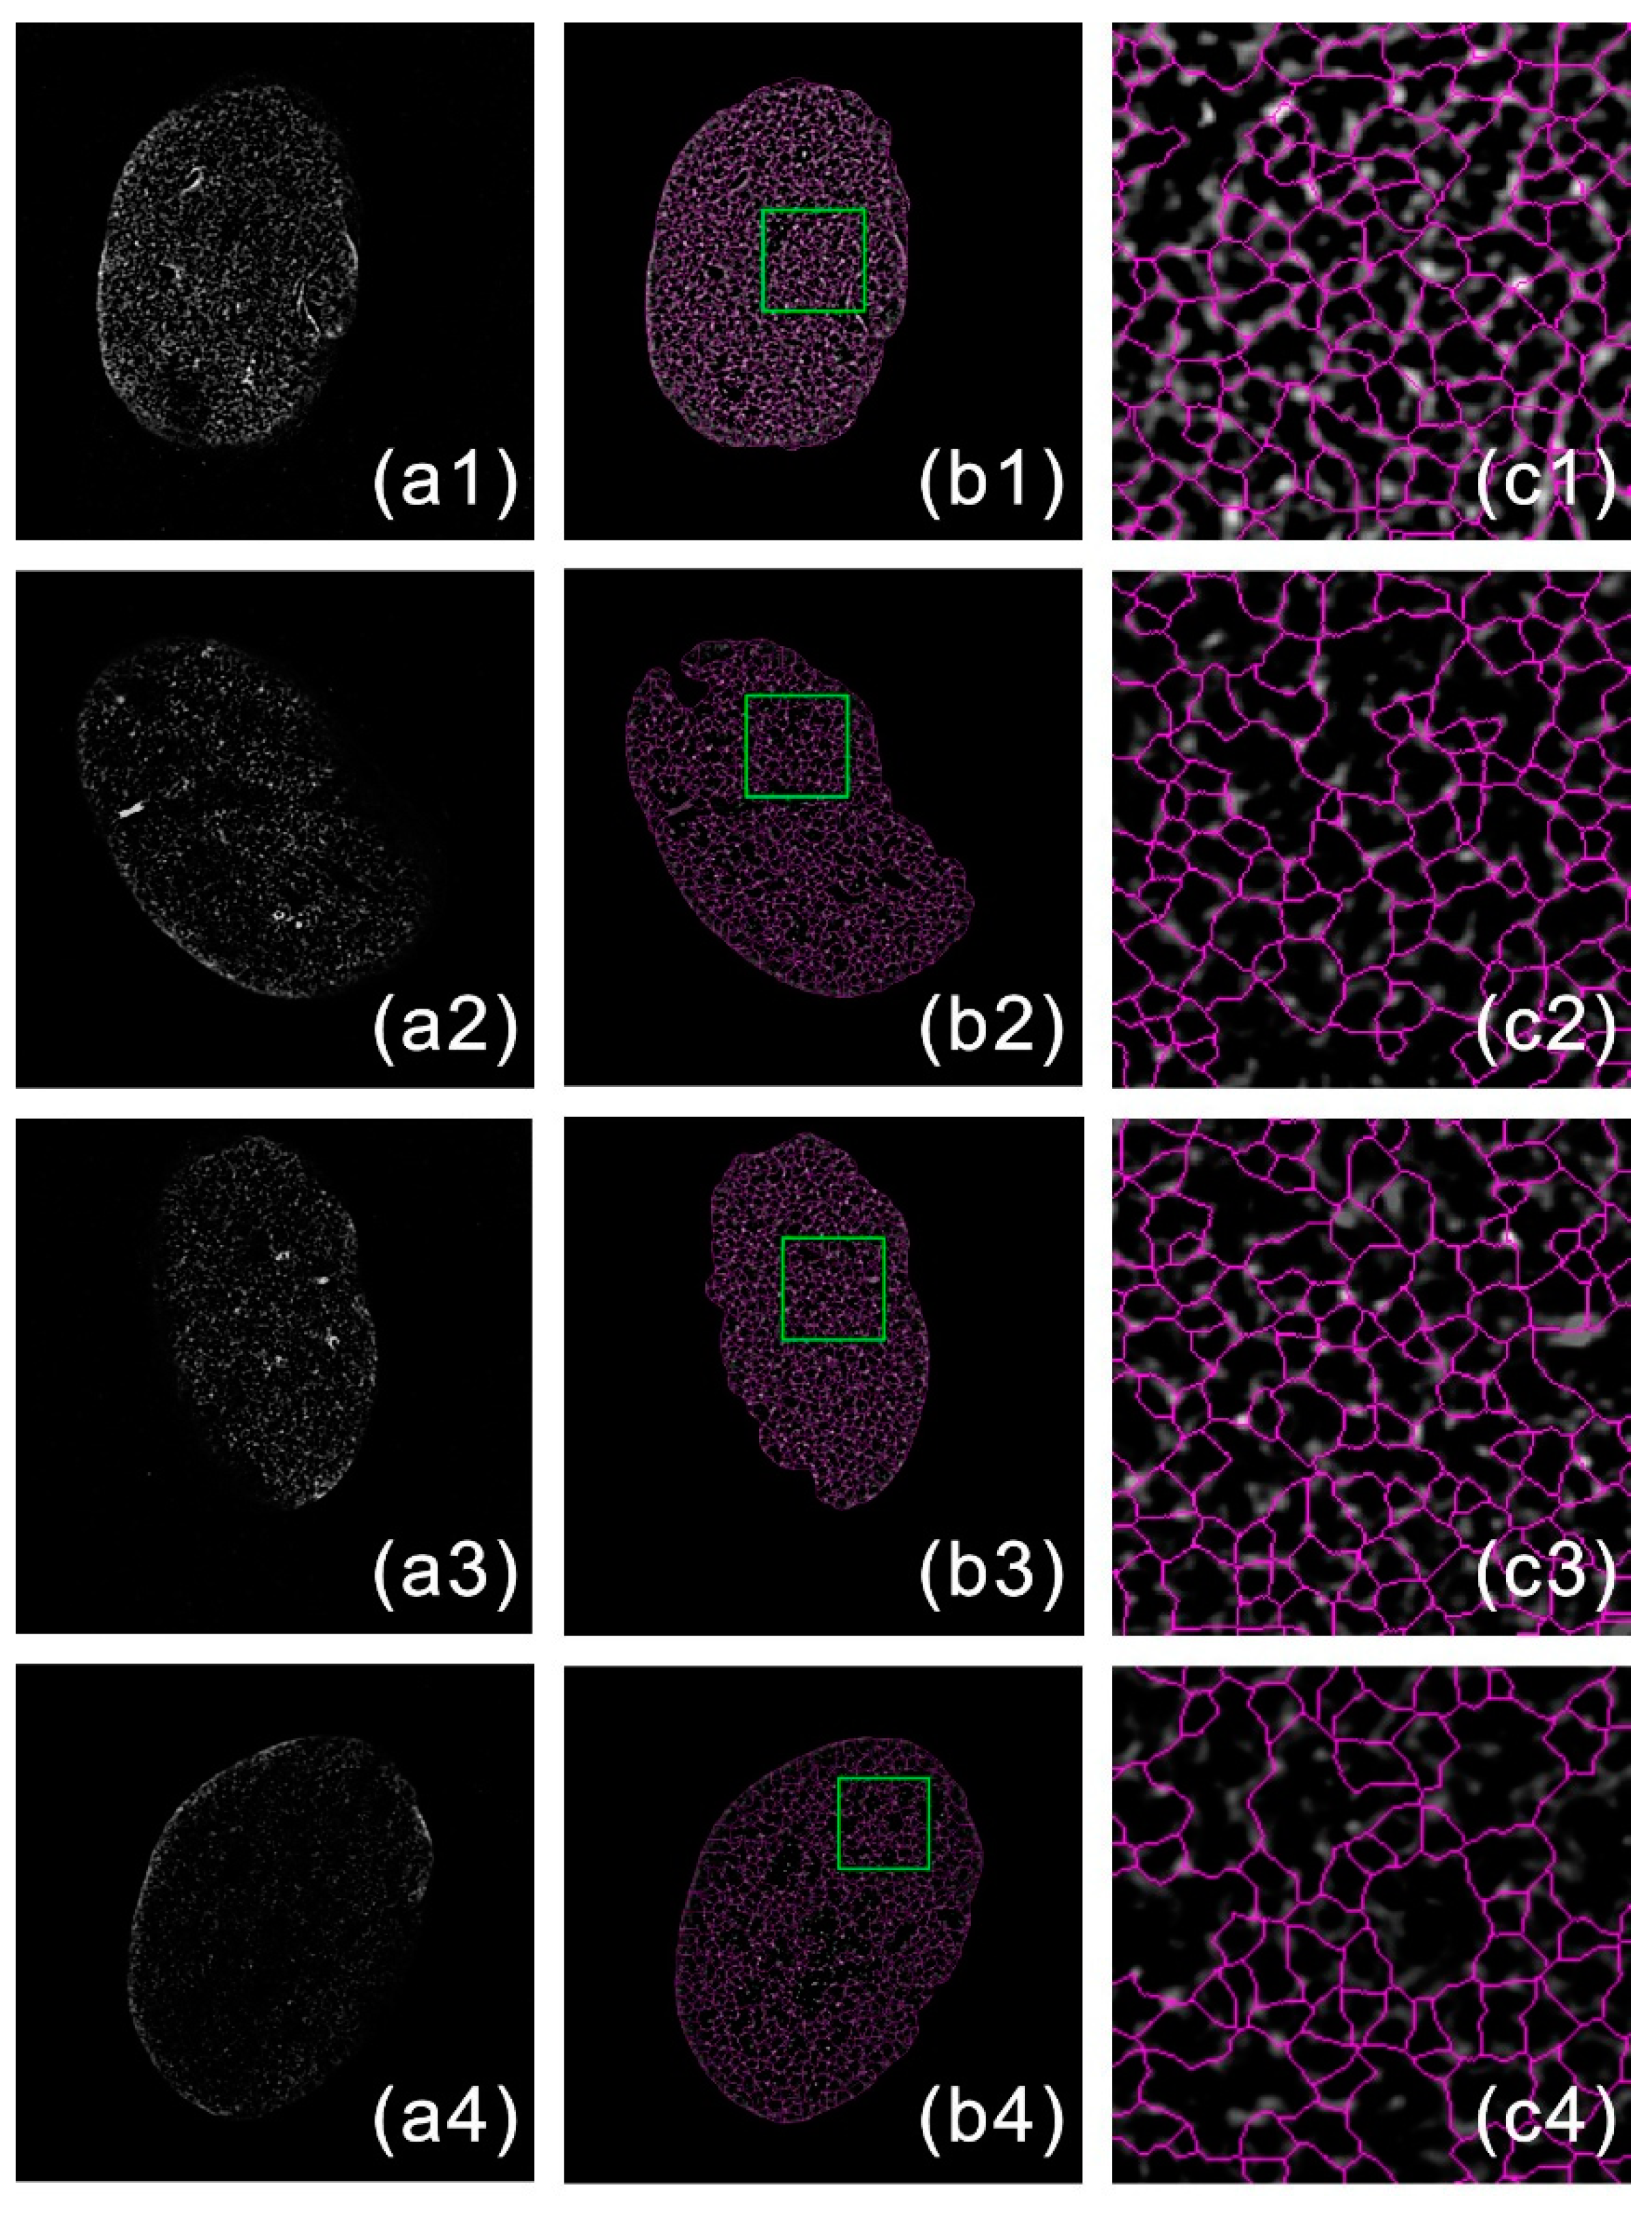
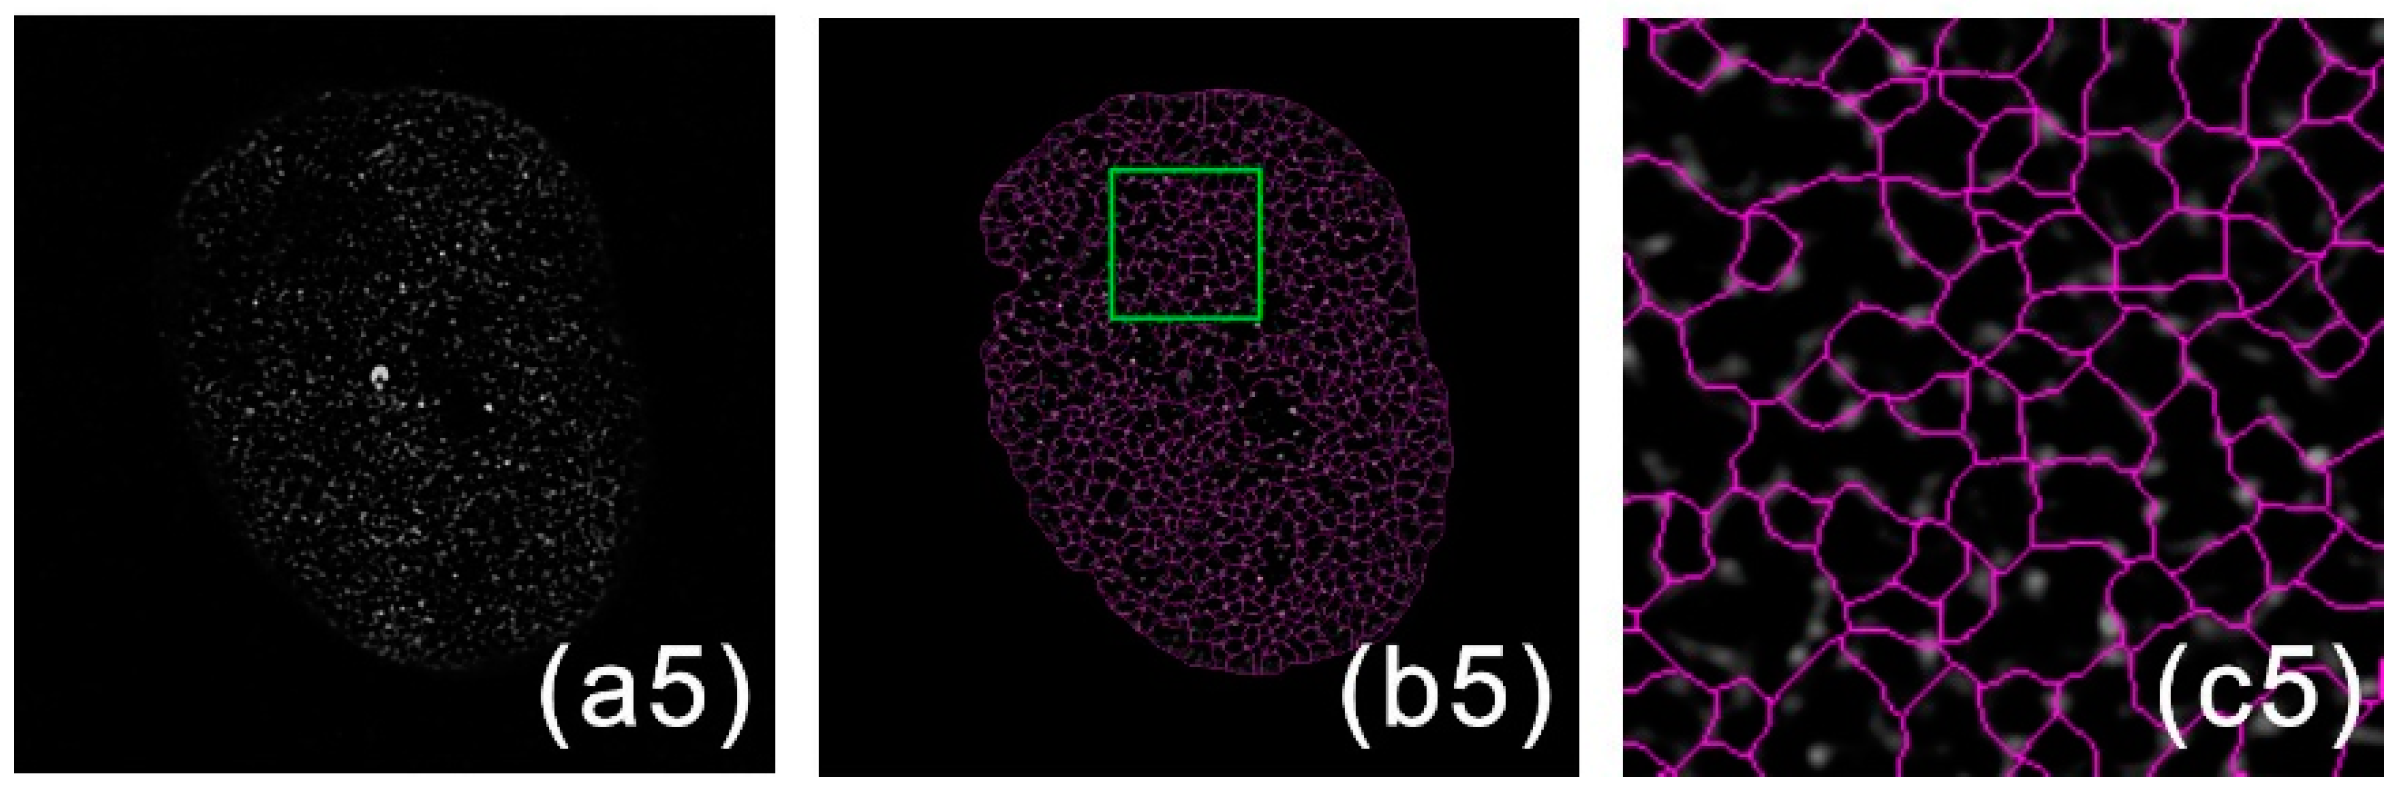
3. Results
4. Discussion
5. Conclusions
Author Contributions
Funding
Acknowledgments
Conflicts of Interest
Appendix A. The Importance of Understanding Nuclear Lamina Network Structure
References
- Turgay, Y.; Eibauer, M.; Goldman, A.E.; Shimi, T.; Khayat, M.; Ben-Harush, K.; Dubrovsky-Gaupp, A.; Sapra, K.T.; Goldman, R.D.; Medalia, O. The Molecular Architecture of Lamins in Somatic Cells. Nature 2017, 543, 261–264. [Google Scholar] [CrossRef] [PubMed]
- Turgay, Y.; Medalia, O. The Structure of Lamin Filaments in Somatic Cells as Revealed by Cryo-Electron Tomography. Nucleus 2017, 8, 475–481. [Google Scholar] [CrossRef] [PubMed]
- Dechat, T.; Adam, S.A.; Taimen, P.; Shimi, T.; Goldman, R.D. Nuclear Lamins. Cold Spring Harb. Perspect. Biol. 2010, 2, a000547. [Google Scholar] [CrossRef]
- Fawcett, D.W. On the Occurrence of a Fibrous Lamina on the Inner Aspect of the Nuclear Envelope in Certain Cells of Vertebrates. Am. J. Anat. 1966, 119, 129–145. [Google Scholar] [CrossRef] [PubMed]
- Aaronson, R.P.; Blobel, G. Isolation of Nuclear Pore Complexes in Association with a Lamina. Proc. Natl. Acad. Sci. USA 1975, 72, 1007–1011. [Google Scholar] [CrossRef]
- Stuurman, N.; Heins, S.; Aebi, U. Nuclear Lamins: Their Structure, Assembly, and Interactions. J. Struct. Biol. 1998, 122, 42–66. [Google Scholar] [CrossRef] [PubMed]
- Kittisopikul, M.; Virtanen, L.; Taimen, P.; Goldman, R.D. Quantitative Analysis of Nuclear Lamins Imaged by Super-Resolution Light Microscopy. Cells 2019, 8, 361. [Google Scholar] [CrossRef]
- Gustafsson, M.G. Nonlinear Structured-Illumination Microscopy: Wide-Field Fluorescence Imaging with Theoretically Unlimited Resolution. Proc. Natl. Acad. Sci. USA 2005, 102, 13081–13086. [Google Scholar] [CrossRef]
- Hell, S.W.; Wichmann, J. Breaking the Diffraction Resolution Limit by Stimulated Emission: Stimulated-Emission-Depletion Fluorescence Microscopy. Opt. Lett. 1994, 19, 780–782. [Google Scholar] [CrossRef]
- Betzig, E.; Patterson, G.H.; Sougrat, R.; Lindwasser, O.W.; Olenych, S.; Bonifacino, J.S.; Davidson, M.W.; Lippincott-Schwartz, J.; Hess, H.F. Imaging Intracellular Fluorescent Proteins at Nanometer Resolution. Science 2006, 313, 1642–1645. [Google Scholar] [CrossRef]
- Rust, M.J.; Bates, M.; Zhuang, X. Sub-Diffraction-Limit Imaging by Stochastic Optical Reconstruction Microscopy (STORM). Nat. Methods 2006, 3, 793–795. [Google Scholar] [CrossRef] [PubMed]
- Hess, S.T.; Girirajan, T.P.K.; Mason, M.D. Ultra-High Resolution Imaging by Fluorescence Photoactivation Localization Microscopy. Biophys. J. 2006, 91, 4258–4272. [Google Scholar] [CrossRef] [PubMed]
- Shimi, T.; Kittisopikul, M.; Tran, J.; Goldman, A.E.; Adam, S.A.; Zheng, Y.; Jaqaman, K.; Goldman, R.D. Structural Organization of Nuclear Lamins A, C, B1, and B2 Revealed by Superresolution Microscopy. Mol. Biol. Cell 2015, 26, 4075–4086. [Google Scholar] [CrossRef] [PubMed]
- Kner, P.; Chhun, B.B.; Griffis, E.R.; Winoto, L.; Gustafsson, M.G. Super-Resolution Video Microscopy of Live Cells by Structured Illumination. Nat. Methods 2009, 6, 339–342. [Google Scholar] [CrossRef] [PubMed]
- Shao, L.; Kner, P.; Rego, E.H.; Gustafsson, M.G. Super-Resolution 3D Microscopy of Live Whole Cells Using Structured Illumination. Nat. Methods 2011, 8, 1044–1046. [Google Scholar] [CrossRef]
- Reynolds, D.A. Gaussian Mixture Models. In Encyclopedia of Biometrics; Springer: Berlin/Heidelberg, Germany, 2009; Volume 741. [Google Scholar]
- Bishop, C.M. Pattern Recognition and Machine Learning; Springer: Berlin/Heidelberg, Germany, 2006. [Google Scholar]
- Bouguila, N. Count Data Modeling and Classification Using Finite Mixtures of Distributions. IEEE Trans. Neural Netw. 2011, 22, 186–198. [Google Scholar] [CrossRef]
- Yuksel, S.E.; Wilson, J.N.; Gader, P.D. Twenty Years of Mixture of Experts. IEEE Trans. Neural Netw. Learn. Syst. 2012, 23, 1177–1193. [Google Scholar] [CrossRef]
- Vincent, L. Morphological Area Openings and Closings for Grey-Scale Images. In Shape in Picture; Springer: Berlin/Heidelberg, Germany, 1994; pp. 197–208. [Google Scholar]
- Vincent, L. Grayscale Area Openings and Closings, Their Efficient Implementation and Applications. In Proceedings of the EURASIP First Workshop on Mathematical Morphology and Its Applications to Signal Processing, Barcelona, Spain, 10–14 May 1993; pp. 22–27. [Google Scholar]
- Tambe, S.B.; Kulhare, D.; Nirmal, M.D.; Prajapati, G. Image Processing (IP) through Erosion and Dilation Methods. Int. J. Emerg. Technol. Adv. Eng. 2013, 3, 285–289. [Google Scholar]
- Jackway, P.T.; Deriche, M. Scale-Space Properties of the Multiscale Morphological Dilation-Erosion. IEEE Trans. Pattern Anal. Mach. Intell. 1996, 18, 38–51. [Google Scholar] [CrossRef]
- Zang, P.; Liu, G.; Zhang, M.; Dongye, C.; Wang, J.; Pechauer, A.D.; Hwang, T.S.; Wilson, D.J.; Huang, D.; Li, D.; et al. Automated Motion Correction Using Parallel-Strip Registration for Wide-Field En Face OCT Angiogram. Biomed. Opt. Express 2016, 7, 2823–2836. [Google Scholar] [CrossRef]
- ZEISS Elyra 7 with Lattice SIM: Your Flexible Platform for Fast and Gentle. Superresolution Microscopy. Available online: https://www.zeiss.com/microscopy/int/cmp/lsc/2019/superresolution/elyra-7.html?utm_source=google&utm_medium=cpc&utm_campaign=new-chapter&gclid=EAIaIQobChMI6KKDjeSc7QIVkzArCh34uQ-KEAAYBCAAEgKcxPD_BwE (accessed on 30 November 2020).
- Shimi, T.; Pfleghaar, K.; Kojima, S.-I.; Pack, C.-G.; Solovei, I.; Goldman, A.E.; Adam, S.A.; Shumaker, D.K.; Kinjo, M.; Cremer, T.; et al. The A- And B-Type Nuclear Lamin Networks: Microdomains Involved in Chromatin Organization and Transcription. Genes Dev. 2008, 22, 3409–3421. [Google Scholar] [CrossRef] [PubMed]
- Wen, S.; Liu, W.; Yang, Y.; Huang, T.; Zeng, Z. Generating Realistic Videos from Keyframes with Concatenated GANs. IEEE Trans. Circuits Syst. Video Technol. 2019, 29, 2337–2348. [Google Scholar] [CrossRef]
- Dong, M.; Wen, S.; Zeng, Z.; Yan, Z.; Huang, T. Sparse Fully Convolutional Network for Face Labeling. Neurocomputing 2019, 331, 465–472. [Google Scholar] [CrossRef]
- Wen, S.; Dong, M.; Yang, Y.; Zhou, P.; Huang, T.; Chen, Y. End-to-End Detection-Segmentation Network for Face Labeling. IEEE Trans. Emerg. Top. Comp. Intell. 2019, 99, 1–11. [Google Scholar]
- Moriuchi, T.; Kuroda, M.; Kusumoto, F.; Osumi, T.; Hirose, F. Lamin A Reassembly at the End of Mitosis Is Regulated by Its SUMO-Interacting Motif. Exp. Cell Res. 2016, 342, 83–94. [Google Scholar] [CrossRef]
- Burla, R.; Carcuro, M.; Torre, M.L.; Fratini, F.; Crescenzi, M.; D’Apice, M.R.; Spitalieri, P.; Raffa, G.D.; Astrologo, L.; Lattanzi, G.; et al. The Telomeric Protein AKTIP Interacts with A- and B-Type Lamines and Is Involved in Regulation of Cellular Senescence. Open Biol. 2016, 6, 160103. [Google Scholar] [CrossRef]
- Shumaker, D.K.; Kuczmarski, E.R.; Goldman, R.D. The Nucleoskeleton: Lamines and Actin Are Major Players in Essential Nuclear Functions. Curr. Opin. Cell Biol. 2003, 15, 358–366. [Google Scholar] [CrossRef]
- Perovanovic, J.; Dell’Orso, S.; Gnochi, V.F.; Jaiswal, J.K.; Sartorelli, V.; Vigouroux, C.; Mamchaoui, K.; Mouly, V.; Bonne, G.; Hoffman, E.P. Laminopathies Disrupt Epigenomic Developmental Programs and Cell Fate. Sci. Transl. Med. 2016, 8, 335ra58. [Google Scholar] [CrossRef]
- Frock, R.L.; Kudlow, B.A.; Evans, A.M.; Jameson, S.A.; Hauschka, S.D.; Kennedy, B.K. Lamin A/C and Emerin Are Critical for Skeletal Muscle Satellite Cell Differentiation. Genes Dev. 2006, 20, 486–500. [Google Scholar] [CrossRef]
- van Loosdregt, I.A.E.W.; Kamps, M.A.; Oomens, C.W.J.; Loerakker, S.; Broers, J.L.V.; Bouten, C.V.C. Lmna knockout mouse embryonic fibroblasts are less contractile than their wild-type counterparts. Integr. Biol. 2017, 9, 709–721. [Google Scholar] [CrossRef]


Publisher’s Note: MDPI stays neutral with regard to jurisdictional claims in published maps and institutional affiliations. |
© 2020 by the authors. Licensee MDPI, Basel, Switzerland. This article is an open access article distributed under the terms and conditions of the Creative Commons Attribution (CC BY) license (http://creativecommons.org/licenses/by/4.0/).
Share and Cite
Chen, Y.; Sun, Z.; He, Y.; Zhang, X.; Wang, J.; Li, W.; Xing, L.; Gao, F.; Shi, G. Automated Nuclear Lamina Network Recognition and Quantitative Analysis in Structured Illumination Super-Resolution Microscope Images Using a Gaussian Mixture Model and Morphological Processing. Photonics 2020, 7, 119. https://doi.org/10.3390/photonics7040119
Chen Y, Sun Z, He Y, Zhang X, Wang J, Li W, Xing L, Gao F, Shi G. Automated Nuclear Lamina Network Recognition and Quantitative Analysis in Structured Illumination Super-Resolution Microscope Images Using a Gaussian Mixture Model and Morphological Processing. Photonics. 2020; 7(4):119. https://doi.org/10.3390/photonics7040119
Chicago/Turabian StyleChen, Yiwei, Zhenglong Sun, Yi He, Xin Zhang, Jing Wang, Wanyue Li, Lina Xing, Feng Gao, and Guohua Shi. 2020. "Automated Nuclear Lamina Network Recognition and Quantitative Analysis in Structured Illumination Super-Resolution Microscope Images Using a Gaussian Mixture Model and Morphological Processing" Photonics 7, no. 4: 119. https://doi.org/10.3390/photonics7040119
APA StyleChen, Y., Sun, Z., He, Y., Zhang, X., Wang, J., Li, W., Xing, L., Gao, F., & Shi, G. (2020). Automated Nuclear Lamina Network Recognition and Quantitative Analysis in Structured Illumination Super-Resolution Microscope Images Using a Gaussian Mixture Model and Morphological Processing. Photonics, 7(4), 119. https://doi.org/10.3390/photonics7040119