Article

Ultrafast Hyperspectral Transient Absorption Spectroscopy: Application to Single Layer Graphene

Dipartimento di Fisica “Ettore Pancini”, Università degli Studi di Napoli “Federico II”, Complesso Universitario di Monte S. Angelo, Via Cintia, I-80126 Napoli, Italy
Photonics 2019, 6(3), 95; https://doi.org/10.3390/photonics6030095
Submission received: 13 August 2019 / Revised: 27 August 2019 / Accepted: 28 August 2019 / Published: 29 August 2019
(This article belongs to the Special Issue Advanced Optical Materials and Devices)

Abstract

:
We describe the basic principles and the experimental implementation of the hyperspectral transient absorption technique, based on femtosecond laser sources. In this technique the samples were optically “pumped” using the femtosecond tunable pulse delivered by an Optical Parametric Amplifier, and “probed” for changes in transmission in a broad spectral range with a “white light” laser-generated supercontinuum. The spectra were collected by a pair of multichannel detectors which allowed retrieval of the absorbance change in a wide spectral range in one time. The use of the supercontinuum probe introduced artifacts in the measured 2D data set which could be corrected with a proper calibration of the chirp. The configuration with crossed polarization for pump and probe pulse extended the spectral measured range above and below the pump energy within the same experiment. We showed the versatility of the technique by applying it to the investigation of the charge carrier dynamics in two-dimensional single layer graphene.

1. Introduction

The development of femtosecond laser solid-state sources at kHz repetition rate and at millijoule pulse-energy has made fs transient absorption (TA) spectroscopy a widely-employed tool for the visualization of ultrafast electron dynamics in condensed matter physics [1,2,3], chemistry [4,5], and biology [6,7].
In the TA technique (pump-probe scheme) the change in the transmission or the reflection of a sample, excited by a pump pulse, is measured by a time-delayed probe pulse. Traditional pump-probe spectroscopy exploits narrow pulses centered at two specific wavelengths (two-color scheme) and makes use of single channel detectors to monitor the probe transmission along with lock-in demodulation to extract the differential signal. This scheme, which allows for low noise measurements, suffers from the fact that it is possible to probe the time-dependent variation of one wavelength at a time. In general, the investigation of ultrafast dynamics in solid target (semiconductor for example) or molecules requires to probe a wide energy spectrum in time for a correct understanding of the underlying photo-physics.
A valid solution is to use broadband fs supercontinuum pulses which can be generated by exploiting self-phase modulation in a transparent medium [8]. This allows adoption of a pump-supercontinuum probe scheme. The use of high-speed multichannel detectors and of a data acquisition system (DAQ) for fast readout permits the rapid acquisition of an entire spectrum at a chosen time delay (hyperspectral detection).
The use of a supercontinuum pulse introduces artifacts in the measurements due to the temporal dispersion of the frequency (chirp) of the probe so that the red portion of the pulse arrives earlier. These artifacts can be corrected by carefully taking in consideration the different time delays of the several monochromatic components of the probe. This requires a measurement of the chirp and a numerical procedure to correct the experimental data.
Here we describe the basic principles and the experimental implementation of the hyperspectral transient absorption technique based on supercontinuum probe. We discuss the sensitivity of the technique, the time resolution and the chirp correction method to retrieve undistorted spectra. Moreover we describe an experimental setup with crossed polarization for pump and probe pulses which widens the measurement’s spectral interval. This configuration simultaneously probes, in the same experiment, a spectral range above, below, and including the pump energy due to an efficient suppression of the pump scattered light.
We apply the technique to the study of exciton dynamics in two-dimensional single layer graphene. The correct application of the technique provides the exact visualization of exciton dynamics. The ability to probe a wider spectral range around the pump energy advances the understanding of the underlying photo-physics.

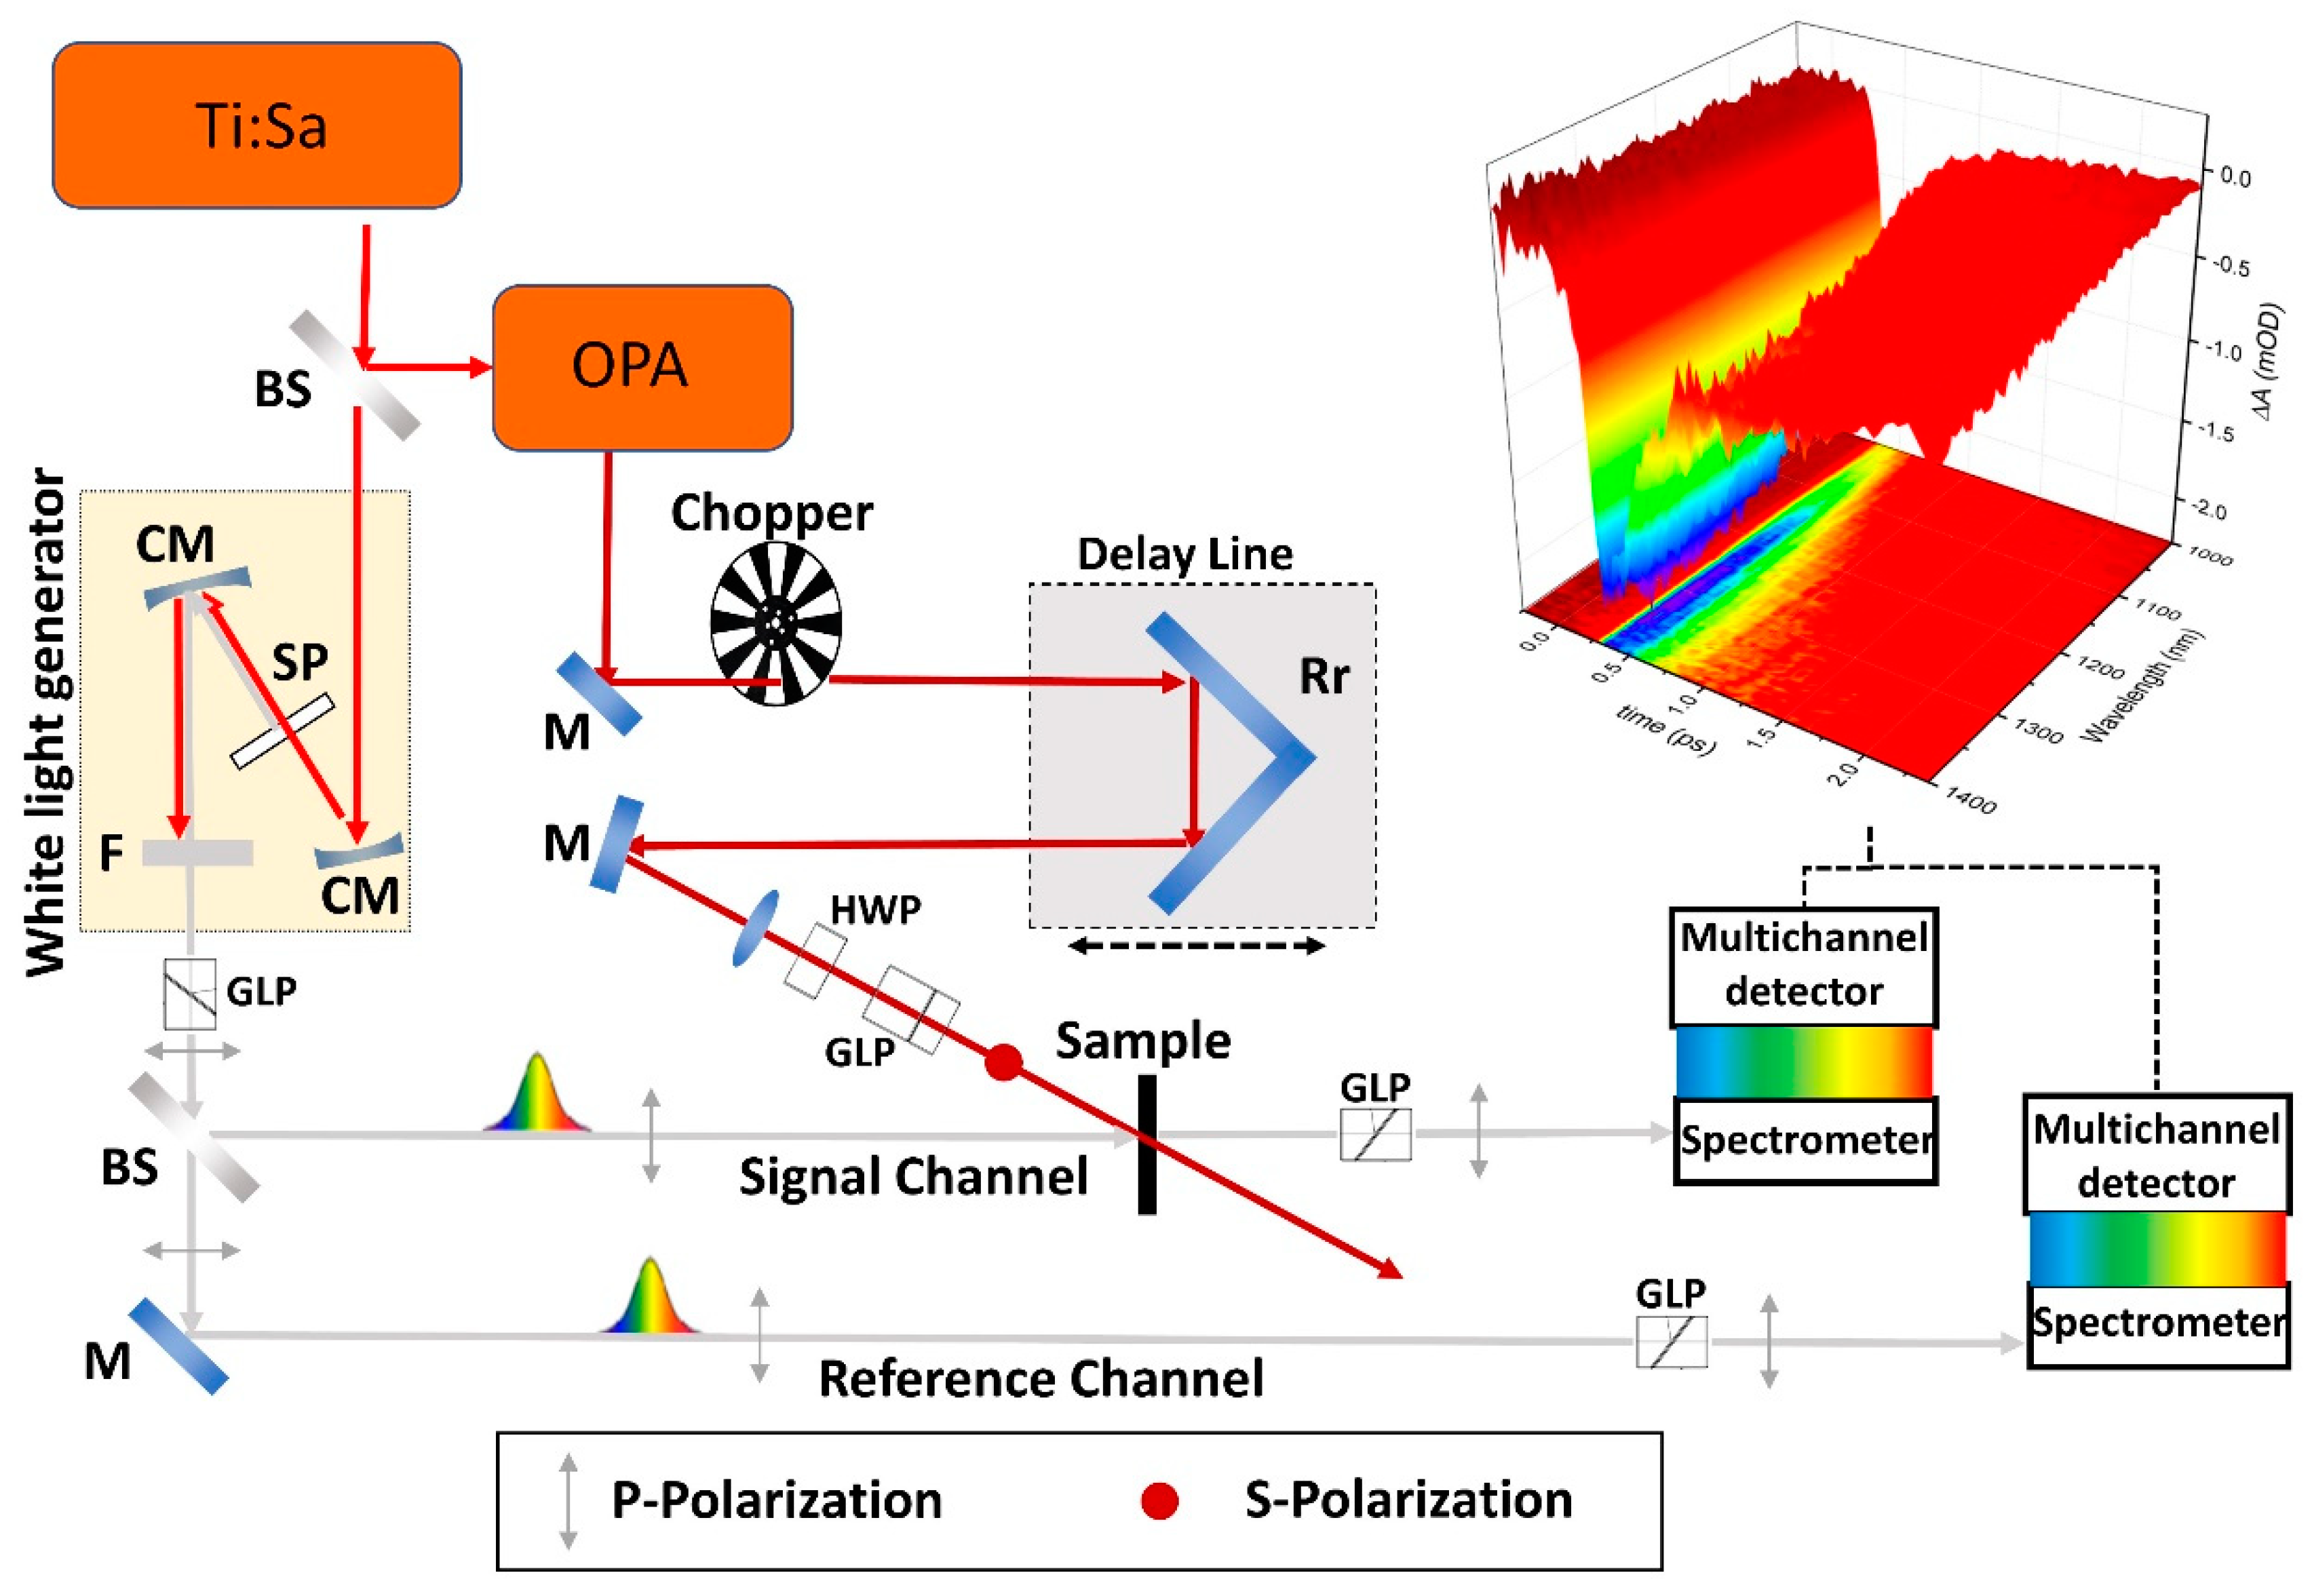
2. Experimental Setup

The hyperspectral transient absorption setup, here used, exploited as a laser source a high-power (1 mJ) Ti:Sapphire (800 nm operating wavelength) femtosecond regenerative amplifier (Spitfire, Spectra-Physics, Santa Clara, CA, USA) operating at a repetition rate of f = 1 kHz.
Combined with an optical parametric amplifier (OPA-TOPAS, Spectra-Physics, Santa Clara, CA, USA) this system generated sub-100 fs pulses in the ultraviolet, visible, and infrared spectral regions. This source was coupled to a setup for hyperspectral transient absorption spectroscopy [3]. The sketch of the setup is depicted in Figure 1. The samples were optically excited using the femtosecond tunable pulse delivered by the OPA. A mechanical chopper modulated the pump beam synchronously at f/2. The pump was sent though a mechanical delay line to control the optical path length and then focused on the samples.
A small fraction of the fundamental beam was recorded and focused through a concave mirror on a sapphire plate to generate the supercontinuum in the NIR (850–1600 nm), which was collimated by another concave mirror and filtered to get rid of the residue of the 800 nm beam. The supercontinuum was split in two parts (signal and reference). The signal was focused on the sample through reflective optics and downstream collimated. The transmitted spectrum was coupled to a 50 µm core multimode fiber and sent to a spectrometer (CP-140, Horiba, Minami-ku Kyoto, Japan) featuring an ion-etched, holographic grating working in the NIR spectral range (800–1700 nm). The grating at the same time dispersed the spectrum and refocused it onto an InGaAs detector (linear diode array, Hamamatsu, Shizuoka, Japan) with 256 pixels of 50 µm (horizontal) and 500 µm (vertical) dimensions. The reference beam passed through a similar optical path and it was collected by another identical spectrometer and multichannel detector. It was better but not crucial that the reference went through the sample (or a replica) too. Pump and probe beam impinged on the sample in a quasi-collinear geometry.
In order to measure change in the transmission in a wide spectral range above and below the pump energy, we implemented a crossed polarization configuration with s-polarized pump and p-polarized probe. A high quality Glan-laser polarizer (GLP) with 105 extinction ratio (GL10, Thorlabs, Newton, NJ, USA) was introduced to set to p-polarization the white-light. A combination of an half-wave plate and another high quality GLP (GL10, Thorlabs, Newton, NJ, USA) was used as a variable attenuator to set to s-polarization the pump pulse and to tune its intensity. Two high quality Glan-laser polarizers (GL10, Thorlabs, Newton, NJ, USA), set to p-polarization, were introduced in the signal and reference optical paths, between the sample and the detectors, in order to get rid of the scattered pump beam.
We note that in some photosynthetic systems [9,10] or in spatially asymmetric clusters [2] an anisotropic response in the transient absorption under optical excitation was observed. In such cases the kinetics of both configurations (with the pump and probe parallel or perpendicular aligned) have to be collected. The optical anisotropy was measured by subtracting the perpendicular from the parallel arrangement of the pump and probe pulses and dividing by the magic angle spectrum (parallel plus two times the perpendicular arrangement). If the parallel configuration was implemented (by rotating the pump polarizer) then the scattering of the pump was also collected with the effect of a constant sharp dip in the differential spectrum which was present also at negative pump-probe delay (pre-zero data). In most cases it could be ruled out via postprocessing of the data.
The detection consisted of a pair of high-resolution multichannel detector arrays coupled to a high-speed data acquisition system (DAQ). We note that the probe power over the entire spectrum was only a few hundred nanowatts. It was well below that of the pump, even for measurements made at low pump powers, and could be considered as nonperturbative.
The DAQ worked synchronously with the laser and the chopper, and acquired spectra at the rate of 1 kHz. The spectra corresponded alternately to the excited sample (in presence of the pump-ON state) and to the non-excited sample (in absence of the pump-OFF state). The change in the sample absorbance induced by the pump was calculated [11] over two consecutive spectra by:
Δ A ( λ , t ) = l o g 10 ( I s ( λ , t ) I s 0 ( λ ) · I R 0 ( λ ) I R ( λ ) )
where I s ( λ , t ) and I s 0 ( λ ) are the transmitted probe intensities through the excited and non-excited sample, and I R ( λ ) and I R 0 ( λ ) are the corresponding intensities measured in the reference channel. I s ( λ , t ) is the only quantity depending on the pump-probe delay ( t ). It is worth noticing that these four quantities cannot be measured simultaneously, since I s ( λ , t ) and I R ( λ ) are measured during an ON state, while I s 0 ( λ ) and I R 0 ( λ ) during the subsequent OFF state. This introduced an intrinsic uncertainty in the pump-probe technique.
The sensitivity of the technique, with this detection approach, was limited by the bit depth of the multichannel detectors. In our setup we used InGaAs arrays with 14 bits A/D Conversion. This meant that a relative intensity difference | I s I s 0 I s 0 | = 2 14 6 · 10 5 could be in principle measured in the collected spectra which corresponded to a Δ A / A 0 6 · 10 6 . In practice, several sources of noise had to be taken into account.
There were two main classes of noise in the transient absorption technique [12]: (1) Optical noise due to pulse-to-pulse energy fluctuations in the pump and probe beams, (2) detector noise which consisted of shot noise in the detector (the statistical noise associated with measuring N photons which goes as N ) and readout noise (electronic noise which is independent on the optical intensity) [13]. These latter two sources of noise were independent and added up as the square root of the sum of the squares: Detector noise = ( readout 2   +   shot 2 ) .
The use of a reference channel allowed reduction of the noise coming from fluctuation of the intensity in the probe pulse train and improved the signal-to-noise ratio [14]. One photodetector was used for the white-light transmitted through the sample, while the other photodetector was illuminated with light from the same source but which had not gone through the sample (or had gone through a part of it not excited by the pump pulse). The intensity noise of the supercontinuum was largely canceled out with that balanced detection scheme. This cancellation method is called common mode rejection.
However, the noise due to detector and readout electronics, which were not correlated in the two channels, were not cancelled by the referencing scheme. Therefore, adding a reference measurement channel could introduce additional noise. In general, if the optical noise dominated, it was useful introducing a reference channel. This is particularly true in the pump-supercontinuum scheme. Indeed while the pulse to pulse intensity fluctuation of the 1 kHz Ti:S amplifier is on the order of 0.5%–1% rms, white-light generation is relatively noisy with ≈10% rms intensity fluctuations from shot to shot [8,14]. The noise in the data was mainly determined by the fluctuations in the white-light continuum so that the merit of referencing became apparent.
In order to reduce the noise it was useful to calculate the absorbance change Δ A ( λ , t ) between two consecutive spectra and perform repeated measurements. For a purely statistical noise distribution the signal-to-noise ratio increases with the square root of the number of collected ON-OFF cycles. Several thousands of spectra are usually stored at a chosen time delay. A Matlab code calculated Δ A ( λ , t ) over two consecutive spectra and averaged over the few thousands ON/OFF cycles.

3. Results

This section contains the measure of the supercontinuum chirp and the application of the technique to single layer graphene. In the first Section 3.1 we report the results of the cross-correlation between the pump pulse and the supercontinuum probe pulse. We show that, due to the temporal dispersion of the supercontinuum, a variation in the temporal onset (time zero) of the kinetic traces appeared. This artifact could be corrected by means of a numerical procedure which we describe in detail. The chirp correction procedure was essential in order to visualize correctly the experimental data. An example is given in Section 3.2 by applying the technique to the investigation of exciton dynamics in single layer graphene. We show how the 2D data set must be corrected for an understanding of the underlying photo-physics.

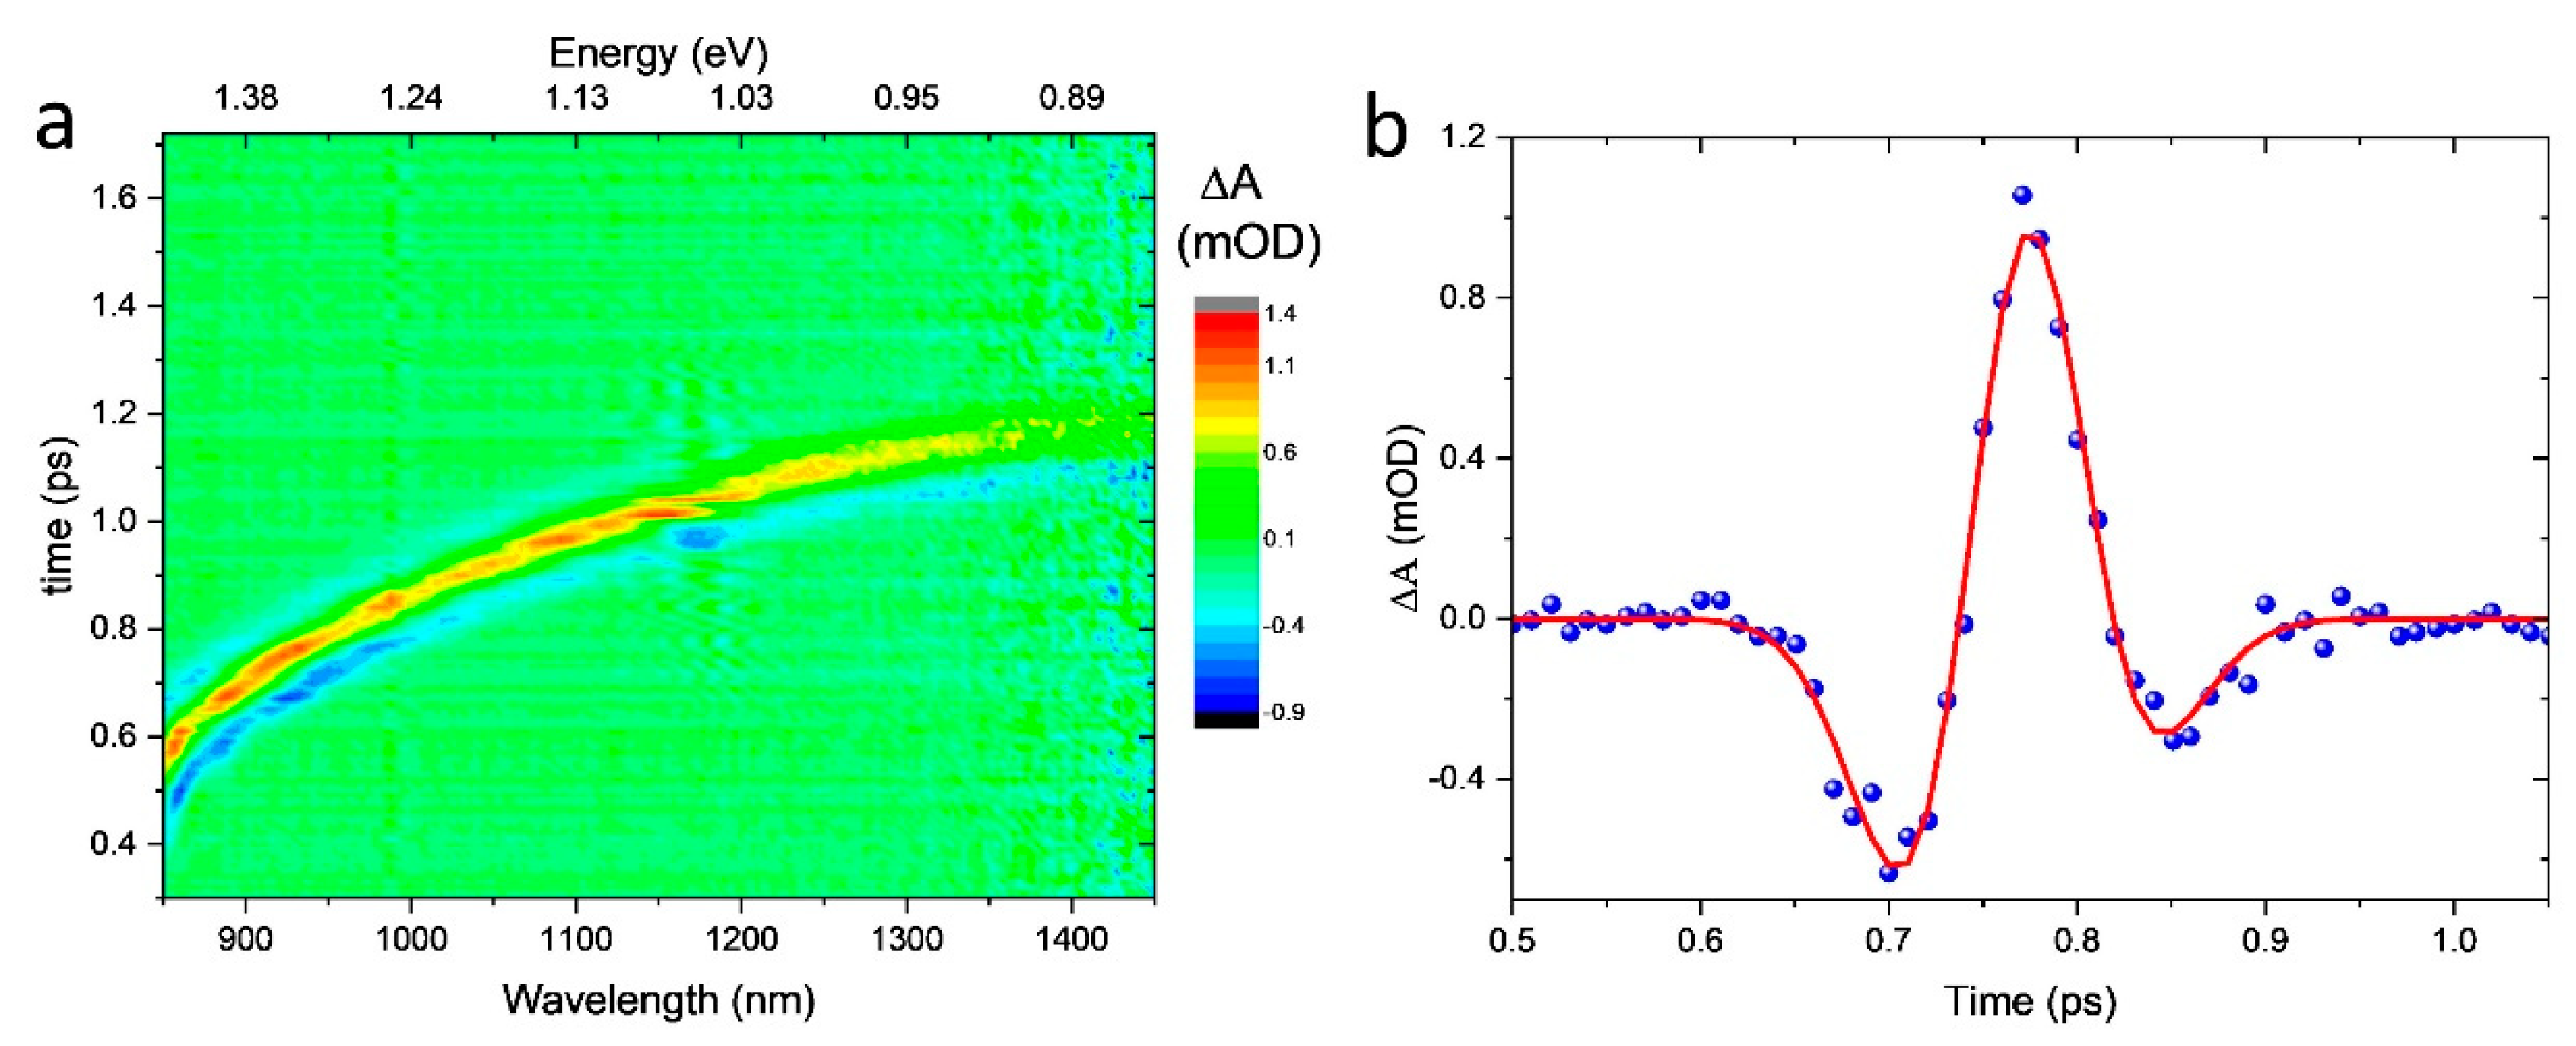
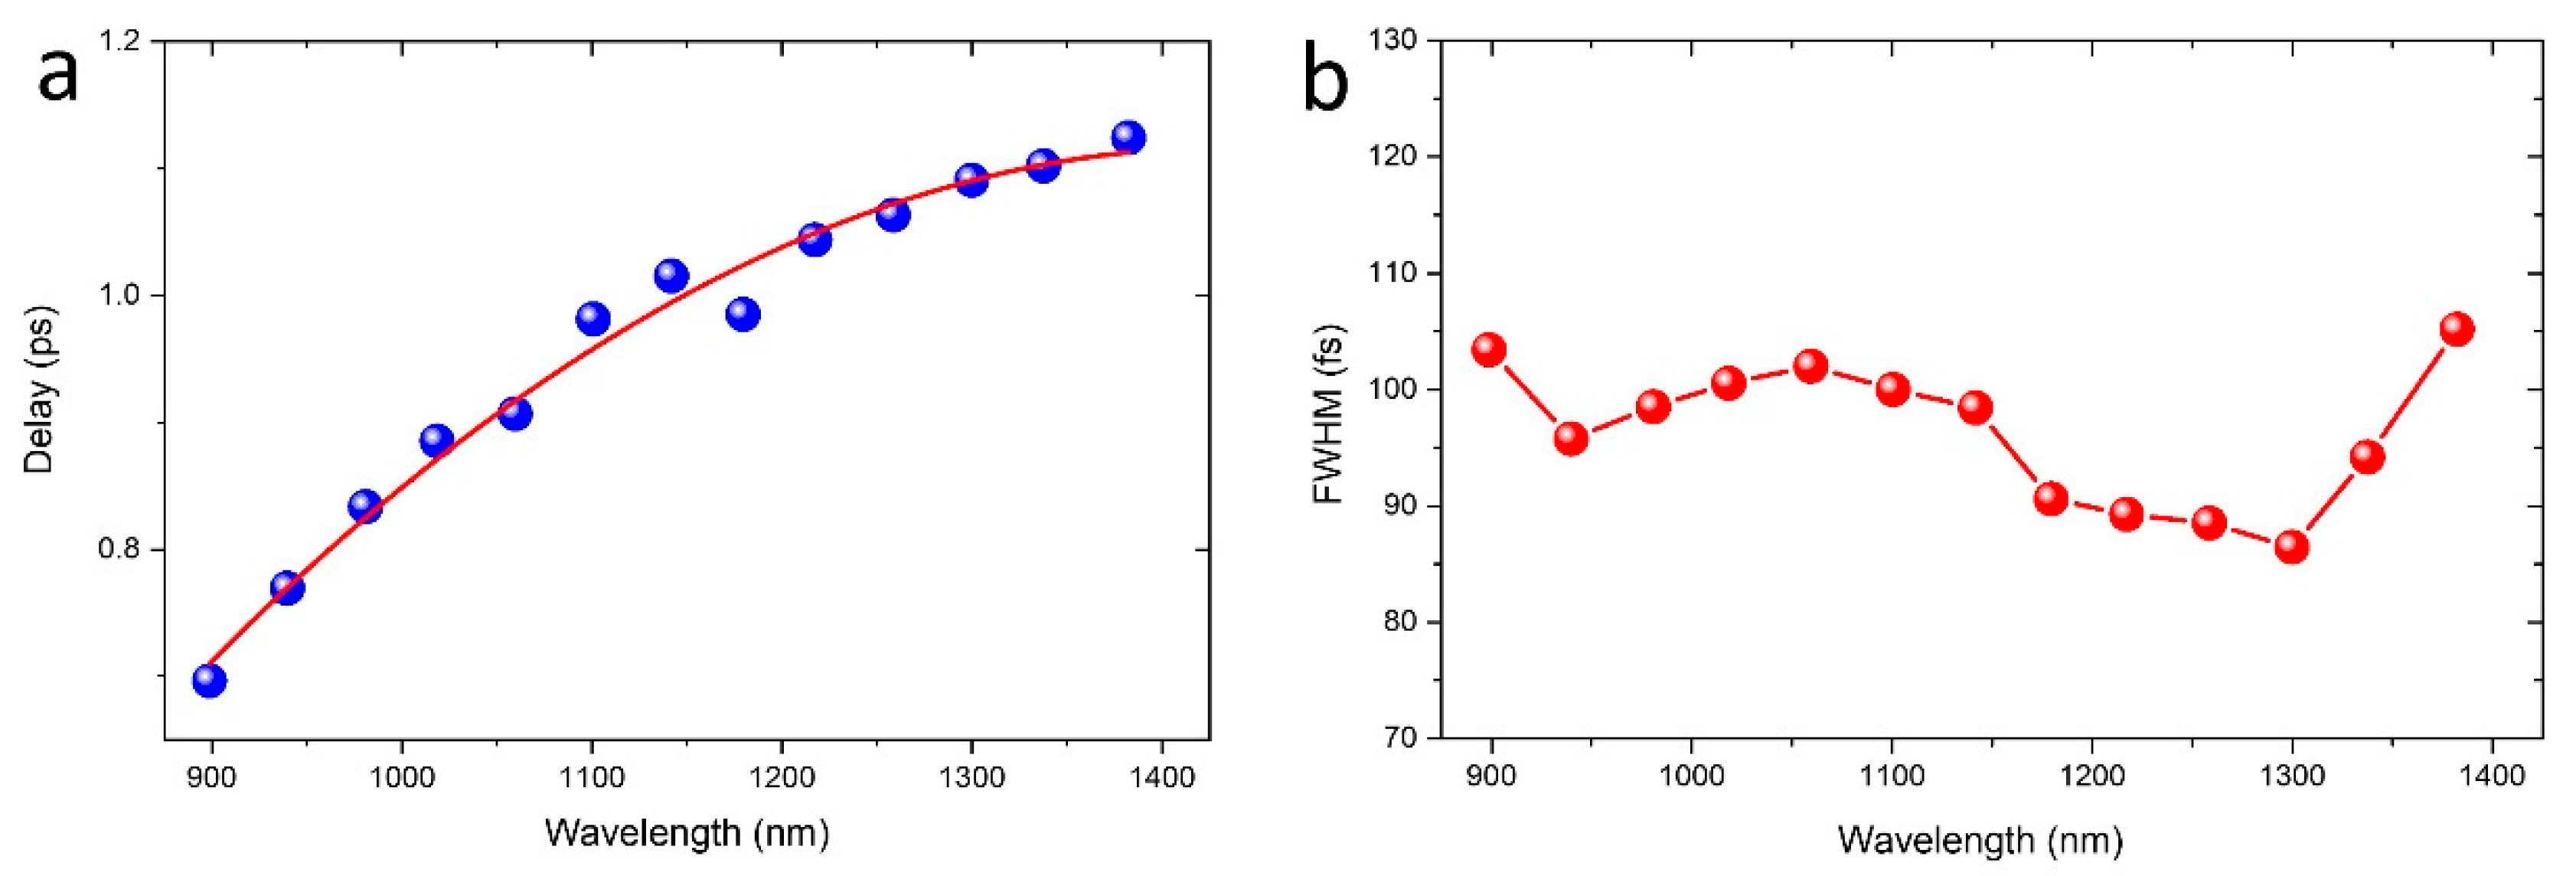
3.1. Chirp Correction and Time Resolution

The temporal overlap between pump and probe was wavelength dependent [15], due to the chirp of the white light [16]. A procedure of chirp correction of the 2D data set was needed in order to access a correct visualization of transient spectra at a fixed delay. Here we employed a numerical correction of the measured spectra through a calibration of the chirp by cross correlation of the continuum with the pump pulse. In practice the chirp needed to be measured independently under the same experimental conditions of the uncorrected data but in absence of the sample. For samples deposited (thin films or few atomic layers of 2D materials) on transparent substrates, we measured the change in transmission of the bare substrate, for nanoparticles dispersed in solution we measured that of the neat solvent in place of the nanocrystal solution.
In Figure 2 we report the raw transient spectra corresponding to the measurement of supercontinuum chirp by cross-correlation with 1150 nm pump pulse in a 0.2 mm fused silica substrate. Panel (a) shows the 2D data set of transient absorption in function of time delay and probe wavelength, from which it is well clear that the temporal pump-probe overlap changes with the probe wavelength with the red portion of the spectrum arriving earlier (note that a longer time in panel (a) corresponds to a shorter optical path of the pump following the scheme of Figure 1). There was about 0.6 ps temporal dispersion between 850 and 1450 nm. It is worth noticing that the effect of the pump scattering was almost canceled by the crossed polarization configuration.
An accurate determination of the time zero t 0 ( ω 2 ) , i.e., the time at which the ω 2 component of the supercontinuum best overlaps with the pump pulse, was needed for a proper chirp correction.
An example of the time dependent kinetic trace is shown in panel (b). The temporal overlap of a certain component of the supercontinuum with the pump pulse results in a coherent artifact [17,18]. The shape of the curve presents a positive maximum and two (left and right) wings.
This is typical of transparent media [19,20] where the electronic part of the transient signal is usually 5–6 times higher in magnitude than that from low-frequency nuclear vibrations (phonons) [21]. In the case of fused silica, which is a widely used window or substrate in femtosecond experiments, high-frequency modes may also be weak. Therefore its transient response contains mainly the instantaneous coherent electronic contribution [22].
In case of linearly chirped probe pulses, the frequency dependent transient signal can be modeled with a superposition of a function, which represents the cross-correlation between the pump and the supercontinuum probe, and its first and second derivatives [22], i.e.,
Δ A ( ω 2 ,   t d ) = c 0 F c c ( ω 2 ,   t d ) + c 1   t d F c c ( ω 2 ,   t d ) + c 2   2 t d 2 F c c ( ω 2 ,   t d ) ,
where the cross-correlation function F c c ( ω 2 ,   t d ) reads [23]
F c c ( ω 2 ,   t d ) = | d t   e x p ( i ω 2 t )   E 2 ( t ) E 1 ( t t d ) | 2 .
E 1 ( t )   and   E 2 ( t ) being the electric field of the pump pulse and of the supercontinuum probe. For Gaussian temporal shapes, as assumed here, F c c ( ω 2 ,   t d ) e x p { [ t d t 0 ( ω 2 ) ] 2 /   τ 2 } . By fitting the kinetic traces with such Gaussian function and its first and second derivatives, it is possible to retrieve time zero function t 0 ( ω 2 ) which represents the delay at which the spectral component ω 2 of the supercontinuum interacts (has zero delay) with the pump.
We extracted a significant number of kinetic traces (at least 10 traces for a robust sampling) and for each one we estimated (by the fitting procedure) the time zero at which pump and probe best overlap. The results of this fitting procedure are shown in Figure 3a for a number of probe wavelengths (blue circles). These data can be well modelled by a low-order polynomial function [16]. The solid red curve is a function D e l a y ( λ ) = A + B λ + C λ 2 (A = −1.8 ps, B = 4 × 10⁻³ ps/nm and C = −1.4 × 10⁻⁶ ps/nm2).
Based on this model we can perform, in the post-processing of the data, the chirp correction at each probe wavelength of the measured 2D data set, in order to obtain the same relative delay across the entire spectrum. The correction consists in shifting back in time the kinetic trace at ω 2 of an amount equal to t 0 ( ω 2 ) = D e l a y ( λ ( ω 2 ) ) . Only after this correction the proper carrier dynamics of the investigated samples can be visualized and available for modeling. This fit typically introduces an error of less than ±5 fs into the chirp correction as shown in Figure 3a. As discussed in the following this is well below the time resolution of our setup.
An estimate of the temporal resolution in the hyperspectral transient absorption experiment can be obtained by the fitting procedure of the kinetic traces too. We define [24] the time resolution of the technique as the Full Width at Half Maximum ( F W H M = 2 l n 2 τ ) of the gaussian fitting function [ F c c ( ω 2 ,   t d ) ] of the kinetic traces, which are the results of the cross-correlation between the pump and the supercontinuum. The results are reported for a number of probe wavelength in Figure 3b and demonstrate that our setup provides sub-100 fs time resolution (over a 3 ns time window). The width τ of the cross-correlation function [ F c c ( ω 2 ,   t d ) ] depends on the width of the pump τ p and that of the probe τ ( ω 2 ) . In condition of a fast chirp rate [ 2 β τ 2 2 1 ] it essentially reduces to τ p [22,25] and the time resolution of the technique is driven by the FWHM of the pump pulses. The resolution is affected by the thickness of all the dispersive optical component of the apparatus due to the pulse lengthening introduced by their group-delay dispersion. The substrates of the samples under investigation (for thin films or few-layers of 2D materials) or the cuvettes (for solution-based samples) may also elongate the measured FWHM of the coherent artifact. This means that the intrinsic time resolution of the technique lies below the width of the artifact measured in the presence of substrates. However, it is reasonable, for sake of comparison with the sample data, to estimate it by measuring the artifact in the same substrate alone which supports the sample under investigation.

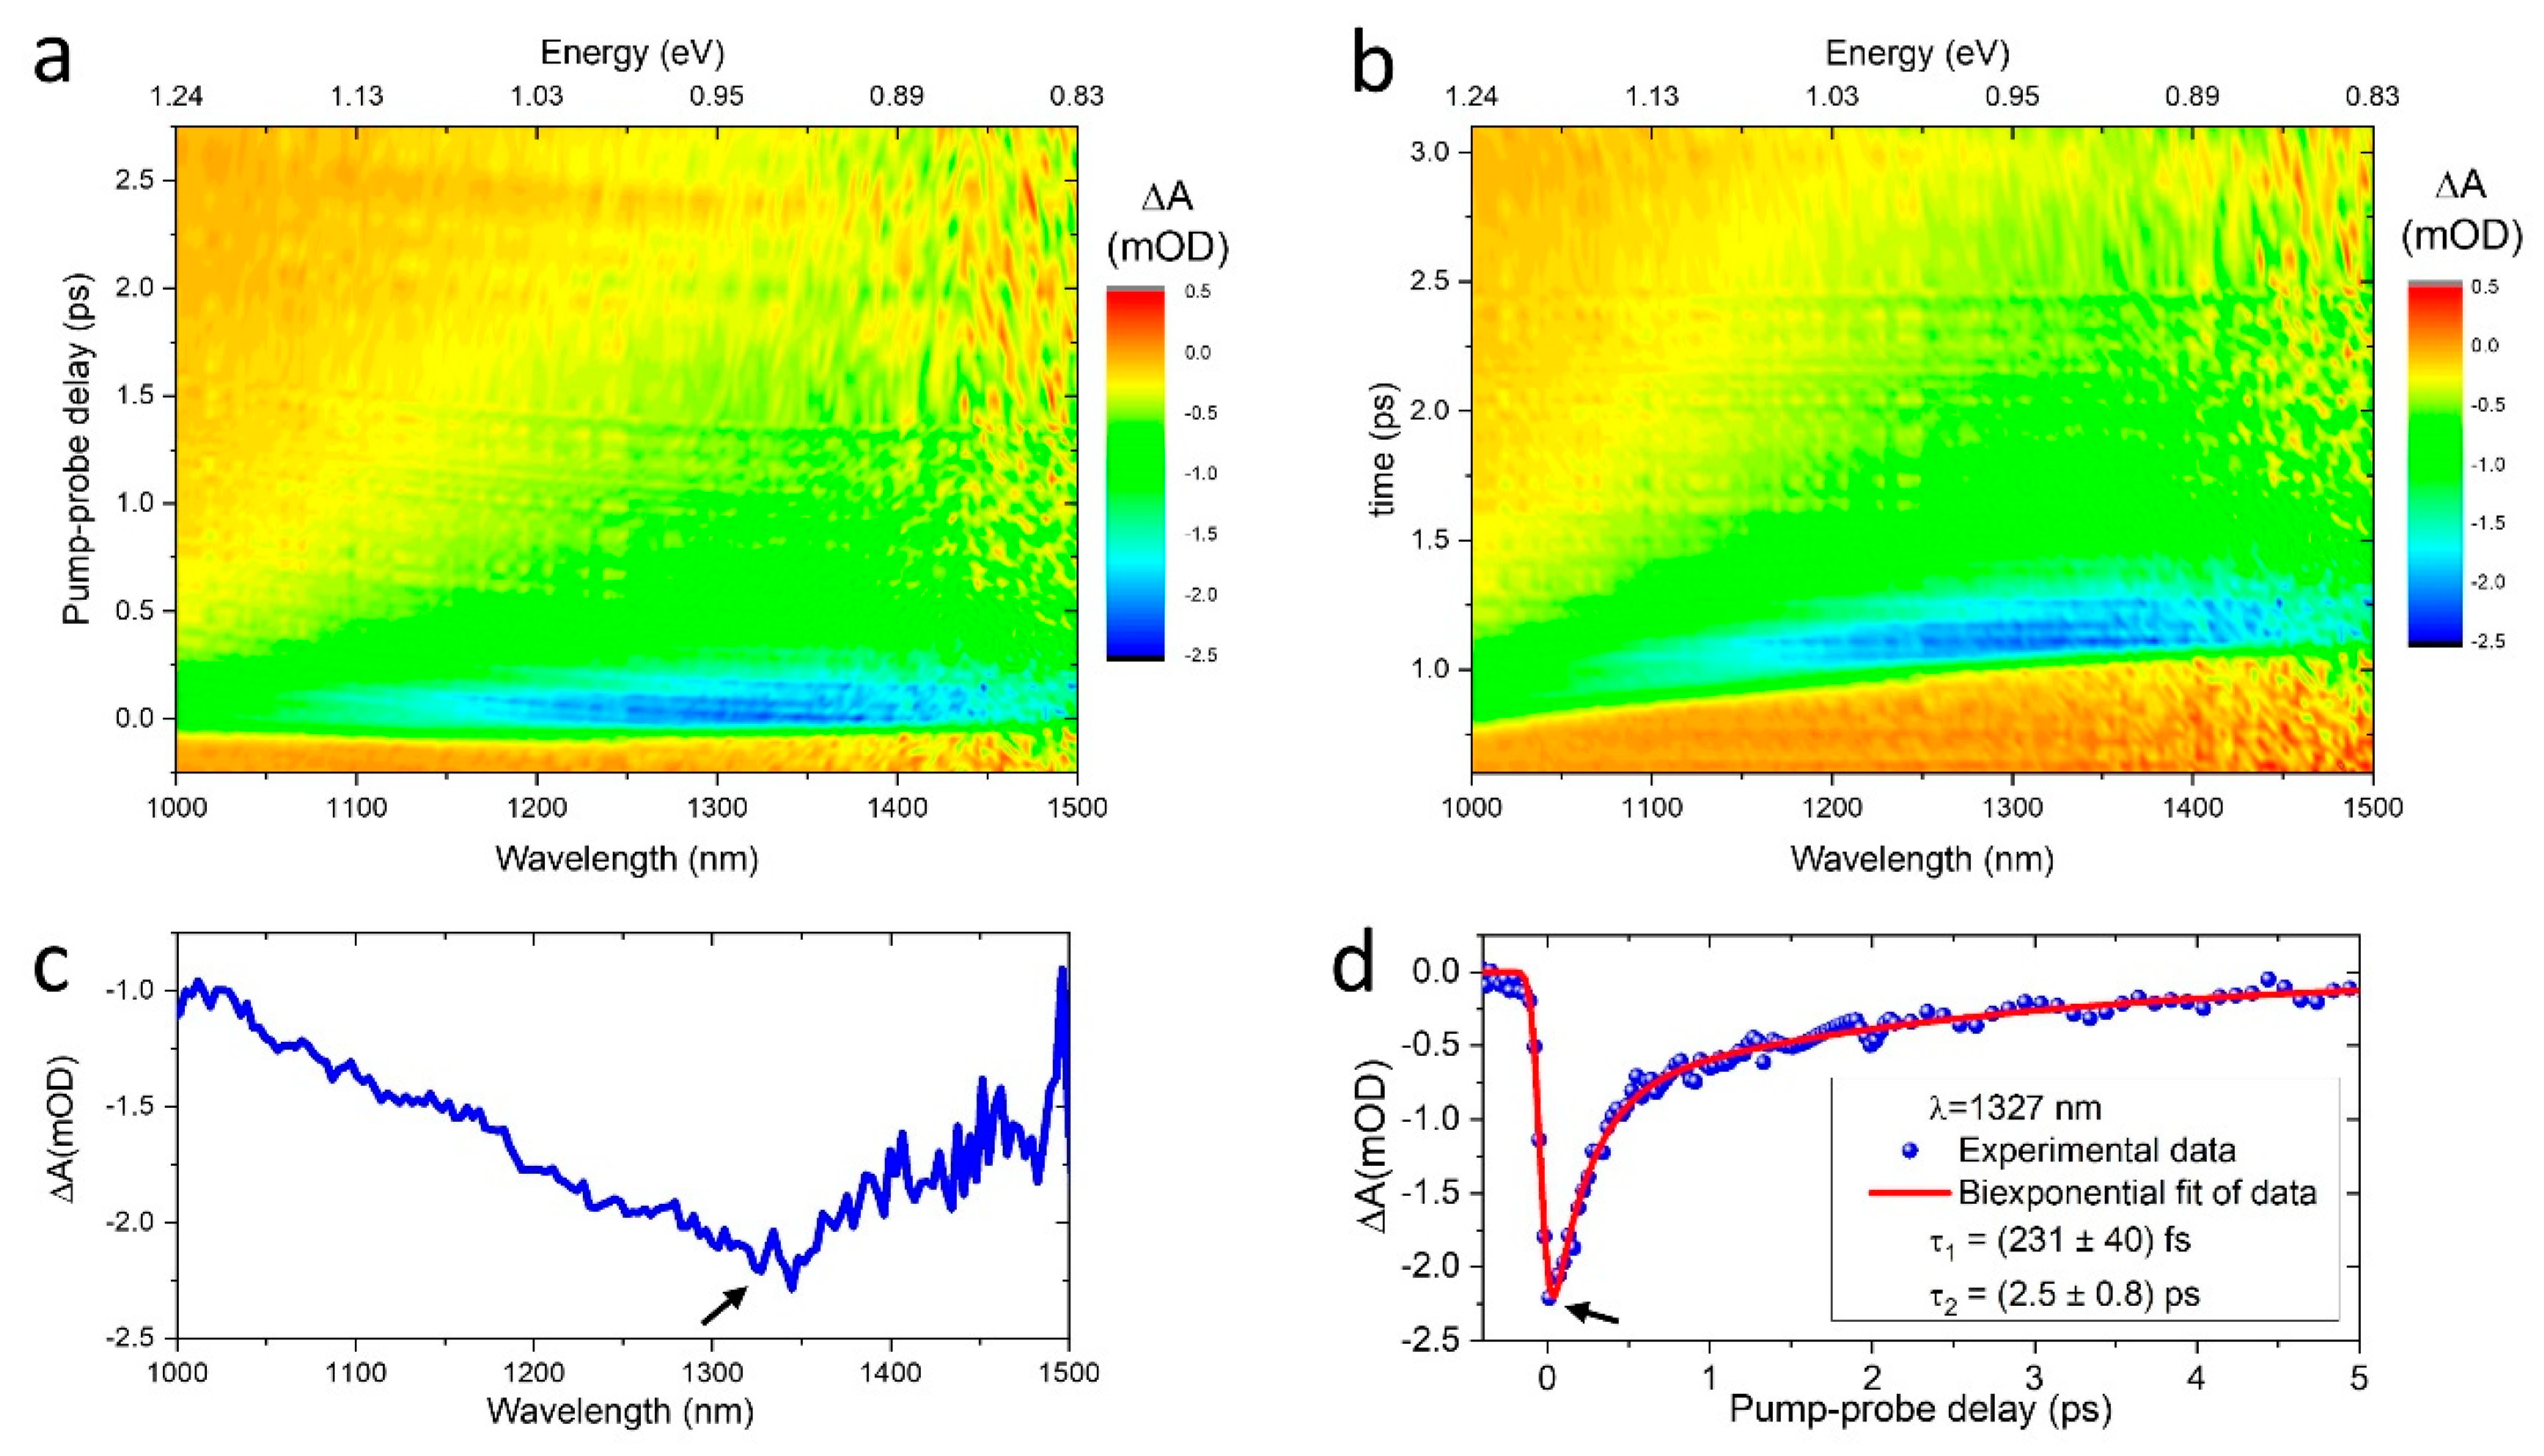
3.2. Ultrafast Carrier Dynamics in 2D Graphene

Two dimensional (2D) van der Waals (vdW) crystals, such as graphene, are a new class of layered materials with novel and intriguing optical and electronic properties when reduced to single atomic layer. Due to their remarkable properties, these systems are suitable candidates for the realization of novel electronic, photonics, photovoltaics, and sensing devices [26,27,28,29,30,31,32,33].
Single layer graphene (SLG) is a characteristic honeycomb arrangement of carbon atoms in their sp2 hybridization [34]. The constituent atoms form strong in plane covalent bond and weak out of plane van der Waals bond making possible to isolate the single layer whose lateral dimensions depend on the particular preparation method.
Interestingly graphene and two-dimensional materials can be recombined to form vdW heterostructures where layers of different materials can be assembled in a tailored sequence showing novel functionalities [35,36,37,38,39,40,41].
Sample of two-dimensional materials can be nowadays produced with several methods. The micromechanical exfoliation [42] (tape method) is still widely employed and allows producing 2D samples of high quality but of limited dimensions (tens of microns at the most) which are useful for fundamental studies. Liquid phase exfoliation [43,44] provides samples of 2D nanoflakes dispersed in several solvents and it is suitable for large scale and cost-effective production, but with low yield of monolayers. Chemical vapor deposition (CVD) is a growth technique producing high quality samples of 2D materials on several substrates. Single-atom thick graphene sheets can now be produced by CVD [45,46] on large scale and is commercially available. In this section we apply the hyperspectral TA technique to the investigation of carrier dynamics in CVD-grown single layer graphene (SLG) deposited on 0.2 mm fused silica substrate (purchased by Graphene Supermarket).
We use Raman spectroscopy (not shown) to confirm the nature of our CVD grown SLG. It is a widely employed method to study the vibrational properties of several nanomaterials [47,48,49,50] and particularly useful for carbon-based nanostructures such as few-layer graphene [51,52]. Indeed it has been well established that Raman spectroscopy represents a robust metrics of the number of layers to be used in place of or in combination with AFM [53,54].
The 2D data set showing the transient absorption spectra in SLG is reported in Figure 4. It is obtained by exploiting an excitation wavelength of 1150 nm (1.08 eV) with an optical pump fluence of 180 µJ/cm2. Panel (a) corresponds to the chirp-corrected data, panel (b) to the measured raw data. The uncorrected 2D data (Figure 4b) are plotted in function (Y-axis) of the time of the setup as measured from the change in the optical path length due to the movement of the mechanical delay stage. The chirp-corrected data (Figure 4a) are instead plotted in function of the pump-probe relative delay which is obtained (as detailed in previous section) subtracting the fitted D e l a y ( λ ) from the time. The crossed polarization configuration substantially cancels the effect of the scattering of the pump beam. Indeed, the presence of scattered pump light would result in an increase of the transmission and a reduction in absorption. The effect would be a narrow negative spike at the pump wavelength which is clearly absent in our data.
A broadband negative differential absorption (ΔA) is measured, indicating a fast increase of graphene transparency (bleach). This bleach is on the order of 10−3 in agreement with previous pump-probe studies on single and multilayered graphene [55,56].
The chirp-corrected data show the same time zero of the kinetics for all the wavelengths of the probe. In the raw data there is a dispersion of the onset of the kinetics with the relative delay shifted at longer times in the red portion of the spectrum, leading to a distortion of the 2D spectrograph and producing a wrong interpretation of the data.
The differential spectra (ΔA) registered at a delay immediately after the pump-probe overlap, shows a maximum of the bleach at (1327−1345) nm (see panel c). The time-dependent behavior (Figure 4d) is fast with the overall bleach decaying in few a picoseconds. We report the time resolved ΔA, at a fixed probe wavelength of 1327 nm, for a pump fluence of 180 μJ/cm2. The data can be modeled with a biexponential fit which is in well agreement with the experimental data. The decay dynamic presents two characteristic lifetimes, τ1 = 231 ± 40 fs and τ2 = 2.5 ± 0.8 ps.
We do not observe anisotropy in our data, i.e., difference (in the amount of signal and in the lifetimes) from perpendicular to parallel configurations. Several studies [57,58] have demonstrated that in degenerate pump-probe experiment, with linearly polarized pump and probe beams, an anisotropy in the early stages of the ultrafast response of graphene can be observed. The linearly polarized pump beam produces an instantaneous anisotropic distribution of carriers with electrons occupying preferentially states in the direction perpendicular to the direction of the electric field of the radiation. Such anisotropic distribution thermalizes due to non-collinear Coulomb scattering and optical phonon emission, while collinear Coulomb scattering rapidly thermalizes the carrier distribution in k directions pointing radially away from the Dirac point but does not significantly redistribute carriers into states of different angles. However such experiments are performed either in regime of low pump and probe energy (<100 meV) with anisotropy lasting for few ps [59] or in the NIR region in regime of low fluence (4 μJ/cm2) and with anisotropy lasting for 150 fs [60]. For these reasons we do not expect to observe anisotropy for energy of the probe too far from that of the pump. Moreover, our experimental conditions (larger fluence 180 μJ/cm2 and 100 fs time resolution) prevents to observe it probing at the same energy of the pump.
Following classical interpretation scheme [55,61,62], the bleach distribution peaked in the 0.9–1.02 eV energy range, represents an hot (quasi-equilibrium) exciton distribution which the system reaches on a timescale of tens of fs. The early stages of the formation of such distribution are too fast and cannot be visualized with our technique. However, what our results show is that this exciton distribution cools down by transferring energy to the lattice via optical phonon and electron-hole recombination in few hundreds of fs. Then the system reaches the equilibrium via interaction of carriers with acoustic phonons in few ps.
It is worth noticing that we observe a substantial independence of the time-resolved absorbance change from the energy of the pump photon, even for blue-shifted probe, i.e., probe energy range higher than that of the pump. This observation is in line with recent reports [56,63] where graphene carrier dynamics can be revealed by means of sub-100 fs time resolution spectroscopies which allow the direct observation of the fast Coulomb carrier-carrier scattering processes.
The initial peaked carrier distribution produced by the pump laser broadens towards a hot Fermi-Dirac (FD) distribution in a timescale shorted than out time resolution due to carrier–carrier scattering. These Coulomb-mediated processes include intra- and inter-band scattering [64,65], carrier multiplication (i.e., increase in the number of carriers in conduction band from valence-band-assisted Coulomb scattering), and Auger recombination (i.e., decrease in the number of carriers in conduction band from valence-band- assisted Coulomb scattering).
Recent observations suggest that, during the early stages of the dynamics of photogenerated carriers, which cannot be accessed with our technique, Auger processes, such as Auger recombination and carrier multiplication, play a significant role [63,66,67,68].

4. Discussion and Conclusions

We describe, in this work, the basic principles and the experimental implementation of hyperspectral transient absorption technique. We discuss the sources of the noise, the time resolution and the need to correct the data for the chirp of the supercontinuum. This pump-supercontinuum probe scheme has the ability to probe an entire energy spectrum and allows for retrieving the full spectral dependence of dynamics in several materials. Moreover, the technique permits new analytic methods such as global fits of the data for a quantitative understanding of the charge carrier dynamics.
We applied the technique to the investigation of charge carrier dynamics in single layer graphene. We showed, in the limit of the temporal resolution of our setup, that the numerical correction of the supercontinuum chirp is essential in order to understand the underlying photo-physics. The cross-polarization scheme permits to probe a wide spectral range above, below and containing the pump energy for a complete visualization of the several processes governing the ultrafast exciton dynamics of graphene.

Funding

This research received no external funding.

Conflicts of Interest

The author declares no conflict of interest.

References

  1. Kambhampati, P. Unraveling the Structure and Dynamics of Excitons in Semiconductor Quantum Dots. Acc. Chem. Res. 2011, 44, 1–13. [Google Scholar] [CrossRef] [PubMed]
  2. Sfeir, M.Y.; Qian, H.; Nobusada, K.; Jin, R. Ultrafast Relaxation Dynamics of Rod-Shaped 25-Atom Gold Nanoclusters. J. Phys. Chem. C 2011, 115, 6200–6207. [Google Scholar] [CrossRef]
  3. Gesuele, F.; Sfeir, M.Y.; Koh, W.-K.; Murray, C.B.; Heinz, T.F.; Wong, C.W. Ultrafast Supercontinuum Spectroscopy of Carrier Multiplication and Biexcitonic Effects in Excited States of PbS Quantum Dots. Nano Lett. 2012, 12, 2658–2664. [Google Scholar] [CrossRef] [PubMed]
  4. Berera, R.; van Grondelle, R.; Kennis, J.T.M. Ultrafast transient absorption spectroscopy: Principles and application to photosynthetic systems. Photosynth. Res. 2009, 101, 105–118. [Google Scholar] [CrossRef] [PubMed]
  5. Zewail, A.H. Femtochemistry: Atomic-Scale Dynamics of the Chemical Bond. J. Phys. Chem. A 2000, 104, 5660–5694. [Google Scholar] [CrossRef]
  6. Itri, F.; Monti, D.M.; Della Ventura, B.; Vinciguerra, R.; Chino, M.; Gesuele, F.; Lombardi, A.; Velotta, R.; Altucci, C.; Birolo, L.; et al. Femtosecond UV-laser pulses to unveil protein–protein interactions in living cells. Cell. Mol. Life Sci. 2016, 73, 637–648. [Google Scholar] [CrossRef] [PubMed]
  7. Auböck, G.; Consani, C.; van Mourik, F.; Chergui, M. Ultrabroadband femtosecond two-dimensional ultraviolet transient absorption. Opt. Lett. 2012, 37, 2337. [Google Scholar] [CrossRef] [PubMed]
  8. Alfano, R.R. The Supercontinuum Laser Source; Springer: New York, NY, USA, 2016; ISBN 978-1-4939-3324-2. [Google Scholar]
  9. Vulto, S.I.E.; Kennis, J.T.M.; Streltsov, A.M.; Amesz, J.; Aartsma, T.J. Energy Relaxation within the B850 Absorption Band of the Isolated Light-Harvesting Complex LH2 from Rhodopseudomonas acidophila at Low Temperature. J. Phys. Chem. B 1999, 103, 878–883. [Google Scholar] [CrossRef]
  10. Savikhin, S.; van Amerongen, H.; Kwa, S.L.; van Grondelle, R.; Struve, W.S. Low-temperature energy transfer in LHC-II trimers from the Chl a/b light-harvesting antenna of photosystem II. Biophys. J. 1994, 66, 1597–1603. [Google Scholar] [CrossRef] [Green Version]
  11. Tkachenko, N.V. Optical Spectroscopy: Methods and Instrumentations; Elsevier: Amsterdam, The Netherlands, 2006; p. 307. ISBN 9780444521262. [Google Scholar]
  12. Auböck, G.; Consani, C.; Monni, R.; Cannizzo, A.; van Mourik, F.; Chergui, M. Femtosecond pumpsupercontinuum-probe setup with 20 kHz repetition rate. Rev. Sci. Instrum. 2012, 83, 2010–2015. [Google Scholar] [CrossRef]
  13. Moon, J.A. Optimization of signal-to-noise ratios in pump-probe spectroscopy. Rev. Sci. Instrum. 1993, 64, 1775–1778. [Google Scholar] [CrossRef]
  14. Dobryakov, A.L.; Kovalenko, S.A.; Weigel, A.; Pérez-Lustres, J.L.; Lange, J.; Müller, A.; Ernsting, N.P. Femtosecond pump/supercontinuum-probe spectroscopy: Optimized setup and signal analysis for single-shot spectral referencing. Rev. Sci. Instrum. 2010, 81, 113106. [Google Scholar] [CrossRef] [PubMed]
  15. Megerle, U.; Pugliesi, I.; Schriever, C.; Sailer, C.F.; Riedle, E. Sub-50 fs broadband absorption spectroscopy with tunable excitation: Putting the analysis of ultrafast molecular dynamics on solid ground. Appl. Phys. B Lasers Opt. 2009, 96, 215–231. [Google Scholar] [CrossRef]
  16. Klimov, V.I.; McBranch, D.W. Femtosecond high-sensitivity, chirp-free transient absorption spectroscopy using kilohertz lasers. Opt. Lett. 1998, 23, 277–279. [Google Scholar] [CrossRef] [PubMed]
  17. Lorenc, M.; Ziolek, M.; Naskrecki, R.; Karolczak, J.; Kubicki, J.; Maciejewski, A. Artifacts in femtosecond transient absorption spectroscopy. Appl. Phys. B Lasers Opt. 2002, 74, 19–27. [Google Scholar] [CrossRef]
  18. Chachisvilis, M.; Fidder, H.; Sundström, V. Electronic coherence in pseudo two-colour pump-probe spectroscopy. Chem. Phys. Lett. 1995. [Google Scholar] [CrossRef]
  19. Kang, I.; Smolorz, S.; Krauss, T.; Wise, F.; Aitken, B.; Borrelli, N. Time-domain observation of nuclear contributions to the optical nonlinearities of glasses. Phys. Rev. B Condens. Matter Mater. Phys. 1996, 54, R12641–R12644. [Google Scholar] [CrossRef]
  20. Valadan, M.; D’Ambrosio, D.; Gesuele, F.; Velotta, R.; Altucci, C. Temporal and spectral characterization of femtosecond deep-UV chirped pulses. Laser Phys. Lett. 2015, 12, 025302. [Google Scholar] [CrossRef]
  21. Hellwarth, R.; Cherlow, J.; Yang, T.T. Origin and frequency dependence of nonlinear optical susceptibilities of glasses. Phys. Rev. B 1975, 11, 964–967. [Google Scholar] [CrossRef]
  22. Kovalenko, S.A.; Dobryakov, A.L.; Ruthmann, J.; Ernsting, N.P. Femtosecond spectroscopy of condensed phases with chirped supercontinuum probing. Phys. Rev. A 1999, 59, 2369–2384. [Google Scholar] [CrossRef]
  23. Trebino, R. Frequency-Resolved Optical Gating: The Measurement of Ultrashort Laser Pulses; Springer US: Boston, MA, USA, 2000; ISBN 978-1-4613-5432-1. [Google Scholar]
  24. Rasmusson, M.; Tarnovsky, A.N.; Åkesson, E.; Sundström, V. On the use of two-photon absorption for determination of femtosecond pump-probe cross-correlation functions. Chem. Phys. Lett. 2001. [Google Scholar] [CrossRef]
  25. Dobryakov, A.L.; Pérez Lustres, J.L.; Kovalenko, S.A.; Ernsting, N.P. Femtosecond transient absorption with chirped pump and supercontinuum probe: Perturbative calculation of transient spectra with general lineshape functions, and simplifications. Chem. Phys. 2008, 347, 127–138. [Google Scholar] [CrossRef]
  26. Descrovi, E.; Ricciardi, C.; Giorgis, F.; Lérondel, G.; Blaize, S.; Pang, C.X.; Bachelot, R.; Royer, P.; Lettieri, S.; Gesuele, F.; et al. Field localization and enhanced Second-Harmonic Generation in silicon-based microcavities. Opt. Express 2007, 15, 4159. [Google Scholar] [CrossRef] [PubMed]
  27. Gesuele, F.; Lettieri, S.; Maddalena, P.; Liscidini, M.; Andreani, L.C.; Ricciardi, C.; Ballarini, V.; Giorgis, F. Band-edge and cavity second harmonic conversion in doubly resonant microcavity. J. Phys. B At. Mol. Opt. Phys. 2007, 40, 727–734. [Google Scholar] [CrossRef]
  28. Bonaccorso, F.; Colombo, L.; Yu, G.; Stoller, M.; Tozzini, V.; Ferrari, A.C.; Ruoff, R.S.; Pellegrini, V. 2D materials. Graphene, related two-dimensional crystals, and hybrid systems for energy conversion and storage. Science 2015, 347, 1246501. [Google Scholar] [CrossRef] [PubMed]
  29. Xia, F.; Wang, H.; Xiao, D.; Dubey, M.; Ramasubramaniam, A. Two-dimensional material nanophotonics. Nat. Photonics 2014, 8, 899–907. [Google Scholar] [CrossRef]
  30. Bhimanapati, G.R.; Lin, Z.; Meunier, V.; Jung, Y.; Cha, J.; Das, S.; Xiao, D.; Son, Y.; Strano, M.S.; Cooper, V.R.; et al. Recent Advances in Two-Dimensional Materials beyond Graphene. ACS Nano 2015, 9, 11509–11539. [Google Scholar] [CrossRef]
  31. Nivas, J.J.J.; Gesuele, F.; Allahyari, E.; Oscurato, S.L.; Fittipaldi, R.; Vecchione, A.; Bruzzese, R.; Amoruso, S. Effects of ambient air pressure on surface structures produced by ultrashort laser pulse irradiation. Opt. Lett. 2017, 42, 2710. [Google Scholar] [CrossRef] [PubMed]
  32. Basov, D.N.; Fogler, M.M.; Garcia de Abajo, F.J. Polaritons in van der Waals materials. Science 2016, 354, aag1992. [Google Scholar] [CrossRef]
  33. Tran, T.T.; Bray, K.; Ford, M.J.; Toth, M.; Aharonovich, I. Quantum emission from hexagonal boron nitride monolayers. Nat. Nanotechnol. 2016, 11, 37–41. [Google Scholar] [CrossRef]
  34. Geim, A.K.; Novoselov, K.S. The rise of graphene. Nat. Mater. 2007, 6, 183–191. [Google Scholar] [CrossRef] [PubMed]
  35. Ajayi, O.A.; Anderson, N.C.; Cotlet, M.; Petrone, N.; Gu, T.; Wolcott, A.; Gesuele, F.; Hone, J.; Owen, J.S.; Wong, C.W. Time-resolved energy transfer from single chloride-terminated nanocrystals to graphene. Appl. Phys. Lett. 2014, 104, 171101. [Google Scholar] [CrossRef] [Green Version]
  36. Geim, A.K.; Grigorieva, I.V. Van der Waals heterostructures. Nature 2013, 499, 419–425. [Google Scholar] [CrossRef]
  37. Attanzio, A.; Sapelkin, A.; Gesuele, F.; van der Zande, A.; Gillin, W.P.; Zheng, M.; Palma, M. Carbon Nanotube-Quantum Dot Nanohybrids: Coupling with Single-Particle Control in Aqueous Solution. Small 2017, 13, 1603042. [Google Scholar] [CrossRef]
  38. Hong, X.; Kim, J.; Shi, S.-F.; Zhang, Y.; Jin, C.; Sun, Y.; Tongay, S.; Wu, J.; Zhang, Y.; Wang, F. Ultrafast charge transfer in atomically thin MoS2/WS2 heterostructures. Nat. Nanotechnol. 2014, 9, 1–5. [Google Scholar] [CrossRef] [PubMed]
  39. Freeley, M.; Attanzio, A.; Cecconello, A.; Amoroso, G.; Clement, P.; Fernandez, G.; Gesuele, F.; Palma, M. Tuning the Coupling in Single-Molecule Heterostructures: DNA-Programmed and Reconfigurable Carbon Nanotube-Based Nanohybrids. Adv. Sci. 2018, 5, 1800596. [Google Scholar] [CrossRef]
  40. Butler, S.Z.; Hollen, S.M.; Cao, L.; Cui, Y.; Gupta, J.A.; Gutiérrez, H.R.; Heinz, T.F.; Hong, S.S.; Huang, J.; Ismach, A.F. Opportunities in Two-Dimensional Materials Beyond Graphene. ACS Nano 2013, 7, 2898–2926. [Google Scholar] [CrossRef]
  41. Frisenda, R.; Castellanos-Gomez, A. Robotic assembly of artificial nanomaterials. Nat. Nanotechnol. 2018, 13, 441–442. [Google Scholar] [CrossRef]
  42. Novoselov, K.S.; Jiang, D.; Schedin, F.; Booth, T.J.; Khotkevich, V.V.; Morozov, S.V.; Geim, A.K. Two-dimensional atomic crystals. Proc. Natl. Acad. Sci. USA 2005, 102, 10451–10453. [Google Scholar] [CrossRef] [Green Version]
  43. Paton, K.R.; Varrla, E.; Backes, C.; Smith, R.J.; Khan, U.; O’Neill, A.; Boland, C.; Lotya, M.; Istrate, O.M.; King, P.; et al. Scalable production of large quantities of defect-free few-layer graphene by shear exfoliation in liquids. Nat. Mater. 2014, 13, 624–630. [Google Scholar] [CrossRef]
  44. Kaur, J.; Gravagnuolo, A.M.; Maddalena, P.; Altucci, C.; Giardina, P.; Gesuele, F. Green synthesis of luminescent and defect-free bio-nanosheets of MoS2: Interfacing two dimensional crystals with hydrophobins. RSC Adv. 2017, 7, 22400–22408. [Google Scholar] [CrossRef]
  45. Li, X.; Cai, W.; An, J.; Kim, S.; Nah, J.; Yang, D.; Piner, R.; Velamakanni, A.; Jung, I.; Tutuc, E.; et al. Large-area synthesis of high-quality and uniform graphene films on copper foils. Science 2009, 324, 1312–1314. [Google Scholar] [CrossRef] [PubMed]
  46. Li, X.; Magnuson, C.W.; Venugopal, A.; An, J.; Suk, J.W.; Han, B.; Borysiak, M.; Cai, W.; Velamakanni, A.; Zhu, Y.; et al. Graphene Films with Large Domain Size by a Two-Step Chemical Vapor Deposition Process. Nano Lett. 2010, 10, 4328–4334. [Google Scholar] [CrossRef] [PubMed] [Green Version]
  47. Lettieri, S.; Pallotti, D.K.; Gesuele, F.; Maddalena, P. Unconventional ratiometric-enhanced optical sensing of oxygen by mixed-phase TiO2. Appl. Phys. Lett. 2016, 109, 031905. [Google Scholar] [CrossRef]
  48. Pallotti, D.K.; Passoni, L.; Gesuele, F.; Maddalena, P.; Di Fonzo, F.; Lettieri, S. Giant O2-Induced Photoluminescence Modulation in Hierarchical Titanium Dioxide Nanostructures. ACS Sens. 2017, 2, 61–68. [Google Scholar] [CrossRef] [PubMed]
  49. Coscia, U.; Ambrosone, G.; Gesuele, F.; Grossi, V.; Parisi, V.; Schutzmann, S.; Basa, D.K. Laser annealing study of PECVD deposited hydrogenated amorphous silicon carbon alloy films. Appl. Surf. Sci. 2007, 254, 984–988. [Google Scholar] [CrossRef]
  50. Gesuele, F.; Nivas, J.J.J.; Fittipaldi, R.; Altucci, C.; Bruzzese, R.; Maddalena, P.; Amoruso, S. Analysis of nascent silicon phase-change gratings induced by femtosecond laser irradiation in vacuum. Sci. Rep. 2018, 8, 12498. [Google Scholar] [CrossRef] [PubMed]
  51. Ferrari, A.C.; Meyer, J.C.; Scardaci, V.; Casiraghi, C.; Lazzeri, M.; Mauri, F.; Piscanec, S.; Jiang, D.; Novoselov, K.S.; Roth, S.; et al. Raman Spectrum of Graphene and Graphene Layers. Phys. Rev. Lett. 2006, 97, 187401. [Google Scholar] [CrossRef] [Green Version]
  52. Ferrari, A.; Basko, D. Raman spectroscopy as a versatile tool for studying the properties of graphene. Nat. Nanotechnol. 2013, 8, 235–246. [Google Scholar] [CrossRef] [Green Version]
  53. Gesuele, F.; Pang, C.X.; Leblond, G.; Blaize, S.; Bruyant, A.; Royer, P.; Deturche, R.; Maddalena, P.; Lerondel, G. Towards routine near-field optical characterization of silicon-based photonic structures: An optical mode analysis in integrated waveguides by transmission AFM-based SNOM. Phys. E Low Dimens. Syst. Nanostruct. 2009, 41, 1130–1134. [Google Scholar] [CrossRef]
  54. Blaize, S.; Gesuele, F.; Stefanon, I.; Bruyant, A.; Lérondel, G.; Royer, P.; Martin, B.; Morand, A.; Benech, P.; Fedeli, J.-M. Real-space observation of spectral degeneracy breaking in a waveguide-coupled disk microresonator. Opt. Lett. 2010, 35, 3168. [Google Scholar] [CrossRef] [PubMed]
  55. Dawlaty, J.M.; Shivaraman, S.; Chandrashekhar, M.; Rana, F.; Spencer, M.G. Measurement of ultrafast carrier dynamics in epitaxial graphene. Appl. Phys. Lett. 2008, 92, 1–3. [Google Scholar] [CrossRef]
  56. Obraztsov, P.A.; Rybin, M.G.; Tyurnina, A.V.; Garnov, S.V.; Obraztsova, E.D.; Obraztsov, A.N.; Svirko, Y.P. Broadband light-induced absorbance change in multilayer graphene. Nano Lett. 2011, 11, 1540–1545. [Google Scholar] [CrossRef] [PubMed]
  57. Winnerl, S.; Mittendorff, M.; König-Otto, J.C.; Schneider, H.; Helm, M.; Winzer, T.; Knorr, A.; Malic, E. Ultrafast Processes in Graphene: From Fundamental Manybody Interactions to Device Applications. Ann. Phys. 2017, 529, 1–12. [Google Scholar] [CrossRef]
  58. Malic, E.; Winzer, T.; Bobkin, E.; Knorr, A. Microscopic theory of absorption and ultrafast many-particle kinetics in graphene. Phys. Rev. B Condens. Matter Mater. Phys. 2011, 84. [Google Scholar] [CrossRef]
  59. König-Otto, J.C.; Mittendorff, M.; Winzer, T.; Kadi, F.; Malic, E.; Knorr, A.; Berger, C.; De Heer, W.A.; Pashkin, A.; Schneider, H.; et al. Slow Noncollinear Coulomb Scattering in the Vicinity of the Dirac Point in Graphene. Phys. Rev. Lett. 2016, 117, 1–6. [Google Scholar] [CrossRef] [PubMed]
  60. Mittendorff, M.; Winzer, T.; Malic, E.; Knorr, A.; Berger, C.; De Heer, W.A.; Schneider, H.; Helm, M.; Winnerl, S. Anisotropy of excitation and relaxation of photogenerated charge carriers in graphene. Nano Lett. 2014, 14, 1504–1507. [Google Scholar] [CrossRef]
  61. George, P.A.; Strait, J.; Dawlaty, J.; Shivaraman, S.; Chandrashekhar, M.; Rana, F.; Spencer, M.G. Ultrafast Optical-Pump Terahertz-Probe Spectroscopy of the Carrier Relaxation and Recombination Dynamics in Epitaxial Graphene. Nano Lett. 2008, 8, 4248–4251. [Google Scholar] [CrossRef] [Green Version]
  62. Sun, D.; Wu, Z.K.; Divin, C.; Li, X.; Berger, C.; De Heer, W.A.; First, P.N.; Norris, T.B. Ultrafast relaxation of excited dirac fermions in epitaxial graphene using optical differential transmission spectroscopy. Phys. Rev. Lett. 2008, 101, 1–4. [Google Scholar] [CrossRef]
  63. Brida, D.; Tomadin, A.; Manzoni, C.; Kim, Y.J.; Lombardo, A.; Milana, S.; Nair, R.R.; Novoselov, K.S.; Ferrari, A.C.; Cerullo, G.; et al. Ultrafast collinear scattering and carrier multiplication in graphene. Nat. Commun. 2013, 4, 1987. [Google Scholar] [CrossRef]
  64. Hwang, E.H.; Hu, B.Y.K.; Das Sarma, S. Inelastic carrier lifetime in graphene. Phys. Rev. B Condens. Matter Mater. Phys. 2007, 76, 1–6. [Google Scholar] [CrossRef]
  65. Polini, M.; Asgari, R.; Borghi, G.; Barlas, Y.; Pereg-Barnea, T.; MacDonald, A.H. Plasmons and the spectral function of graphene. Phys. Rev. B Condens. Matter Mater. Phys. 2008, 77, 3–6. [Google Scholar] [CrossRef]
  66. Chirayath, V.A.; Callewaert, V.; Fairchild, A.J.; Chrysler, M.D.; Gladen, R.W.; McDonald, A.D.; Imam, S.K.; Shastry, K.; Koymen, A.R.; Saniz, R.; et al. Auger electron emission initiated by the creation of valence-band holes in graphene by positron annihilation. Nat. Commun. 2017, 8, 1–7. [Google Scholar] [CrossRef] [PubMed]
  67. Winzer, T.; Malić, E. Impact of Auger processes on carrier dynamics in graphene. Phys. Rev. B Condens. Matter Mater. Phys. 2012, 85, 1–5. [Google Scholar] [CrossRef]
  68. Winzer, T.; Knorr, A.; Malic, E. Carrier multiplication in graphene. Nano Lett. 2010, 10, 4839–4843. [Google Scholar] [CrossRef] [PubMed]
Figure 1. Schematic representation of the setup for ultrafast hyperspectral transient absorption spectroscopy with crossed polarization of pump and probe. The system was based on an amplified 800 nm mode-locked Ti:Sapphire laser. A pair of multichannel optical detectors allow for the acquisition of the entire spectrum. The samples were optically pumped using the spectrally tunable femtosecond pulses generated in the OPA. The induced changes in transmission were probed using the white-light supercontinuum. Other components: DL, delay line; M, mirror; BS, beam splitter; SP, sapphire plate; F, long-pass filter; Rr, retroreflector; GLP, Glan-laser polarizer; HWP, half-wave plate. The technique reconstructs the time and wavelength dependent change in the sample absorbance Δ A ( λ , t ) (2D spectrograms) induced by the pump.
Photonics 06 00095 g001
Figure 2. (a) Chirp of the supercontinuum probe measured by cross correlation with a pulse at 1150 nm in 0.2 mm fused silica substrate. Since the pump lies on the spectral region of the probe pulse, we employ a crossed polarization configuration with pump s-polarized and probe p-polarized. (b) Extracted time dependent kinetics at 940 nm probe wavelength (the blue circles are experimental data, the solid red line is the gaussian fit described in the text).
Photonics 06 00095 g002
Figure 3. (a) Relative delay of the overlap pump-probe: the blue points are the results of the fitting procedure for the kinetic traces extracted from the 2D data set in Figure 2a. The solid red curve represent a polynomial (of order 2) fit of the data. (b) Time resolution as a function of the probe wavelength. The red circles represent the Full Width at Half Maximum (FWHM) extrapolated by the gaussian fit of the kinetic traces. The red solid line is a guide for eye.
Photonics 06 00095 g003
Figure 4. 2D spectrograph of time resolved absorbance change in single layer graphene (SLG) with pump energy of 1.08 eV at a fluence of 180 µJ/cm2 (a) after the numerical procedure of chirp correction and (b) before chirp correction. (c) Differential spectra ΔA of corrected dataset at maximum bleach. (d) Time resolved differential absorbance ΔA at red-shifted probe energy of 0.934 eV (1327 nm). The blue circles represent the experimental results and the red line is a biexponential fit of the data with the two decay constants reported in the inset.
Photonics 06 00095 g004

