Article

Validation of an Inverse Fitting Method of Diffuse Reflectance Spectroscopy to Quantify Multi-Layered Skin Optical Properties

1
Graduate Institute of Biomedical Electronics and Bioinformatics, National Taiwan University, Taipei 10617, Taiwan
2
Department of Electrical Engineering, National Taiwan University, Taipei 10617, Taiwan
3
Molecular Imaging Center, National Taiwan University, Taipei 10672, Taiwan
*
Author to whom correspondence should be addressed.
These authors contributed equally to this work.
Photonics 2019, 6(2), 61; https://doi.org/10.3390/photonics6020061
Submission received: 28 February 2019 / Revised: 4 May 2019 / Accepted: 28 May 2019 / Published: 30 May 2019
(This article belongs to the Special Issue Biomedical Photonics Advances)

Abstract

:
Skin consists of epidermis and dermis layers that have distinct optical properties. The quantification of skin optical properties is commonly achieved by modeling photon propagation in tissue using Monte Carlo (MC) simulations and iteratively fitting experimentally measured diffuse reflectance spectra. In order to speed up the inverse fitting process, time-consuming MC simulations have been replaced by artificial neural networks to quickly calculate reflectance spectra given tissue geometric and optical parameters. In this study the skin was modeled to consist of three layers and different scattering properties of the layers were considered. A new inverse fitting procedure was proposed to improve the extraction of chromophore-related information in the skin, including the hemoglobin concentration, oxygen saturation and melanin absorption. The performance of the new inverse fitting procedure was evaluated on 40 sets of simulated spectra. The results showed that the fitting procedure without knowing the epidermis thickness extracted chromophore information with accuracy similar to or better than fitting with known epidermis thickness, which is advantageous for practical applications due to simpler and more cost-effective instruments. In addition, the melanin volume fraction multiplied by the thickness of the melanin-containing epidermis layer was estimated more accurately than the melanin volume fraction itself. This product has the potential to provide a quantitative indicator of melanin absorption in the skin. In-vivo cuff occlusion experiments were conducted and skin optical properties extracted from the experiments were comparable to the results of previously reported in vivo studies. The results of the current study demonstrated the applicability of the proposed method to quantify the optical properties related to major chromophores in the skin, as well as scattering coefficients of the dermis. Therefore, it has the potential to be a useful tool for quantifying skin optical properties in vivo.

1. Introduction

Diffuse reflectance spectroscopy (DRS) has been applied to detecting optical properties that are related to both normal physiological conditions and pathological changes of superficial tissue, such as the skin and mucosa in various openings of the human body [1,2,3,4,5]. To quantify the optical properties of tissue, forward and inverse methods are needed to resolve the relationship between measured spectra and optical properties in the framework of the radiative transport equation. The most commonly used modeling methods are diffusion approximation [6] and Monte Carlo (MC) simulations [7]. The former, under simple and symmetric geometries, provides analytical solutions which are fast and easy to implement. However, it suffers from larger errors in situations where photons are not sufficiently scattered. For applications of measuring superficial tissue, diffusion approximation is not a good choice, since the separation between the light source and detectors is typically shorter than distances required for diffusion approximation to be accurate. MC simulations, on the other hand, have been regarded as the gold standard in modeling photon propagation through tissue. However, since MC simulations use repeated random sampling to describe the random-walk behavior of photons in tissue, tracking large numbers of photons are needed to obtain stable and usable results, which is very time-consuming. Although using graphics processing units (GPU) to accelerate MC simulations has been proposed [8] and widely adopted, it is still time-consuming to iteratively fit experimental data for extracting tissue optical properties [9].
For modeling the skin which consists of a thin layer of epidermis on top of the dermis, two or more layered tissue models are more appropriate than semi-infinite homogeneous models [10,11,12,13,14,15,16,17,18,19,20,21]. To reduce the time for running repeated MC simulations when extracting tissue optical properties, many studies have proposed to construct empirical relations [10,11,12,13,14], look-up tables [15,16], or artificial neural networks [18,19,20,22] to quickly calculate the reflectance at tissue surface given tissue geometric and optical properties. These forward methods are all established using databases pre-calculated with MC simulations. Among the previously proposed forward methods, using artificial neural networks to train the forward model (F-ANN) is particularly attractive because it possesses high flexibility, accuracy and computational efficiency at the same time. There is no restriction on tissue optical properties, such as the scattering coefficients of the epidermis and dermis being the same in some of the empirical models [13,14,15,16]. A three-layered F-ANN skin model was reported to provide accurate reflectance values with about 1000 times reduction in computational time as compared to MC simulations [20]. It was then applied to extracting optical properties of the skin through iterative curve fitting of in-vivo spatially-resolved diffuse reflectance spectra. However, the thickness of the epidermis was measured using in-vivo harmonic generation microscopy (HGM) and assumed to be known in the curve fitting process. The use of imaging techniques, such as HGM or optical coherence tomography (OCT) to measure the epidermis thickness is inconvenient or even impractical for applying DRS to quantifying skin optical properties in clinics.
To continue developing DRS as a practical and widespread tool for in-vivo quantification of skin optical properties, this study aims to quantify the optical properties of the skin in vivo without knowing the thickness of the epidermis based on a multi-layered skin model. The accurate and highly efficient and flexible F-ANN forward model was combined with several inverse fitting procedures to improve the curve fitting of in vivo DRS data. The performance of estimating tissue layer thickness, scattering coefficients and chromophore information in multi-layered skin model from spatially-resolved diffuse reflectance spectra was evaluated using simulated data. Finally, in vivo cuff occlusion experiments were conducted and the estimation of in vivo skin optical properties was demonstrated. Results were compared to other in-vivo DRS studies to support the credibility of the proposed method.

2. Materials and Methods

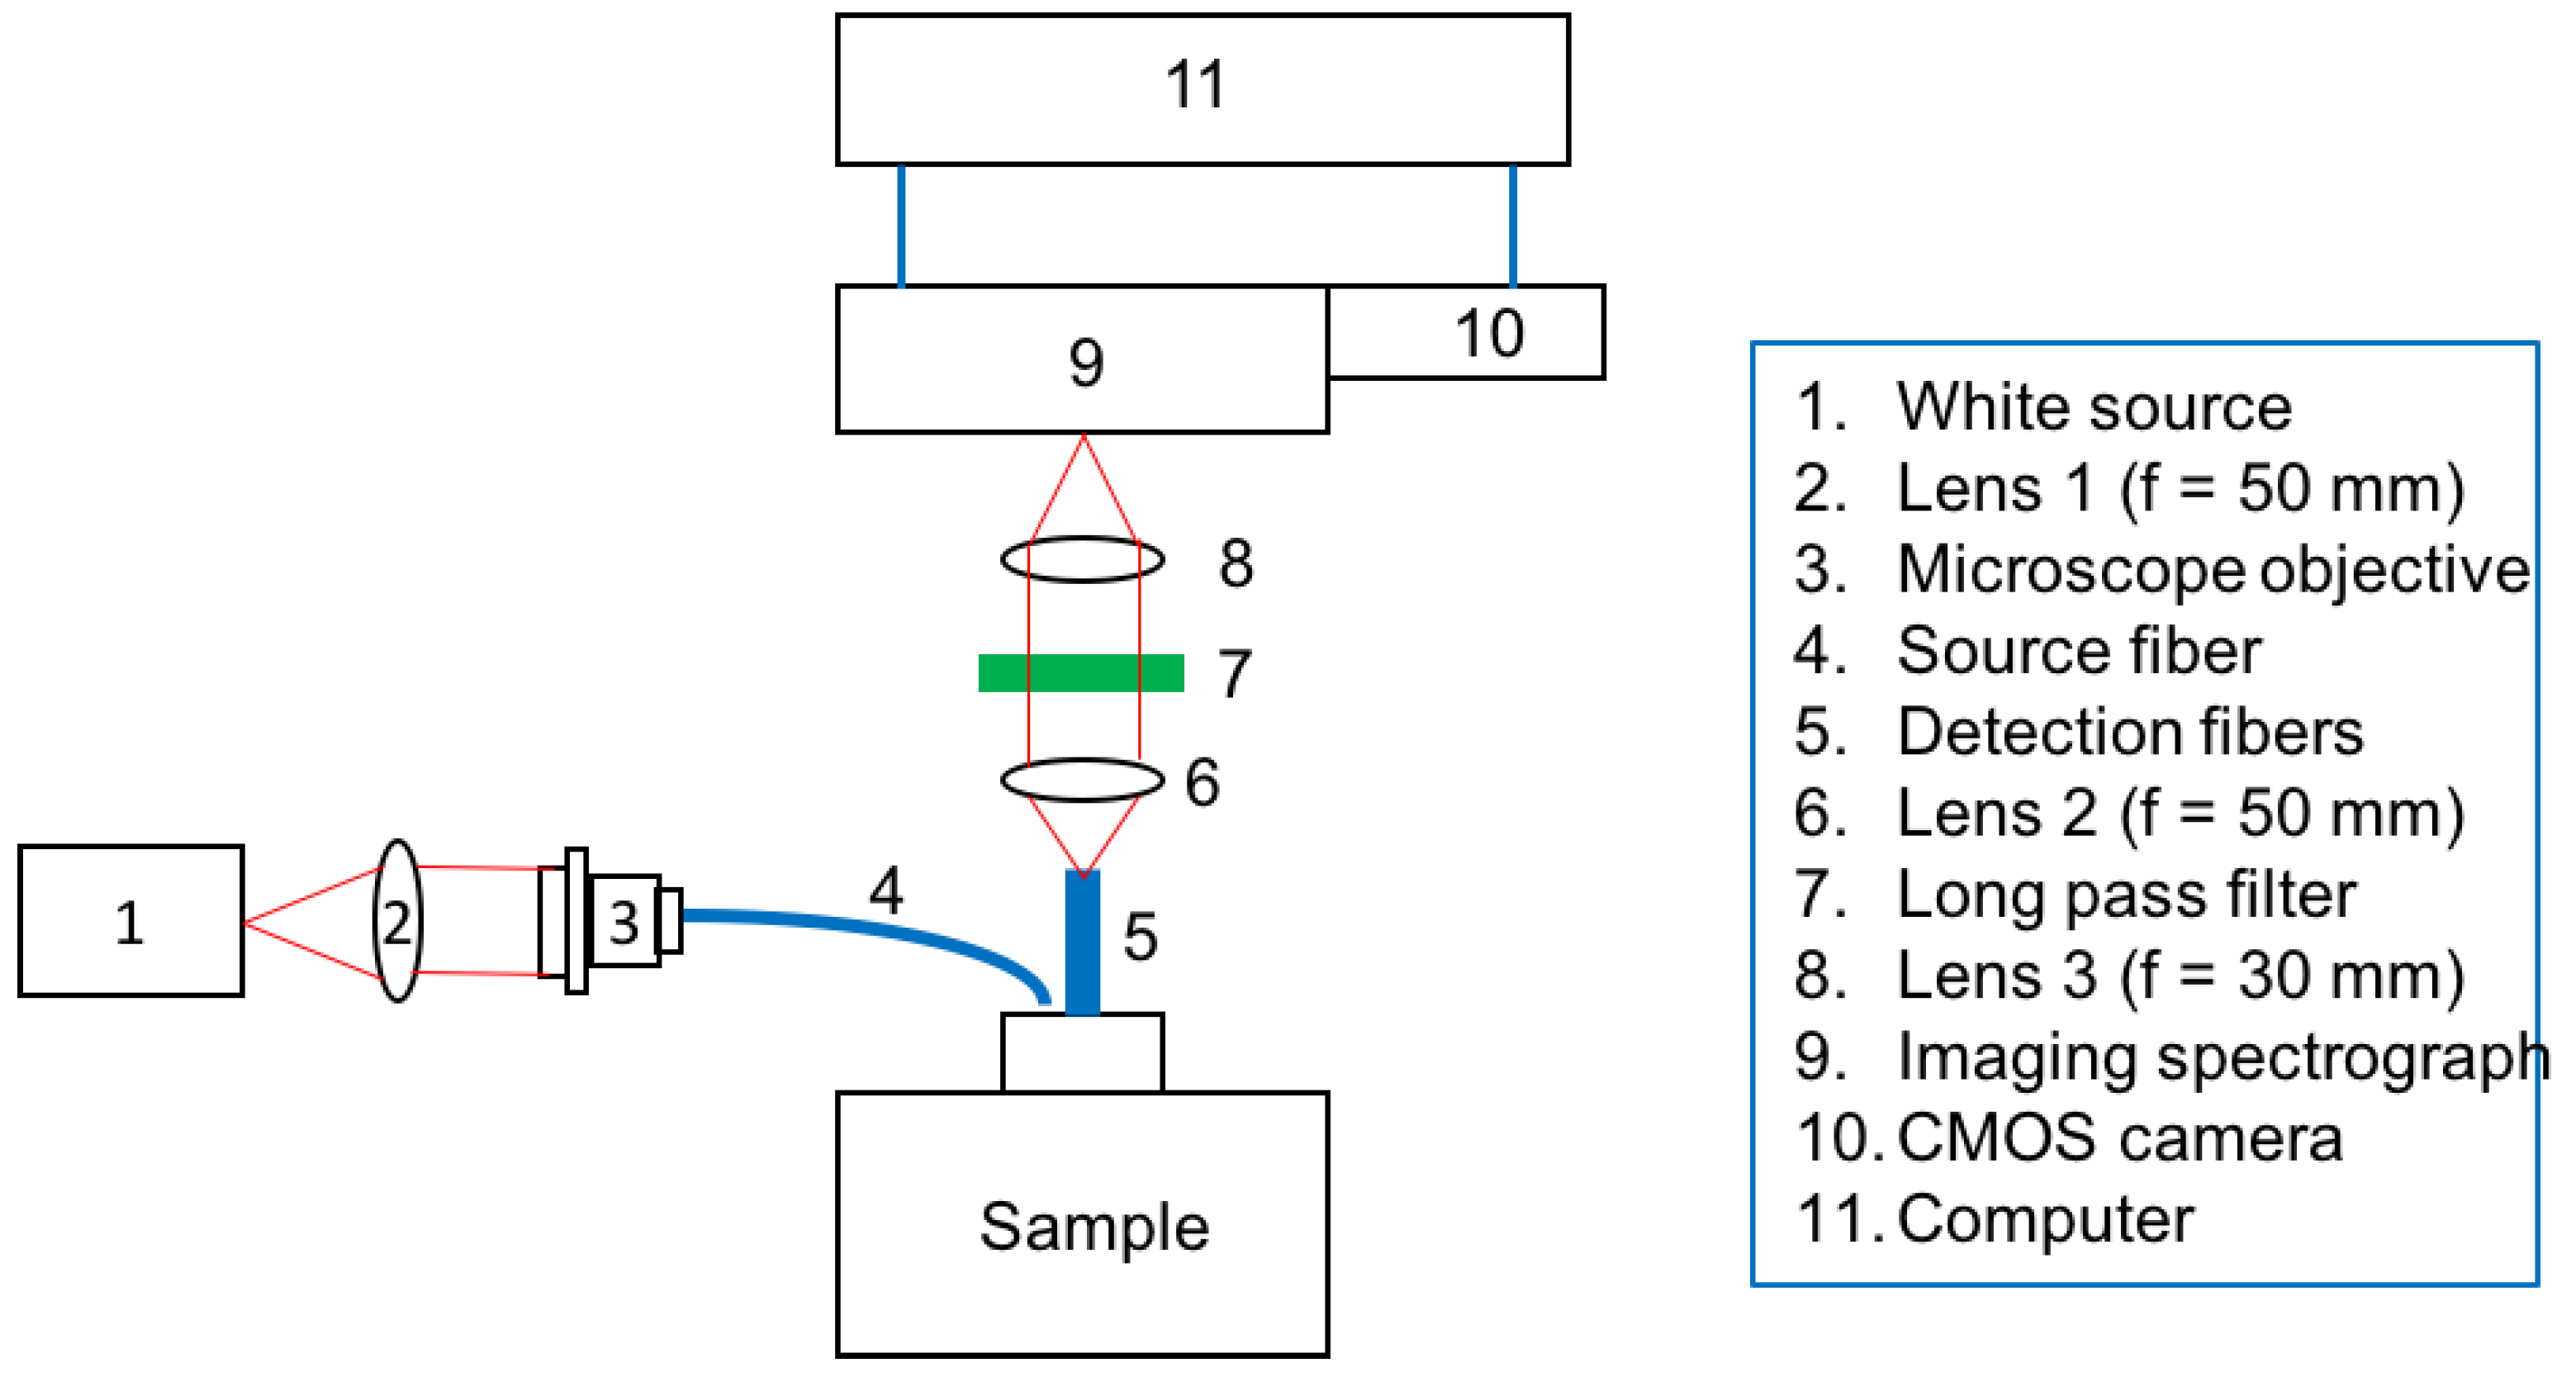
2.1. Spatially-Resolved Diffuse Reflectance Spectroscopy (SRDRS) System

A schematic diagram of the SRDRS system is shown in Figure 1. The output beam of a broad-band light source (Bluloop, Ocean Optics) was focused into the proximal end of a multi-mode optical fiber by a lens and a microscope objective. The distal end of the source fiber was gently placed on the surface of the skin with a pressure of about 6 kPa. Diffusely reflected light from phantoms or the tissue was collected by distal ends of three optical fibers located at source-detector separations (SDS) of 0.22, 0.45, and 0.73 mm, respectively. All of the fibers had a core diameter of 200 μm and a numerical aperture of 0.26. The light emerging from proximal ends of the detector fibers was focused into the entrance slit of an imaging spectrograph (Holospec, Andor, USA), dispersed by the spectrograph and recorded by a CMOS camera (GS3-U3-23S6M-C, PointGrey). The exposure time to capture one set of spectra was 0.15 s.

2.2. Tissue Model

The skin consists of two types of tissue, including an upper epithelial tissue layer called epidermis on top of the connective tissue called dermis. The epidermis is composed of four to five cellular layers (i.e., stratum corneum, stratum lucidum, stratum granulosum, stratum spinosum, and stratum basale) with a total thickness of 20–380 μm depending on the location of the skin. The major chromophore in the epidermis is melanin which resides mostly in lower layers of the epidermis, such as the stratum granulosum, stratum spinosum and stratum basale. In this study the epidermis was modeled as two homogeneous layers, including an upper layer without melanin and a lower layer with melanin. The dermis was modeled as a homogenous semi-infinitely thick layer, since the penetration depth of photons collected by the experimental system described in Section 2.1 was expected to be within the dermis only.
The absorption coefficient of the upper amelanotic epidermis layer was set to be the same as that measured from epithelial cells [23],
μ a 1 ( λ ) = μ e p i ( λ ) .
The absorption coefficient of the second layer was assumed to be contributed by both melanin and epithelial cells and was expressed as
μ a 2 ( λ ) = f m e l ×   μ m e l ( λ ) + ( 1 f m e l ) × μ e p i ( λ ) ,
where fmel is the volume fraction of melanin and μmel(λ) was the wavelength-dependent absorption coefficient of melanin [24]. The absorption coefficient of the third layer was mainly contributed by collagen, hemoglobin and water, and was expressed as
μ a 3 ( λ ) = f b l o o d × μ h b ( λ ) + f w × μ w ( λ ) + ( 1 f w f h b ) × μ c o l ( λ ) ,
where f b l o o d is the volume fraction of blood, fw was the volume fraction of water which was assumed to be a fixed value of 70% [25], and μhb(λ), μw(λ), μcol(λ) were absorption coefficients of whole blood, water [26] and pure collagen [27], respectively. The absorption coefficient spectrum of pure collagen is showed in Figure 2. The absorption coefficient of the whole blood was calculated as,
μ h b ( λ ) = 2.303 × C h e m o × ( α × ε o x y ( λ ) 64532 + ( 1 α ) × ε d e o x y ( λ ) 64500 ) ,
where Chemo is the hemoglobin concentration of whole blood with a typical assumed value of 150 g/L, εoxy(λ) and εdeoxy(λ) are molar extinction coefficients of oxy-hemoglobin and deoxy-hemoglobin respectively [28], and α is the tissue oxygen saturation (StO2). The blood volume fraction is used throughout this paper for easy comparison with previous studies, but can be converted to the hemoglobin concentration in tissue simply by 150 × fblood (g/L).
The scattering coefficients, μ s x ( λ ) , of layer x were assumed to follow a two-term inverse power-law function of the wavelength as [29],
μ s x ( λ ) = μ s x ( λ ) / ( 1 g x )   ( x = 2 ,   3 ) ,
μ s x ( λ ) = 1000 × A x 1 × λ k x 1 + A x 2 × λ k x 2   ( x = 2 ,   3 ) ,
where Ax1, Ax2, kx1, kx2 were parameters to be determined and g x was the anisotropy factor. To simplify the model the scattering coefficient of the upper epidermal layer was set to be 1.3 × μ s 2 ( λ ) according to a previous study [30]. The Henyey-Greenstein scattering phase function was used for all layers with g x set to be 0.835, 0.75, and 0.715 for the three layers, respectively [29]. All tissue layers had the same refractive index of 1.42.

2.3. Pre-Simulated Reflectance Database and forward ANN Models

The forward model of reflectance spectra measured by the SRDRS system was implemented using publically accessible multi-layered Monte Carlo (MCML) accelerated by a graphics processing unit (GPU, GeForce GTX 1080, 1080Ti, 1070Ti, 660Ti) [31]. The incident light from the source fiber was modeled as a Gaussian beam with a size of 0.22 mm at e−2 of its maximum intensity and one billion photons were launched. To train and test ANN models, a total of 57,695 sets of reflectance were created using MCML and seven parameters (th1, th2, μa1, μa2, μa3, μs2, μs3) with randomly assigned values within ranges, shown in Table 1 [25,29,32], where th1 and th2 represent the thickness of the upper and lower epidermal layer, respectively.

2.4. Inverse Fitting Procedures

The non-linear iterative curve-fitting function ‘fmincon’ with the interior-point algorithm provided by MATLAB® (MathWorks, Inc., Natick, MA, USA) was used to extract optical properties from simulated or measured target reflectance spectra. The objective function to be optimized was the root-mean-squared percent error between the F-ANN modeled spectra and the target spectra:
r m s e = S D S λ ( R ( λ , S D S ) R t a r g e t ( λ , S D S ) R t a r g e t ( λ , S D S ) ) 2 ( N u m b e r   o f   S D S ) × ( N u m b e r   o f   λ ) × 100 % ,
where Rtarget and R were the targets and F-ANN modeled reflectance spectra, respectively. The inverse fitting procedure consisted of the following steps:
  • Compare the target spectra to 1000 sets of spectra pre-calculated with MC simulations using randomly assigned parameters, and calculate the rmse between the target and the pre-calculated spectra.
  • Choose three pre-calculated spectra with the lowest rmse, and the corresponding parameter sets were chosen as the initial parameter sets. Repeat step 3 for each of the three initial parameter sets.
  • Do iterative curve fitting of the target spectra according to one of the following procedures
    • Procedure X: Only fit the target spectra in wavelength ranges 410–440 nm and 530–580 nm where hemoglobin absorption is prominent.
    • Procedure Y: Do procedure X, constrain the boundary of fblood and α to be within ±10% of the results after procedure X, and fit the target spectra in full wavelength range (401–590 nm).
    • Procedure Z: Only fit the target spectra in the full wavelength range (401–590 nm).
  • Find the lowest reflectance value of each spectrum in the wavelength range of 401–480 nm, and adjust fblood to make the lowest values of modeled spectra best match those of the target spectra.
  • Adjust α to minimize the rmse between the modeled and the target spectra in the wavelength range of 520–583 nm.
  • Choose the optimal result as the one with the lowest rmse among the three fitting trials to avoid local minimum.
To test the influences of not knowing the epidermis thickness on the performance of extracting optical properties, we compared two fitting scenarios:
  • Scenario A: Thicknesses of the two epidermal layers, th1 and th2, are unknown,
  • Scenario B: The sum of th1 and th2 is known.
In summary, there were six combinations of inverse fitting procedures to be tested. Forty sets of test spectra were generated using MC simulations to compare the performance of the inverse fitting procedures. Ranges of optical properties were chosen to generate test spectra that resemble realistic in-vivo spectra measured by the SRDRS system. Since the test data were generated from simulations, the parameters used to generate the data were known and served as the ground truth for the performance evaluation.

2.5. In Vivo Cuff Occlusion Experiments and Calibration of Spectra

To demonstrate the applicability of the F-ANN forward model and inverse fitting procedure on in-vivo skin optical property estimation, we took in-vivo measurements using the SRDRS system and conducted cuff occlusion experiments according to previous studies [33,34,35,36,37]. The current study was approved by the Institutional Review Board at National Taiwan University, and the informed consent was obtained from each healthy volunteer. After measuring the blood pressure of a volunteer, we used a mercurial sphygmomanometer to occlude the blood flow in the volunteer’s upper arm and measured reflectance spectra on the volunteer’s ventral side of the forearm before, during and after applying the pressure indicated below for arterial and venous occlusion, respectively. Venous occlusion was achieved by applying pressure that approximately equaled to the average of the systolic and diastolic blood pressures of the volunteer. Arterial occlusion was achieved by applying pressure about 50 mmHg higher than the systolic blood pressure of the volunteer to ensure total occlusion of the blood flow [38].
Reflectance spectra measured by the SRDRS system were converted by a previously published calibration procedure [39] to absolute reflectance values that can be directly compared to MC simulated reflectance values. We used five homogeneous aqueous phantoms to calibrate in-vivo diffuse reflectance spectra and remove effects of the non-uniform spectral response of the system and background, due to the ambient light. The phantoms were made of known concentrations of polystyrene beads (Polysciences, Inc., Polybead Microspheres) and hemoglobin (Sigma-Aldrich, ferrous stabilized human hemoglobin). The nominal diameter of the beads was 0.51 ± 0.008 μm and concentrations were 9.10 × 10¹⁰, 5.60 × 10¹⁰, 3.64 × 10¹⁰, 2.28 × 10¹⁰, and 1.21 × 10¹⁰ particles/mL, respectively. The hemoglobin concentration of the first four phantoms was 0.056 mg/mL and that of the last phantom was 0.1126 mg/mL. Compositions of the phantoms were chosen to give reflectance spectra similar to those measured from the skin in vivo. Theoretical scattering coefficients of the phantoms were obtained by Mie theory and absorption coefficients of hemoglobin solutions were measured by UV-visible absorption spectrometry. Finally, a calibration equation was obtained by performing linear regression between the measured and the MC-modeled reflectance values of the five phantoms.

3. Results

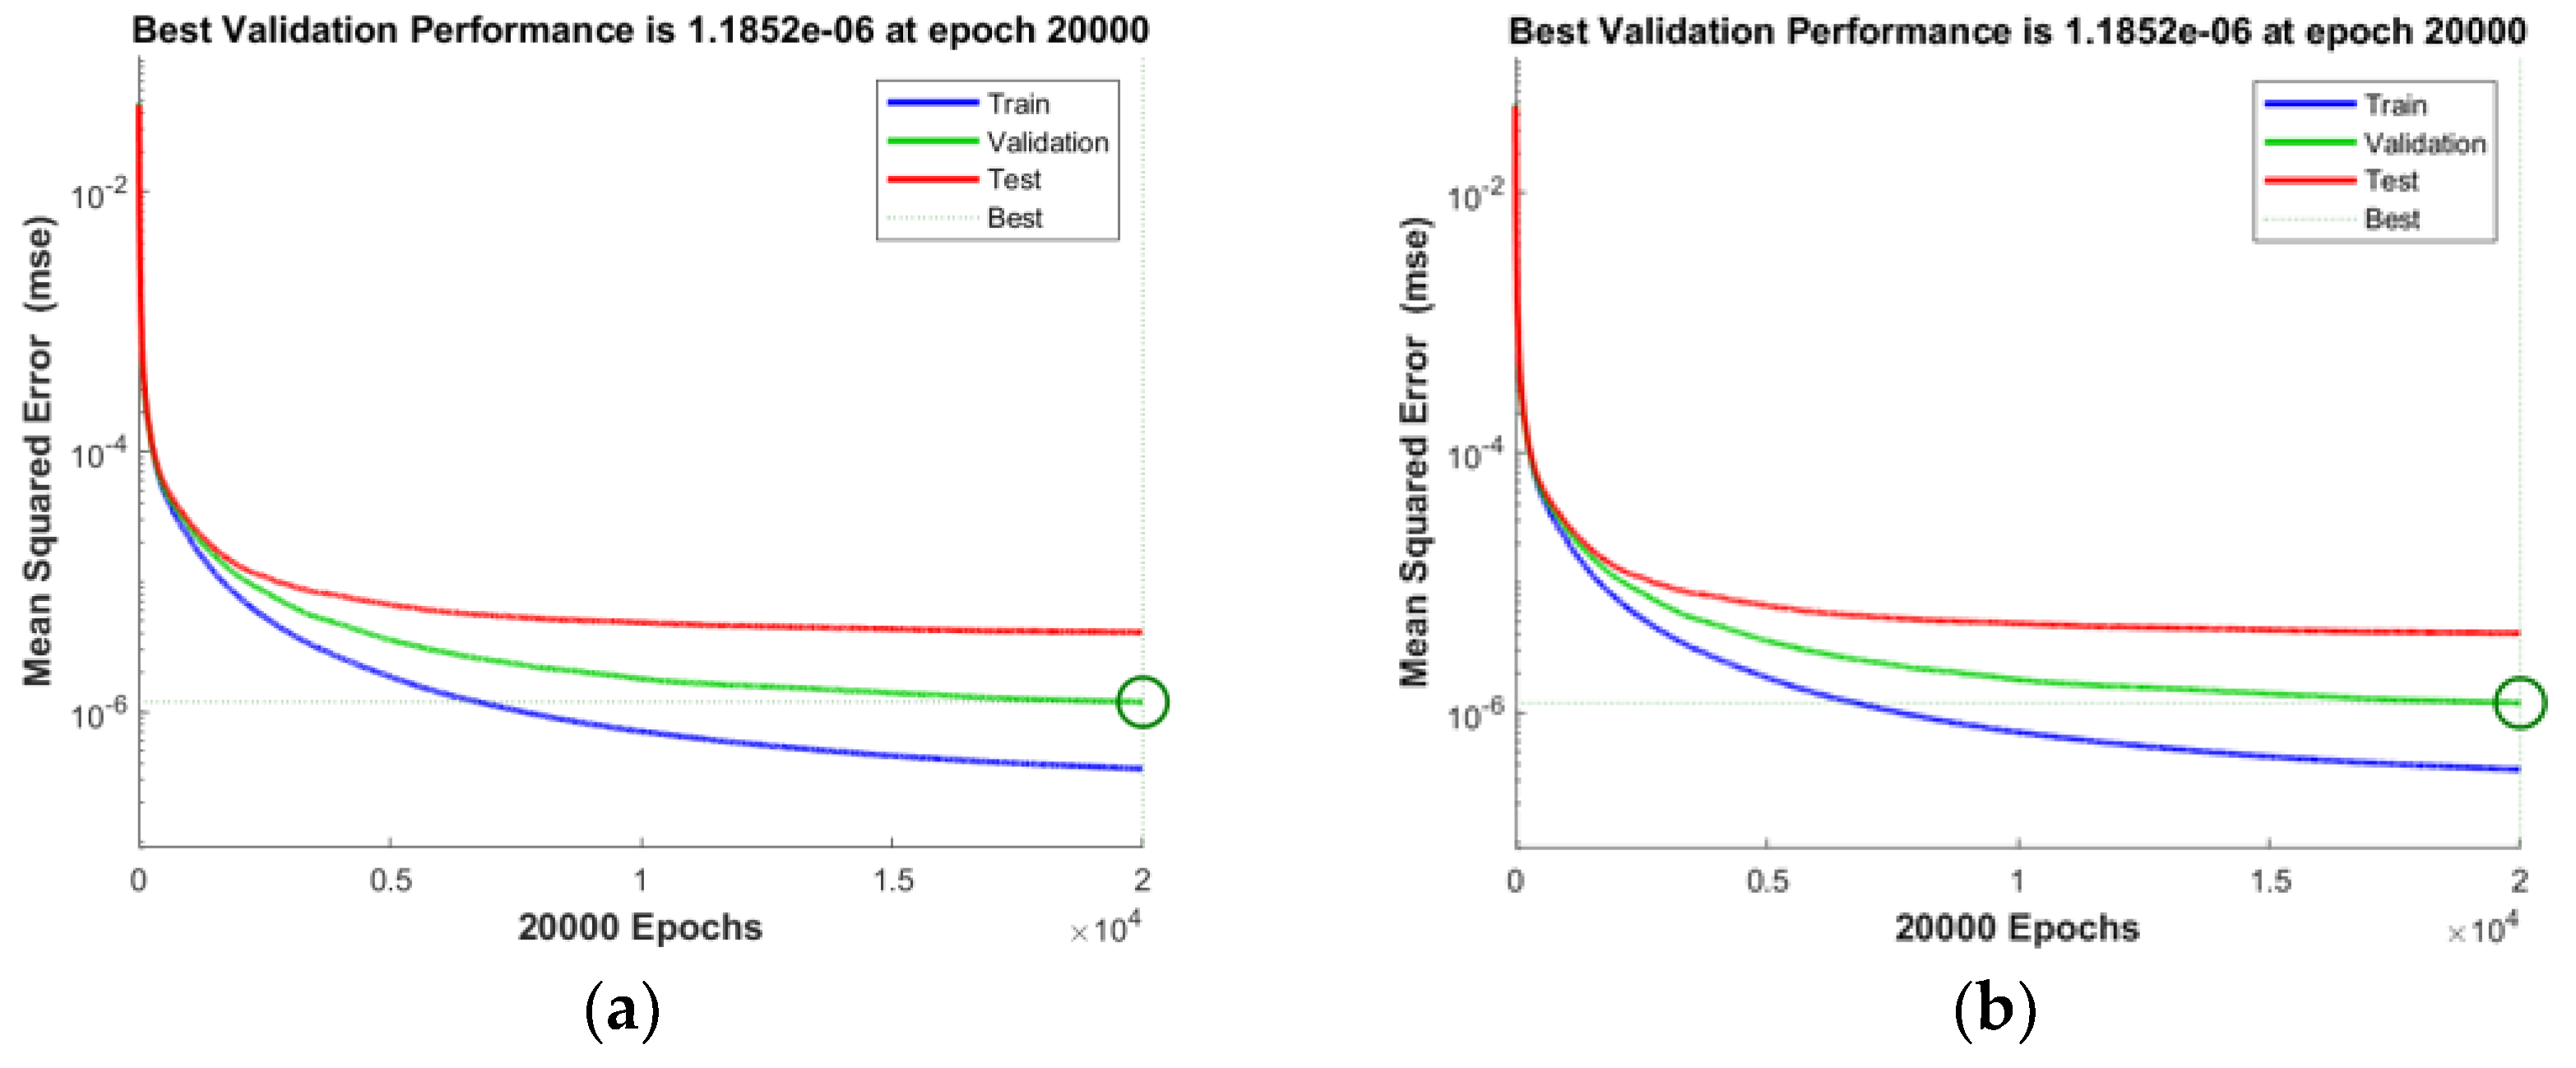
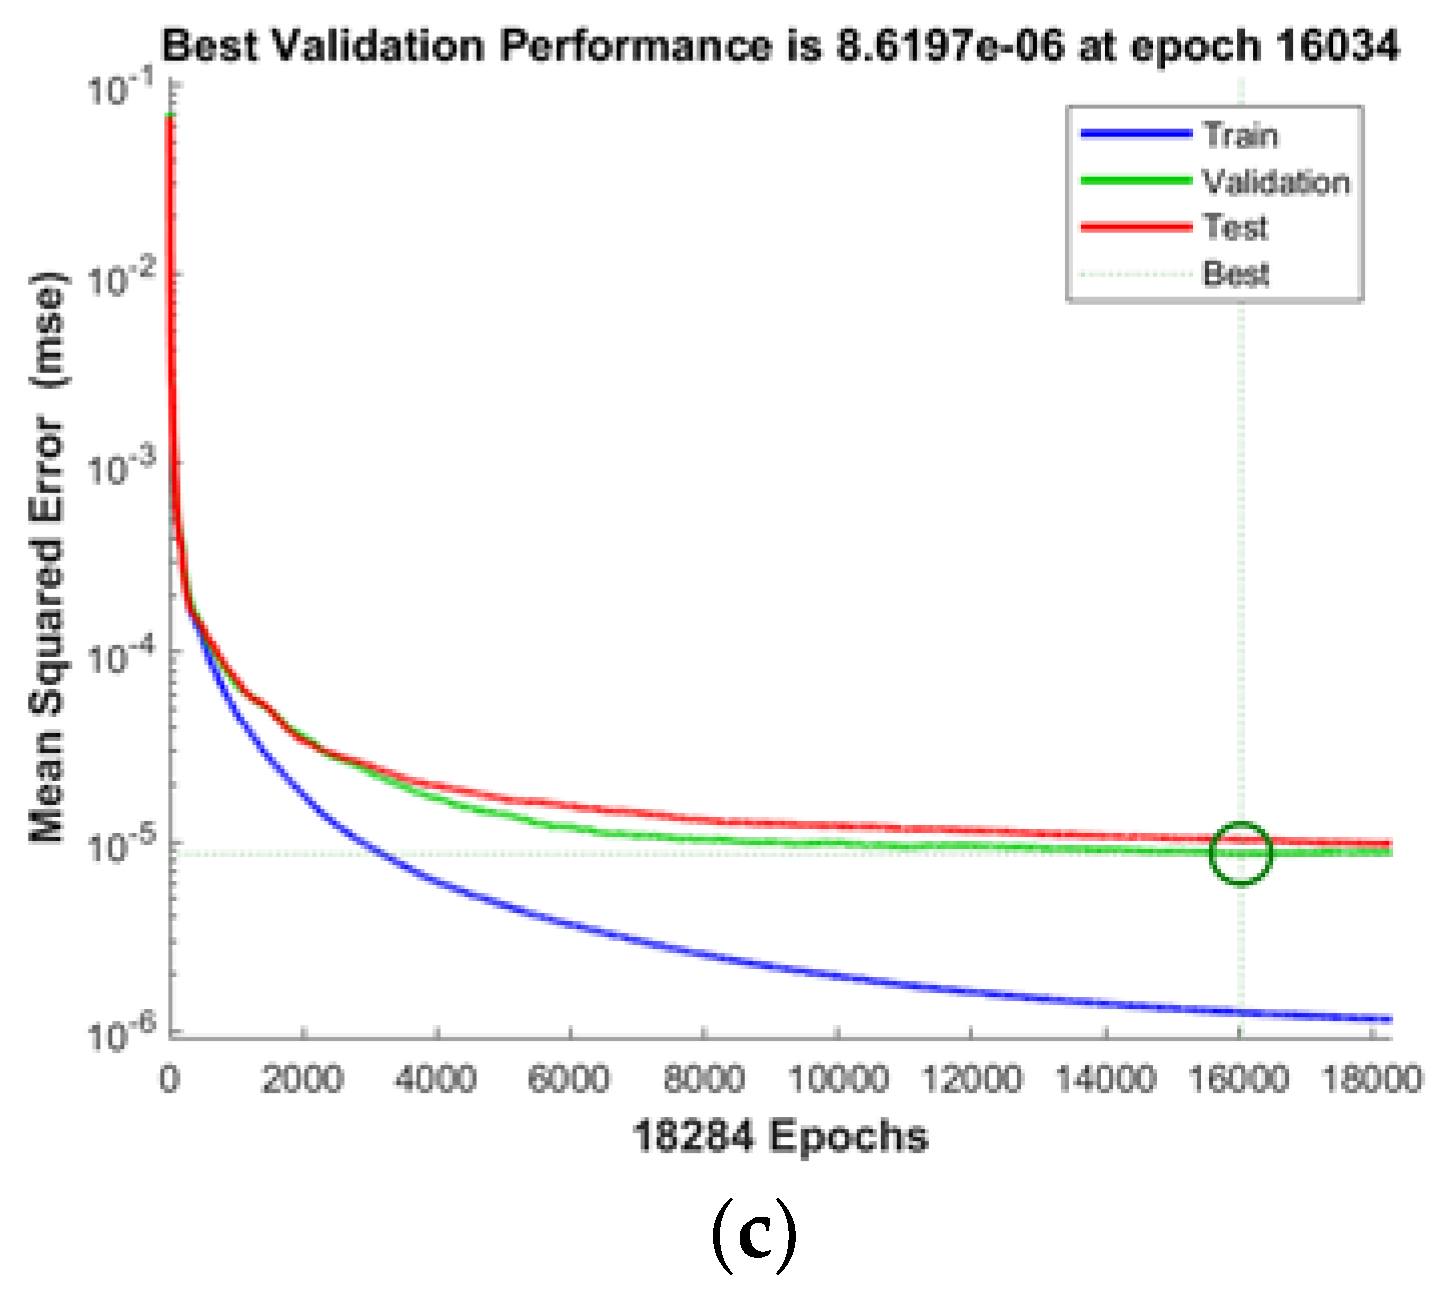
3.1. ANN Training Results

According to a previous study [20], a larger sample size and lower coefficient of variation (CV) of MC simulations help decrease errors in training and testing data. Therefore, in the current study the CV of MC simulations was controlled to be smaller than 2% using about 109 photons per simulation, which took approximately 20 s. The training of one ANN model needed only about 20 min. When training the F-ANN models, we tried different numbers of neurons in each layer of 2 hidden-layered ANN models. The optimal number of neurons in each layer was 150, which was judged by the smallest error in the testing data. Learning curves of the training procedure, shown in Figure 3, indicated excellent convergence of the validation and testing data sets.

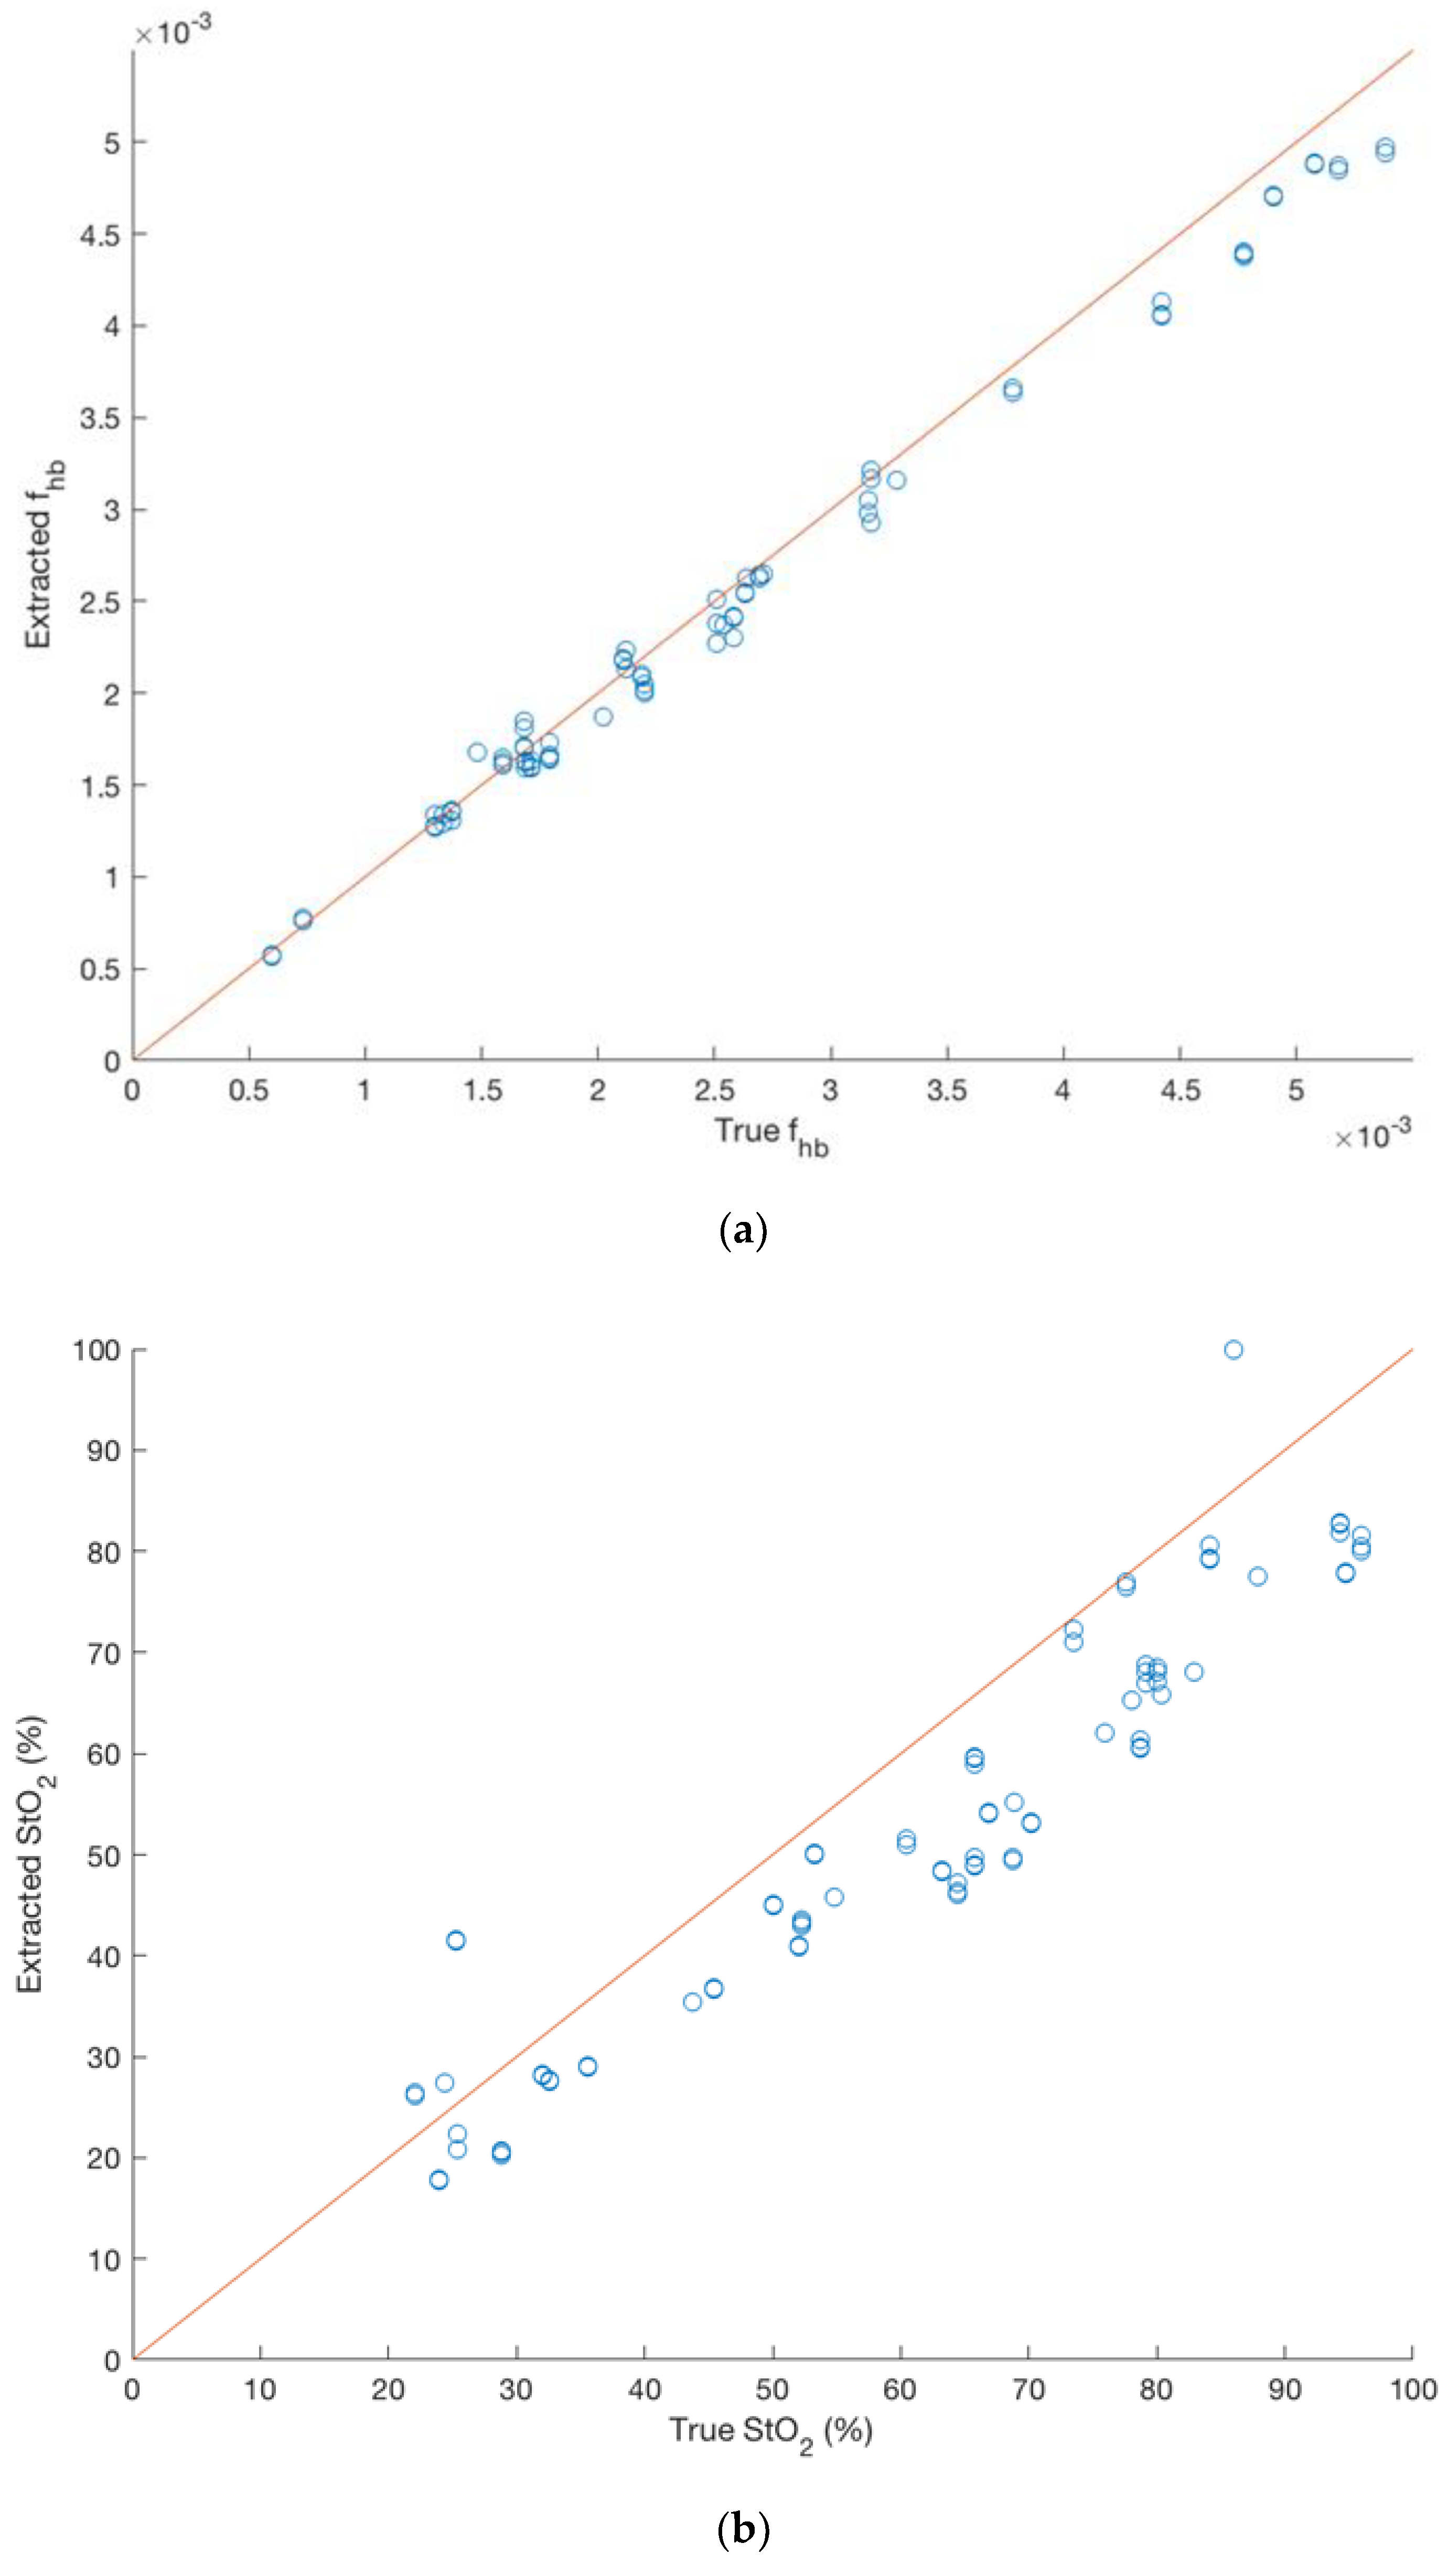
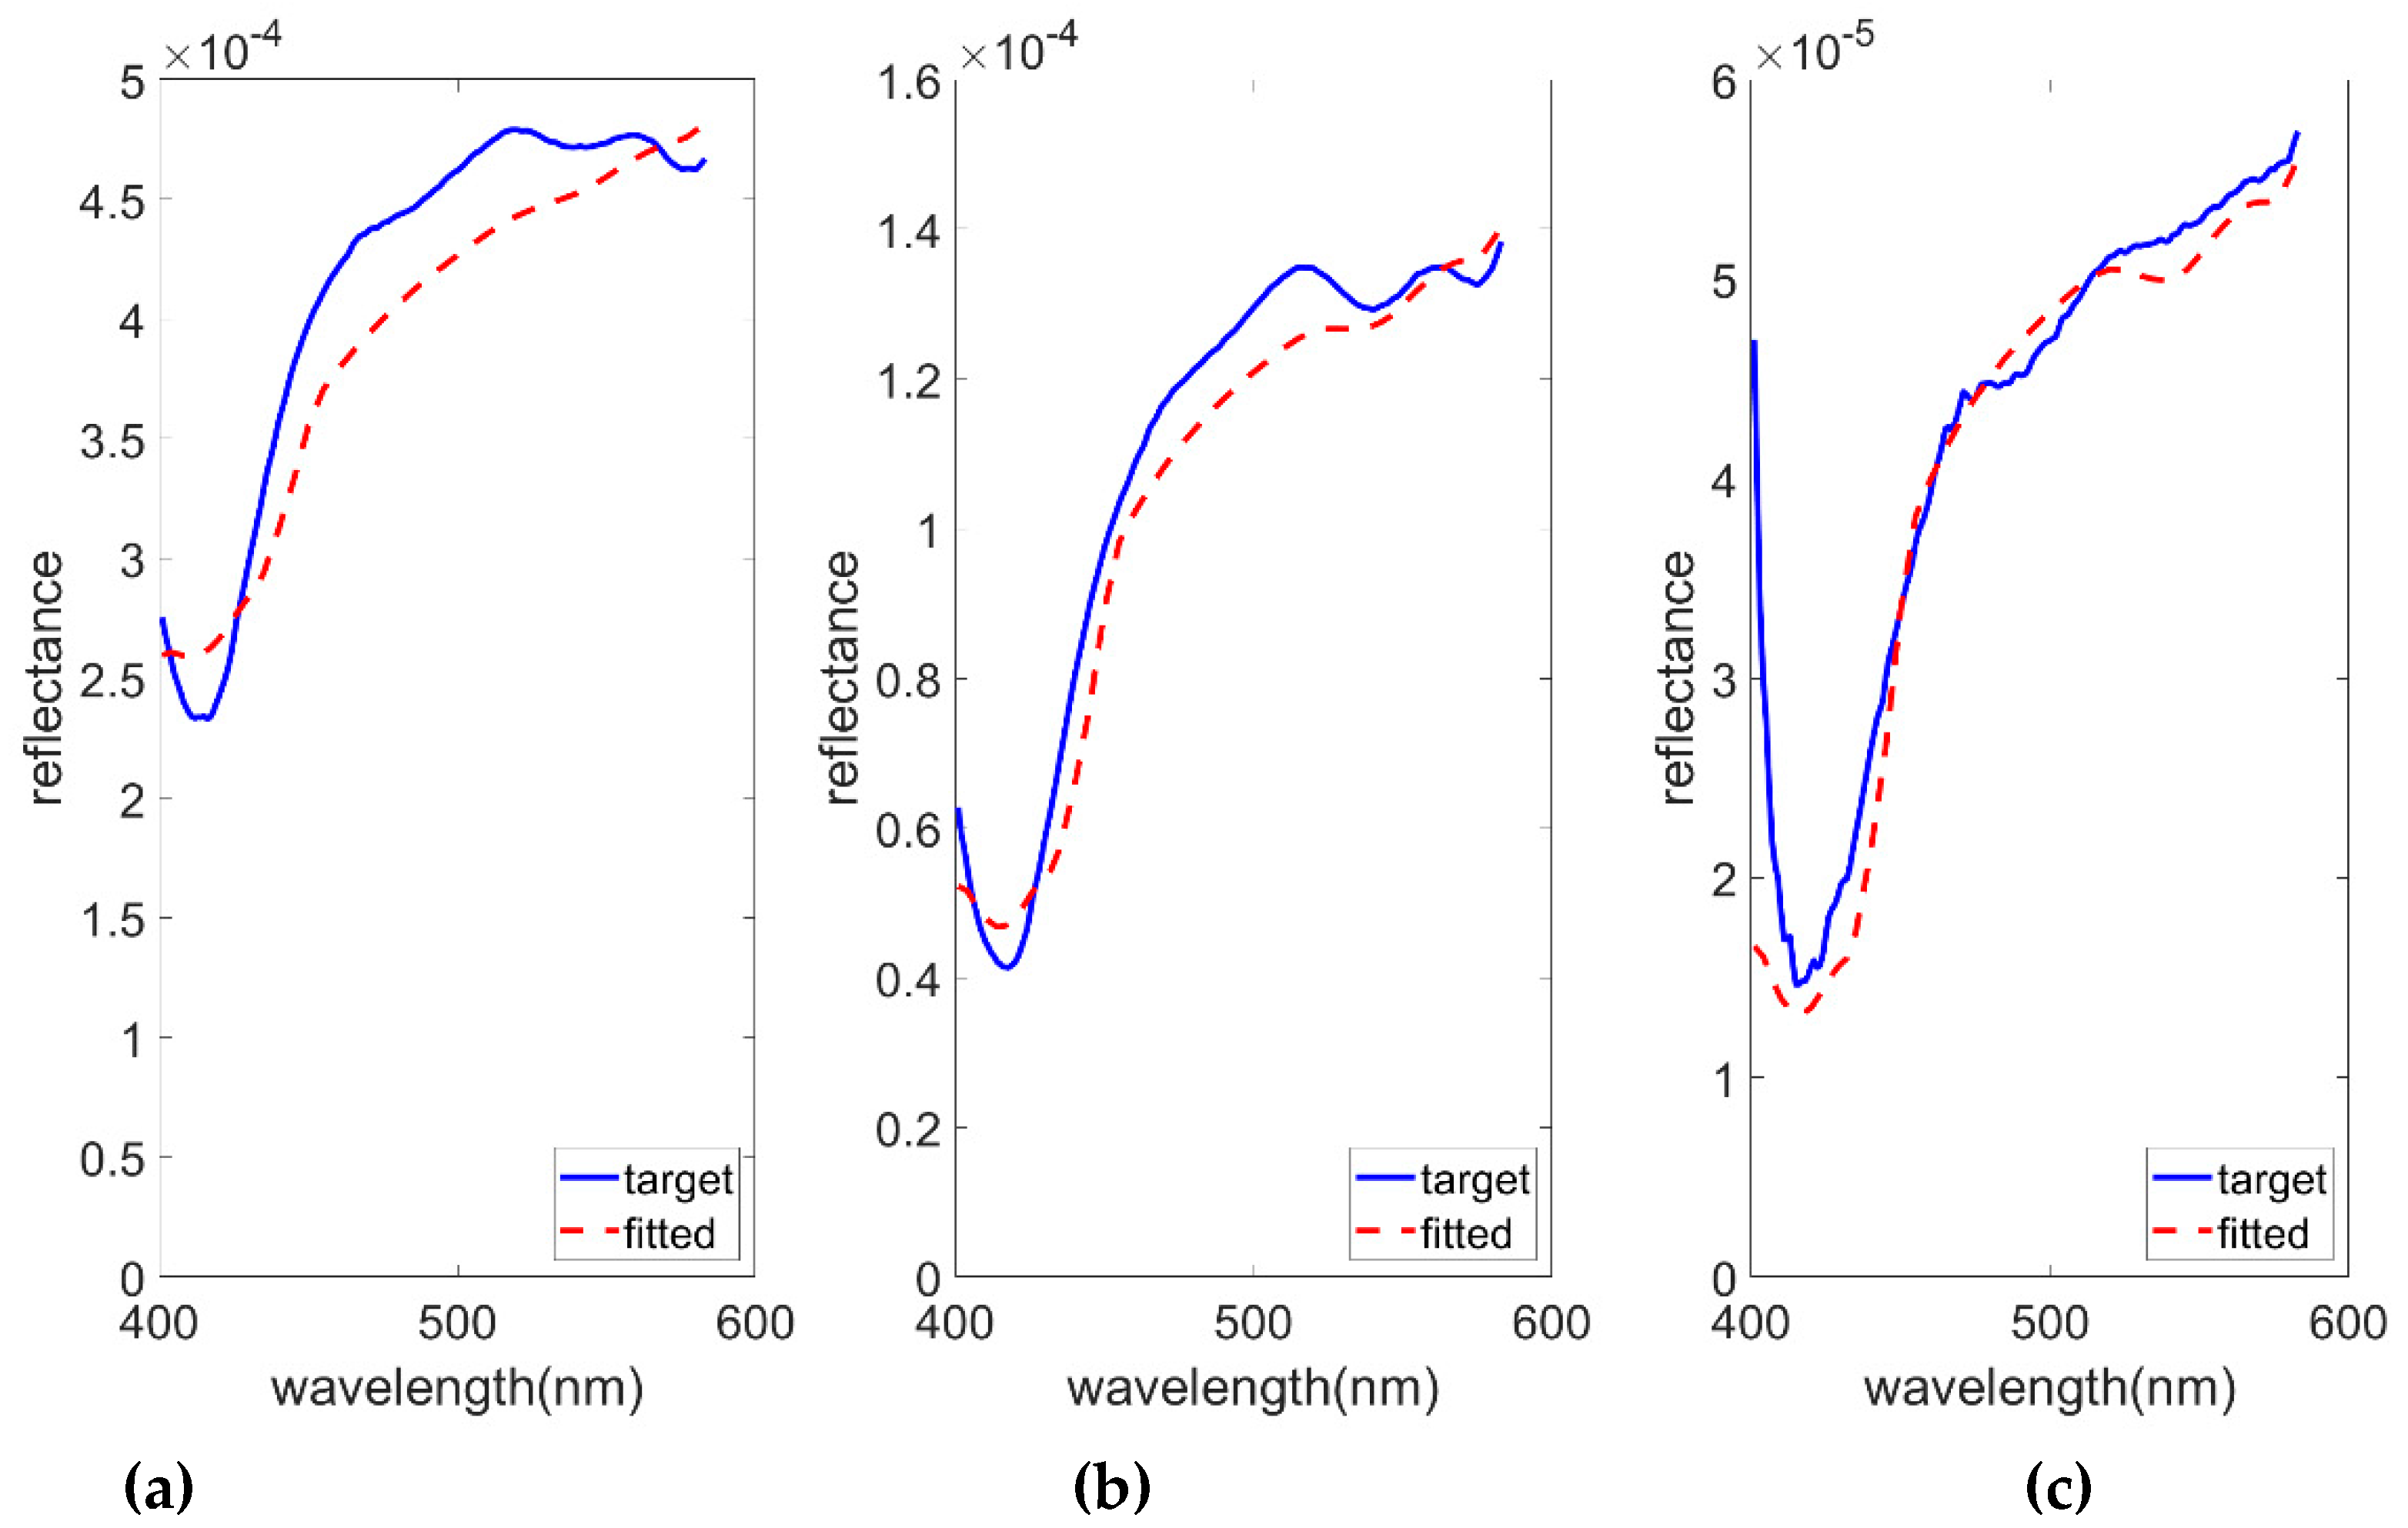
3.2. Inverse Fitting of Simulated SRDRS Data with Various Fitting Procedures

Table 2 summarizes errors in tissue geometric and optical parameters extracted from the 40 sets of simulated spectra using the six combinations of inverse fitting procedures. When extracting fmel × th2, μs2′ and th1 + th2 from simulated target spectra, we found cases where values of extracted parameters were different among the three fitting trials with different initial parameter sets and the optimal result could not be decided because the differences in their rmse values were within the variance of MC simulations. Such multiple-solution situations occurred in 5% of the simulated target spectra when we attempted to extract fmel × th2, and 25–50% of the targets when extracting μs2′ and th1 + th2. When we encountered multiple solutions, we calculated the error in the estimated parameter of each of the multiple solutions and took the average of the absolute value of these errors to represent the error of the case.
Firstly, we compared the accuracy of estimating the parameters using scenario A (without knowing the epidermis thickness) and scenario B (epidermis thickness was known). It can be seen that the errors in fmel × th2 estimated by the inverse fitting procedure YA were significantly lower than those by YB, with a p-value of 0.0216. The errors in blood-related parameters of the skin, including fblood and StO2 were both comparable between the two fitting scenarios. The results indicate that it is not necessary to know the epidermis thickness in order to estimate the parameters related to skin chromophores using the proposed tissue model and inverse fitting method. Since scenario A is much easier to implement than scenario B without the need of any additional instrument to measure the epidermis thickness, we then compared the performance between procedures YA and ZA. Procedure YA showed lower errors in estimated fblood (p = 0.06) and fmel × th2 (p = 0.004) than procedure ZA. Errors in estimated StO2 using the two procedures were similar. The inverse fitting results of the skin chromophore parameters using procedure YA are plotted in Figure 4. If one wishes to get optimal quantification of hemoglobin concentration and melanin absorption, the inverse fitting procedure YA is recommended. In the first part of procedure Y, only spectra in hemoglobin absorption bands of 410–440 nm and 530–580 nm are considered. Therefore, the sensitivity to hemoglobin absorption is expected to be increased compared to procedure Z where the full spectra are fitted without spectral specificity [21].

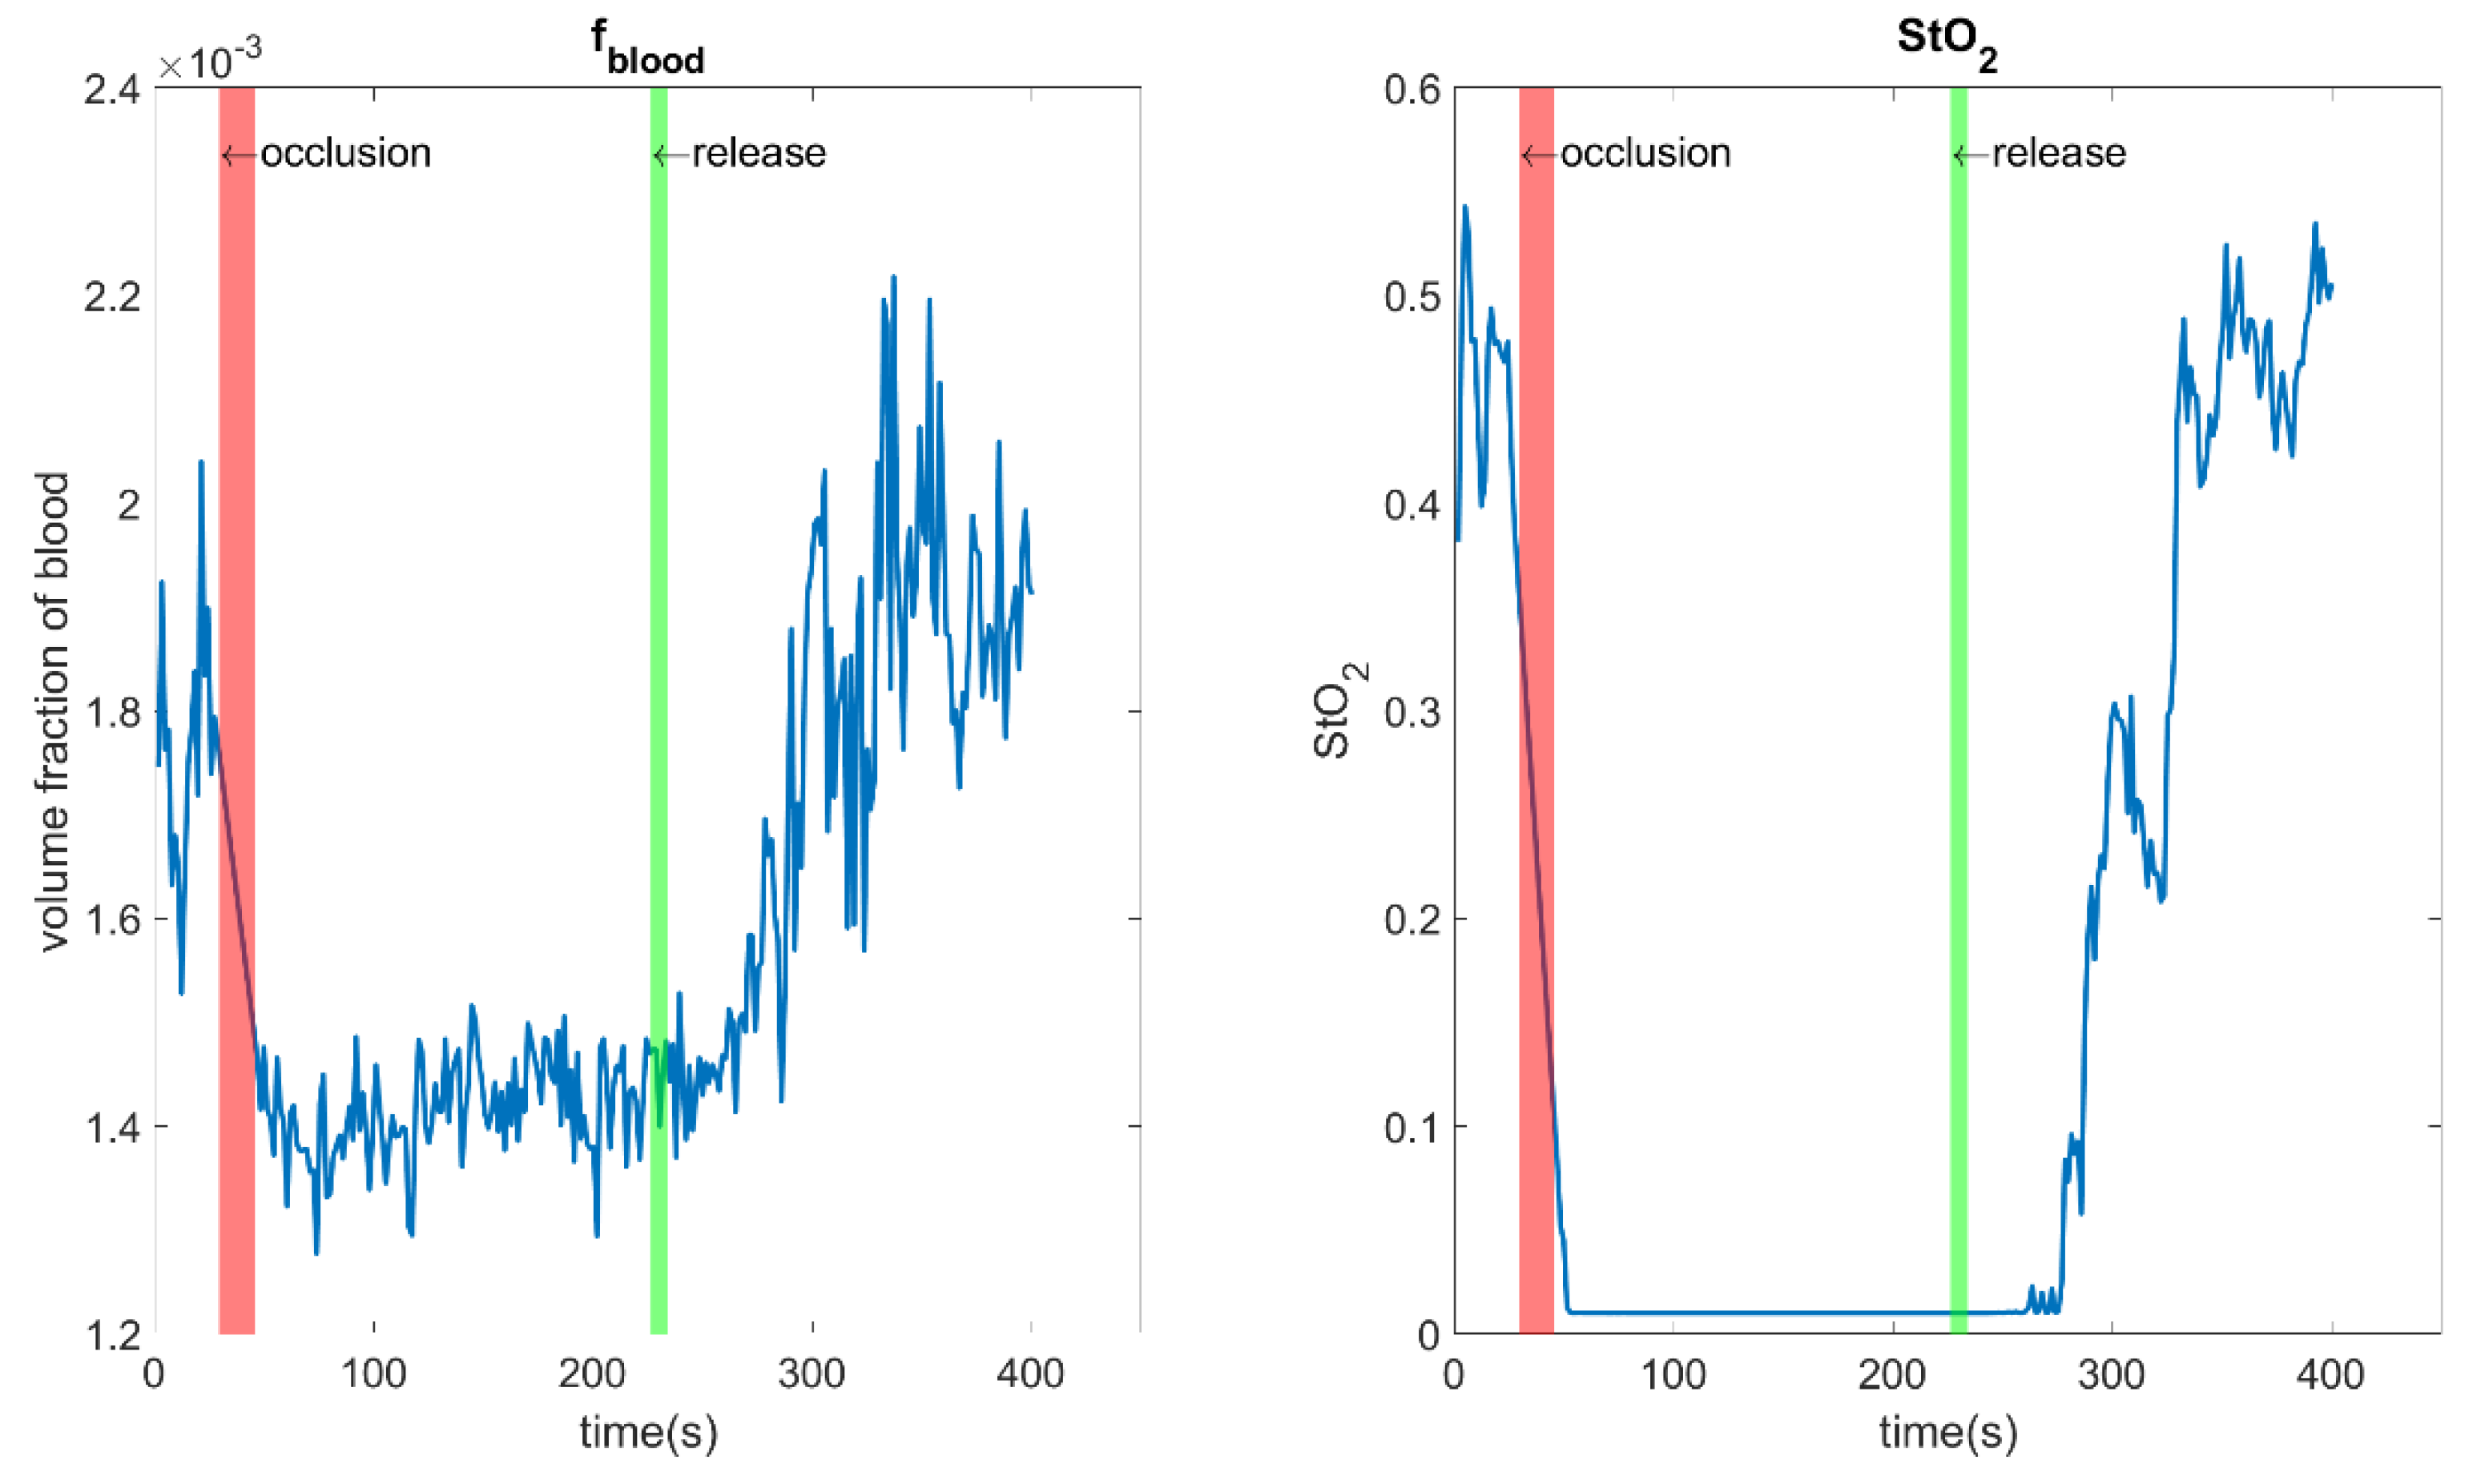
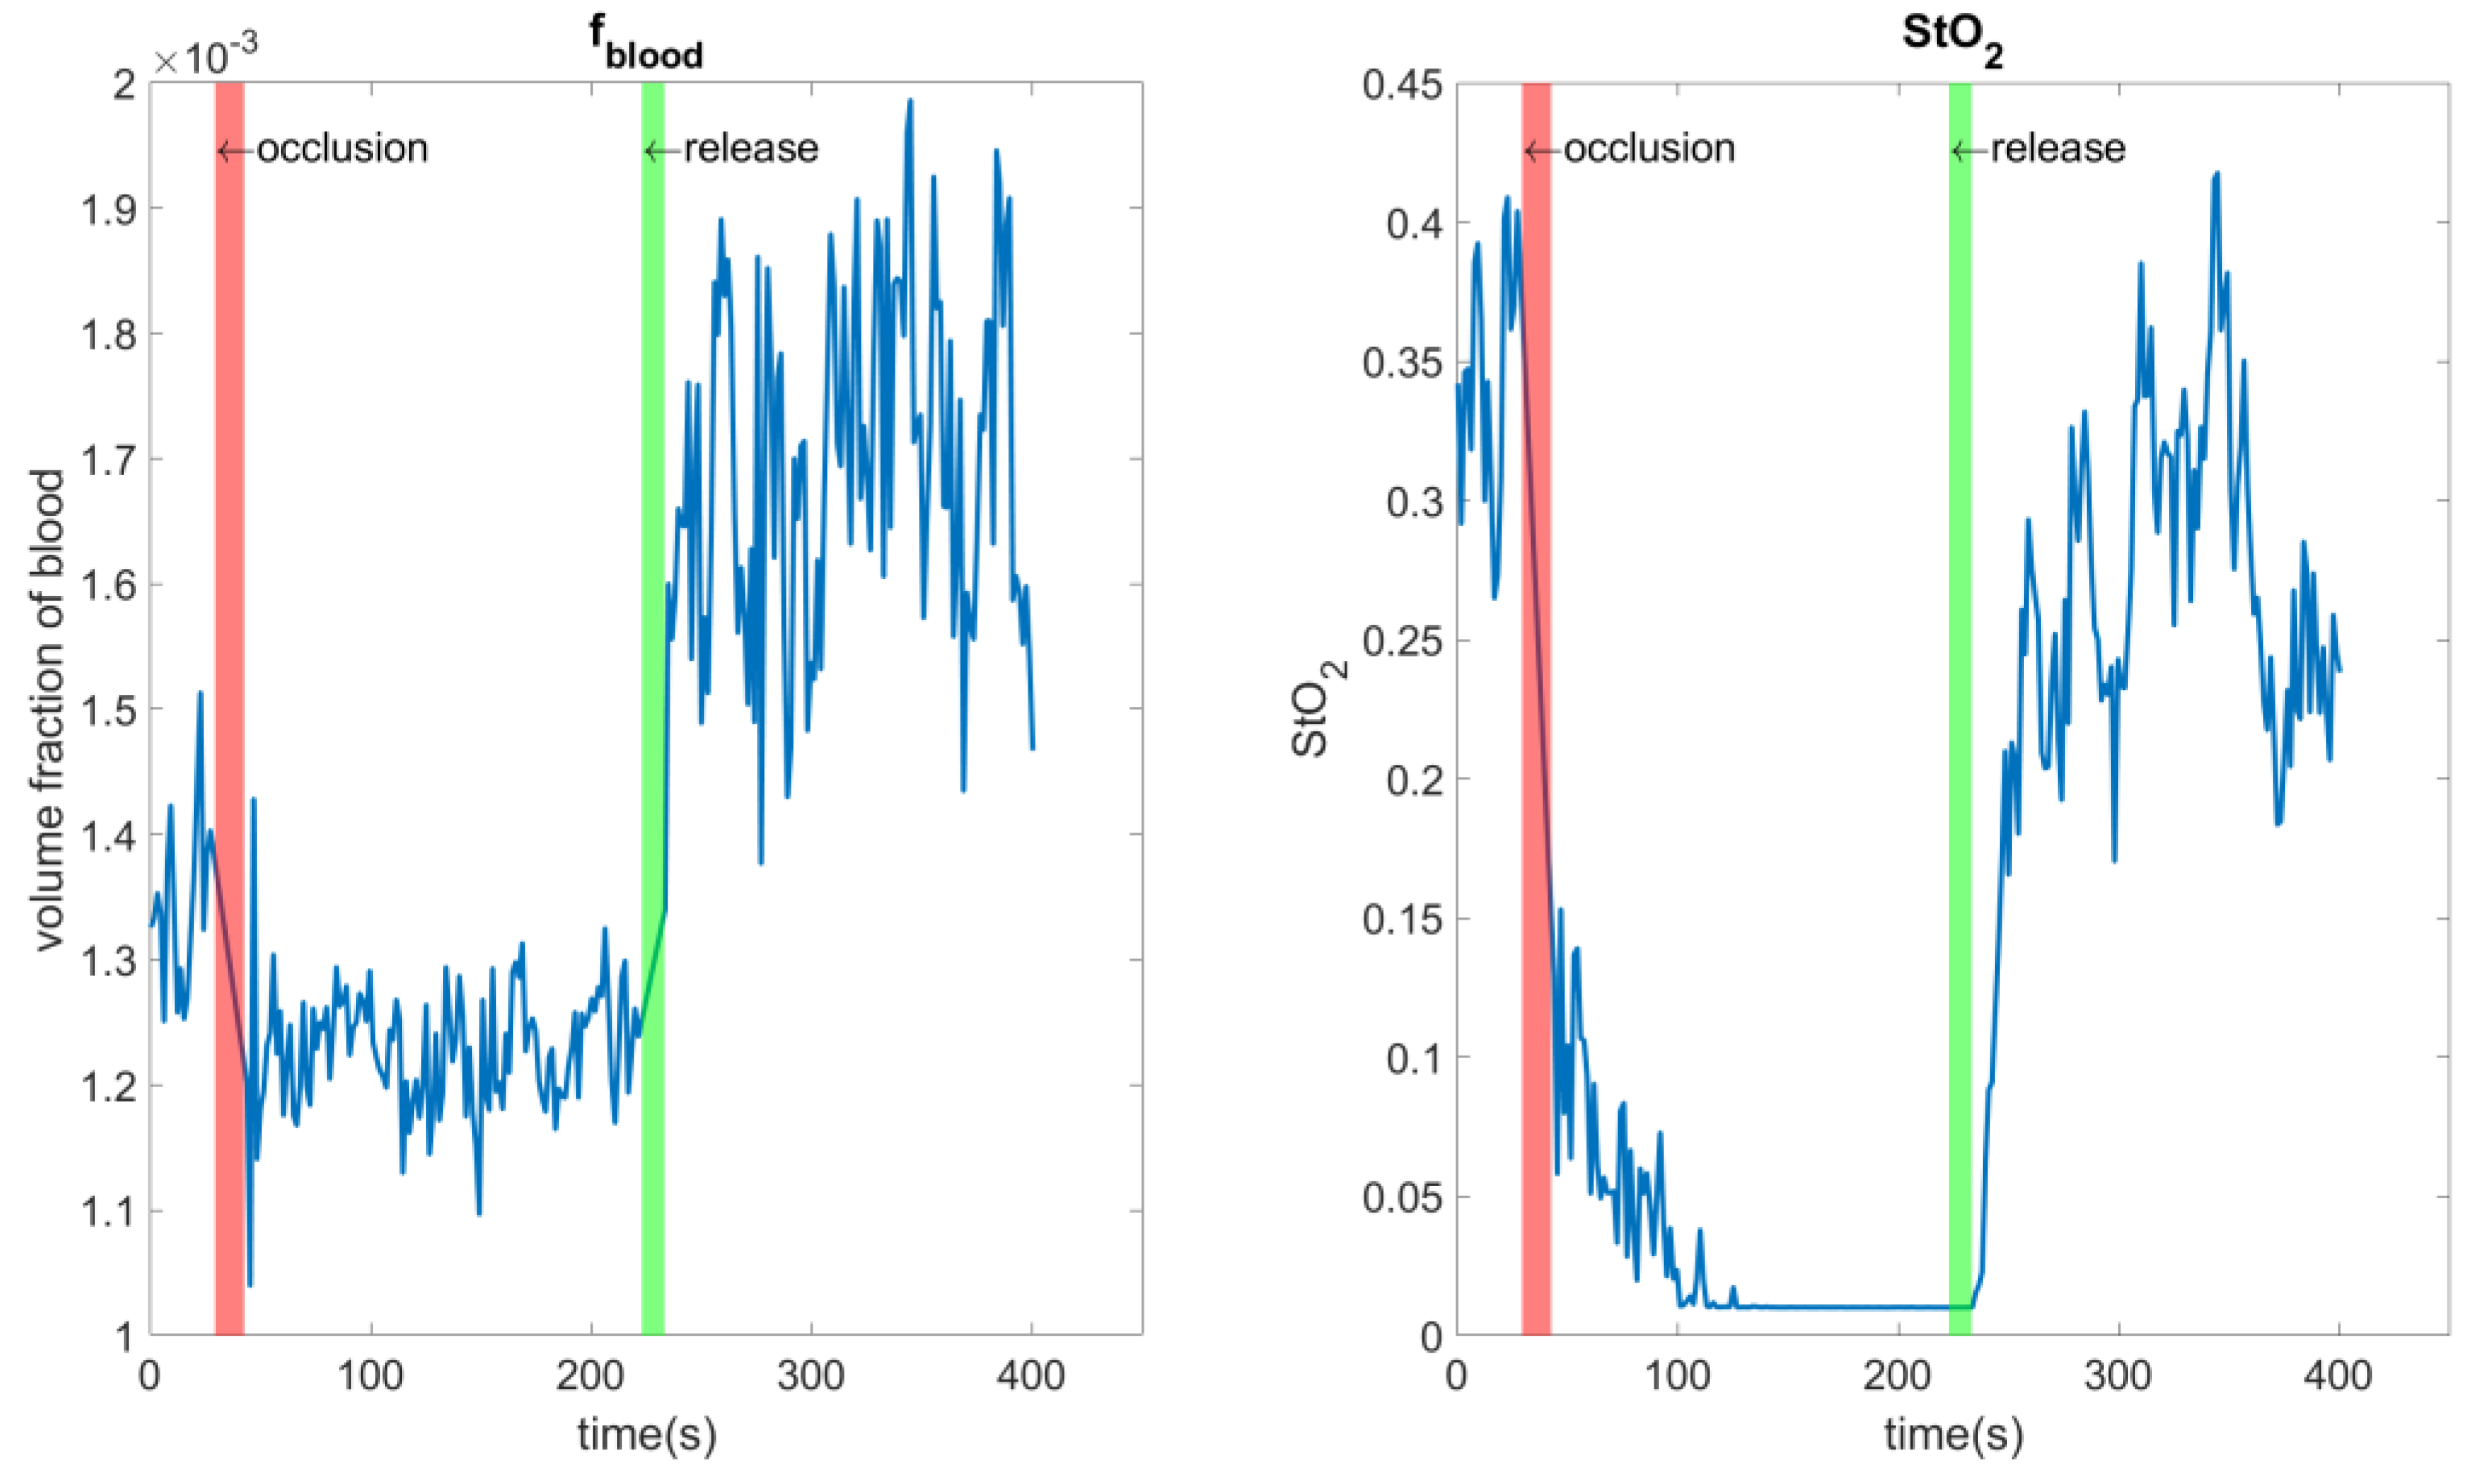
3.3. In-Vivo Cuff Occlusion Experiment Results

In-vivo reflectance spectra were measured from six healthy subjects undergoing both arterial occlusion and venous occlusion. All spectra were fitted using the YA inverse procedure according to the superior performance of procedure YA on simulated spectra. One example of in-vivo spectra and the best fitting spectra obtained by the inverse fitting procedure is shown in Figure 5. Before applying any pressure to the upper arm of one of the subjects during the arterial or the venous occlusion experiment, we acquired 20 baseline in-vivo spectra and extracted tissue parameters using the inverse procedure YA. The coefficient of variance (CV) of fblood over the 20 baseline measurements was 11% and 7% and the standard deviation of StO2 was 6% and 4% in the arterial and the venous occlusion experiment, respectively. The CVs of fmel, th1, th2, epidermis thickness (th1 + th2) and fmel × th2 were all below 5%, indicating a high level of stability of both baseline measurements and the inverse fitting procedure. Moreover, the extracted th1 + th2 were 60.3 ± 1.3 µm and 60.5 ± 0.9 µm in the arterial and venous occlusion experiments, respectively. These numbers are close to the epidermis thickness of 62.9 µm measured by a custom-built optical coherence tomography system. Since the thickness of the epidermis layer and the melanin density were highly stable in baseline measurements and not expected to change during the occlusions, we calculated the average values of fmel, th1 and th2 extracted from the baseline measurements and used them in the YA inverse procedure to estimate fblood and StO2 values during and after the occlusion periods.
Example results of extracted fblood and StO2 in the arterial occlusion and the venous occlusion experiment are shown in Figure 6 and Figure 7, respectively. Although there are some fluctuations in the curves of fblood and StO2 which are likely caused by motion artifacts, fblood and StO2 during the occlusions apparently deviated from the baseline and the deviations were much larger than standard deviations during the baselines. The decreases in StO2 during both occlusions are similar to results reported in previous studies [33,37,38,39,40], and are expected because tissue consumes oxygen and no oxygenated blood is supplied under the occlusions. We observed that fblood decreased slightly during both arterial and venous occlusions, which are not in agreement with trends often reported [33,35,36,37,40]. This discrepancy might be partly, due to the short SDS used in the current SRDRS system that is more sensitive to the micro-circulation in the superficial dermis. After the cuff pressure was released both fblood and StO2 returned to baseline values. The results seem to follow reasonably well the expected physiological responses of blood vessel occlusion.
The geometric and optical parameters estimated from in-vivo SRDRS measurements on the inner forearm of the six healthy Asian volunteers with Fitzpatrick skin type are summarized in Table 3 and Figure 8. Values of fblood, StO2, and epidermis thickness (th1 + th2) were all within known ranges of healthy skin. A comparison to selected previous in-vivo studies [18,19,20,41,42] is summarized in Table 4. Our results seem to be reasonably close to the results of previous studies [18,19,20,41,42].

3.4. Comparison of Inverse Fitting Using One Term or Two Terms in the Inverse Power Law Function of μs′(λ)

The reduced scattering coefficients μs′(λ) are typically modeled to be an inverse power law function of wavelength. In this study a two-term inverse power law function, as shown in Equation (6), was proposed to model μs′(λ). We used the baseline spectra from in-vivo cuff-occlusion experiments to evaluate fitting results between using one term and two terms of the inverse power law function for modeling μs′(λ). The same 40 sets baseline spectra used to generate the results shown in Figure 5, Figure 6 and Figure 7 were used here. The rmse between measured and modeled spectra are 10.28% ± 0.82% and 10.37% ± 0.74%, respectively, for the one-term and two-term inverse power law functions of μs′(λ). The differences in extracted th1, th2, fmel, fmel × th2 and th1 + th2 between the two μs′(λ) models were all smaller than 6%, and differences in extracted fblood and StO2 were below 15%. The results showed that all parameters extracted using two terms of the inverse power law function were similar to those extracted using one term of the inverse power law function.

4. Discussion and Conclusions

The errors in the thickness and scattering coefficient of the epidermal layers are relatively high. This can be understood by the facts that the epidermal layer is very thin (less than 100 μm in thickness) and its scattering is highly forward (g is 0.75 or above). As a result, photons pass through the epidermis without many scattering events and the sensitivity of the SRDRS system to epidermal optical properties and thickness is relatively low. Without special design of the optical probe, such as an oblique orientation [43] or a focusing mechanism [44], the errors in estimated thickness and μs of the epidermis are significantly larger than those in estimated μa and μs of the dermis.
The results of inverse fitting on simulated spectra (Table 2) showed that errors in extracted chromophore information (fblood, StO2, and fmel × th2) by fitting procedure YA (without knowing the epidermis thickness) were no worse than those by fitting procedure YB (knowing the epidermis thickness). Knowing the total thickness of the epidermis did help the extraction of μs’ of the epidermis layers. However, the results showed that knowing the total thickness of the epidermis did not help the extraction of the chromophore information. In DRS it is generally known that the scattering coefficient mainly influences the overall reflectance intensity, while the shape of a reflectance spectrum is mainly determined by the absorption coefficient spectrum. It is speculated that in fitting procedure YA (not knowing the epidermis thickness) the effect of any error in the epidermis thickness could be countered by errors in μs’ of the epidermis, and that their collective effects are on the overall reflectance intensity, but not on the spectral shape. Therefore, not knowing the epidermis thickness would not adversely affect the estimation of the chromophore information.
It is interesting that despite the relatively low sensitivity to the superficial epidermis as discussed above, the quantification of the melanin content can be achieved with an average error of less than 21% using procedure YA. The trick lies in the fact that the melanin content is expressed as melanin volume fraction multiplied by the thickness of the lower epidermis which is the only layer assumed to contain melanin. The melanin volume fraction is proportional to the melanin concentration and approximately proportional to μa of the lower epidermis layer. The product of μa and the thickness of the layer would be similar to optical density which is commonly used to quantify the attenuation of light passing through a clear sample. To support the idea of using fmel × th2 as a surrogate to assess the melanin absorption in the skin, we plotted fmel × th2 against in-vivo reflectance values measured from SDS = 0.22 mm and λ = 500 nm, where the total absorption, due to the blood, is relatively small. As shown in Figure 9, fmel × th2 is negatively correlated to the reflectance values with a high coefficient of correlation r = 0.91 A similar concept has been proposed in a previous study [19] where the optical thickness instead of the physical thickness of the epidermis was estimated. The result suggests that the quantity fmel × th2 estimated by the proposed inverse method and SRDRS system is suitable to estimate the amount of light absorbed by melanin. Its performance to quantify the skin color in vivo needs to be evaluated by further studies.
This study aimed to use spatially-resolved diffuse reflectance spectroscopy to quantify geometric and optical properties of the skin in vivo. An inverse fitting method based on F-ANN trained with MC simulations was proposed and its performance was evaluated on simulated spectra. The results of comparing the inverse fitting without knowing the epidermis thickness and that with known epidermis thickness showed the former achieved similar or better accuracy in extracted chromophore information (fblood, StO2, and fmel × th2). This provides a huge improvement over a previous study [20], since SRDRS can be used alone without the need to know the epidermis thickness. The absorption due to melanin in the skin was quantified by the product of melanin volume fraction and the thickness of the epidermis layer containing melanin (fmel × th2) instead of using the melanin volume fraction directly, because the former is better suited to represent the total amount of melanin per unit area of skin. The results of in-vivo measurements on six healthy volunteers showed high stability in extracted optical properties whose values were similar to those reported in previous studies. In addition, arterial and venous occlusion experiments on one healthy volunteer showed trends in changes of StO2 consistent with physiological expectations. These results support the applicability of the proposed inverse model and SRDRS system to quantify in vivo optical properties related to major chromophores in the skin. Further in vivo studies on more subjects are needed to improve, fully characterize the proposed SRDRS system and inverse methodology, and ultimately to establish a practical tool for quantifying hemoglobin and melanin absorption in the skin in vivo.

Author Contributions

Conceptualization, K.-B.S.; Methodology, K.-B.S., C.-Y.W. and T.-C.K.; Software, C.-Y.W. and T.-C.K.; Validation, K.-B.S., C.-Y.W. and T.-C.K.; Formal Analysis, C.-Y.W. and T.-C.K.; Resources, K.-B.S.; Data Curation, C.-Y.W., T.-C.K., Y.-F.C., W.-W.S. and H.-J.S.; Writing—Original Draft Preparation, C.-Y.W. and T.-C.K.; Writing—Review and Editing, K.-B.S.; Visualization, K.-B.S., C.-Y.W. and T.-C.K.; Supervision, K.-B.S.; Project Administration, K.-B.S.; Funding Acquisition, K.-B.S.

Funding

This research was funded by the Ministry of Science and Technology (MOST), Taiwan, grant number 105-2221-E-002-068-MY3 and Molecular Image Center, National Taiwan University.

Acknowledgments

The authors thank Hsiang-Chieh Lee, Assistant professor of the Graduate Institute of Photonics and Optoelectronics, National Taiwan University and his lab for the OCT measurements.

Conflicts of Interest

The authors declare no conflict of interest. The funders had no role in the design of the study; in the collection, analyses, or interpretation of data; in the writing of the manuscript, and in the decision to publish the results.

References

  1. Bigio, I.J.; Mourant, J.R. Ultraviolet and visible spectroscopies for tissue diagnostics: Fluorescence spectroscopy and elastic-scattering spectroscopy. Phys. Med. Biol. 1997, 42, 803–814. [Google Scholar] [CrossRef] [PubMed]
  2. Utzinger, U.; Richards-Kortum, R.R. Fiber optic probes for biomedical optical spectroscopy. J. Biomed. Opt. 2003, 8, 121–147. [Google Scholar] [CrossRef]
  3. Bigio, I.J.; Bown, S.G. Spectroscopic sensing of cancer and cancer therapy: Current status of translational research. Cancer Biol. Ther. 2004, 3, 259–267. [Google Scholar] [CrossRef]
  4. Zonios, G.; Dimou, A.; Bassukas, I.; Galaris, D.; Tsolakidis, A.; Kaxiras, E. Melanin absorption spectroscopy: New method for noninvasive skin investigation and melanoma detection. J. Biomed. Opt. 2008, 13, 014017. [Google Scholar] [CrossRef] [PubMed]
  5. Tuchin, V.V. Tissue Optics: Light Scattering Methods and Instruments for Medical Diagnosis; SPIE: Bellingham, WA, USA, 2015. [Google Scholar]
  6. Groenhuis, R.A.J.; Ferwerda, H.A.; Bosch, J.J.T. Scattering and absorption of turbid materials determined from reflection measurements. 1: Theory. Appl. Opt. 1983, 22, 2456–2462. [Google Scholar] [CrossRef] [PubMed]
  7. Wang, L.; Jacques, S.L.; Zheng, L. MCML–Monte Carlo modeling of light transport in multi-layered tissues. Comput. Methods Programs Biomed. 1995, 47, 131–146. [Google Scholar] [CrossRef]
  8. Zhu, C.; Liu, Q. Review of Monte Carlo modeling of light transport in tissues. J. Biomed. Opt. 2013, 18, 50902. [Google Scholar] [CrossRef] [PubMed]
  9. Kienle, A.; Patterson, M.S. Determination of the optical properties of turbid media from a single Monte Carlo simulation. Phys. Med. Biol. 1996, 41, 2221. [Google Scholar] [CrossRef] [PubMed]
  10. Yudovsky, D.; Pilon, L. Simple and accurate expressions for diffuse reflectance of semi-infinite and two-layer absorbing and scattering media. Appl. Opt. 2009, 48, 6670–6683. [Google Scholar] [CrossRef] [Green Version]
  11. Yudovsky, D.; Pilon, L. Rapid and accurate estimation of blood saturation, melanin content, and epidermis thickness from spectral diffuse reflectance. Appl. Opt. 2010, 49, 1707–1719. [Google Scholar] [CrossRef]
  12. Fredriksson, I.; Larsson, M.; Strömberg, T. Inverse Monte Carlo method in a multilayered tissue model for diffuse reflectance spectroscopy. J. Biomed. Opt. 2012, 17, 047004. [Google Scholar] [CrossRef] [PubMed]
  13. Yudovsky, D.; Laurent, P. Retrieving skin properties from in vivo spectral reflectance measurements. J. Biophotonics 2011, 4, 305–314. [Google Scholar] [CrossRef]
  14. Nishidate, I.; Aizu, Y.; Mishina, H. Estimation of melanin and hemoglobin in skin tissue using multiple regression analysis aided by Monte Carlo simulation. J. Biomed. Opt. 2004, 9, 700–711. [Google Scholar] [CrossRef] [PubMed]
  15. Zhong, X.; Wen, X.; Zhu, D. Lookup-table-based inverse model for human skin reflectance spectroscopy: Two-layered Monte Carlo simulations and experiments. Opt. Express 2014, 22, 1852–1864. [Google Scholar] [CrossRef] [PubMed]
  16. Sharma, M.; Hennessy, R.; Markey, M.K.; Tunnell, J.W. Verification of a two-layer inverse Monte Carlo absorption model using multiple source-detector separation diffuse reflectance spectroscopy. Biomed. Opt. Express 2014, 5, 40–53. [Google Scholar] [CrossRef]
  17. Wang, Q.; Le, D.; Ramella-Roman, J.; Pfefer, J. Broadband ultraviolet-visible optical property measurement in layered turbid media. Biomed. Opt. Express 2012, 3, 1226–1240. [Google Scholar] [CrossRef]
  18. Yudovsky, D.; Durkin, A.J. Spatial frequency domain spectroscopy of two layer media. J. Biomed. Opt. 2011, 16, 107005. [Google Scholar] [CrossRef]
  19. Yudovsky, D.; Nguyen, J.Q.; Durkin, A.J. In Vivo spatial frequency domain spectroscopy of two layer media. J. Biomed. Opt. 2012, 17, 107006. [Google Scholar] [CrossRef]
  20. Tsui, S.-Y.; Wang, C.-Y.; Huang, T.-H.; Sung, K.-B. Modelling spatially-resolved diffuse reflectance spectra of a multi-layered skin model by artificial neural networks trained with Monte Carlo simulations. Biomed. Opt. Express 2018, 9, 1531–1544. [Google Scholar] [CrossRef] [Green Version]
  21. Hsieh, H.-P.; Ko, F.-H.; Sung, K.-B. Hybrid method to estimate two-layered superficial tissue optical properties from simulated data of diffuse reflectance spectroscopy. Appl. Opt. 2018, 57, 3038–3046. [Google Scholar] [CrossRef]
  22. Doronin, A.; Meglinski, I.; Bykov, A.V.; Rushmeier, H. Determination of human skin optical properties from hyper spectral data with deep-learning neural networks (conference presentation). In Optical Biopsy XVI: Toward Real-Time Spectroscopic Imaging and Diagnosis; International Society for Optics and Photonics: Bellingham, WA, USA, 2018; Volume 10489. [Google Scholar]
  23. Qu, J.; MacAulay, C.; Lam, S.; Palcic, B. Optical properties of normal and carcinomatous bronchial tissue. Appl. Opt. 1994, 33, 7397–7405. [Google Scholar] [CrossRef] [PubMed]
  24. Jacques, S.L.; McAuliffe, D.J. The melanosome: Threshold temperature for explosive vaporization and internal absorption coefficient during pulsed laser irradiation. Photochem. Photobiol. 1991, 53, 769–775. [Google Scholar] [CrossRef] [PubMed]
  25. Jacques, S.L. Optical properties of biological tissues: A review. Phys. Med. Biol. 2013, 58, R37. [Google Scholar] [CrossRef]
  26. Buiteveld, H.; Hakvoort, J.; Donze, M. Optical Properties of Pure Water. In Ocean Optics XII; International Society for Optics and Photonics: Bellingham, WA, USA, 1994. [Google Scholar]
  27. Nunez, A.S. A Physical Model of Human Skin and Its Application for Search and Rescue; Air Force Inst of Tech Wright-Patterson Afb oh School of Engineering: Greene County, OH, USA, 2009. [Google Scholar]
  28. Prahl, S. Optical Absorption of Hemoglobin. Available online: http://omlc.ogi.edu/spectra/hemoglobin/hemestruct/index.html (accessed on 8 January 2018).
  29. Bashkatov, A.N.; Genina, E.A.; Tuchin, V.V. Optical properties of skin, subcutaneous, and muscle tissues: A review. J. Innov. Opt. Health Sci. 2011, 4, 9–38. [Google Scholar] [CrossRef]
  30. Su, J.-W.; Hsu, W.-C.; Tjiu, J.-V.; Chiang, C.-P.; Huang, C.-W.; Sung, K.B. Investigation of influences of the paraformaldehyde fixation and paraffin embedding removal process on refractive indices and scattering properties of epithelial cells. J. Biomed. Opt. 2014, 19, 075007. [Google Scholar] [CrossRef]
  31. Alerstam, E.; Tomas, S.; Stefan, A.-E. Parallel computing with graphics processing units for high-speed Monte Carlo simulation of photon migration. J. Biomed. Opt. 2008, 13, 060504. [Google Scholar] [CrossRef]
  32. Chopra, K.; Calva, D.; Sosin, M.; Tadisina, K.K.; Banda, A.; De La Cruz, C.; Chaudhry, M.R.; Legesse, T.; Drachenberg, C.B.; Manson, P.N.; et al. A comprehensive examination of topographic thickness of skin in the human face. Aesthet. Surg. J. 2015, 35, 1007–1013. [Google Scholar] [CrossRef]
  33. Broxterman, R.M.; Ade, C.J.; Craig, J.C.; Wilcox, S.L.; Schlup, S.J.; Barstow, T.J. Influence of blood flow occlusion on muscle oxygenation characteristics and the parameters of the power-duration relationship. J. Appl. Physiol. 2015, 118, 880–889. [Google Scholar] [CrossRef] [Green Version]
  34. Martelli, F.; Del Bianco, S.; Zaccanti, G.; Pifferi, A.; Torricelli, A.; Bassi, A.; Taroni, P.; Cubeddu, R. Phantom validation and in vivo application of an inversion procedure for retrieving the optical properties of diffusive layered media from time-resolved reflectance measurements. Opt. Lett. 2004, 29, 2037–2039. [Google Scholar] [CrossRef]
  35. Abay, T.Y.; Kyriacou, P.A. Photoplethysmography for blood volumes and oxygenation changes during intermittent vascular occlusions. J. Clin. Monit. Comput. 2018, 32, 447–455. [Google Scholar] [CrossRef]
  36. Abay, T.Y.; Kyriacou, P.A. Reflectance photoplethysmography as noninvasive monitoring of tissue blood perfusion. IEEE Trans. Biomed. Eng. 2015, 62, 2187–2195. [Google Scholar] [CrossRef]
  37. Chatterjee, S.; Abay, T.Y.; Phillips, J.P.; Kyriacou, P.A. Investigating optical path and differential pathlength factor in reflectance photoplethysmography for the assessment of perfusion. J. Biomed. Opt. 2018, 23, 075005. [Google Scholar] [CrossRef]
  38. Tuncali, B.; Boya, H.; Kayhan, Z.; Arac, S. Tourniquet pressure settings based on limb occlusion pressure determination or arterial occlusion pressure estimation in total knee arthroplasty? A prospective, randomized, double blind trial. Acta Orthopaedica et Traumatologica Turcica 2018, 52, 256–260. [Google Scholar] [CrossRef]
  39. Sung, K.B.; Shih, K.W.; Hsu, F.W.; Hsieh, H.P.; Chuang, M.J.; Hsiao, Y.H.; Su, Y.H.; Tien, G.H. Accurate extraction of optical properties and top layer thickness of two-layered mucosal tissue phantoms from spatially resolved reflectance spectra. J. Biomed. Opt. 2014, 19, 077002. [Google Scholar] [CrossRef]
  40. Suzuki, S.; Takasaki, S.; Ozaki, T.; Kobayashi, Y. Tissue oxygenation monitor using NIR spatially resolved spectroscopy. In Optical Tomography and Spectroscopy of Tissue III; International Society for Optics and Photonics: Bellingham, WA, USA, 1999; Volume 3597. [Google Scholar]
  41. Jonasson, H.; Fredriksson, I.; Bergstrand, S.; Östgren, C.J.; Larsson, M.; Strömberg, T. In Vivo characterization of light scattering properties of human skin in the 475- to 850-nm wavelength range in a Swedish cohort. J. Biomed. Opt. 2018, 23, 121608. [Google Scholar] [CrossRef]
  42. Strömberg, T.; Sjöberg, F.; Bergstrand, S. Temporal and spatiotemporal variability in comprehensive forearm skin microcirculation assessment during occlusion protocols. Microvasc. Res. 2017, 113, 50–55. [Google Scholar] [CrossRef] [PubMed]
  43. Sung, K.-B.; Chen, H.-H. Enhancing the sensitivity to scattering coefficient of the epithelium in a two-layered tissue model by oblique optical fibers: Monte Carlo study. J. Biomed. Opt. 2012, 17, 107003. [Google Scholar] [CrossRef] [PubMed]
  44. Schwarz, R.A.; Arifler, D.; Chang, S.K.; Pavlova, I.; Hussain, I.A.; Mack, V.; Knight, B.; Richards-Kortum, R.; Gillenwater, A.M. Ball lens coupled fiber-optic probe for depth-resolved spectroscopy of epithelial tissue. Opt. Lett. 2005, 30, 1159–1161. [Google Scholar] [CrossRef] [Green Version]
Figure 1. Schematic diagram of the experimental system.
Photonics 06 00061 g001
Figure 2. The absorption coefficient spectrum of pure collagen [26].
Photonics 06 00061 g002
Figure 3. Learning curves of training the ANN model for (a) SDS = 0.22 mm, (b) SDS = 0.45 mm and (c) SDS = 0.73 mm, respectively. The green circles indicate the epochs number of best validation performance where the validation loss is the lowest.
Photonics 06 00061 g003aPhotonics 06 00061 g003b
Figure 4. Comparisons between extracted values and true values of (a) fblood, (b) StO2, and (c) fmel × th2 from 40 sets of simulated target spectra using fitting condition YA. The red lines indicate when the extracted and true values are identical.
Photonics 06 00061 g004aPhotonics 06 00061 g004b
Figure 5. Example of fitted spectra and target in-vivo spectra measured from detection fibers located at SDS equal to (a) 0.22 mm, (b) 0.45 mm, and (c) 0.73 mm.
Photonics 06 00061 g005
Figure 6. Extracted fblood and StO2 during the arterial occlusion experiment.
Photonics 06 00061 g006
Figure 7. Extracted fblood and StO2 during the venous occlusion experiment.
Photonics 06 00061 g007
Figure 8. Extracted (a) μs2 (b) μs3 of in-vivo inner forearm skin of healthy volunteers.
Photonics 06 00061 g008aPhotonics 06 00061 g008b
Figure 9. Log of reflectance of SDS 0.22 mm on 500 nm vs. fmel × th2.
Photonics 06 00061 g009
Table 1. Ranges of parameters used to generate the reflectance database.
thx (μm)μax (cm−1)μsx (cm−1)gx
Upper epidermis (x = 1)10–600.1–5.0fixed at 1.3 × μs20.835
Lower epidermis (x = 2)10–601–35010–7000.75
Dermis (x = 3)Inf0.01–1610–5000.715
Table 2. Average absolute value and standard deviation (in parentheses) of errors in extracted tissue geometric and optical parameters using the six combinations of inverse fitting procedures.
Inverse ProcedurefbloodStO2fmel × th2μs2μs3th1 + th2
YA5.3% (5.4%)10.1% (16.3%)20.4% (28.5%)43.1% (33.4%)1.9% (2.1%)34.8% (52.4%)
ZA6.3% (4.5%)10.1% (16.5%)25.3% (29.7%)46.2% (29.0%)1.6% (1.2%)35.6% (47.9%)
YB6.1% (5.9%)10.1% (16.1%)23.4% (28.8%)28.5% (24.5%)2.4% (2.2%)
ZB7.1% (5.6%)9.9% (16.0%)28.4% (38.7%)18.3% (18.1%)1.9% (1.1%)
Table 3. Extracted geometric and optical parameters of the in-vivo inner forearm of five healthy volunteers.
EnderAgefbloodStO2fmel × th2 (μm)th1 (μm)th2 (μm)
subject 1Male230.129%99%0.80427.148.1
subject 2Male230.217%62%1.63017.946.5
subject 3Male230.284%54%1.05935.845.3
subject 4Female230.244%37%0.22339.018.9
subject 5Male230.140%99%3.84610.436.9
subject 6Male450.155%40%1.36012.547.8
Table 4. The comparison of optical parameters estimated from this study to those from in-vivo studies reported in the literature.
ReferencefbloodStO2fmelμs2μs3
[18]0.78–2.06%34–64%4.8–24%--
[19]0.23–0.35%51.6–60.3%11–16%--
[20]0.14–0.27%84–100%7.6–17.2%12.5–200 cm−15.7–57 cm−1
[43]---10–40 cm−110–40 cm−1
[44]1.74247%---
This study0.09–0.28%37–99%1.3–10%5–180 cm−126–36 cm−1

