Article

Temporal Distribution Measurement of the Parametric Spectral Gain in a Photonic Crystal Fiber Pumped by a Chirped Pulse

1
Institut FEMTO-ST, Département d’Optique, UMR 6174 CNRS-Université Bourgogne Franche-Comté, 25030 Besançon, France
2
Université Limoges, CNRS, XLIM, UMR 7252, F-87000 Limoges, France
3
FYLA LASER SL, Ronda Guglielmo Marconi 12, 46980 Paterna (Valencia), Spain
*
Author to whom correspondence should be addressed.
Photonics 2019, 6(1), 20; https://doi.org/10.3390/photonics6010020
Submission received: 30 January 2019 / Revised: 20 February 2019 / Accepted: 21 February 2019 / Published: 26 February 2019

Abstract

:
The temporal distribution of the spectral parametric gain was experimentally investigated when a chirped pump pulse was injected into a photonic crystal fiber. A pump-probe experiment was developed and the important characteristics were measured as the chirp of the pump, the signal pulse, and the gain of the parametric amplifier. We highlight that the amplified spectrum depends strongly on the instantaneous pump wavelength and that the temporal evolution of the wavelength at maximum gain is not monotonic. This behavior is significantly different from the case in which the chirped pump has a constant peak power. This measurement will be very important to efficiently include parametric amplifiers in laser systems delivering ultra-short pulses.

1. Introduction

Ultra-fast optical parametric amplification (OPA) has already demonstrated many interesting features relevant for the amplification of ultra-short pulses. It allows one to get a very high gain value and a very large gain bandwidth to amplify pulses with a duration as short as few optical cycles [1]. In addition, as the parametric process is based on an instantaneous nonlinearity, this type of amplification is of prime interest when maintaining or enhancing the temporal contrast [2,3]. Most of the OPA based ultra-fast sources are developed with nonlinear crystals as the amplifier media and they are often reliable enough for most applications [4]. Alternatively, ultra-fast four wave mixing in an optical fiber is a promising step towards the OPA of ultra-short pulses at high gain in a compact and rugged geometry [5,6]. In this case, the ultra-short signal has a very large bandwidth and is firstly stretched before the amplification to decrease the peak power and to limit spurious nonlinearities in the fiber. After the amplification, the signal is recompressed close to its initial pulse duration. The strong pump pulse has a relatively long duration (tens of ps to ns) to match the one of the stretched signals [5,7,8,9]. More recently, several configurations of fiber-based OPA (FOPA) have been performed to amplify a very large spectral width at high gain [10,11,12,13] or a narrower band at high energy in the µJ range [14,15,16]. In particular, we have shown that ultra-broad band parametric amplification at high gain can be obtained by using a single pump stretched pulse with a relatively broad spectrum [10,11]. In this case, the spectral parametric gain is distributed in the temporal domain since the instantaneous frequency of the pump changes quasi-linearly with time due to the chirp rate. Therefore, we can expect to amplify a stretched ultra-short pulse when a broad band signal is simultaneously injected into the optical fiber [12]. However, the instantaneous frequencies of the stretched signal will also change with time and they will need to match the temporal distribution of the spectral gain. In addition, the temporal shape of the pump strongly impacts the parametric gain shape since the gain value and/or the phase matching condition both depend on the instantaneous power injected either into the fiber [16,17] or in a nonlinear crystal [18]. Therefore, it is very important to measure and understand the temporal distribution of this spectral gain in order to design ultra-broad band parametric amplifiers. This feature cannot be measured with a spectrometer that records a time integrated spectrum. Hence, in this manuscript, we present a pump-probe method with stretched pulses to diagnose this distribution. The paper is structured as follows: In Section 2, we present didactic examples to highlight the temporal evolution of the spectral gain when the pump power is not constant during its duration. In Section 3, we describe the experimental set-up. The most important properties were measured as the chirp of the pump, the signal pulse and the parametric fluorescence. The measurement of the parametric gain as a function of the delay between the pump and the probe is discussed in Section 4. We highlight that the amplified spectrum depends strongly on the instantaneous pump wavelength and that the temporal evolution of the wavelength at maximum gain is not monotonic. Finally, we conclude the article in Section 5.

2. Parametric Amplification in Fiber Pumped by a Structured and Chirped Pump Pulse

Parametric amplification of an ultra-short pulse in a fiber relies on phase-matched four wave mixing of a stretched signal with a very large bandwidth, a strong pump pulse with a power P, and a generated idler. In this manuscript, the pump was a chirped pulse. The gain of the signal was at its maximum when all the involved waves were phase-matched according to
κ ( Ω , t ) = β 20 · Ω 2 + β 40 12 · Ω 4 + 2 γ P ( τ ) = 0
with β20 and β40 the second and fourth order dispersion terms at the pump wavelength λp. We neglected higher order terms. Ω is the angular frequency offset from the pump. γ is the nonlinear coefficient of the fiber and is set to 35 W−1 km−1. In order to calculate the phase matching condition (Equation (1)), we considered the photonic crystal fiber (PCF) used in the experiment. From the input facet of the PCF measured with a scanning electron microscope (SEM, inset in Figure 1a), the second order dispersion term as the function of the wavelength was calculated (Figure 1a). The SEM image was first, turned into a two-color image that represented the refractive index map. A mesh was then created from this index map and both effective indices and intensity distributions of electric and magnetic fields were then calculated using a commercial mode solver based on the finite element method. The chromatic dispersion curve was simply deduced from the effective index one, leading to the determination of the zero dispersion wavelength (ZDW) at 1020 nm.
For comparison, we firstly calculated the phase matching condition as a function of λp for a constant peak power of 600 W (Figure 2, magenta solid lines) and 200 W (Figure 2, cyan solid lines). In both cases, the phase matched wavelengths evolved monotonically with λp. Since we aimed to investigate the impact of the pulse shape of a chirped pump, the instantaneous power P was time dependent in the following. For example, the spectral profile of the pump that originates from an ultra-fast laser has usually a Gaussian profile. In our configuration, the pulse was stretched with a linear chirp rate α = τ/(λpλp0), with λp0 as the pump central wavelength. Therefore, the temporal profile also had a Gaussian profile. Figure 1b (black line) displays a spectrum centered at λp0 = 1031 nm with a bandwidth equal to 6 nm at Full Width at Half Maximum (FWHM). The full pump spectrum is lain in the anomalous dispersion regime of the PCF. For α = 6 ps/nm close to the experimental value, the pulse duration was 36 ps. Figure 2 shows the phase matching condition calculated from Equation (1) for the Gaussian pump profile with a maximum power of 600 W (red solid line) and 200 W (blue solid line) at 1030 nm.
In these cases, the curves were not monotonic and had Bell shapes with a maximum and a minimum at 1131/946 nm (for 600 W) and 1088/978 nm (200 W) at λp ~ 1031 nm. As a result, the phase matched wavelength could be obtained at two different λp. For example, the parametric amplification at 1100 nm could occur at λp ~ 1027 nm and λp ~ 1034 nm. For the chirped pump pulse, owing to a linear temporal distribution of λp, it meant that the amplification at 1100 nm also could be obtained at two times delayed by 43.4 ps. When a signal was injected into the PCF simultaneously with the chirped pump, its amplification was considerably affected by the pump shape. For a continuous wave signal [15], two delayed amplifications occurred and therefore, two idler pulses were generated during the parametric process. Alternatively, if a chirped seed with a broad bandwidth was injected into the FOPA [12], the parametric process would reshape the amplified signal and it would depend strongly on the delay between the signal and the pump. In addition, any variation of the pump profile would modify the phase matching condition. In our experiment, the pump spectrum was modulated (Figure 1b, red line), impacting upon the phase matching condition (Figure 2, dashed lines). It is worth noting that Figure 2 only takes into account the parametric process in the strong pump regime. The saturation and the Raman process are not included, although it may have modified the amplification behavior. Therefore, it was highly important to directly measure the temporal distribution of the spectral gain in the experimental conditions.

3. Experimental Set-up and Main Parameters

3.1. Pump-Probe Set-Up

The experimental setup is displayed in Figure 3. The pump and the signal were both generated from a unique mode-locked oscillator (Flint, LightConversion, Vilnius, Lithuania) delivering a train of pulses at 76 MHz with a duration of 80 fs at FWHM centered at 1030 nm. The total average power was 1.5 W. The pump wavelength was set at 1030 nm, while the signal one needed to be tunable in order to seed the targeted parametric amplification band. In order to shift the signal spectrum, a beam splitter selected a part of the oscillator output and 400 mW was injected into an all normal dispersion fiber (ANDI) to generate a coherent continuum [19]. It extended from ~750 nm to 1250 nm and, therefore, it could be used to seed a parametric amplifier in this band. Then, the continuum was injected into a Öffner type stretcher. The selection of the signal wavelength was achieved by the stretcher alignment by rotating the grating. The spectral bandwidth was imposed by the finite size of the mirrors in the stretcher. The other part of the oscillator (around 750 mW) seeded the pump amplifier. It was composed of a volume Bragg grating (VBG) that stretched the pulses to a duration of few tens of ps. The chirped pulse was then injected into an acoustooptic modulator (AOM) to decrease the repetition rate to 1 MHz and amplified by two ytterbium doped fiber amplifiers (YDFA). The maximum average power was 1 W. Finally, the pump and the signal were both injected into the 5-meter-long PCF. The properties of the PCF were described in Section 2. The two pulses were synchronized with a delay stage and the amplification spectrum was measured with an optical spectrum analyzer (OSA) for several delays. As the signal was shorter than the pump pulse, the instantaneous gain was measured for a selected part of the pump.
The spectrum at the PCF output was firstly measured with the OSA for an average pump power of 31 mW, when the signal was not injected (Figure 4a). It showed two lobes at 992 nm and 1077 nm, together with the pump spectrum at 1030 nm. The bandwidth at 1077 nm was ~12 nm. The experimental pump spectrum is shown in Figure 1b (red line) and exhibited structures due to self phase modulation (SPM) occurring in the last YDFA. Therefore, we expected that this spectral modulation would impact the temporal distribution of the spectral gain. In the next section, the signal was injected into the PCF together with the chirped pump pulse. Therefore, the continuum (black line in Figure 4b) was filtered in the stretcher to select the signal spectrum at 1080 nm (red line in Figure 4b) close to the central value of the lobes (Figure 4a). The spectral bandwidth was 15 nm (FWHM). The duration of the stretched pulse was measured with an autocorrelator and the experimental trace is shown in Figure 4c (red points). From a Gaussian fit (solid black line in Figure 4c), we deduced a pulse duration of 4.2 ps. This pulse duration is a good compromise, since several constraints need to be considered. Indeed, a very short pulse allowed us to get a high temporal resolution in the pump-probe measurement. However, in this case, the signal pulse can produce SPM even for a low power. For a longer pulse duration, the chirp from the stretcher should also be taken into account in the gain analysis, since the signal wavelength will be distributed in the temporal domain. In our case, we assumed that the signal chirp was negligible compared to the one of the pump, since the signal duration was shorter by a factor >10.

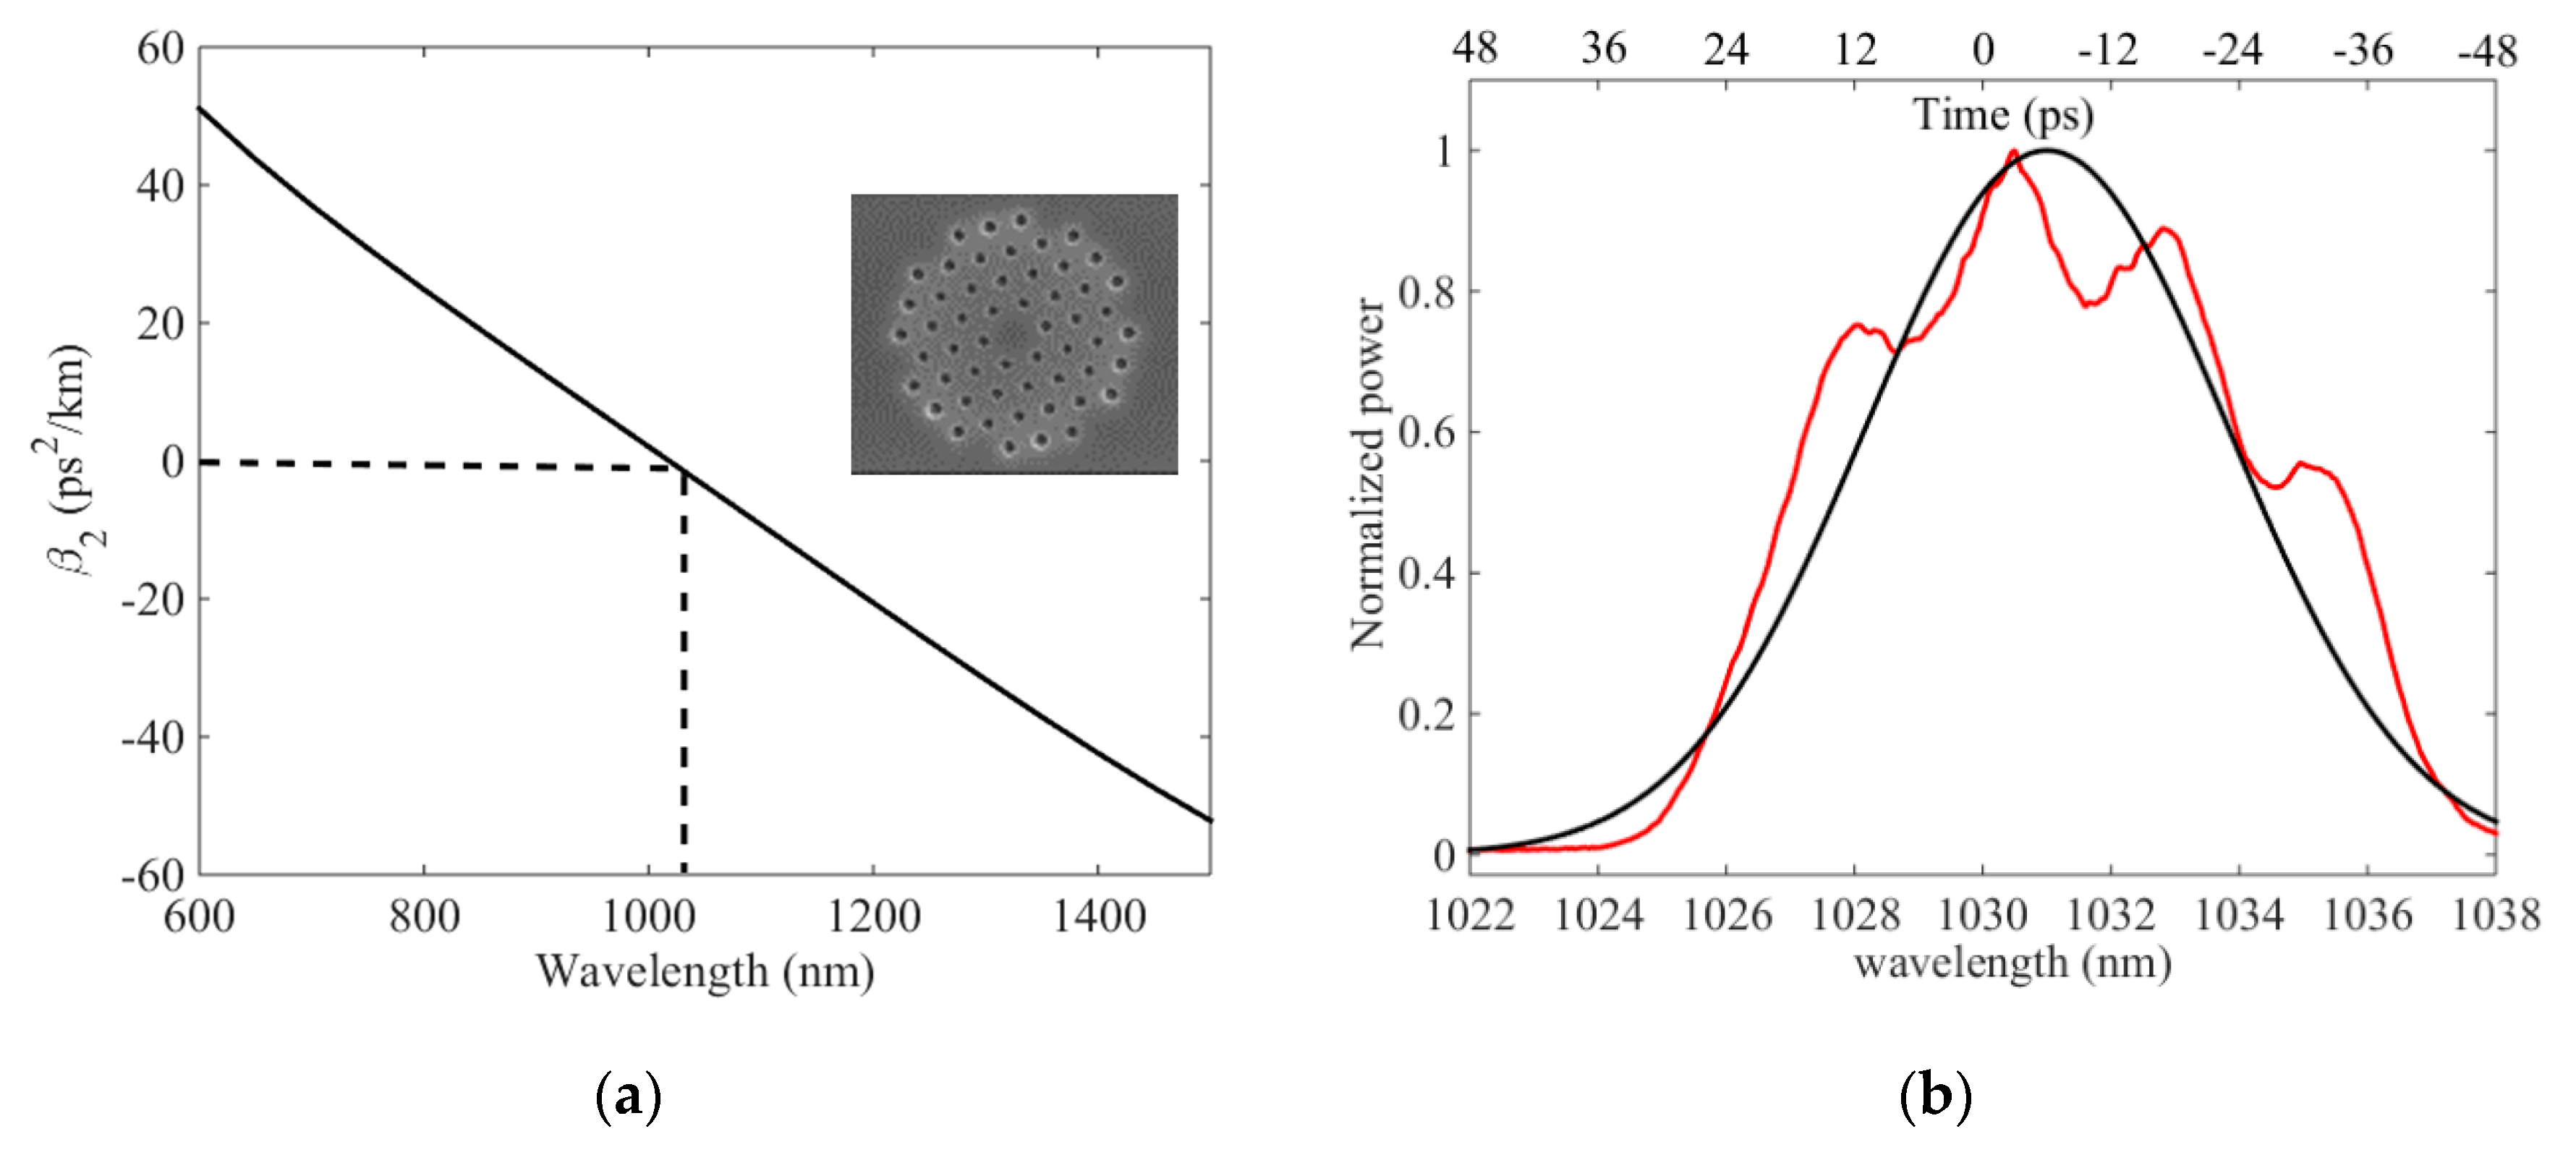
3.2. Characterization of the Pump

For each delay between the long chirped pump and the short probe, the signal (the probe) overlapped with one slide of the pump, owing to an instantaneous power and wavelength. Therefore, it was highly important to measure the temporal distribution of the pump wavelength. We measured the chirp rate, corresponding to the spectral phase, by spectral interferometry between a long and a short pulse both at the pump wavelength [20]. Accordingly, we modified the set-up. Briefly, a part of the output of the amplifier was injected at the opposite side of the VBG to recompress it to ~300 fs. Then, the chirped pump and the compressed pulse were combined with a beam splitter and the interference pattern was recorded with the OSA. Due to the finite resolution of the spectrometer, the complete interference pattern could not be measured over the full spectrum. Therefore, a local fringe was measured directly at the null delay between the two pulses. For more details, we refer the reader to the reference [21] describing the method. For example, the inset in Figure 5a displays an example of the interference pattern occurring at 1030 nm. In order to get the chirp rate, the spectral location of the fringe was measured as a function of the delay between the long and short pulses (Figure 5a). The null delay was fixed at 1030 nm. From a linear fit, we deduced a α value of 6.2 ps/nm, i.e., the pump wavelengths evolved linearly with time. Combining this value with the spectrum (Figure 1), the temporal shape could be inferred (Figure 5b). The pulse duration was 55 ps (FWHM) and the temporal shape was modulated with a period of ~14 ps.

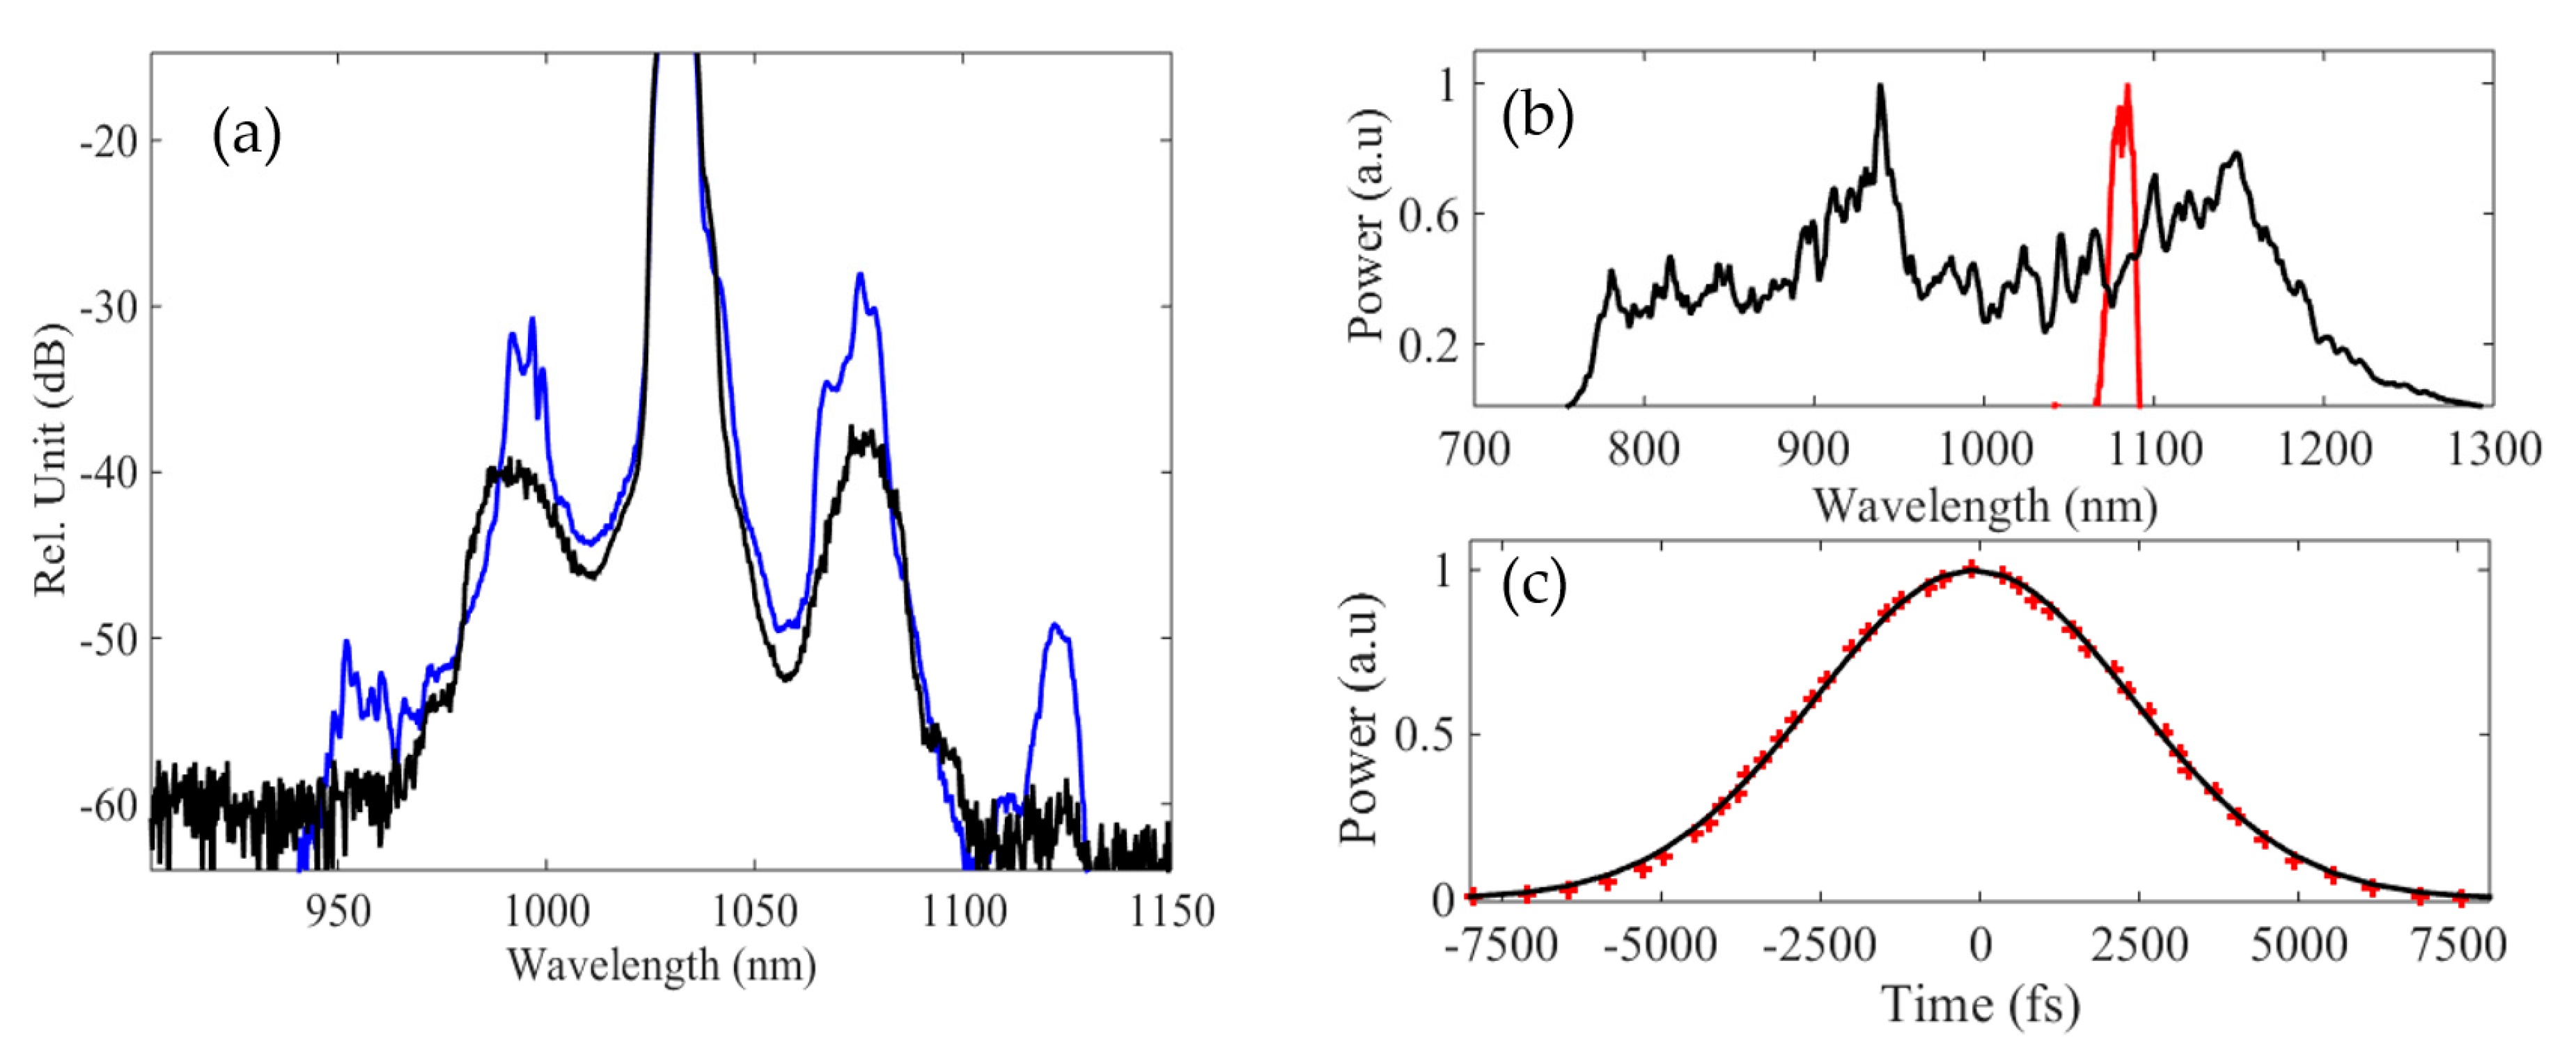
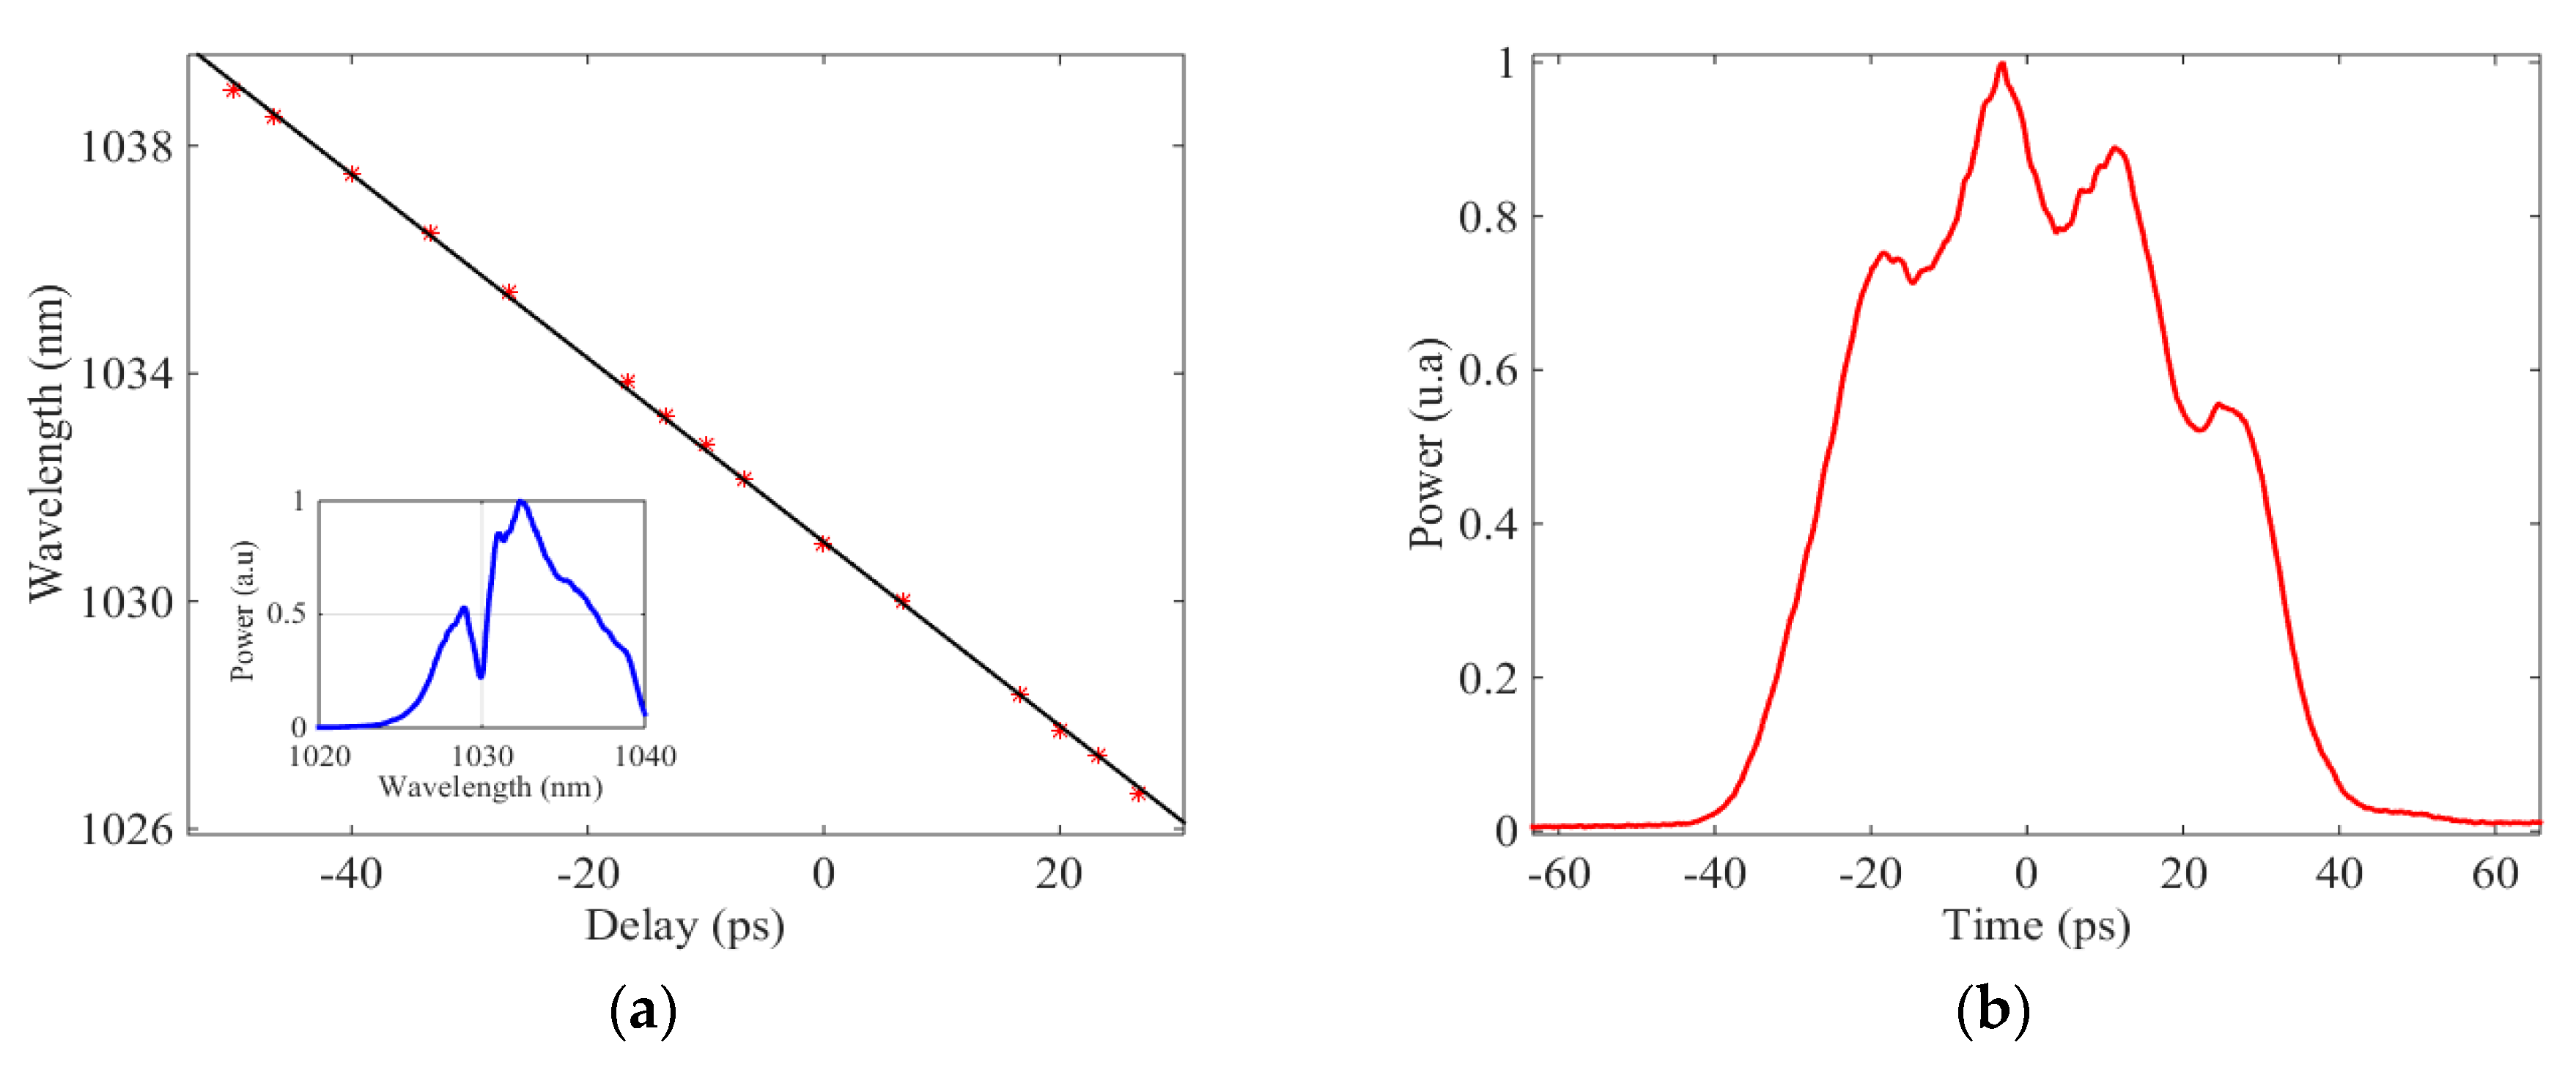
4. Measurement of the Amplification and Discussion

To measure the instantaneous gain, the chirped pump pulse was injected into the PCF simultaneously with the signal. The delay Δτ between the two pulses was tuned and the amplified spectrum was recorded for every delay separated by 3.3 ps. To ensure that the pump power launched in the PCF was constant during the complete measurement, we checked that the fluorescence spectrum was identical for each delay. The amplification was measured between Δτ ~ −15 and +25 ps. For longer delay, we did not detect any clear amplification since the pump power was lower by almost 50% from its maximum. From the pump average power and the pulse duration (Figure 5b), the peak power was estimated at ~530 W. The signal average power was ~5 µW. Figure 4a (blue line) shows an example of an output spectrum when the signal was injected at Δτ around 0 ps. An idler was generated, confirming the amplification of the signal. We also observed some other bands at 952 and 1124 nm, resulting from cascaded four wave mixings. Figure 6a,b show a selection of amplified and idler spectra when the Δτ was tuned from −6.6 ps to +19.8 ps.
The null delay corresponded to the pump wavelength of 1030 nm (Figure 5). However, we could not accurately define it and we set it when the amplification was at its maximum near the center of the signal spectrum (blue line in Figure 6a). For each Δτ, the amplification clearly occurred at a selected wavelength. In addition, the amplified shapes and their bandwidths varied with Δτ since the signal pulse overlapped with a different portion signal of the pump. Therefore, the pump power and the dispersion at the pump wavelength changed with the delay and influenced the properties of the amplified signal, as explained in Section 2. Particularly, the pump temporal shape was modulated around Δτ = 0 ps and had a Bell shape (Figure 5b). Therefore, the variation of the wavelengths at the maximum amplification with Δτ (Figure 6b) was not monotonic and was modulated. The amplification of one given signal wavelength could be achieved at several delays. This behavior is significantly different from the case in which the chirped pump has a constant peak power since only the dispersion parameter changed with time. In this case, the wavelength at maximum amplification evolved monotonically [11].
We also calculated the gain from the spectra of the input and the amplified signal. We remind readers that the repetition rate of the signal was 76 MHz, while the pump one was 1 MHz. Thus, it needed to be taken into account in the gain measurement; the output/input ratio at the signal wavelength did not directly give the net gain of amplification. Indeed, the instantaneous amplification occurred when the pump and the signal temporally overlapped, while the OSA detected the average power of all the incoming pulses. Therefore, the net gain was derived from G = S a m p / S i n · 76 with Samp and Sin the amplified and input signal spectra at the PCF output. Figure 7 displays the evolution of the wavelength at maximum gain as a function of Δτ (black circles) and it showed a similar behavior as in Figure 6b. For each delay, the maximum gain was very high (red circles in Figure 7) and it ranged from 1.8×10³ to 4.6×10⁵ for signal wavelength extending from ~1068 to ~1088 nm. We checked that the amplifier did not saturate since the gain did not change when the input power of the signal was decreased by a factor of ten. In addition, no spectral broadening of the signal by SPM was observed since the amplified spectra was not significantly different at lower power. Similarly, the measurement of the saturated gain could not be measured directly, since the increase of the signal input power would create SPM.

5. Conclusions

We presented a pump-probe experiment enabling the characterization of the temporal distribution of the spectral gain in a fiber-based optical parametric amplifier pumped by a chirped pump. We showed that the gain value and the amplified spectrum varied importantly when the signal overlapped with a different portion of the pump pulse. This measurement will be very important in future efforts to efficiently include the fiber-based OPA into a laser system delivering ultra-short pulses. For example, when a chirped signal is injected into the PCF with the chirped pump pulse, the temporal evolution of the signal wavelength should closely match the distribution of the spectral gain measured with our method.

Author Contributions

C.F.-D., A.I. and D.B. conceived, designed and performed the full experiment; A.I. and C.F.-D. analyzed the data; R.D., H.M.-M. and P.P.-M. designed the PCF; R.D. and R.J. achieved the PCF modeling; R.D., P.R., H.M.-M. and P.P.-M. fabricated the PCF and R.J., H.M.-M. and P.P.-M. characterized it. C.F.-D., P.R., H.M. and D.B. supervised the project (PCF, experiment and simulation) and contributed to experimental tools and concepts. C.F.-D. and D.B. wrote the manuscript.

Funding

This research was funded by the ANR, grant number FiberAmp/ANR-16-CE24-0009, the EUR EIPHI program (ANR-17-EURE-0002), the Franche-Comté councils (SIMULIE and CORPS project).

Conflicts of Interest

The authors declare no conflict of interest.

References

  1. Ciriolo, A.G.; Negro, M.; Devetta, M.; Cinquanta, E.; Facciala, D.; Pusala, A.; De Silvestri, S.; Stagira, S.; Vozzi, C. Optical Parametric Amplification Techniques for the Generation of High-Energy Few-Optical-Cycles IR Pulses for Strong Field Applications. Appl. Sci. 2017, 7, 265. [Google Scholar] [CrossRef]
  2. Bigourd, D.; Patankar, S.; Olsson Robbie, S.I.; Doyle, H.W.; Mecseki, K.; Stuart, N.; Hadjicosti, K.; Leblanc, N.; New, G.H.C.; Smith., R.A. Spectral enhancement in optical parametric amplifiers in the saturated regime. Appl. Phys. B 2013, 113, 627–633. [Google Scholar] [CrossRef]
  3. Dorrer, C.; Begishev, I.A.; Okishev, A.V.; Zuegel, J.D. High-contrast optical parametric amplifier as a front end of high-power laser systems. Opt. Lett. 2007, 32, 2143–2145. [Google Scholar] [CrossRef] [PubMed]
  4. Fu, Y.; Yuan, H.; Midorikawa, K.; Lan, P.; Takahashi, E.J. Towards GW-scale isolated attosecond pulse far beyond carbon K-Edge driven by mid-infrared waveform synthesizer. Appl. Sci. 2018, 8, 2451. [Google Scholar] [CrossRef]
  5. Hanna, M.; Druon, F.; Georges, P. Fiber optical parametric chirped-pulse amplification in the femtosecond regime. Opt. Express 2006, 14, 2783–2790. [Google Scholar] [CrossRef] [PubMed]
  6. Faccio, D.; Grün, A.; Bates, P.K.; Chalus, O.; Biegert, J. Optical amplification in the near-infrared in gas filled hollow-core fibers. Opt. Lett. 2009, 34, 2918–2920. [Google Scholar] [CrossRef] [PubMed]
  7. Cristofori, V.; Lali-Dastjerdi, V.; Rishj, L.S.; Galili, M.; Peucheretand, C.; Rottwitt, K. Dynamic characterization and amplification of sub-picosecond pulses in fiber optical parametric chirped pulse amplifiers. Opt. Express 2013, 21, 26044–26051. [Google Scholar] [CrossRef] [PubMed]
  8. Caucheteur, C.; Bigourd, D.; Hugonnot, E.; Szriftgiser, E.; Kudlinski, A.; Gonzalez-Herraez, M.; Mussot, A. Experimental demonstration of optical parametric chirped pulse amplification in optical fiber. Opt. Lett. 2010, 35, 1786–1788. [Google Scholar] [CrossRef] [PubMed]
  9. Bigourd, D.; Lago, L.; Mussot, A.; Kudlinski, A.; Gleyze, J.F.; Hugonnot, E. High-gain, optical-parametric, chirped-pulse amplification of femtosecond pulses at 1 µm. Opt. Lett. 2010, 20, 3480–3482. [Google Scholar] [CrossRef] [PubMed]
  10. Bigourd, D.; Beaure d’Augères, P.; Dubertrand, J.; Hugonnot, E.; Mussot, A. Ultra-broadband fiber optical parametric amplifier pumped by chirped pulses. Opt. Lett. 2014, 39, 3782–3785. [Google Scholar] [CrossRef] [PubMed]
  11. Vanvincq, O.; Fourcade-Dutin, C.; Mussot, A.; Hugonnot, E.; Bigourd, D. Ultrabroadband fiber optical parametric amplifiers pumped by chirped pulses. Part 1: Analytical model. J. Opt. Soc. Am. B 2015, 32, 1479–1487. [Google Scholar] [CrossRef]
  12. Fourcade-Dutin, C.; Vanvincq, O.; Mussot, A.; Hugonnot, E.; Bigourd, D. Ultrabroadband fiber optical parametric amplifiers pumped by chirped pulses. Part 2: Sub-30 fs pulse amplification at high gain. J. Opt. Soc. Am. B 2015, 32, 1488–1493. [Google Scholar] [CrossRef]
  13. Bigourd, D.; Fourcade-Dutin, C.; Vanvincq, O.; Hugonnot, E. Numerical analysis of broadband fiber optical parametric amplifiers pumped by two chirped pulses. J. Opt. Soc. Am. B 2016, 33, 1800–1807. [Google Scholar] [CrossRef]
  14. Morin, P.; Dubertrand, J.; Beaure d’Augères, P.; Quiquempois, Y.; Bouwmans, G.; Mussot, A.; Hugonnot, E. µJ-level Raman-assisted fiber optical fiber parametric chirped pulse amplification. Opt. Lett. 2018, 43, 4683–4686. [Google Scholar] [CrossRef] [PubMed]
  15. Fu, W.; Wise, F.W. Normal-dispersion fiber optical parametric chirped-pulse amplification. Opt. Lett. 2018, 43, 5331–5334. [Google Scholar] [CrossRef] [PubMed]
  16. Bigourd, D.; Morin, P.; Dubertrand, J.; Fourcade-Dutin, C.; Maillotte, H.; Quiquempois, Y.; Bouwmans, G.; Hugonnot, E. Parametric gain shaping from a structured pump pulse. IEEE Photonics Technol. Lett. 2019, 31, 214–217. [Google Scholar] [CrossRef]
  17. Finot, C.; Wabnitz, S. Influence of the pump shape on the modulation instability process induced in a dispersion-oscillating fiber. J. Opt. Soc. Am. B 2015, 32, 892–899. [Google Scholar] [CrossRef] [Green Version]
  18. Lee, H.W.; Kim, Y.G.; Yoo, J.Y.; Yoon, J.W.; Yang, J.M.; Lim, H.; Nam, C.H.; Sung, S.H.; Lee, S.K. Spectral shaping of an OPCPA preamplifier for a sub-20 fs multi-PW laser. Opt. Express 2018, 26, 24775–24783. [Google Scholar] [CrossRef] [PubMed]
  19. Fourcade-Dutin, C.; Bigourd, D. Near infrared tunable source delivering ultra-short pulses based on an all normal dispersion fiber and a zero dispersion line. Appl. Phys. B 2018, 124, 154. [Google Scholar] [CrossRef]
  20. Kovacs, A.P.; Osvay, K.; Kurdi, G.; Gorde, M.; Klebniczki, J.; Bor, Z. Dispersion control of a pulse stretcher-compressor system with two-dimensional spectral interferometry. Appl. Phys. B 2005, 80, 165–170. [Google Scholar] [CrossRef]
  21. Dou, T.H.; Tautz, R.; Gu, X.; Marcus, G.; Feurer, T.; Krausz, F.; Veisz, L. Dispersion control with reflection grisms of an ultra-broadband spectrum approaching a full octave. Opt. Express 2010, 18, 27900–27909. [Google Scholar] [CrossRef] [PubMed]
Figure 1. (a) Second order dispersion term as a function of the wavelength. Inset. Input facet of the PCF measured with a scanning electron microscope. (b) Normalized pump spectrum of a chirped pulse with a Gaussian shape (black line) or with the experimental profile (red line).
Photonics 06 00020 g001
Figure 2. Phase matching as a function of the pump wavelength for a chirped pulse with a Gaussian spectrum (solid red and blue lines) or with the experimental profile (dashed red and blue lines). The maximum power was 600 W (red lines) or 200 W (blue lines). The magenta and cyan lines correspond to the phase matching for a constant peak power of 600 W or 200 W, respectively.
Photonics 06 00020 g002
Figure 3. Experimental set-up. VBG, volume Bragg grating; AOM, acoustooptic modulator; YDFA, ytterbium doped fiber amplifier; OSA, optical spectrum analyzer; PCF, photonic crystal fiber; ANDI, all normal dispersion fiber; BS, beam splitter; M, mirror; P, polarizer; DM, dichroic mirror; FM, flipped mirror.
Photonics 06 00020 g003
Figure 4. (a) Fluorescence spectrum when the PCF is pumped by 31 mW (black line). Output spectrum when the signal is injected at null delay (blue line). (b) Spectrum of the continuum generated in the ANDI fiber (black line) and spectrum of the signal (red line). (c) Autocorrelation trace (red stars) and the Gaussian fit (solid black line) of the signal.
Photonics 06 00020 g004
Figure 5. (a) Measurement of the chirp rate by spectral interferometry and its linear fit leading to α = 6.2 ps/nm. The inset is an example of the interference pattern. (b) Temporal shape of the pump pulse.
Photonics 06 00020 g005
Figure 6. (a,b) Selection of amplified and idler spectra when the delay is tuned from −6.6 ps to +19.8 ps. (c,d) Variation of the signal and idler wavelengths at the maximum amplification as a function of the delay.
Photonics 06 00020 g006
Figure 7. Maximum gain value (red circles) and its corresponding signal wavelength (black circles) as a function of the delay.
Photonics 06 00020 g007

