Article

Imaging of Chemical Reactions Using a Terahertz Chemical Microscope

1
Graduate School of Interdisciplinary Science and Engineering in Health Systems, Okayama University, 3-1-1 Tsushimanaka, Kitaku, Okayama 700-8530, Japan
2
Graduate School of Natural Science and Technology, Okayama University, 3-1-1 Tsushimanaka, Kitaku, Okayama 700-8530, Japan
3
Kyowa Fintech Co. Ltd., 948-9 Kanaokanishi, Higashiku, Okayama 704-8193, Japan
*
Author to whom correspondence should be addressed.
Photonics 2019, 6(1), 10; https://doi.org/10.3390/photonics6010010
Submission received: 14 December 2018 / Revised: 22 January 2019 / Accepted: 25 January 2019 / Published: 27 January 2019
(This article belongs to the Special Issue Terahertz Photonics)

Abstract

:
This study develops a terahertz (THz) chemical microscope (TCM) that visualizes the distribution of chemical reaction on a silicon-based sensing chip. This chip, called the sensing plate, was fabricated by depositing Si thin films on a sapphire substrate and thermally oxidizing the Si film surface. The Si thin film of the sensing plate was irradiated from the substrate side by a femtosecond laser, generating THz pulses that were radiated into free space through the surface field effect of the Si thin film. The surface field responds to chemical reactions on the surface of the sensing plate, changing the amplitude of the THz pulses. This paper first demonstrates the principle and experimental setup of the TCM and performs the imaging and measurement of chemical reactions, including the reactions of bio-related materials.

1. Introduction

In a pioneering study, Auston et al. [1,2] generated coherent terahertz (THz) pulses and detected their time-domain waveforms. Since then, many researchers have sought novel and practical industrial applications of THz pulses [3]. One promising application of THz pulses is THz time-domain spectroscopy (THz-TDS) using ultra-short laser pulses, which was first demonstrated by van Exter et al. [4]. THz-TDS has been employed in both scientific research (evaluating the complex dielectric constants of materials) [5] and in many industrial fields. The latest highly stable femtosecond lasers and THz measurement techniques have successfully evaluated bio-related materials, paving the way for future medical diagnosis [6,7,8].
Laser-excited THz microscopy (LTEM) has also introduced THz pulses to various scientific and industrial fields. THz-TDS measures the optical properties of materials, whereas LTEM evaluates the dynamics of carriers or electric dipoles in materials and has already analyzed high-temperature superconductors (HTS) [8,9], ferroelectrics [10] and semiconductor devices [11,12,13,14]. LTEM irradiates materials by femtosecond laser pulses, generating THz radiation. Because the observed waveforms are related to the dynamics of the photo-excited carriers or electric dipoles in the illuminated region of the material, a two-dimensional map of the material properties can be constructed by scanning the femtosecond laser across the surface of the materials and detecting the THz pulses. The spatial resolution of conventional THz imaging is limited by the wavelength of the THz pulses, but the spatial resolution of LTEM is limited by the wavelength of the femtosecond laser that excites the THz pulses (generally 1.5 µm or 790 nm). Therefore, the spatial resolution is expected to be much higher in LTEM than in conventional THz imaging. Recently, Klarskov et al. obtained a spatial resolution of 20 nm by combining LTEM with scanning near-field optical microscopy [15].
Our group has proposed and developed an advanced variation of LTEM called the THz chemical microscope (TCM), which visualizes various types of chemical reactions, including those of protons [16,17,18], sodium and potassium ions [19], antigens [20,21,22,23] and catalysts [24].
This paper describes the principle and optical setup of the TCM and introduces some measurements of chemical reactions related to bio-related materials.

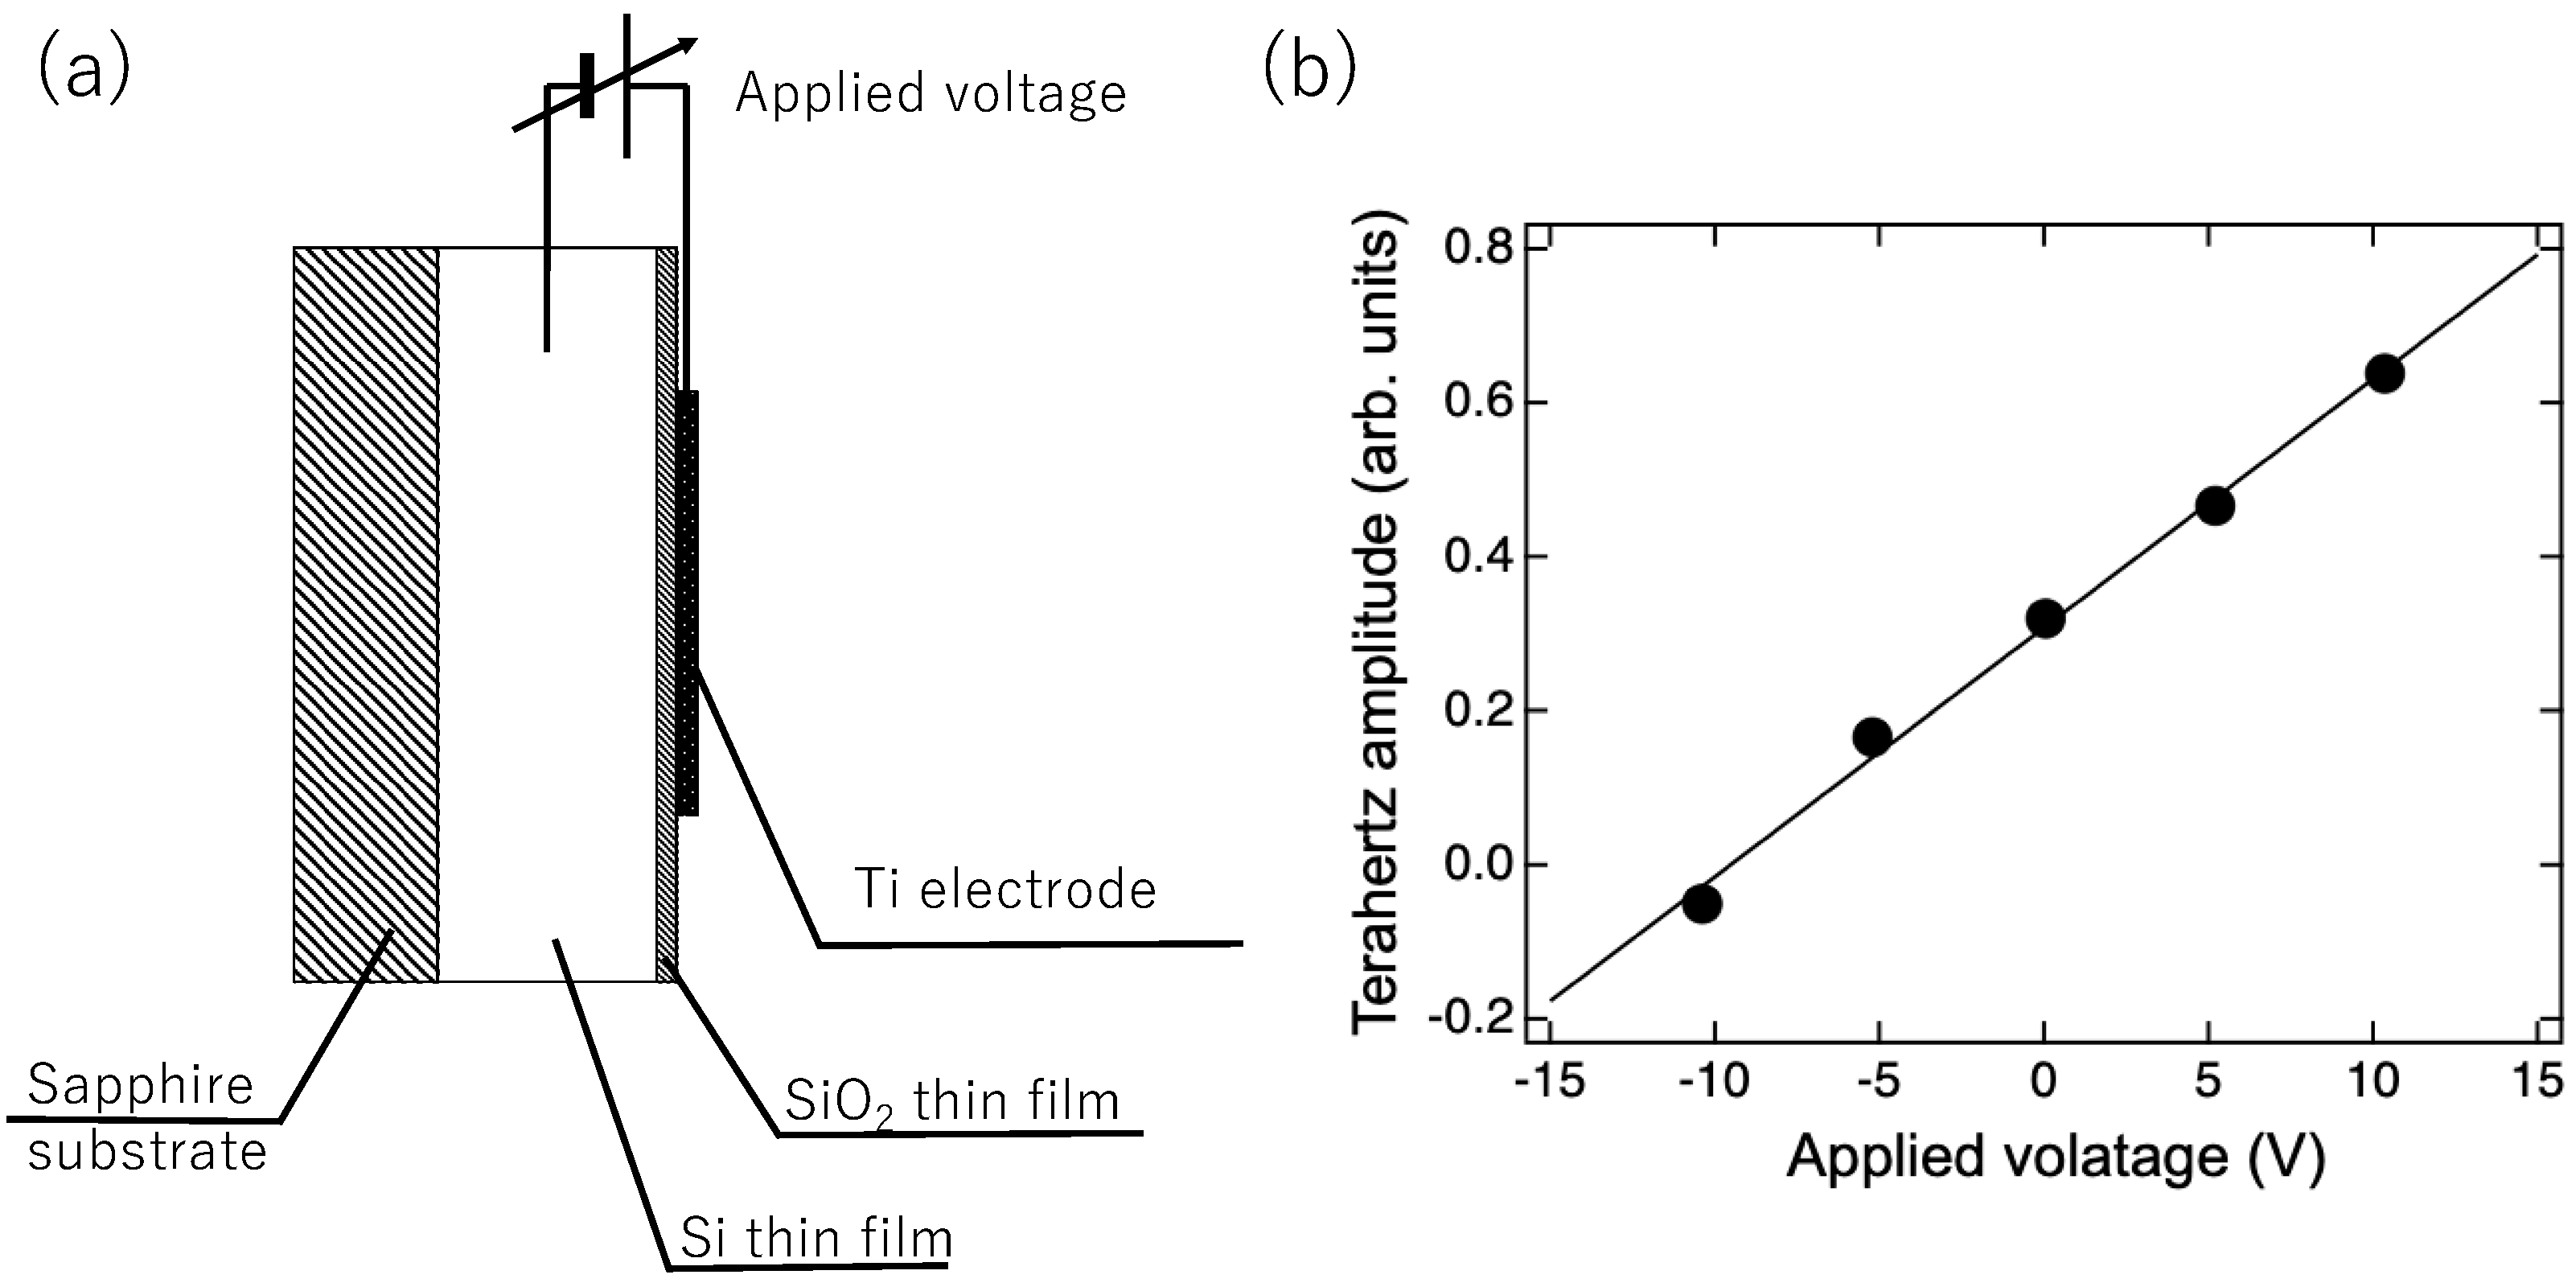
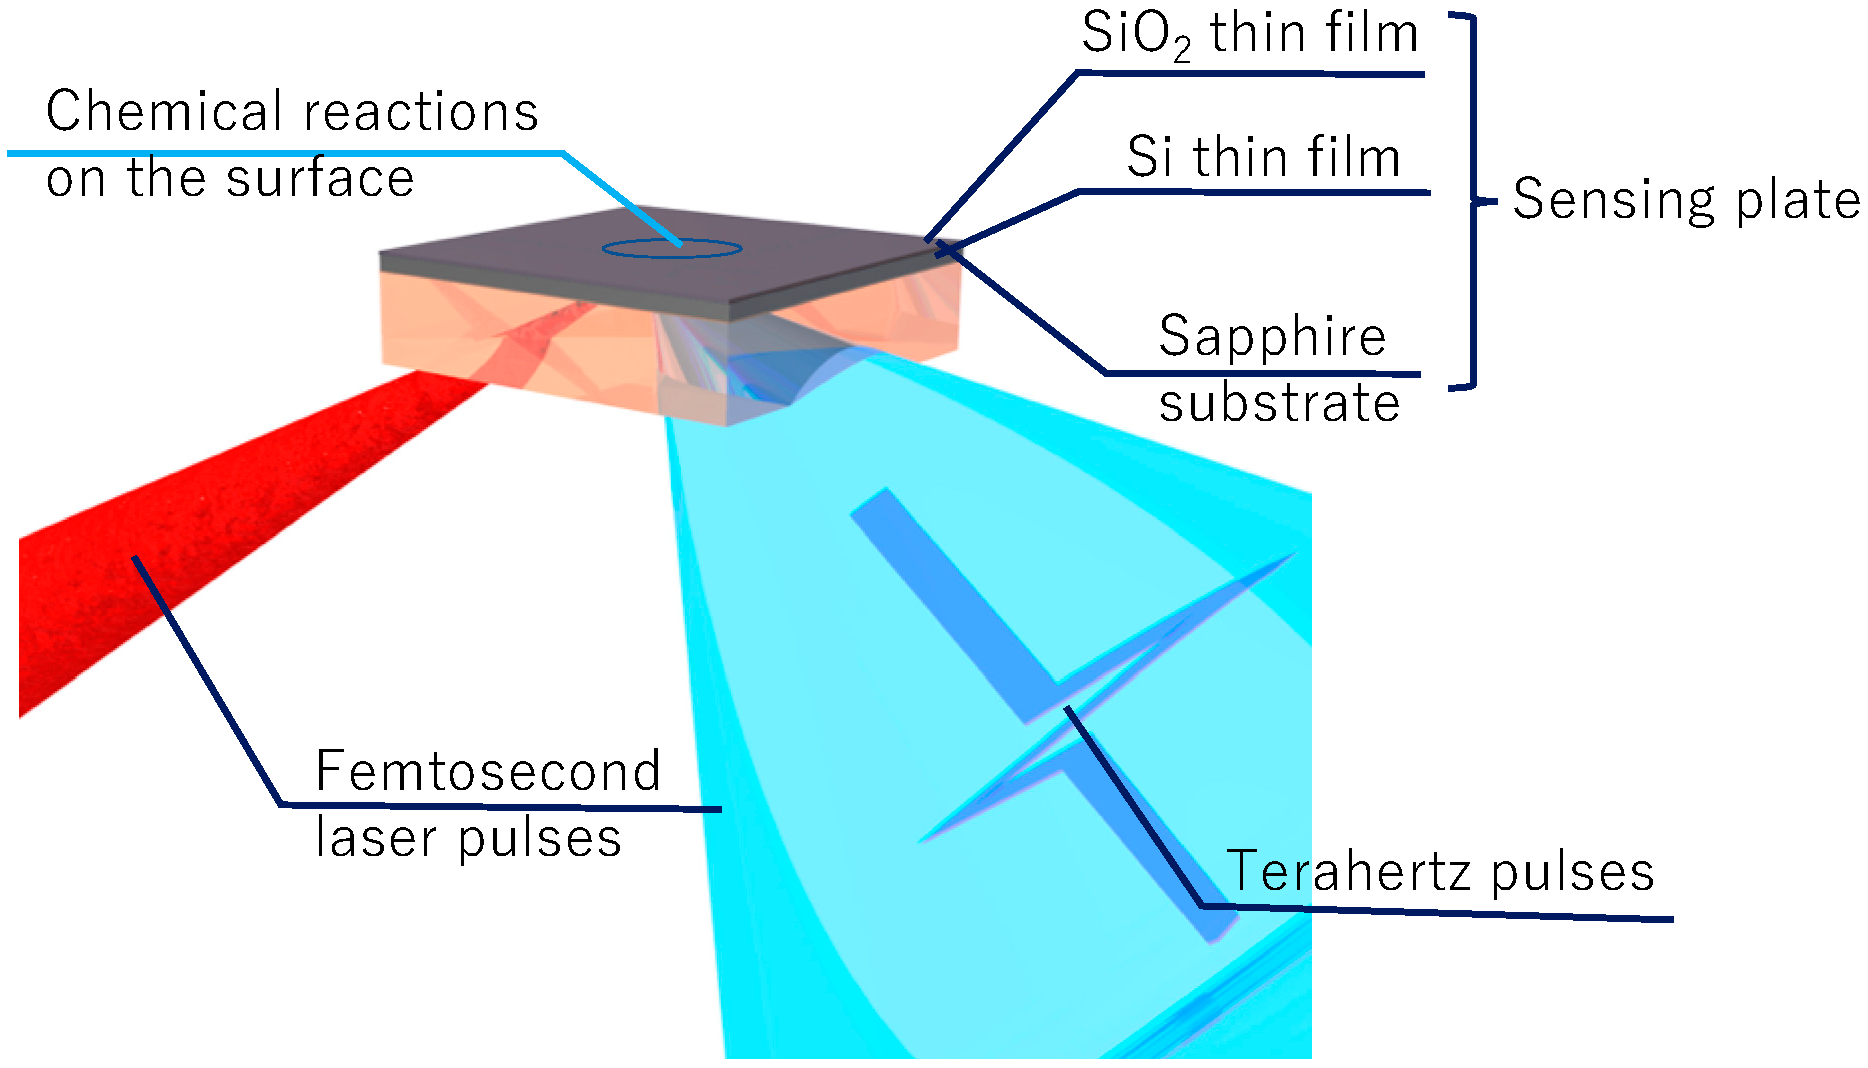
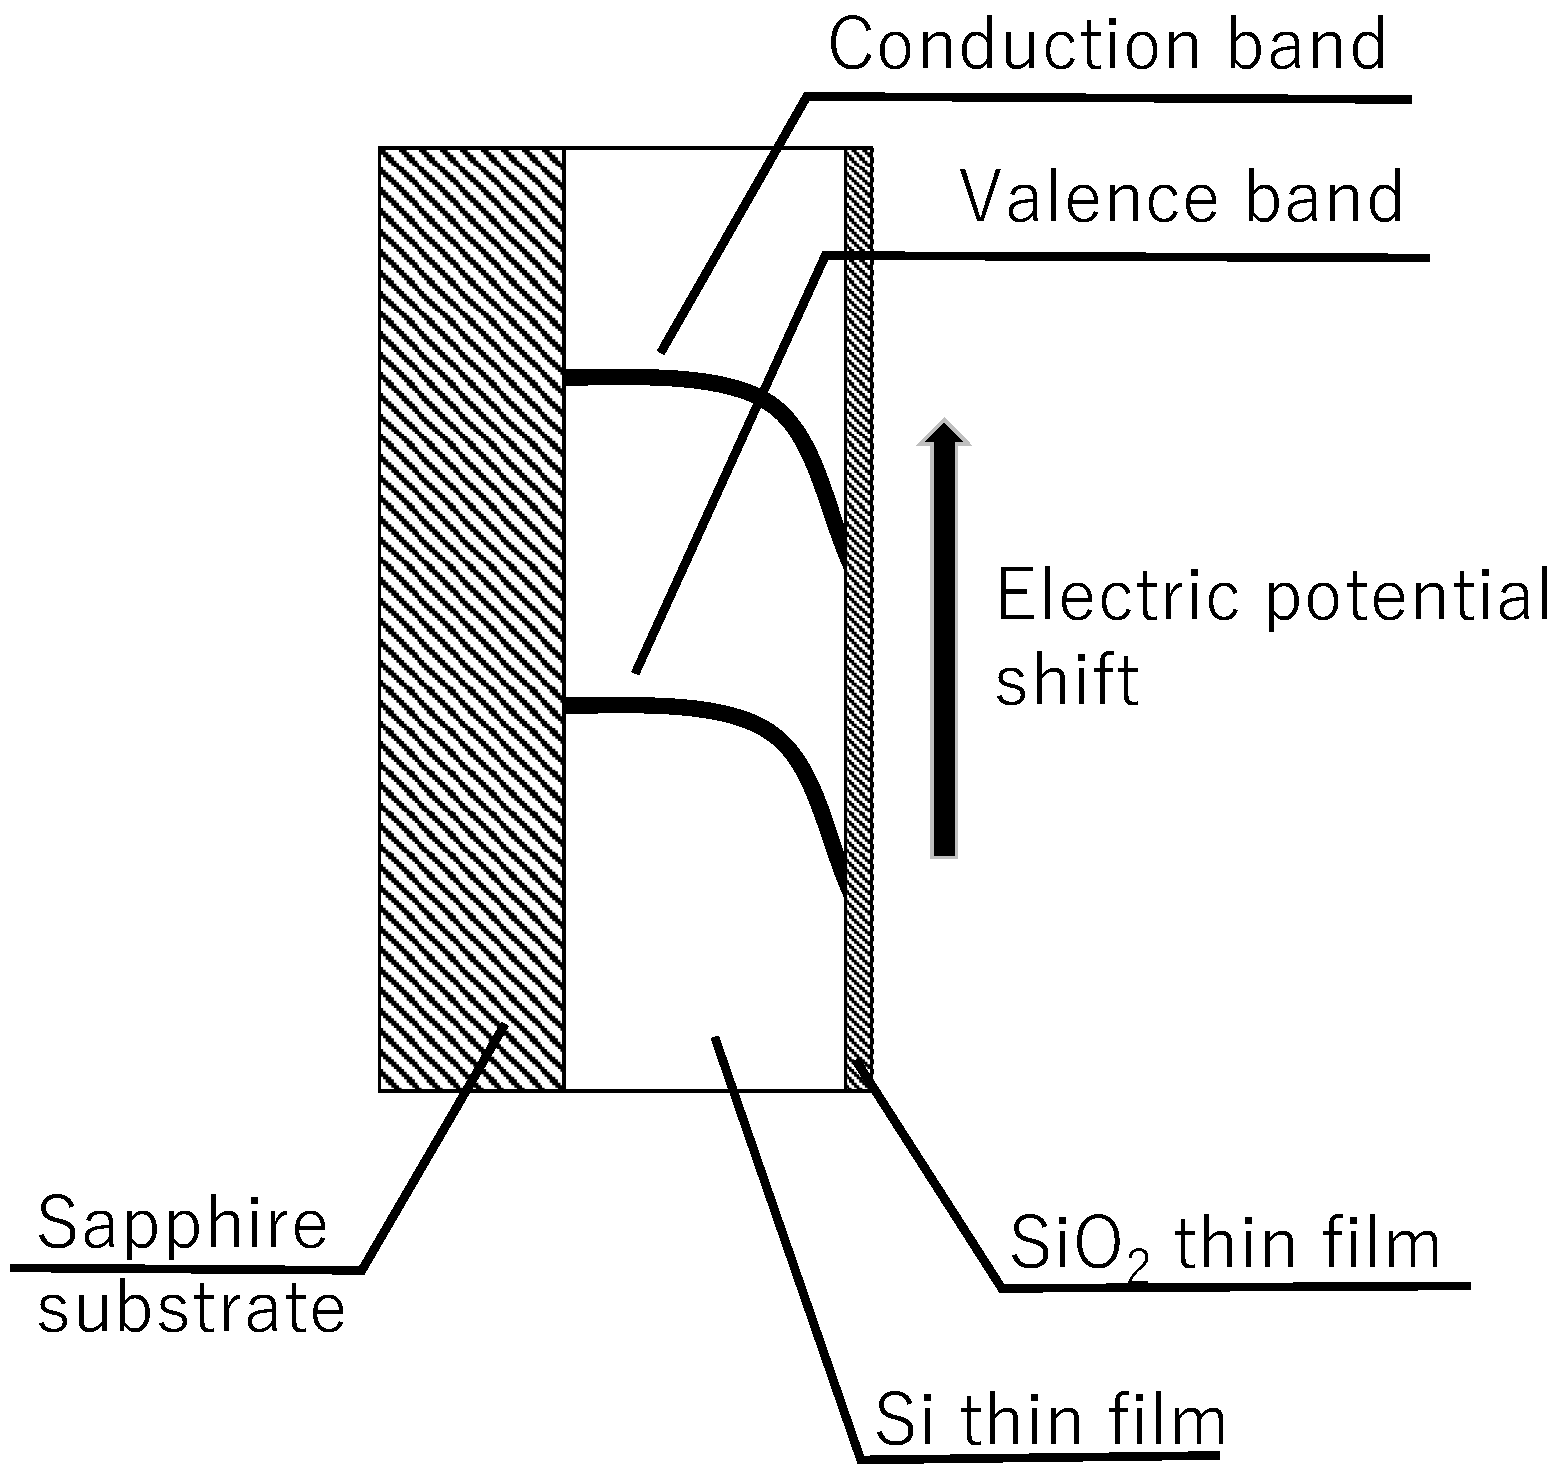
2. Measurement Principle
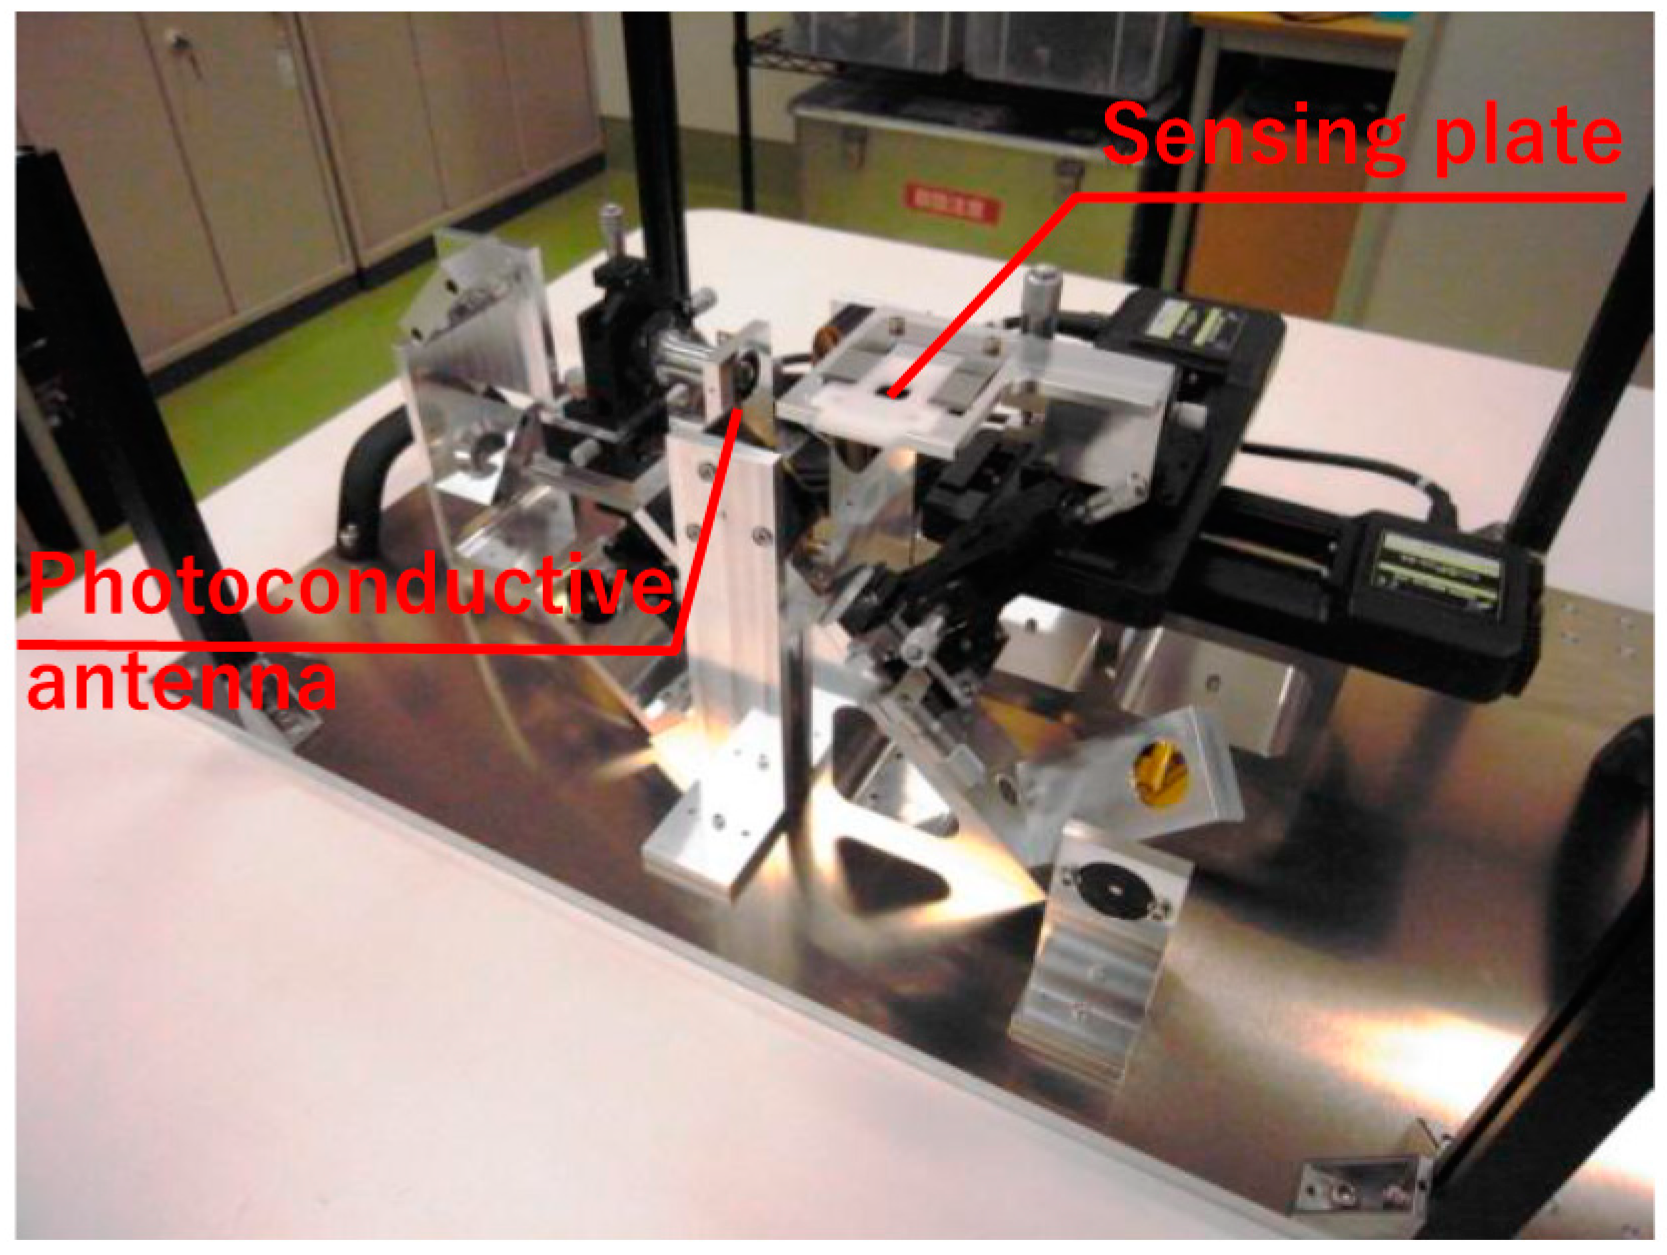
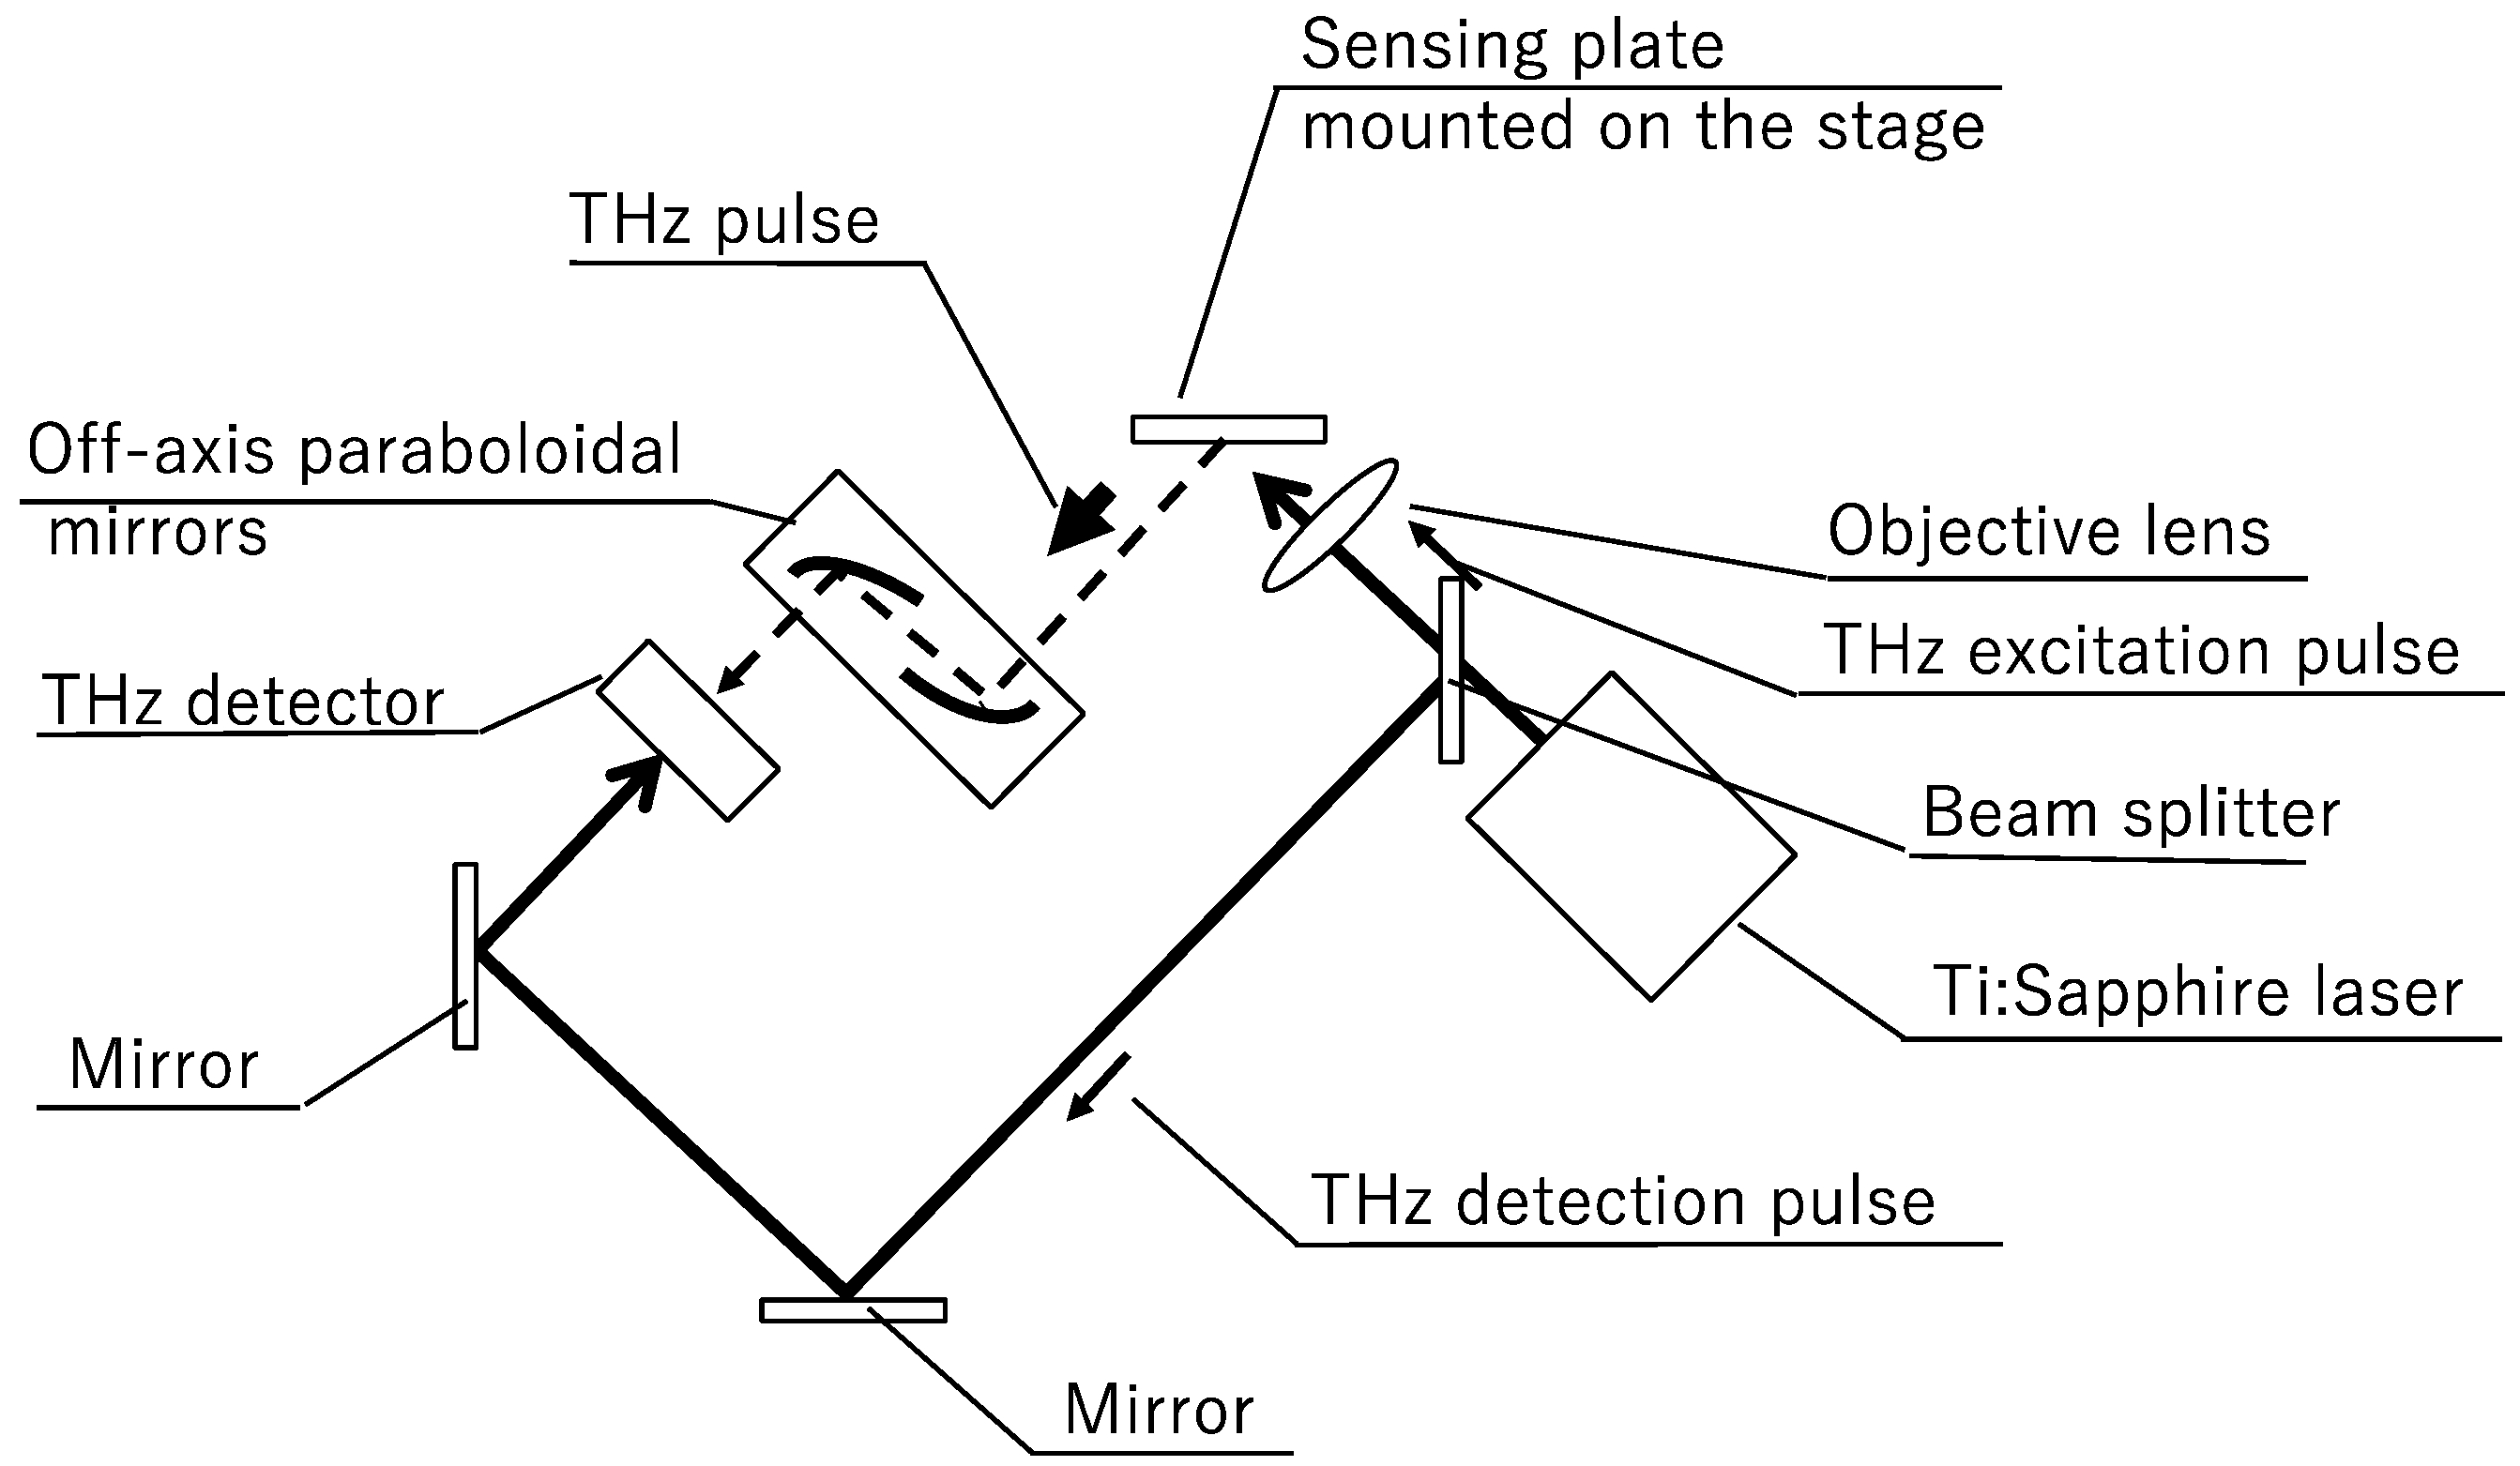
Figure 1 is a schematic of the sensing plate prepared by fabricating an epitaxial Si thin film on a sapphire substrate. The thicknesses of the Si thin film and sapphire substrate were 500 nm and 600 µm, respectively. The plate size was 10 × 10 mm2. As the surface of the Si thin film naturally oxidizes, it was coated by a SiO2 thin film to prevent electrons produced by the chemical reactions from transferring to the Si thin film. When femtosecond laser pulses are focused on the sensing plate from its sapphire substrate side, THz pulses are generated in the Si thin film and radiated into free space. The energy band diagram of the sensing plate is schematized in Figure 2. The bending of the conduction and valence bands in the Si thin film near the Si–SiO2 boundary is attributable to defects in the Si thin film. This bending phenomenon naturally forms a depletion field in the Si thin film. When the photon energy of the femtosecond laser exceeds the band gap of the Si thin film, the carriers are excited and accelerated by the depletion field. Consequently, THz pulses are generated in the Si thin films and are radiated into free space via ultrafast carrier modulation [24,25]. When chemical reactions proceed on the sensing plate, they shift the electric or chemical potential ψ on the surface, thereby changing the magnitude of the depletion layer. Assuming that the depletion layer linearly changes through the depth of the Si thin film, the depletion layer E l is given by
E l = e N D / 2 ε × ψ ,
where N D is the carrier density, e is the elementary charge and ε is the dielectric constant of the Si thin film [13]. Meanwhile, the far electric field E T H z of the THz pulses is calculated as
E T H z t J n t e v + n e v t ,
where J is the current density and n and v are the carrier density and velocity of the charges excited by the femtosecond laser, respectively. n / t is related to the intensity and pulse width of the femtosecond laser pulses used for excitation and is constant under fixed laser conditions. Because the carrier acceleration v / t is proportional to E l , E T H z is proportional to the square root of the electric potential ψ , which depends on the specific chemical reaction. The time-domain waveforms of THz pulses are similar to the optical-source waveforms of conventional THz time-domain spectroscopy.
As in conventional LTEM systems, the amplitude of the radiated THz in TCM includes the information of the precise illumination position of the femtosecond laser. Therefore, the distribution of the chemical reactions can be obtained by scanning the femtosecond laser across the surface of the substrate side of the sensing plate. The amplitude of the THz pulses is estimated as the maximum peak amplitude of the measured THz waveforms. To check the relation between the electric potential and the THz pulse amplitude, a Ti electrode was fabricated on the sensing plate and voltage was applied between the electrode and the Si thin film (see Figure 3a). As shown in Figure 3b, the amplitude of the radiated THz is an increasing function of applied voltage, consolidating the emission mechanism described above. By linearly fitting the data, the slope was determined as 0.032 /V. The slope generally depends on the alignment of the laser and the amplification factor of the current amplifier used in the THz detection circuit.

3. Optical Setup

Figure 4 shows the optical setup of the TCM. The optical source was a mode-locked Ti: Sapphire laser. The pulse width was approximately 80 fs half-width at half-maximum (FWHM) and the repetition rate was 82 MHz. The average output power was 680 mW. The center wavelength of the laser pulse was 790 nm, corresponding to a photon energy of 1.57 eV.
The femtosecond laser pulses were irradiated from the substrate side of the sensing plate and focused on the plate through an objective lens, generating the THz pulses. The incident angle and spot size of the laser pulses was 45° and ~5 µm, respectively. Because of the phased array effect of THz radiation, the THz pulses were radiated into free space in the direction of their reflection. The radiated THz pulses were collimated and focused onto a bow-tie-type photoconductive antenna. To measure the amplitude of the THz pulses, the antenna arrival time of the trigger pulses was fixed at the observed timing of the peak amplitude. For scanning the laser pulses and mapping their amplitudes, the sensing plate was mounted on an xy movable stage. A photograph of the prototype TCM is shown in Figure 5. Almost all modules were fabricated from aluminum blocks, thereby reducing the number of mechanical components.

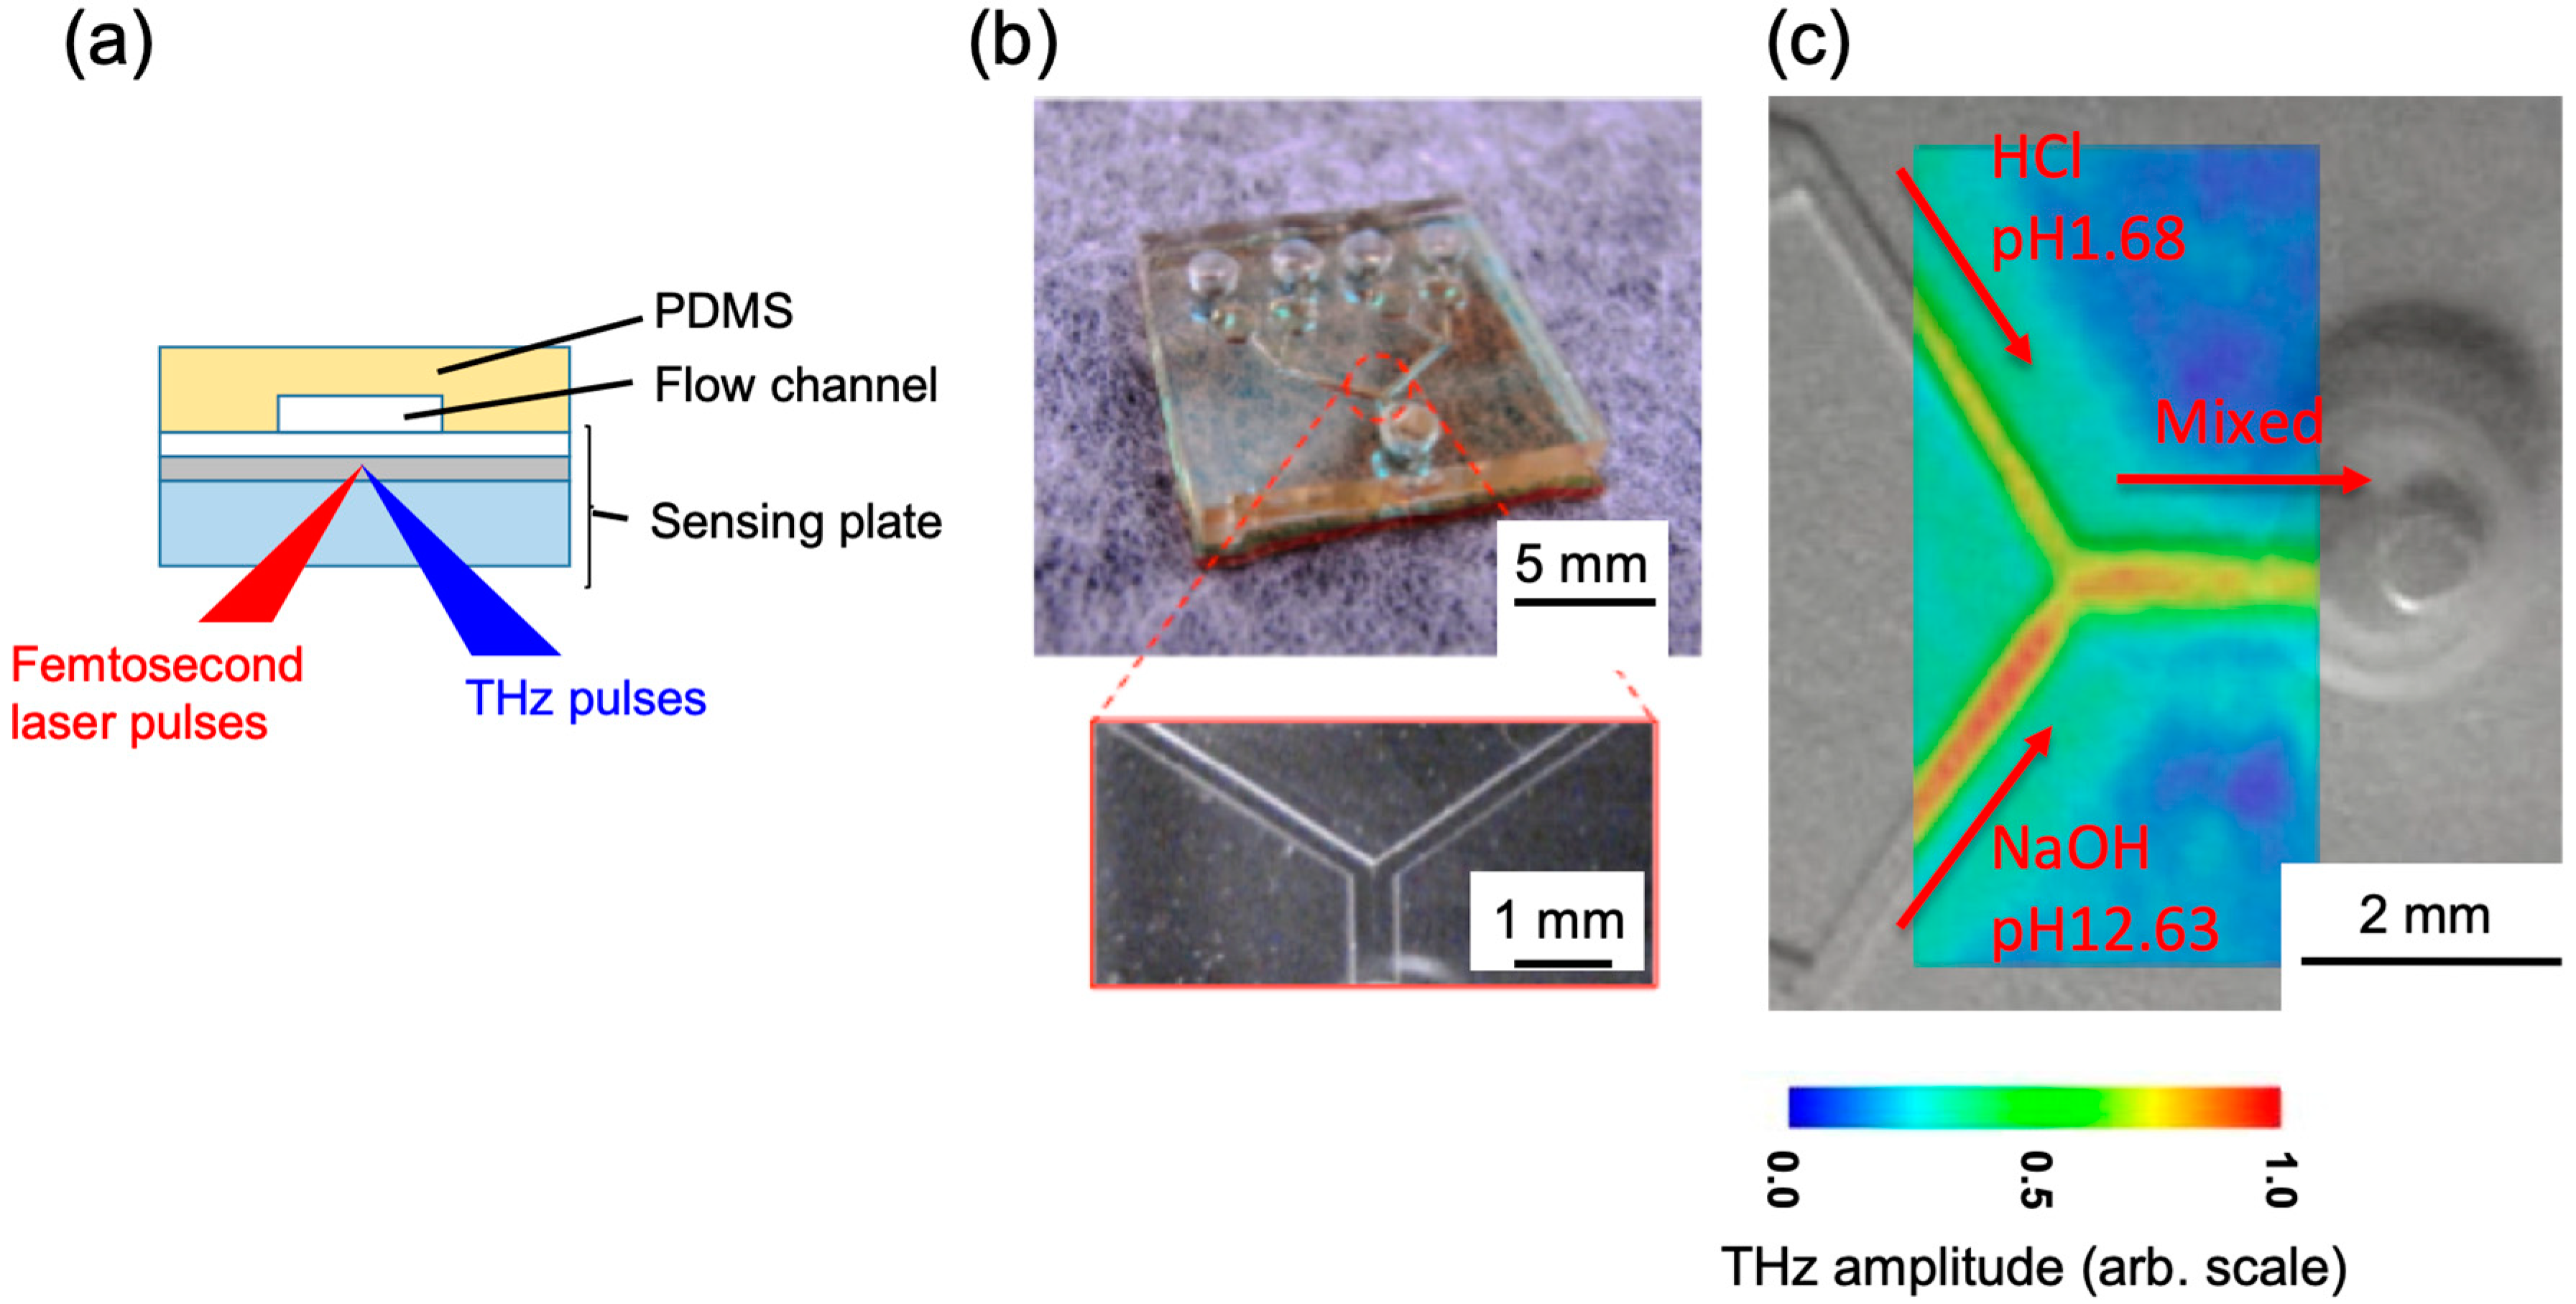
4. Imaging of Chemical Reactions

4.1. pH Measurements

To measure the pH of the solution using the TCM, silanol (Si–OH) groups were prepared on the surface of the SiO2 thin film of the sensing plate. Si–OH groups in the thermal equivalent state coexist with SiO ions and protons as follows:
Si-OH ⇔ SiO + H+.
The Si–OH groups titrate with the protons in the solution and exist as either uncharged Si–OH or negatively charged SiO. An electric double layer is thus formed at the SiO2 surface. The electric potential ψ at the surface is determined by the Nernst Equation, which depends on the proton concentration:
ψ =   ψ 0 + R T z F ln C 1 C 0 ,
where ψ 0 is the standard potential and R and F are the ideal gas constant and the Faraday constant, respectively. T is the absolute temperature and z is the number of electrons transferred. C 0 and C 1 are the ion concentrations before and after the change, respectively. Combining Equations (1)–(3), we obtain
E T H z ψ 0 + R T z F ln C 1 C 0 .
Panels (a) and (b) of Figure 6 show a cross-sectional schematic and a photograph of the Y-shaped microflow channel on the sensing plate, respectively. Made from dimethylpolysiloxane (PDMS), the microflow channel is approximately 500 µm high and 500 µm wide. In Figure 6c, the microflow channel is superimposed with the distribution of THz radiation from the sensing plate. Solutions of HCl (pH 1.68) and NaOH (pH 12.63) were continuously injected into opposite channel inlets by peristaltic pumps. These solutions were then mixed and drained. The average normalized THz amplitudes were 0.77 and 0.98, respectively, in the inlets carrying the HCl and NaOH solutions and 0.80 in the neutralized area. Apparently, the distribution of THz amplitudes obtained by the TCM visualizes the pH on the sensing plate bearing silanol groups on its surface. By virtue of the high spatial resolution of the TCM (~5 µm), the pH values of a small volume of solution are measurable. In our previous demonstration, we measured the pH values in 16-nL buffer solutions [18].

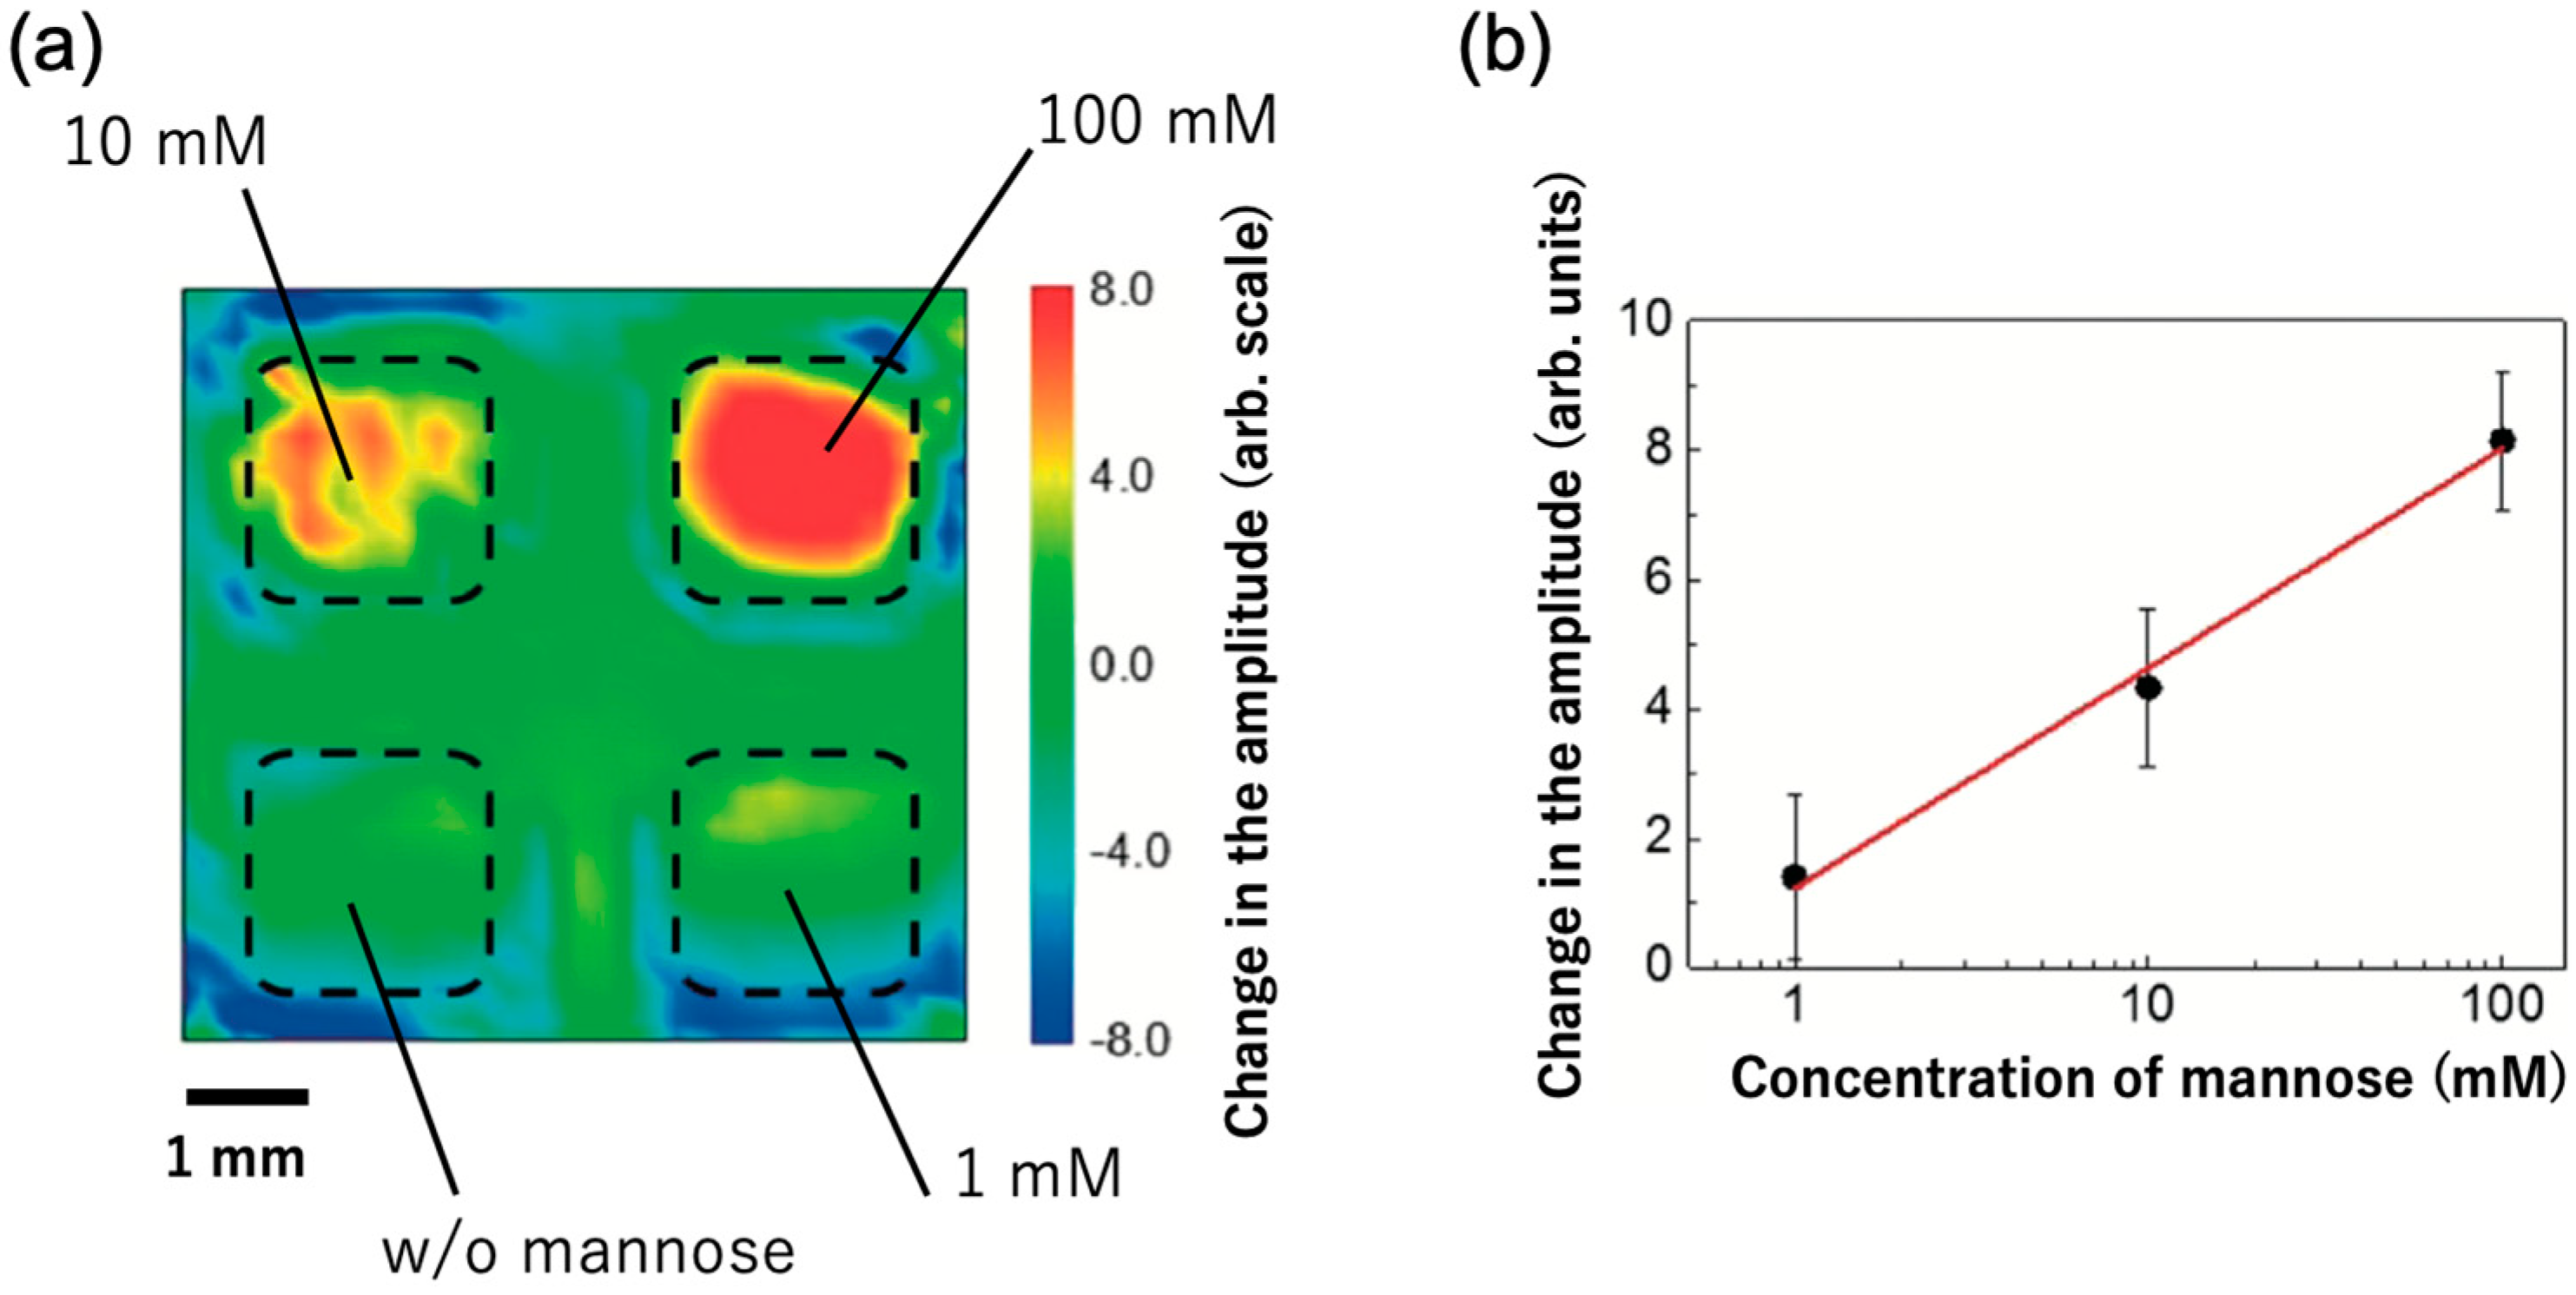
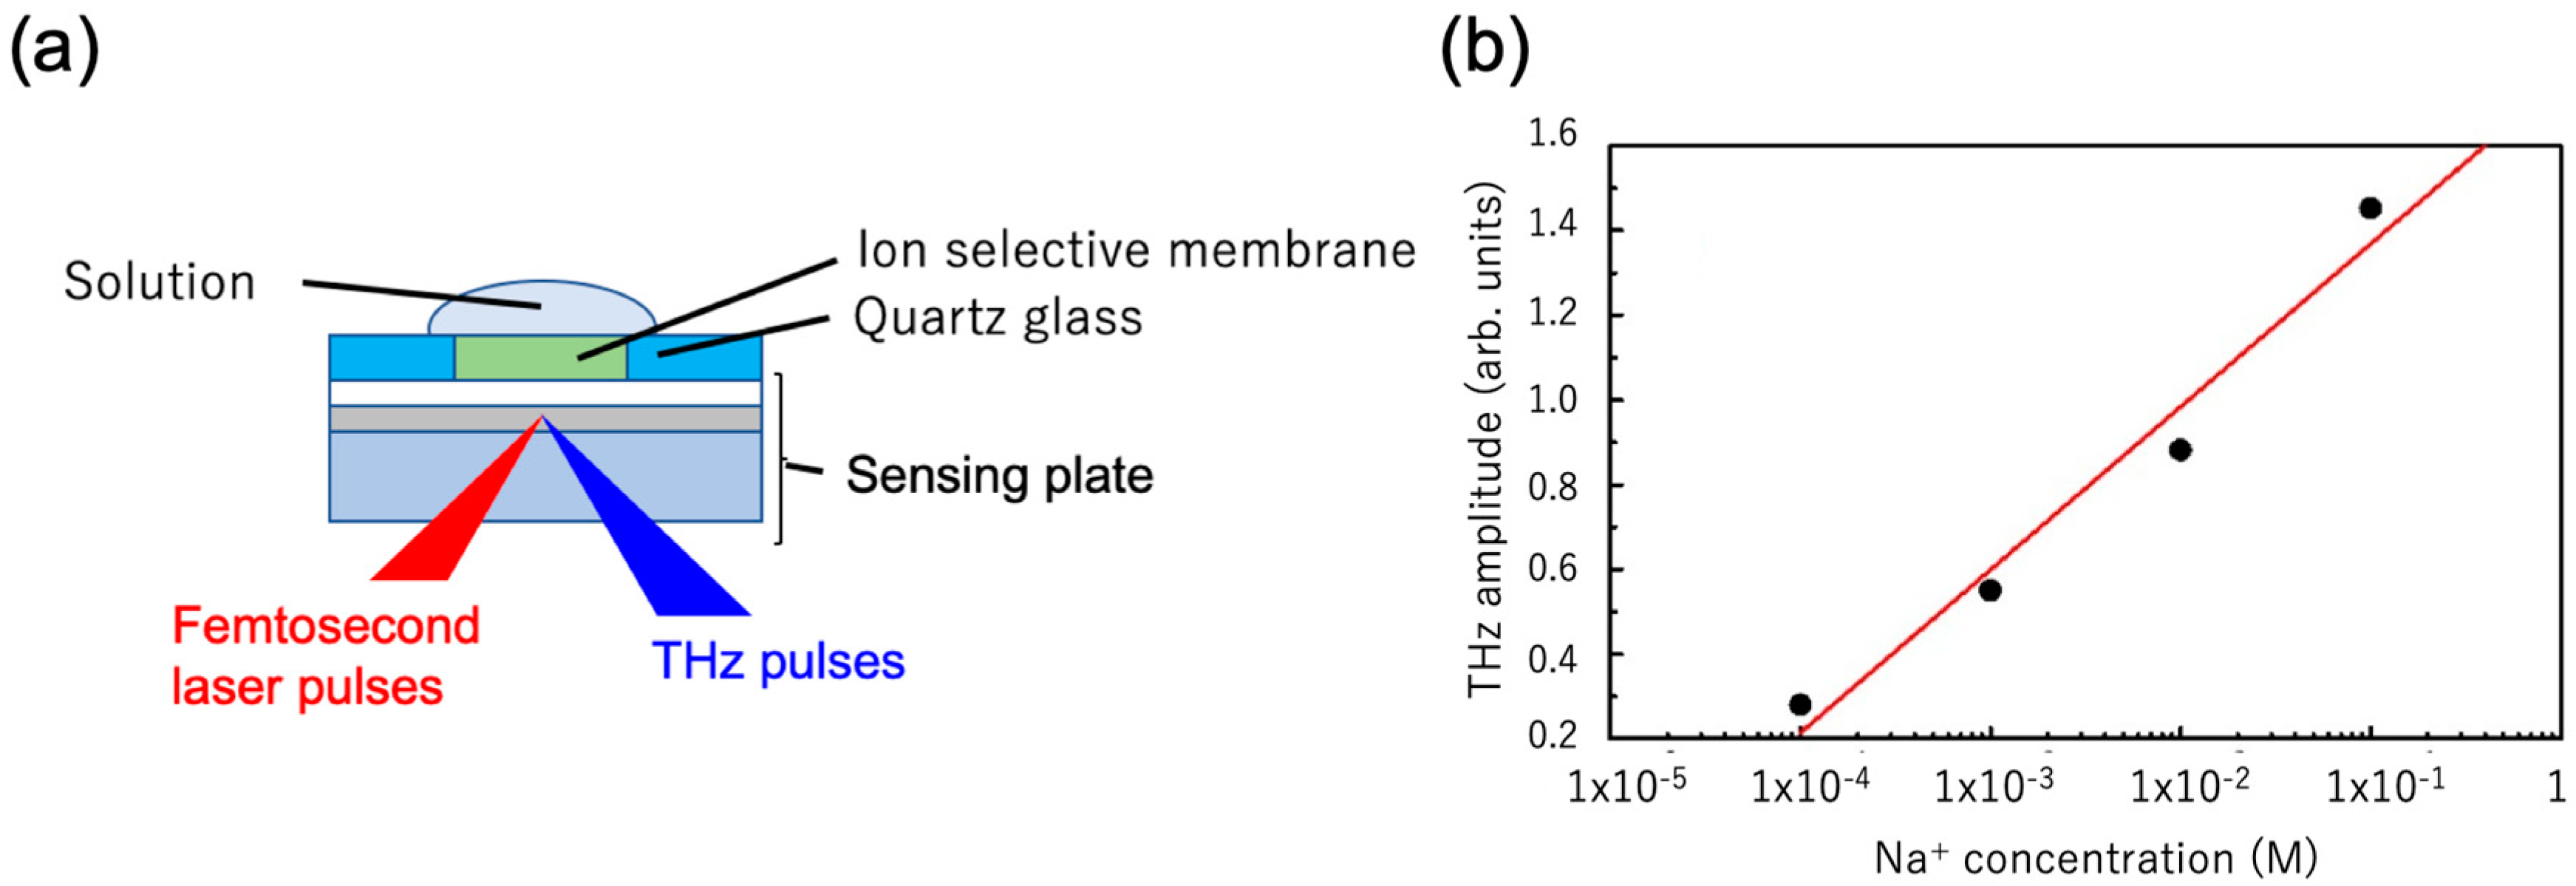
4.2. Ion Measurements

Like the pH measurements, the ion measurements require a specific chemical reaction on the sensing plate. To measure the concretion of sodium ions in buffer solution, the following chemicals were mixed and immobilized as an ion-selective membrane [26] on the sensing plate (see Figure 7a).
  • Polyvinyl chloride (PVC), 30.9 wt.% (Fujifilm Wako Pure Chemicals, Tokyo, Japan)
  • DOA Standard, 67.0 wt.% (99.0 +% (Capillary GC), Fujifilm Wako Pure Chemicals, Tokyo, Japan)
  • ETH 2120, 1.8 wt.% (≥98.0%(HPLC), Sigma–Aldrich, Saint-Louis, CA, USA)
  • Sodium tetraphenylborate, 0.3 wt.% (≥99.5%, Sigma–Aldrich, Saint-Louis, CA, USA)
  • Tetrahydrofuran (THF), 1.0 mL (99.5 +%(mass/mass) (GC), Fujifilm Wako Pure Chemical, Tokyo, Japan)
Because the medium contained ETH2120, sodium ions were selectively taken into the membrane. Therefore, the electric potential beneath the membrane responded to the changing concentration of sodium ions in the solution on the membrane. The electric potential and ion concentration are related by Equation (2), which derives from the change in the Gibbs free energy associated with the electrochemical transformation. Figure 7b plots the THz amplitude as a function of sodium-ion concentration in the solution during femtosecond laser illumination beneath the ion-selective membrane. The amplitude of the THz pulses increased as the ion concentration increased from 1 × 10⁻⁴ M to 1 × 10⁻¹ M. The sensitivity (estimated from the slope of the linear line) was 0.38/decade and the volume of the measured solution was 470 nL. Currently, we are further reducing the solution volume by fabricating smaller ion-selective membranes.

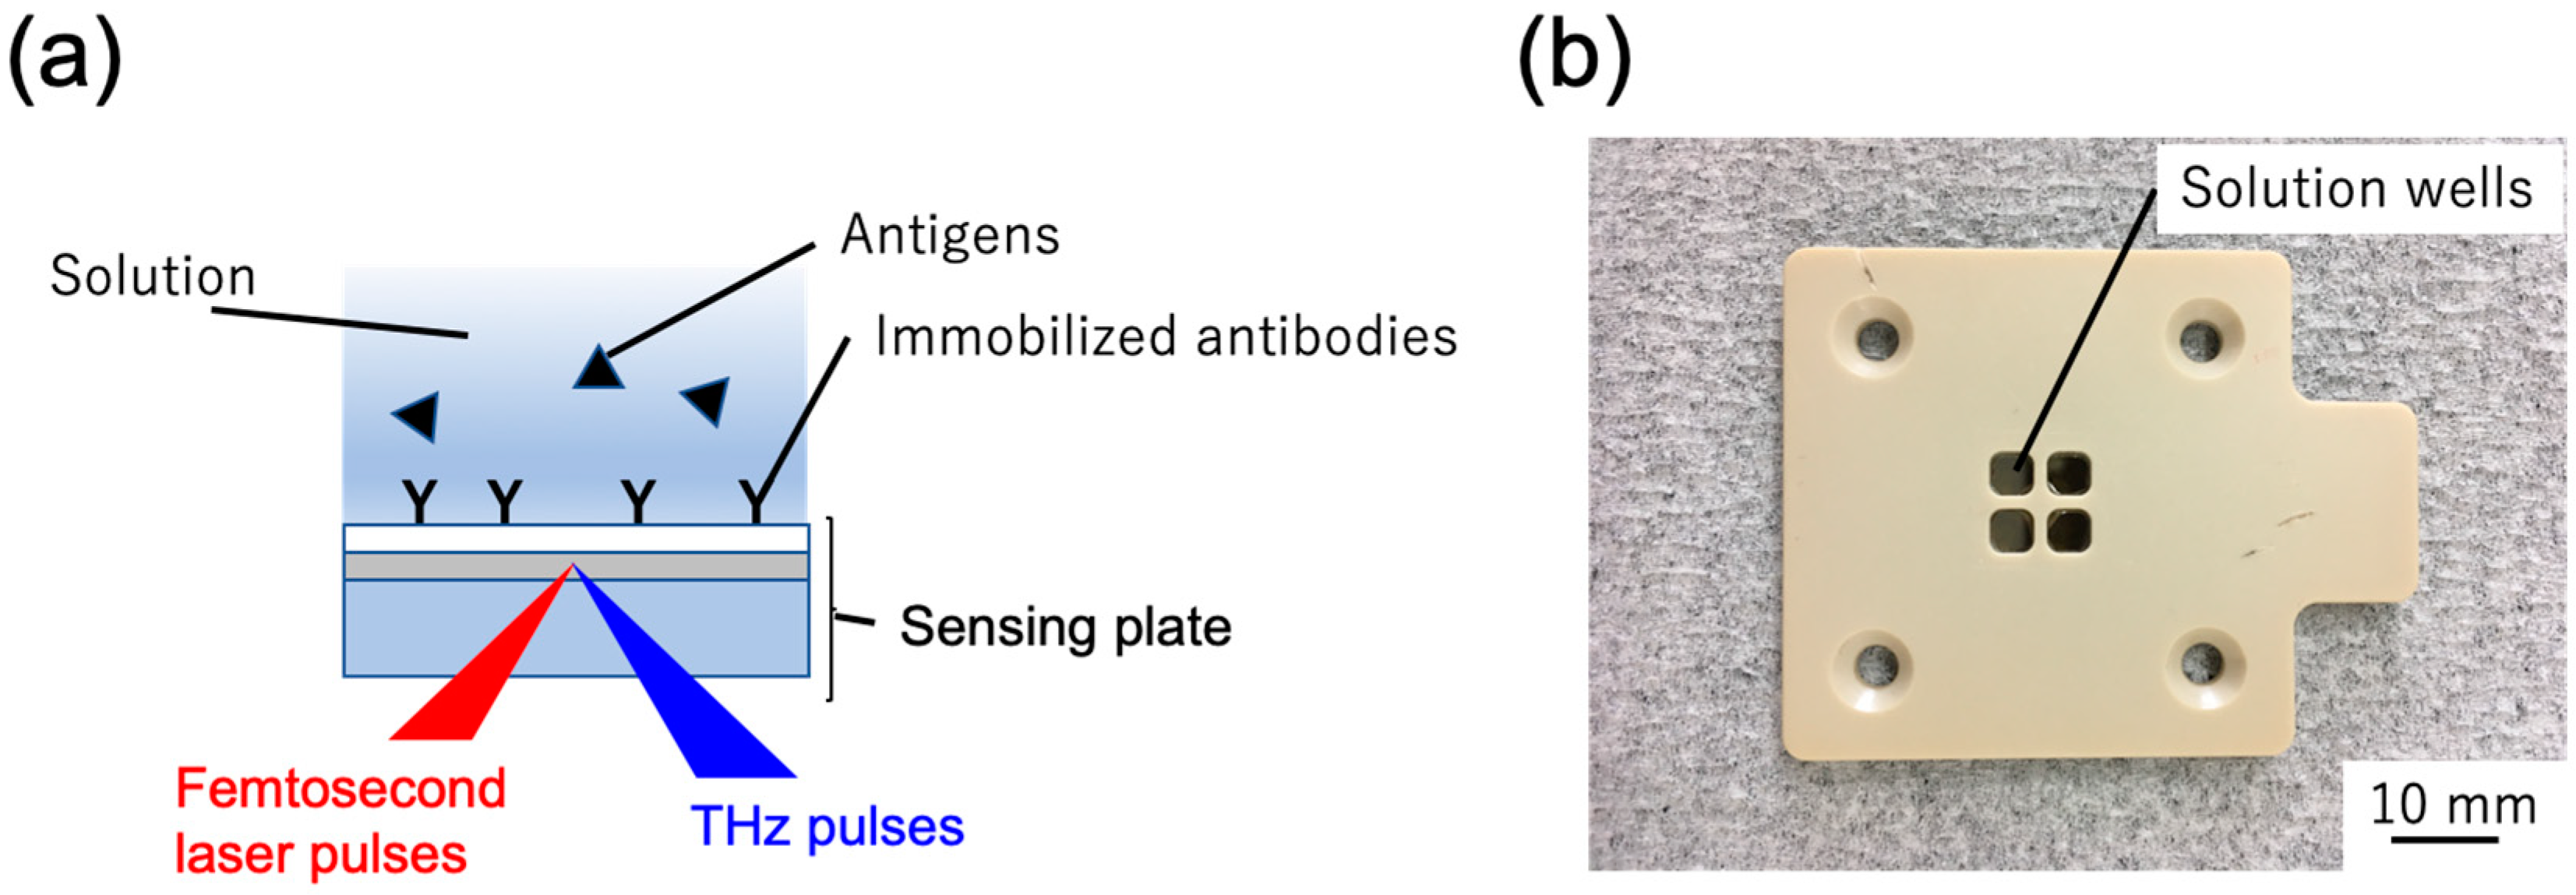
4.3. Measurement of Immune Reactions

To demonstrate different types of ion chemical reactions, this subsection presents the results of immune reactions. The sensitivity of the method based on surface plasmon resonance (SPR) depends on the molecular weight of the antigens reacted with the antibody, but the sensitivity of TCM is expected not to exhibit this dependency [23].
Figure 8a is a cross-sectional schematic of the sensing plate with antibodies on the surface of the sensing plate and Figure 8b is a photograph of the solution wells filled with the antigens. The antibodies were immobilized on the surface of the sensing plate by a covalent binding method [27]. First, the SiO2 thin film surface was modified with ester groups using 2-(carbomethoxy)ethyltri-chlorosilane (CMETS, Fujifilm Wako Pure Chemicals, Tokyo, Japan). The COOH-modified SiO2 surface was formed with 35% HCl solution (Fujifilm Wako Pure Chemicals, Tokyo, Japan) and the latter was activated by the amine coupling reaction using N-hydroxy-succinimide (NHS) (Fujifilm Wako Pure Chemicals, Tokyo, Japan) and 1-ethyl-3-(3-dimethylamino-propyl)-carbodiimide hydrochloride (EDC; Fujifilm Wako Pure Chemicals, Tokyo, Japan). The sensing plate was then soaked in a solution of antibodies, which became immobilized on the sensing-plate surface. To prevent the nonspecific binding of mannose to the SiO2 surface, the sensing plate was dipped in 4-(2-hydroxyethyl)-1-piperazineethanesulfonic acid (HEPES) solution containing 2-aminoethanol (Tokyo Kasei, Tokyo, Japan) at pH 8.5.
Antigen solutions were inserted in four wells fabricated from engineering plastic and attached on the sensing plate. Each well was 3 × 3 mm2 in area and 3 mm deep. The immobilized antibody was concanavalin A (Con A, purified by sodium dodecyl sulfate-polyacrylamide gel electrophoresis (SDS-PAGE), Vector Lab. Inc., Burlingame, CA, USA). The antibody concentration was 1 µM.
Figure 9a shows the amplitude changes in the THz pulses before and after the immune reaction. The antibody solution was D-(+)-Mannose (Man, Fujifilm Wako Pure Chemicals, Tokyo) in HEPES. The concentrations pointed by arrows in Figure 9a are the mannose concentrations in the wells (delineated by dashed lines). Figure 9b plots the amplitude changes as a function of the mannose concentration in the wells on the sensing plate. The sensitivity (calculated by linearly fitting the data points) was 3.3 mV/dec. In general, the sensitivity is changed by changing the alignment of the laser and the laser conditions, so wells containing reference solutions must be integrated into the sensing plate for calibration [22]. The error bars are the standard deviations of the amplitudes in each well. The average standard deviation was 2.4 mV, rather large relative to the sensitivity, but could be improved by improving the signal-to-noise ratio of the THz detectors. The amplitude change increased by increasing the mannose concentration in the dropped solution because the immune reactions conjugated the Con A and Man, thereby altering the electric potential at the surface of the sensing plate. The typical noise level of the obtained THz amplitude was approximately 0.3 mV and the detection limit was calculated as 0.3 mM by extrapolating the linear data fitting.
These results indicate that mannose concentration can be quantitatively measured by immobilizing Con A on the sensing plate surface. Note that the molecular weight of Man is approximately 180, much lower than the molecular weights of conventional proteins, so is not easily measured by conventional SPR systems.

5. Conclusions

TCM was proposed and developed as an advanced system of LTEM. TCM visually reveals various types of chemical reactions, pH values and ion concentrations as amplitude maps of THz pulses radiated from the sensing plate. The small sample volumes (16 nL for pH and 470 nL for sodium ions in the present study) were achieved by fabricating micro-wells on the sensing plate. Next, the immune reactions between concanavalin A antibody and mannose were assayed. The sensitivity, calculated by linearly fitting the data, was 3.3 mV/dec. These results demonstrate TCM as an excellent candidate for visualizing and measuring chemical reactions in the solution, offering a potentially useful tool for medical science, biology and chemistry.

Author Contributions

Conceptualization, T.K. (Toshihiko Kiwa); methodology, T.K. (Toshihiko Kiwa), H.N. and M.K.; investigation, T.K. (Toshihiko Kiwa), T.K. (Tatsuki Kamiya), T.M., K.F., Y.M., Y.A., M.I., T.K. (Taihei Kuroda).; resources, T.K. (Toshihiko Kiwa); K.S.; data curation, T.K. (Toshihiko Kiwa); writing—original draft preparation, T.K. (Toshihiko Kiwa); writing—review and editing, T.K. (Toshihiko Kiwa); visualization, T.K. (Toshihiko Kiwa); supervision, T.K. (Toshihiko Kiwa); project administration, K.T.; funding acquisition, T.K. (Toshihiko Kiwa).

Funding

This work was partially supported by JSPS KAKENHI Grant Number 16H03887.

Conflicts of Interest

The authors declare no conflict of interest.

References

  1. Auston, D.H.; Glass, A.M. Optical generation of intense picosecond electrical pulses. Appl. Phys. Lett. 1972, 20, 398–399. [Google Scholar] [CrossRef]
  2. Auston, D.H. Picosecond optoelectronic switching and gating in silicon. Appl. Phys. Lett. 1975, 26, 101–103. [Google Scholar] [CrossRef]
  3. Tonouchi, M. Cutting-edge terahertz technology. Nat. Photonics 2007, 1, 97–105. [Google Scholar] [CrossRef]
  4. Exter, M.; Fattinger, C.; Grischkowsky, D. Terahertz time-domain spectroscopy of water vapor. Opt. Lett. 1989, 14, 1128–1130. [Google Scholar] [CrossRef] [PubMed]
  5. Jepsen, P.U.; Cooke, D.G.; Koch, M. Terahertz spectroscopy and imaging—Modern techniques and applications. Laser Photonics Rev. 2011, 5, 124–166. [Google Scholar] [CrossRef]
  6. Fischer, B.M.; Walther, M.; Jepsen, P.U. Far-infrared vibration modes of DNA components studied by terahertz time-domain spectroscopy. Phys. Med. Biol. 2002, 47, 3807–3814. [Google Scholar] [CrossRef] [PubMed]
  7. Whitmire, S.E.; Wolpert, D.; Markelz, A.G.; Hillbrecht, J.R.; Galan, J.; Brige, R.R. Protein Flexbility and Conformation State: A Comparison of Collective Vibrational Modes of Wild-Type and D96N Bacteriorhodopsin. Biophys. J. 2003, 85, 1269–1277. [Google Scholar] [CrossRef]
  8. Tonouchi, M.; Yamashita, M.; Hangyo, M. Vortex penetration in YBCO thin film strip observed by THz radiation imaging. Phys. B 2000, 284–288, 853–854. [Google Scholar] [CrossRef]
  9. Yamashita, M.; Tonouchi, M.; Hangyo, M. Visualization of supercurrent distribution by THz radiation mapping. Phys. B 2000, 284–288, 2067–2068. [Google Scholar] [CrossRef]
  10. Sotome, M.; Kida, N.; Horiuchi, S.; Okamoto, H. Terahertz radiation imaging of ferroelectric domain topography in room-temerature hjydorogen-bonded supermolecular ferroelectrics. ACS Photonics 2015, 2, 1373–1383. [Google Scholar] [CrossRef]
  11. Kiwa, T.; Tonouchi, M.; Yamashita, M.; Kawase, K. Laser terahertz-emission microscope for inspecting electrical faults in integrated circuits. Opt. Lett. 2003, 28, 2058–2060. [Google Scholar] [CrossRef] [PubMed]
  12. Yamashita, M.; Kawase, K.; Otani, C.; Kiwa, T.; Tonouochi, M. Imaging of large-scale integrated circuits using laser terahertz emission microscopy. Opt. Exp. 2005, 13, 115–120. [Google Scholar] [CrossRef]
  13. Kiwa, T.; Tsukada, K.; Suzuki, M.; Tonouchi, M.; Migitaka, S.; Yokosawa, K. Laser terahertz emission system to investigate hydrogen gas sensors. Appl. Phys. Lett. 2005, 86, 261102. [Google Scholar] [CrossRef]
  14. Murakami, H.; Uchida, N.; Inoue, R.; Kim, S.; Kiwa, T.; Tonouchi, M. Laser terahertz emission microscope. Proc. IEEE 2007, 95, 1646–1657. [Google Scholar] [CrossRef]
  15. Klarskov, P.; Kim, H.; Colvin, V.L.; Mittleman, D.M. Nanoscale Laser Terahertz Emission Microsocpy. ACS Photonics 2017, 4, 2675–2680. [Google Scholar] [CrossRef]
  16. Kiwa, T.; Oka, S.; Kondo, J.; Kawayama, I.; Yamada, H.; Tonouchi, M.; Tsuakda, K. A Terahertz Chemical Microscope to Visualize Chemical Concentrations in Microfluidic Chips. Jpn. J. Appl. Phys. 2007, 46, 41–44. [Google Scholar] [CrossRef]
  17. Kiwa, T.; Kondo, J.; Oka, S.; Kawayama, I.; Yamada, H.; Tonouchi, M.; Tsukada, K. Chemical sensing plate with a laser-terahertz monitorins system. Appl. Opt. 2008, 37, 3324–3327. [Google Scholar] [CrossRef]
  18. Kiwa, T.; Kamiya, T.; Morimoto, T.; Sakai, K.; Tsukada, K. pH measurments in 16-nL-volume solutions using terahetz chemical microscopy. Opt. Exp. 2018, 26, 8232–8238. [Google Scholar] [CrossRef]
  19. Akimune, K.; Okawa, Y.; Sakai, K.; Kiwa, T.; Tsukada, K. Multi-ion sensing of buffer solutions using terahertz chemical microscopy. APEX 2014, 7, 122401. [Google Scholar] [CrossRef]
  20. Kiwa, T.; Kondo, Y.; Minami, Y.; Kawayama, I.; Tonouchi, M.; Tsukada, K. Terahertz chemical microscope for label-free detection of protein complex. Appl. Phys. Lett. 2010, 96, 211114. [Google Scholar] [CrossRef]
  21. Kiwa, T.; Tenma, A.; Takahashi, S.; Sakai, K.; Tsukada, K. Label free immune assay using terahertz chemical microscope. Sens. Actuators B 2013, 187, 8–11. [Google Scholar] [CrossRef]
  22. Kiwa, T.; Sakai, K.; Tsuakada, K. Stabilization method for signal drifts in terahertz chemical microscopy. Opt. Exp. 2014, 22, 1330–1335. [Google Scholar] [CrossRef] [PubMed]
  23. Kuwana, T.; Ogawa, M.; Sakai, K.; Kiwa, T.; Tsukada, K. Label-free detection of low-molecular-weight samples using a terahertz chemical microscope. APEX 2016, 9, 042401. [Google Scholar] [CrossRef] [Green Version]
  24. Kiwa, T.; Hagiwara, T.; Shinomiya, M.; Sakai, K.; Tsukada, K. Wrok function shifts of catalytic metals under hydrogen gas visualized by terahertz chemical microscopy. Opt. Exp. 2012, 20, 11637–11642. [Google Scholar] [CrossRef] [PubMed]
  25. Zhang, X.-C.; Hu, B.B.; Darrow, J.T.; Auston, D.H. Generation of femtosecond electromagnetic pulses from semiconductor surfaces. Appl. Phys. Lett. 1990, 56, 1011. [Google Scholar] [CrossRef]
  26. Tsukada, K.; Sebata, M.; Miyahara, Y.; Miyagi, H. Long-life multiple-ISFETS with polymeric gates. Sens. Actuators 1989, 18, 329–336. [Google Scholar] [CrossRef]
  27. Tero, R.; Misawa, N.; Watanabe, H.; Yamamura, S.; Nambu, S.; Nonogaki, Y.; Urisu, T. Fabrication of avidin single molecular layer on silicon oxide surfaces and formation of tethered lipid bilayer membranes. e-J. Surf. Sci. Nanotechnol. 2005, 3, 237–243. [Google Scholar] [CrossRef]
Figure 1. Schematic of the sensing plate. The sensing plate consists of a Si thin film sandwiched between a SiO2 thin film and a sapphire substrate. Femtosecond laser pulses penetrate the sensing plate, generating THz pulses in the Si thin film. The amplitude of the THz pulses depends on the chemical reactions on the surface of the sensing plate.
Photonics 06 00010 g001
Figure 2. Energy band diagram of the sensing plate. The conduction and valence bands of the Si thin film are slightly bent near the Si–SiO2 boundary, forming a natural depletion field near the edge of the Si film. When a chemical reaction shifts the electric potential on the sensing-plate surface, it simultaneously changes the magnitude of the depletion field.
Photonics 06 00010 g002
Figure 3. Relation between the electric potential on the sensing-plate surface and the amplitude of the radiated THz pulses. (a) Schematic of the Ti electrode on the sensing plate; (b) amplitude of the THz pulses as a function of the applied voltage. The black line is the best linear fit to the data.
Photonics 06 00010 g003
Figure 4. Schematic of the optical setup of the TCM.
Photonics 06 00010 g004
Figure 5. Photograph of the prototype TCM.
Photonics 06 00010 g005
Figure 6. (a) Cross-sectional schematic and (b) photograph of the microflow channel on the sensing plate. (c) Microflow channel in (b) superimposed with the distribution of THz radiation from the sensing plate. The color scale is normalized by the maximum amplitude in the image.
Photonics 06 00010 g006
Figure 7. (a) Cross-sectional schematic of the sensing plate with an ion-selective membrane on the surface. The solution containing sodium ions was dropped onto the membrane. (b) THz pulse amplitude versus sodium-ion concentration in the solution during femtosecond laser illumination beneath the ion-selective membrane. The red line is the linear best fit to the data.
Photonics 06 00010 g007
Figure 8. (a) Cross-sectional schematic of the sensing plate with antibodies on the surface of the sensing plate and (b) photograph of the solution wells filled with the antigens. Four wells were fabricated on the sensing plate.
Photonics 06 00010 g008
Figure 9. Amplitude changes in the THz pulses before and after the immune reaction. (a) Amplitude map (dashed lines indicate the well edges) and (b) amplitude change versus concentration of mannose dropped into the wells on the sensing plate.
Photonics 06 00010 g009

