Article

Phase-Insensitive Scattering of Terahertz Radiation

1
School of Engineering and Physical Sciences, SUPA, Heriot-Watt University, Edinburgh EH14 4AS, UK
2
Max Planck Institute for the Science of Light (MPL), D-91058 Erlangen, Germany
3
Department of Physics and Solid State Institute, Technion, Haifa 32000, Israel
4
Centre de Physique Théorique CNRS, École Polytechnique, F-91128 Palaiseau, France
5
INRS-EMT, 1650 Blvd. Lionel-Boulet, Varennes, QC J3X 1S2, Canada
6
Institute of Fundamental and Frontier Sciences, University of Electronic Science and Technology of China, Chengdu 610054, China
7
National Research University of Information Technologies, Mechanics and Optics, St. Petersburg 197101, Russia
8
School of Engineering, University of Glasgow, Glasgow G12 8LT, UK
*
Authors to whom correspondence should be addressed.
Photonics 2017, 4(1), 7; https://doi.org/10.3390/photonics4010007
Submission received: 17 November 2016 / Accepted: 25 January 2017 / Published: 31 January 2017
(This article belongs to the Special Issue Ultrafast Photonics and Attosecond Sciences)

Abstract

:
The nonlinear interaction between Near-Infrared (NIR) and Terahertz pulses is principally investigated as a means for the detection of radiation in the hardly accessible THz spectral region. Most studies have targeted second-order nonlinear processes, given their higher efficiencies, and only a limited number have addressed third-order nonlinear interactions, mainly investigating four-wave mixing in air for broadband THz detection. We have studied the nonlinear interaction between THz and NIR pulses in solid-state media (specifically diamond), and we show how the former can be frequency-shifted up to UV frequencies by the scattering from the nonlinear polarisation induced by the latter. Such UV emission differs from the well-known electric field-induced second harmonic (EFISH) one, as it is generated via a phase-insensitive scattering, rather than a sum- or difference-frequency four-wave-mixing process.

1. Introduction

The far-infrared spectral region suffered for years from the lack of adequate sources and detectors—a fact that led the community to identify this evident underdevelopment as the THz Gap. The potential impact of THz photonics on fields such as bio-imaging, pharmaceutical, chemical identification, and security stimulated the research on this topic [1,2], and the THz Gap in now almost closed [3]. To this end, the development of practical THz sources and detectors witnessed in the last two decades played a crucial role. Many techniques for THz detection rely on the nonlinear red interaction of the THz radiation with visible or NIR probe pulses. For instance, the electro-optical effect in second-order nonlinear crystals is at the core of several time-domain spectroscopy setups [4]. Alternatively, third-order nonlinear interactions in centrosymmetric media such as electric field-induced second harmonic generation (EFISH) have been proposed as means to detect infrared radiation [5,6].
A breakthrough in broadband time-domain THz spectroscopy was achieved utilising the low dispersion of air to perform THz coherent detection [7]. This technique, later called air-biased coherent detection (ABCD) [8], relies on the EFISH process, which can be interpreted—in the framework of four-wave-mixing—as the beating between sum- and difference-frequency generation processes [9]. Such beating leads to a phase- and amplitude-modulated signal at the second harmonic of the optical probe. Overlapping this signal to a coherent field at the second-harmonic of the probe pulse, either induced by spectral broadening of the high intensity probe in air [7], by electric field-induced second harmonic generation of the probe via an external DC electric field [8], or by employing a second-order nonlinear crystal [10] leads to coherent detection of the THz field. In a recent publication, we investigated such a four-wave-mixing process in condensed matter (specifically, diamond), demonstrating counter-propagating phase-matched THz–NIR (near infrared) mixing [11].
In this letter, we study the emission spectrum of the interaction between a THz single-cycle field and a NIR pump pulse mediated by the third-order nonlinearity. While at low pump intensities we observe the expected EFISH spectral signature, at high intensities, we observe the appearance of an additional feature in the UV spectral region that hints at the onset of a nonlinear process different from the EFISH. We performed a numerical study of the nonlinear waves dynamics, and we identified the unexpected signal as the result of a phase-insensitive scattering (PI) of the THz from the intense NIR pump [12,13]. These results are in keeping with our previous prediction for the scattering from an effective moving dispersive medium [14].

2. Experiments

We experimentally investigated the nonlinear interaction between intense NIR pulses and THz fields in diamond by recording the spectrum resulting from their nonlinear mixing. The setup employed is sketched in Figure 1a. The NIR pump pulses are delivered at a 100 Hz repetition rate by a Ti:sapphire laser (Advanced Laser Light Source, ALLS, Thales), with 790 nm central wavelength and 40 fs full-width at half-maximum duration. The seed pulse at THz frequencies is generated via two-colour gas ionisation driven by a mid-infrared pump at 1.8 μ m and its second harmonic, as described in Ref. [15]. A set of long pass filters with a cutoff at 20 THz and 10 4 isolation was employed to remove the high-frequency components from the THz pulse (QMC Instruments).
We chose diamond for the nonlinear mixing, mainly because it features high optical transmission over a large spectral region, covering all the bands involved in our experiments (i.e., NIR, UV, and THz). The THz pulse is focused with a 2 inch diameter, 2 inch reflected focal length, gold-coated, 90 deg off-axis parabolic mirror onto a 500 μ m thick, 100 -cut, single crystal diamond sample (Element-6). The THz beam is characterised by scanning the focused region with a THz camera (PV-320, Electrophysics). The mode profile is that of a broadband Bessel–Gauss beam with a ∼85 μ m width, Gaussian apodization, and 13 deg cone-angle. The THz field temporal profile at the parabolic focus was measured with ABCD [8], and resulted in a single cycle sine wave pulse (see Figure 1b) with ∼90 fs duration and ∼5 THz carrier frequency (≃60 μ m wavelength), see Figure 1c. The THz pulse energy was measured by a calibrated pyroelectric detector (Molectron, Coherent), and was ∼1 μ J. The NIR pump pulse is tightly focused with a f = 125 mm fused-silica lens, and is overlapped in space and time to the THz field inside the diamond sample.
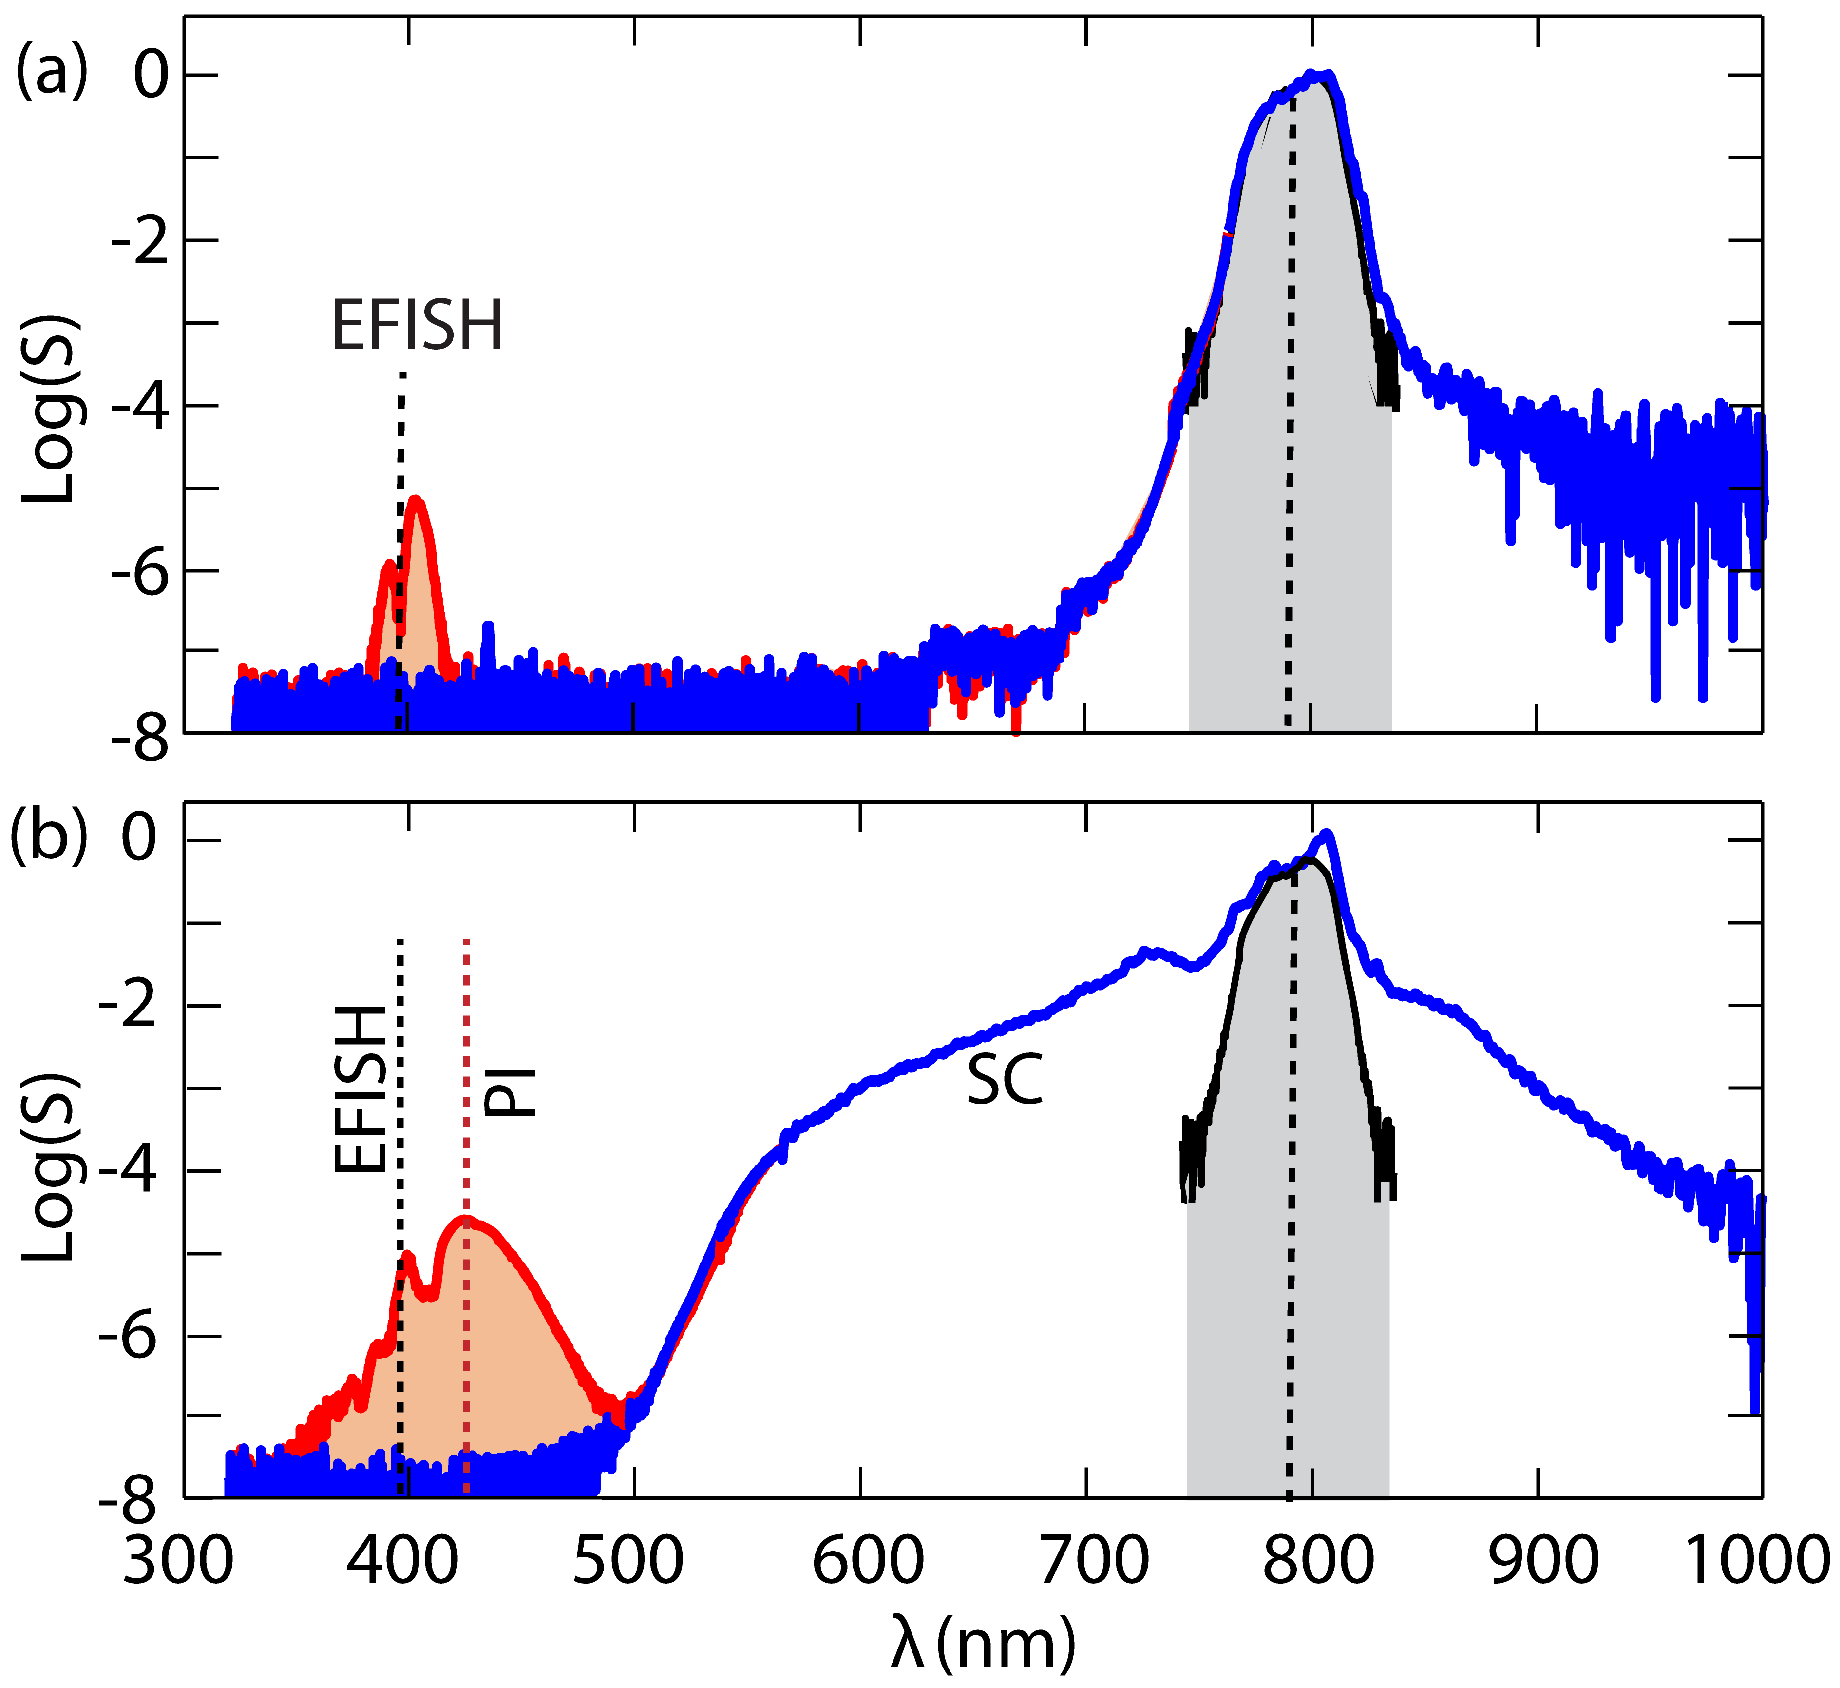
The spectrum of the radiation at the output of the crystal was measured with an imaging spectrometer (Newport MS260i) coupled to a charge-coupled device (CCD) camera (QSI 620). Different neutral density filters have been employed while acquiring data on different portions of the spectrum to enhance the overall dynamic range. The measured spectra recorded for low 3 μ J and high 10 μ J pump energies are shown in Figure 2a,b, respectively. For the low pump energy case, the spectrum is what would be expected from an EFISH process, as can be appreciated considering the spectrally-resolved measurements of the nonlinear wave-mixing in air between the same THz and NIR pulses reported in Ref. [9]. The red curve in Figure 2a shows two spectral lobes around the second harmonic wavelength of the NIR pump, according to:
ω EFISH SF / DF = 2 ω p ± ω seed ,
where SF and DF stand for sum- and difference-frequency, respectively, ω p = 2 π c / λ p , λ p = 790 nm, and ω seed = 2 π 5 THz. We note that the two measured peaks are ≃10 nm apart, whereas the spectral shift predicted for a 5 THz carrier frequency pulse is ≃5 nm. This difference is likely to be due to the limited THz detection bandwidth accessible with the long 40 fs probe pulse, and to phase matching considerations that are not included in Equation (1). Notably, at these low input energies and in the absence of an input THz seed, the pump pulse undergoes minimal nonlinear reshaping, and the output spectrum (blue curve) is still close to that of the input spectrum (black curve in Figure 2a).
On the other hand, when the pump intensity is increased, a strong spectral reshaping occurs, as can be seen by the onset of supercontinuum generation, indicated by SC on the blue curve in Figure 2b. Supercontinuum generation is a signature of strong nonlinear effects, and the blue-shift indicates significant self-steepening [16]. In this regime, a second, more intense peak centred at ∼430 nm appears, and in the following, we provide our interpretation of its physical origin. We note that in the high-energy case, the SF and DF peaks are not spectrally separated, as a consequence of the strong spectral broadening of the intense pump field. In Ref. [14], we have anticipated that the scattering of a THz field from the refractive index induced by the shock-front on an intense NIR pulse propagating in diamond would result in an emission in the UV part of the spectrum. In the following section, we show that the recorded ∼430 nm peak fits with the prediction of that model. Before that, we exclude some of the more trivial effects, such as EFISH and Raman scattering.

Excluded Possible Origins of the UV Signal

  • Fluorescence. We note that although diamond exhibits fluorescence in the analysed UV spectral regions, all the recorded UV signals only appear when the THz field is spatially and temporally overlapped to the 790 nm intense pulse. This observation rules out the possibility that the ≃430 nm signal is originating from a fluorescence process in diamond.
  • Residual THz pump field. The multimesh filters used to remove the 1800 nm field from the THz beam path provide more than 10 4 extinction. Given the low < 10 - 4 efficiency of the THz generation process, it is essential to exclude the possibility that a residual 1800 nm field contributes to the onset of the ≃430 nm signal. To this end, we have first inserted a 1 mm thick CaF 2 window in the THz beam path and searched for evidence of UV radiation. In this case, no EFISH or 430 nm signal were observed. Since CaF 2 is transparent to IR radiation but opaque to THz, we concluded that THz is essential to generate the 430 nm signal. Further, we observed that the UV radiation was visible upon removing the CaF 2 window and inserting a paper filter, which both absorbs and scatters the 1800 nm radiation. We therefore exclude any possible role of a residual 1800 nm field in the generation of the 430 nm signal.
  • EFISH. We note that the 430 nm peak cannot be explained by the EFISH mechanism described above. Indeed, its large shift from 395 nm—the wavelength of the pump second harmonic—cannot be justified by the broadening of the NIR pump pulse spectrum.
  • Raman. Diamond is a well-known Raman-active crystal and has a large R ∼1350 cm - 1 shift. The Raman-mediated wave mixing, ω p + ω p - 2 π c R , gives a product at 417 nm (c is the speed of light). This process is independent of the presence of the THz field, whereas in our measurement, the 430 nm signal only appeared when the THz field was injected in the crystal. Another Raman-mediated four-wave-mixing process that may lead to a signal around 417 nm is ω p + ( ω p - 2 π c R ) ± ω seed . This would require the presence of a Raman peak at ω p - 2 π c R , corresponding to a ∼884 nm wavelength, which does not appear in the recorded spectra. Finally, we note that the EFISH signal has energies <1 pJ, and is too low to directly excite a Raman red-shifted peak.

3. Model

Here we consider the experimental condition where a weak seed and a strong pump co-propagate in a dispersive medium. The temporal dynamics of the two-pulse interaction can be investigated within the framework of the First Born approximation (e.g., Ref [17]). In this case, the result of the interaction is evaluated considering the scattering of the seed pulse from a potential, which is determined by the nonlinear refractive index modification induced by the pump pulse via the Kerr nonlinearity. This description can also be applied in a guided wave geometry [18], and if the two pulses have different frequencies, the weak one may catch up and scatter off the refractive index induced by the intense one. Interestingly, if the refractive index perturbation is such that the seed pulse cannot overcome it, the interaction mimics the physics at an event horizon. This analogy holds for time-invariant pump pulses, such as solitons in an optical fibre [19,20]. However, the horizon physics can be observed in a wider context, such as in optical filamentation [21].
The discussed scattering process leads to a shift of the probe frequency, and is a relevant mechanism for the spectral broadening and the supercontinuum generation at the core of the nonlinear guided-optics research [22,23]. Within this framework, frequency conversion consequent to the interaction of a weak field with a strong solitonic pump has previously been investigated, and is termed phase-insensitive scattering [12,13,24,25,26,27].
The scattering process is favoured for those spectral components that keep the same phase of the input seed across the interaction. This is determined by the momentum conservation:
k ( ω scatter ) - ω scatter / v p = k ( ω seed ) - ω seed / v p ,
where k is the wavevector, ω seed is the weak seed frequency, S indicates the scattered quantities, and the scatterer velocity is that of the pump pulse, v p . Considering the dispersion of diamond k ( ω ) from Ref. [28] and the linear input conditions of the experiment, v p = d k ( ω ) / d ω | ω = ω p - 1 = 0.1228 μ m/fs, Equation (2) is satisfied for λ S = 2 π c / ω scatter 460 nm. This result is obtained neglecting any nonlinear effect that the pump pulse undergoes during the propagation in the diamond, yet the predicted wavelength for the maximum scattering efficiency is remarkably close to the anomalous 430 nm signal measured in the experiment above. To refine this prediction, we performed numerical simulations with a code that solves the nonlinear Maxwell’s equations in (1D + 1) for the total field Ɛ = Ɛ p + Ɛ seed , using the Pseudospectral Space Domain (PSSD) algorithm [29]. Note that Ɛ refers to the complex electric field.

3.1. Nonlinear Maxwell Equation Via Pseudospectral Space Domain Algorithm (1D + 1)

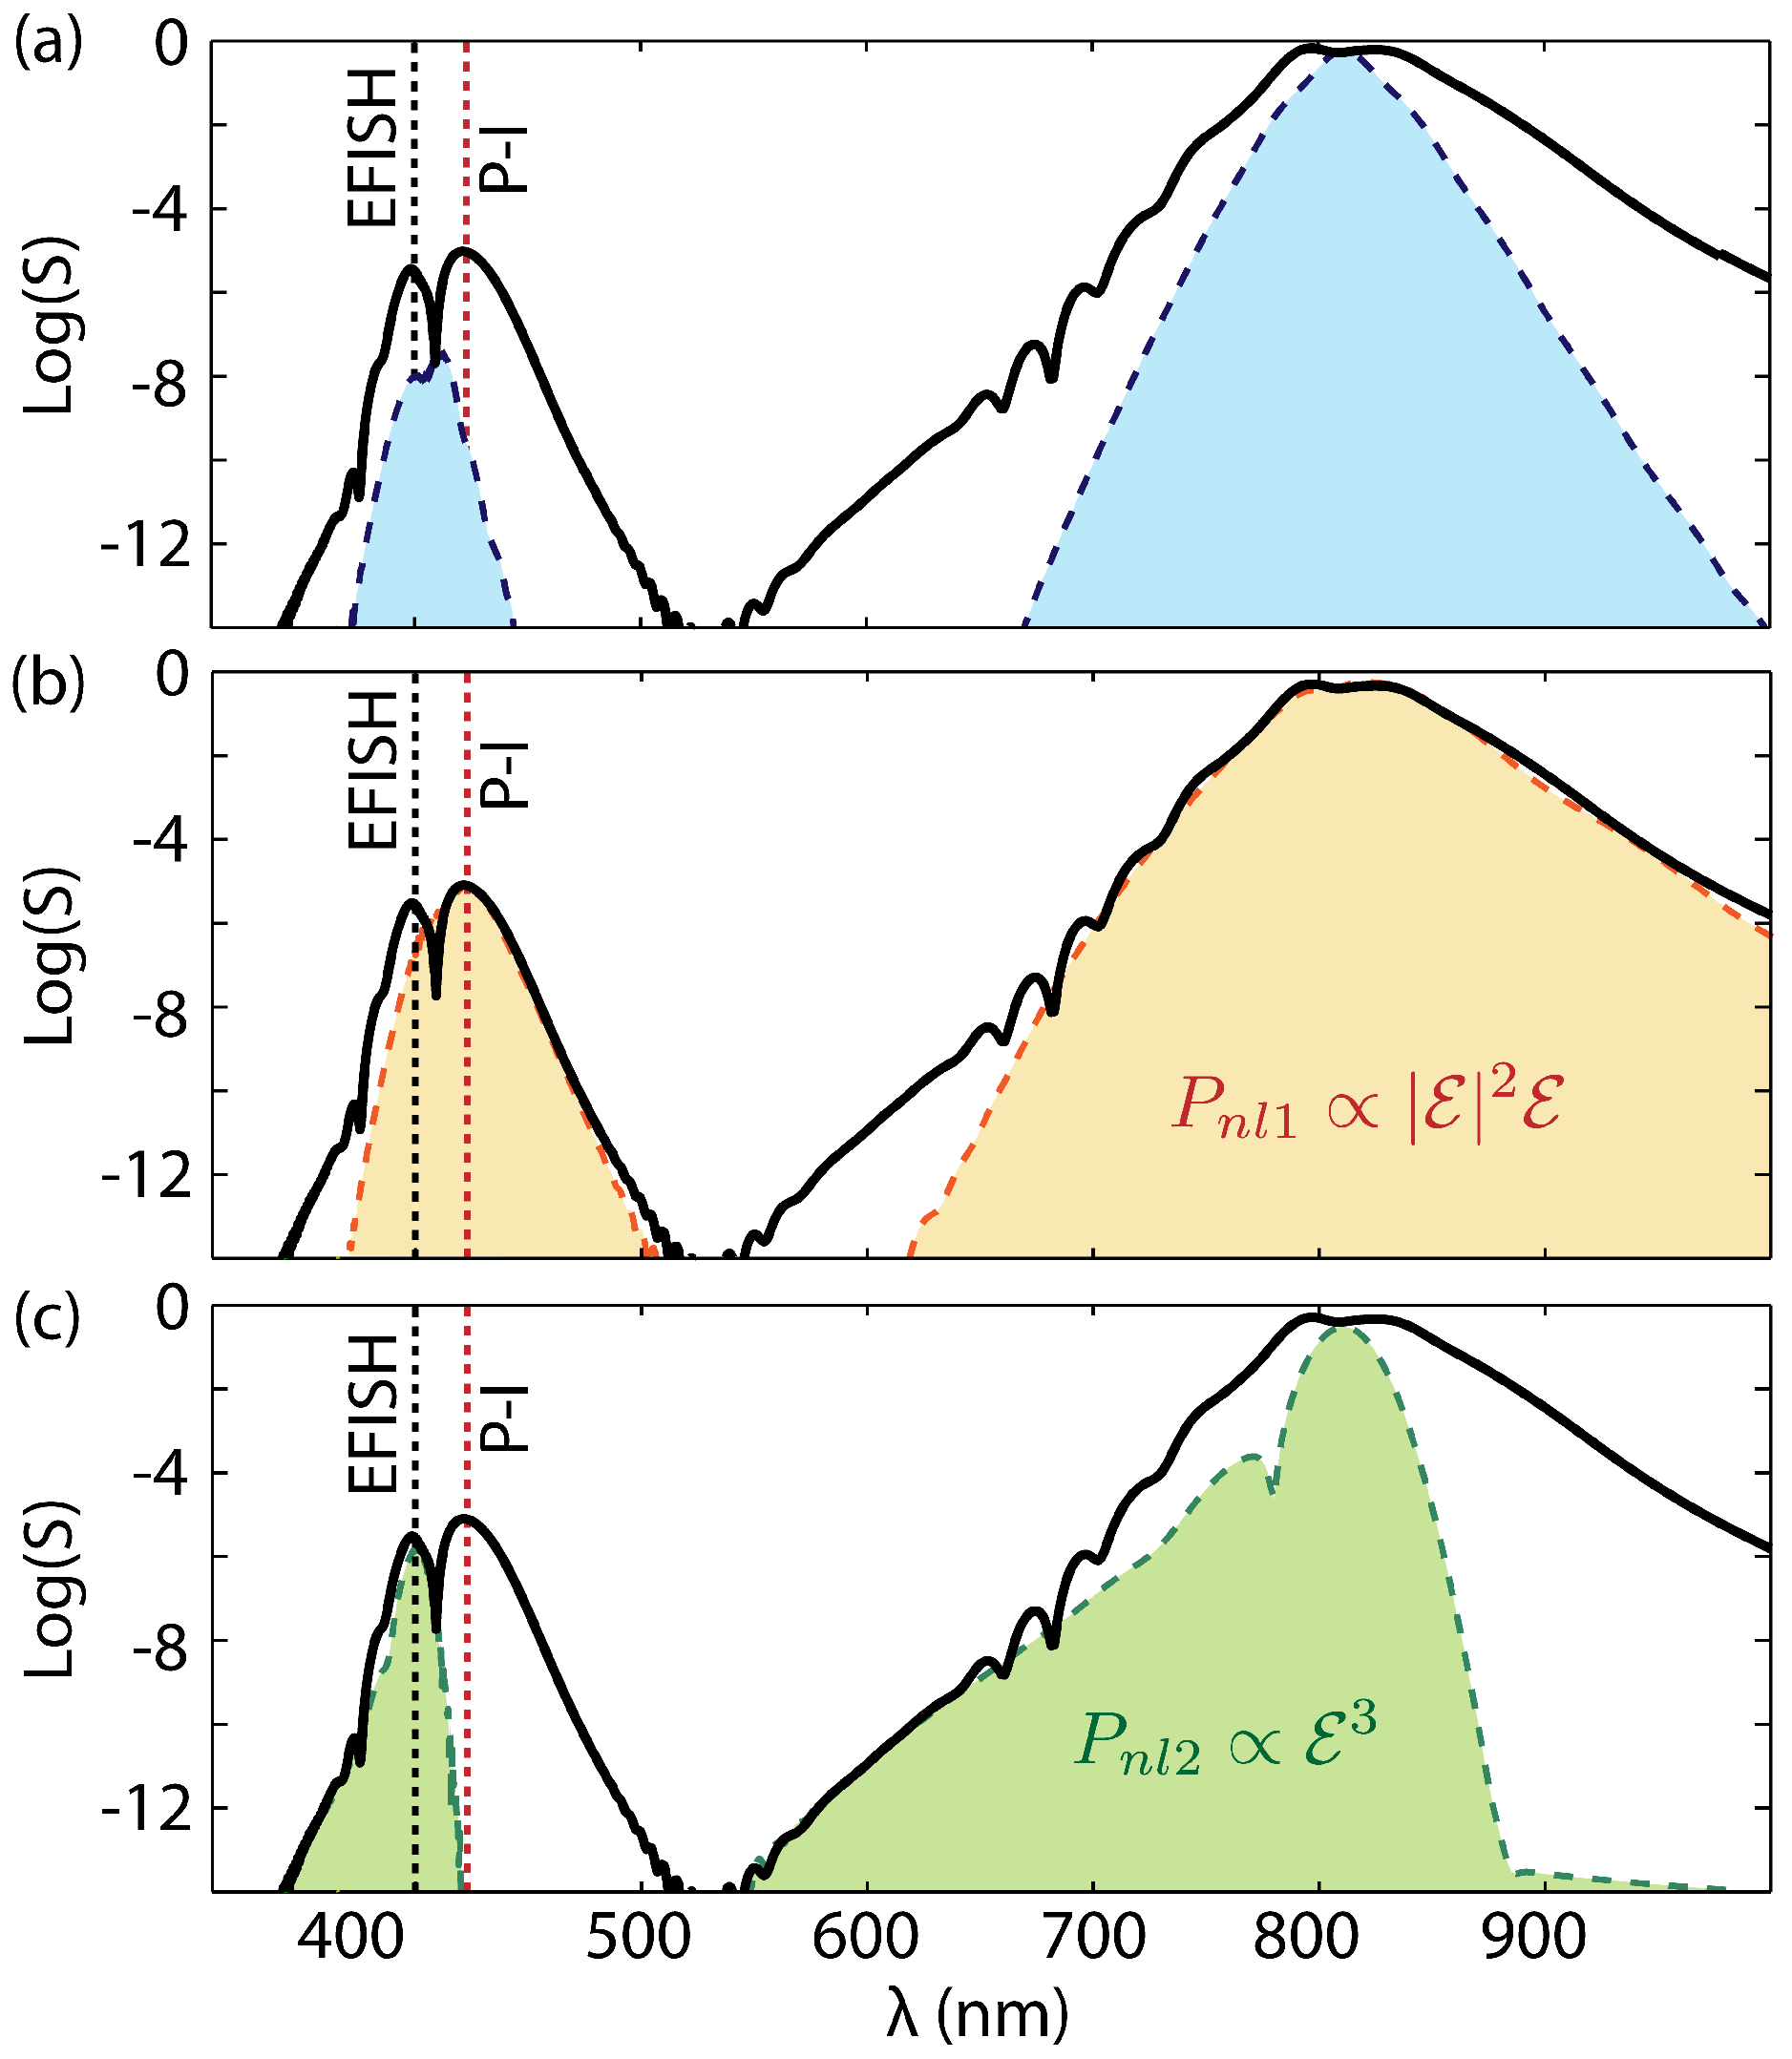
The PSSD approach solves the Maxwell equations for the electric and magnetic fields, considering the fields as functions of time, performing the spatial derivatives in direct space and the temporal derivatives in the Fourier domain. We considered a nonlinear polarisation P n l written in a fashion identical to that presented in Ref. [30] that explicitly separates P n l into two terms: P n l = P n l 1 + P n l 2 . P n l 1 Re | Ɛ | 2 Ɛ is responsible for the phase-insensitive scattering process as well as the difference frequency generation components of the EFISH. P n l 2 Re Ɛ 3 accounts for third harmonic generation and other four-wave mixing effects, including the sum-frequency generation term of the EFISH. Combined together, these terms describe the full plethora of third-order nonlinear effects.
Figure 3a shows the result of these simulations. The light blue shaded area shows the output spectrum for a low pump energy. As can be seen, a weak EFISH signal is observed around the pump second harmonic at ∼395 nm, in keeping with our experimental observations shown in Figure 2a. Here, two photons of the intense pump pulse perform a sum and a difference frequency generation process together with a THz photon, hence generating fields with frequencies centred at the pump second harmonic. The momentum conservation relation for the EFISH process is k EFISH = 2 k p + k seed , while the energy conservation relation is in Equation (1). We stress that these simulations are performed in 1 D + 1 , and therefore are not expected to capture all the details of the measured spectra. Nonetheless, at high pump input energies, they predict the appearance of a broad supercontinuum (SC) which indicates the onset of a shock, and a second peak at ∼430 nm, in addition to the EFISH peak at ∼395 nm, as shown by the black curve in Figure 3a. The spectral position of these peaks agrees with the experiments shown in Figure 2b. To gain insight into the physical mechanism responsible for the 430 nm emission, we performed two sets of simulations for the case of high-energy pump. The first (shown in Figure 3b) is performed only including the term P n l 1 . This term is expected to lead to the generation of the red-shifted part of the EFISH, as well as of the scattered radiation, and indeed matches well the long-wavelength lobe of the UV signal. A second simulation is performed considering only P n l 2 (as shown in Figure 3b), and as expected, matches the blue-end part of the UV spectrum. From these simulations, we can infer that the red-shifted peak observed both in the simulation and in the experiments at ∼430 nm is due either to the difference frequency generation terms of four-wave mixing, or to the phase-insensitive scattering process. To determine which of the two terms is indeed contributing to the measured spectrum, we performed another set of simulations, this time dropping the four-wave mixing terms. In addition, we consider a more general 2D + 1 scenario where only cylindrical symmetry around the propagation axis is assumed.

3.2. Coupled Nonlinear Envelope Equations

We use a numerical model that relies on two coupled nonlinear envelope equations (NEE) describing the propagation of the intense pump laser pulse with frequency ω p coupled with a second THz pulse at frequency ω seed . The coupled NEE are written for the Fourier-transformed envelopes of the fundamental pulse Ɛ ^ p ( δ ω p , r , z ) and the THz pulse Ɛ ^ seed ( δ ω seed , r , z ) , and read as [31]:
Ɛ ^ p z = i 2 2 k p ( ω ) + K p Ɛ ^ p + i n 0 n 2 ω 2 k p ( ω ) c 2 | Ɛ p | 2 Ɛ p ^ ,
Ɛ ^ seed z = i 2 2 k seed ( ω ) + K seed ( ω ) - k Ɛ ^ seed + i 2 n 0 n 2 ω 2 k seed ( ω ) c 2 | Ɛ p | 2 Ɛ seed ^
where n 2 = 1.2 × 10 - 15 cm 2 /W [32], k p ( ω ) = k ( ω p ) + k p δ ω p , K p ( ω ) = k ( ω ) - k p ( ω ) , and similarly for the seed, THz field, k seed ( ω ) = k ( ω seed ) + k seed δ ω seed , K seed ( ω ) = k ( ω ) - k seed ( ω ) , k = k 0 δ ω seed - k ( ω seed ) . The hat ( · ^ ) symbol denotes the time-domain Fourier transform. The frequency variable δ ω is fixed for both pulses by the numerical grid, and represents the departure from ω p and ω seed in Equations (3) and (4), respectively. We note that this model does not account for effects such as the four-wave mixing between the seed THz pulse and the NIR pump, and hence does not capture the EFISH process. It is therefore well-suited to evidence the phase-insensitive scattering effects.
As input for our simulation, we use a 790 nm pump pulse with duration of 40 fs and input energy of 10 μ J. The probe has a wavelength of 60 μ m, duration of 90 fs, and energy of 2 μ J, in accordance with the experimental values.
We introduced a relative delay of 110 fs for the THz field in order to compensate for the difference in group velocities of the two pulses. This delay was optimised so that the THz pulse catches up with the pump pulse after a propagation distance of 300 μ m, corresponding to a position where the pump pulse generated the steepest shock front, which increases the efficiency of the resonant scattering process [33,34].
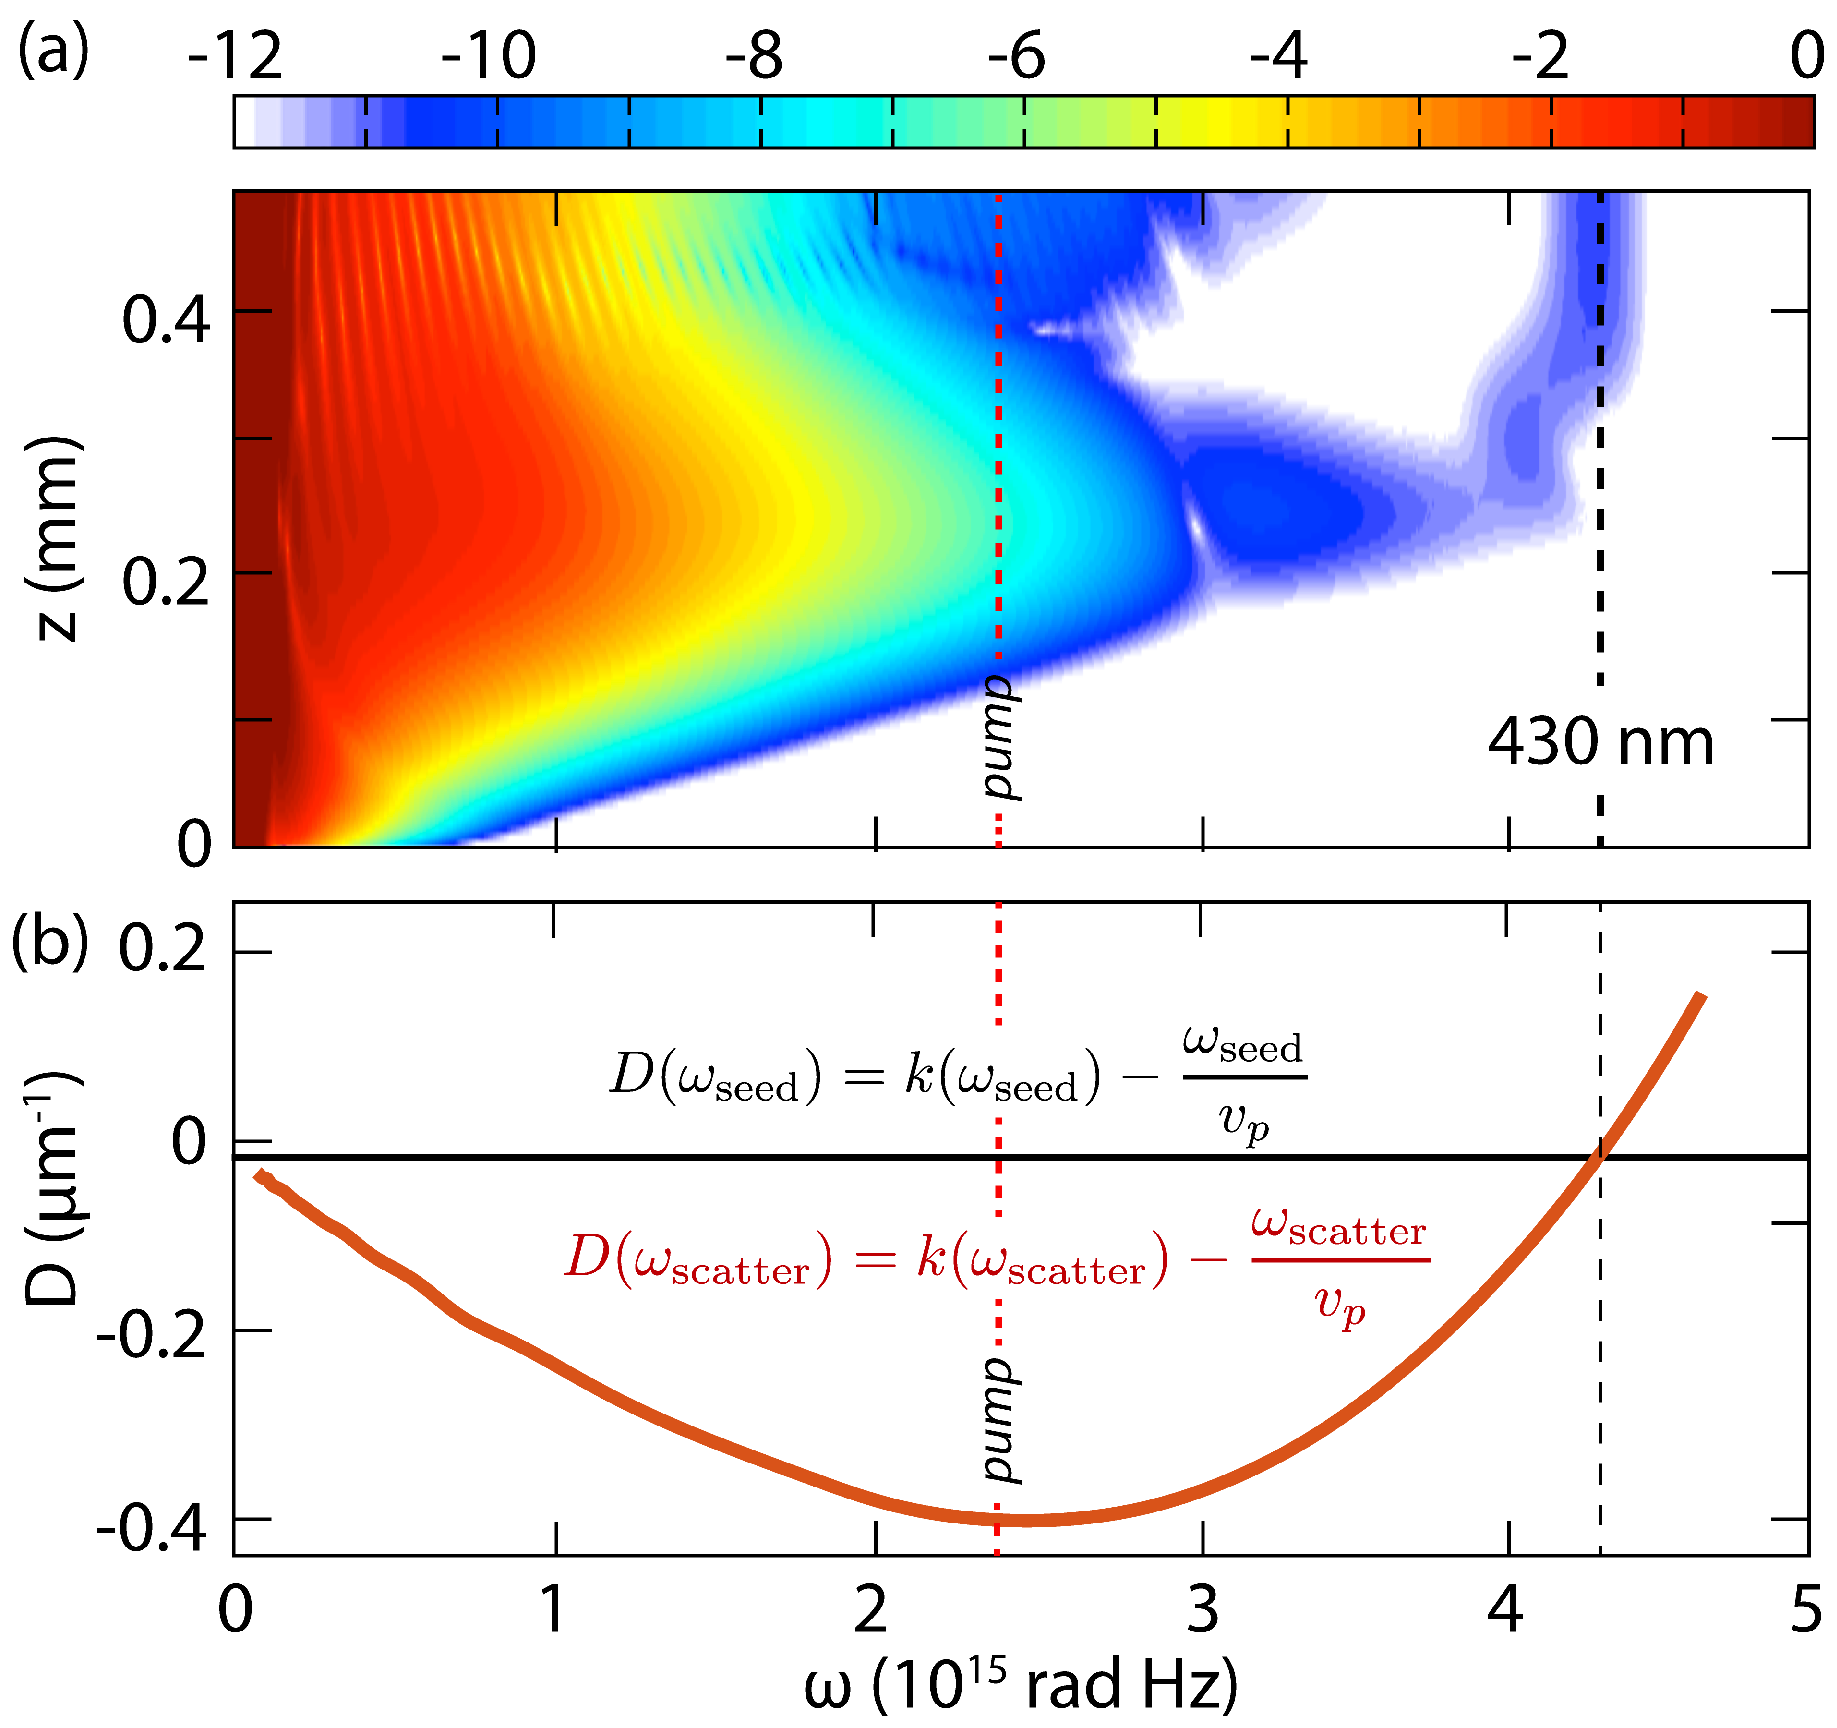
Figure 4a shows in detail the spectral evolution of the THz pulse over the full propagation distance. At z = 0.3 mm, the interaction with the pump pulse induces phase-insensitive scattering. The scattering peak in Figure 4a occurs at a frequency corresponding to 430 nm, in agreement with the simulations performed with the PSSD algorithm, and most importantly, with the experimental observations. This supports the interpretation of the observed peak at 430 nm as a result of phase insensitive scattering of the THz seed off the refractive index perturbation induced by the intense pump. It is worth noting that the numerical simulation in Figure 4a does not include cross-phase modulation induced by the intense 790 nm pulse on the ≃395 nm EFISH signal among the captured physical effects. Furthermore, the amplitude of the ≃430 nm signal is comparable to that of the EFISH, and we are therefore confident to exclude such cross-phase modulation process from the possible sources of the ≃430 nm emission.
To further support this interpretation, we evaluated the velocity of the shock front on the pump pulse as resulted from the 2D + 1 NEE simulations. At the propagation distance at which the scattering occurs (i.e., at ∼300 μ m), the front speed is ∼ 0.1223 μ m/fs. Considering this as the value for the speed of the scattering object, the position of the phase-insensitive scattering peak can be predicted from Equation (2), and is graphically shown in Figure 4a, where we plot the dispersion D = k ( ω scatter ) - ω scatter v p (red curve), while the black horizontal line is by D = k ( ω seed ) - ω seed / v p . There is an excellent correspondence between the predicted and numerically observed spectral peaks, thus confirming our interpretation of the 430 nm peak as phase-insensitive scattering.

4. Conclusions

Frequency conversion of THz radiation in the UV spectral range can be accomplished via EFISH, and it provides a mean for the detection of far-infrared radiation. Here we have shown that, under appropriate conditions, an additional effect contributes to the frequency conversion; namely, phase-insensitive scattering. This effect belongs to the cross-phase modulation family rather than to the frequency mixing processes that accompany the third-order nonlinearity.

Acknowledgments

D.F. acknowledges financial support from the European Research Council under the European Union’s Seventh Framework Programme (FP/2007-2013)/ERC GA 306559 and EPSRC (UK, Grant EP/J00443X/1). M.C. acknowledges the support from the People Programme (Marie Curie Actions) of the European Union’s Seventh Framework Programme (FP7/2007-2013) GA 299522 and from EPSRC (EP/P009697/1). N.W. acknowledges support from the EPSRC CM-CDT Grant No. EP/L015110/1. R.M. gratefully acknowledges support by NSERC (Strategic Grant Program), MESI (PSR-SIIRI Grant Program) and FQRNT (Equipe Grant Program) in Canada. The authors wish to acknowledge the technical support from the staff of the ALLS (Advanced Laser Light Source) facility, from M. Peccianti and from B. Schmidt. M.C. gratefully acknowledges the support of B.L.M. SpA. The dataset which underpins this publication is available at http://dx.doi.org/10.5525/gla.researchdata.373.

Author Contributions

All the authors equally contributed to the development of the work and the writing of the manuscript.

Conflicts of Interest

The authors declare no conflict of interest. The founding sponsors had no role in the design of the study; in the collection, analyses, or interpretation of data; in the writing of the manuscript, and in the decision to publish the results.

References

  1. Federici, J.F.; Schulkin, B.; Huang, F.; Gary, D.; Barat, R.; Oliveira, F.; Zimdars, D. THz imaging and sensing for security applications—Explosives, weapons and drugs. Semicond. Sci. Technol. 2005, 20, S266–S280. [Google Scholar] [CrossRef]
  2. Wallin, S.; Pettersson, A.; Östmark, H.; Hobro, A. Laser-based standoff detection of explosives: A critical review. Anal. Bioanal. Chem. 2009, 395, 259–274. [Google Scholar] [CrossRef] [PubMed]
  3. Tonouchi, M. Cutting-edge terahertz technology. Nat. Photonics 2007, 1, 97–105. [Google Scholar] [CrossRef]
  4. Zhang, X.C.; Xu, J. Introduction to THz Wave Photonics; Springer US: Boston, MA, USA, 2010; pp. 1–246. [Google Scholar]
  5. Ohlhoff, C.; Meyer, C.; Lupke, G.; Loffler, T.; Pfeifer, T.; Roskos, H.G.; Kurz, H. Optical second-harmonic probe for silicon millimeter-wave circuits. Appl. Phys. Lett. 1996, 68, 1699. [Google Scholar] [CrossRef]
  6. Nahata, A.; Heinz, T.F. Detection of freely propagating terahertz radiation by use of optical second-harmonic generation. Opt. Lett. 1998, 23, 67. [Google Scholar] [CrossRef] [PubMed]
  7. Dai, J.; Xie, X.; Zhang, X.C. Detection of Broadband Terahertz Waves with a Laser-Induced Plasma in Gases. Phys. Rev. Lett. 2006, 97, 103903. [Google Scholar] [CrossRef] [PubMed]
  8. Karpowicz, N.; Dai, J.; Lu, X.; Chen, Y.; Yamaguchi, M.; Zhao, H.; Zhang, X.C.; Zhang, L.; Zhang, C.; Price-Gallagher, M.; et al. Coherent heterodyne time-domain spectrometry covering the entire “terahertz gap”. Appl. Phys. Lett. 2008, 92, 011131. [Google Scholar] [CrossRef]
  9. Clerici, M.; Faccio, D.; Caspani, L.; Peccianti, M.; Yaakobi, O.; Schmidt, B.E.; Shalaby, M.; Vidal, F.; Légaré, F.; Ozaki, T.; et al. Spectrally resolved wave-mixing between near- and far-infrared pulses in gas. New J. Phys. 2013, 15, 125011. [Google Scholar] [CrossRef]
  10. Li, C.Y.; Seletskiy, D.V.; Yang, Z.; Sheik-Bahae, M. Broadband field-resolved terahertz detection via laser induced air plasma with controlled optical bias. Opt. Express 2015, 23, 11436–11443. [Google Scholar] [CrossRef] [PubMed]
  11. Clerici, M.; Caspani, L.; Rubino, E.; Peccianti, M.; Cassataro, M.; Busacca, A.; Ozaki, T.; Faccio, D.; Morandotti, R. Counterpropagating frequency mixing with terahertz waves in diamond. Opt. Lett. 2013, 38, 178–180. [Google Scholar] [CrossRef] [PubMed] [Green Version]
  12. Efimov, A.; Yulin, A.V.; Skryabin, D.V.; Knight, J.C.; Joly, N.; Omenetto, F.G.; Taylor, A.J.; Russell, P. Interaction of an Optical Soliton with a Dispersive Wave. Phys. Rev. Lett. 2005, 95, 213902. [Google Scholar] [CrossRef] [PubMed]
  13. Efimov, A.; Taylor, A.J.; Yulin, A.V.; Skryabin, D.V.; Knight, J.C. Phase-sensitive scattering of a continuous wave on a soliton. Opt. Lett. 2006, 31, 1624–1626. [Google Scholar] [CrossRef] [PubMed]
  14. Petev, M.; Westerberg, N.; Moss, D.; Rubino, E.; Rimoldi, C.; Cacciatori, S.L.; Belgiorno, F.; Faccio, D. Blackbody Emission from Light Interacting with an Effective Moving Dispersive Medium. Phys. Rev. Lett. 2013, 111, 043902. [Google Scholar] [CrossRef] [PubMed]
  15. Clerici, M.; Peccianti, M.; Schmidt, B.E.; Caspani, L.; Shalaby, M.; Giguère, M.; Lotti, A.; Couairon, A.; Légaré, F.; Ozaki, T.; et al. Wavelength Scaling of Terahertz Generation by Gas Ionization. Phys. Rev. Lett. 2013, 110, 253901. [Google Scholar] [CrossRef] [PubMed] [Green Version]
  16. Couairon, A.; Mysyrowicz, A. Femtosecond filamentation in transparent media. Phys. Rep. 2007, 441, 47–189. [Google Scholar] [CrossRef]
  17. Kolesik, M.; Wright, E.M.; Moloney, J.V. Interpretation of the spectrally resolved far field of femtosecond pulses propagating in bulk nonlinear dispersive media. Opt. Express 2005, 13, 10729–10741. [Google Scholar] [CrossRef] [PubMed]
  18. Kolesik, M.; Tartara, L.; Moloney, J.V. Effective three-wave-mixing picture and first Born approximation for femtosecond supercontinua from microstructured fibers. Phys. Rev. A 2010, 82, 045802. [Google Scholar] [CrossRef]
  19. Philbin, T.G.; Kuklewicz, C.; Robertson, S.; Hill, S.; Konig, F.; Leonhardt, U. Fiber-Optical Analog of the Event Horizon. Science 2008, 319, 1367–1370. [Google Scholar] [CrossRef] [PubMed]
  20. Webb, K.E.; Erkintalo, M.; Xu, Y.; Broderick, N.G.R.; Dudley, J.M.; Genty, G.; Murdoch, S.G. Nonlinear optics of fibre event horizons. Nat. Commun. 2014, 5, 4969. [Google Scholar] [CrossRef] [PubMed]
  21. Belgiorno, F.; Cacciatori, S.L.; Clerici, M.; Gorini, V.; Ortenzi, G.; Rizzi, L.; Rubino, E.; Sala, V.G.; Faccio, D. Hawking Radiation from Ultrashort Laser Pulse Filaments. Phys. Rev. Lett. 2010, 105, 203901. [Google Scholar] [CrossRef] [PubMed]
  22. Agrawal, G. Nonlinear Fiber Optics; Academic Press: New York, NY, USA, 2001; p. 467. [Google Scholar]
  23. Dudley, J.M.; Genty, G.; Coen, S. Supercontinuum generation in photonic crystal fiber. Rev. Mod. Phys. 2006, 78, 1135–1184. [Google Scholar] [CrossRef]
  24. Gordon, J.P. Dispersive perturbations of solitons of the nonlinear Schrödinger equation. J. Opt. Soc. Am. B 1992, 9, 91–97. [Google Scholar] [CrossRef]
  25. Yulin, A.V.; Skryabin, D.V.; Russell, P.S.J. Four-wave mixing of linear waves and solitons in fibers with higher-order dispersion. Opt. Lett. 2004, 29, 2411–2413. [Google Scholar] [CrossRef] [PubMed]
  26. Efimov, A.; Taylor, A.J.; Omenetto, F.G.; Yulin, A.V.; Joly, N.Y.; Biancalana, F.; Skryabin, D.V.; Knight, J.C.; Russell, P.S. Time-spectrally-resolved ultrafast nonlinear dynamics in small-core photonic crystal fibers: Experiment and modelling. Opt. Express 2004, 12, 6498–6507. [Google Scholar] [CrossRef] [PubMed]
  27. Skryabin, D.V.; Yulin, A.V. Theory of generation of new frequencies by mixing of solitons and dispersive waves in optical fibers. Phys. Rev. E 2005, 72, 016619. [Google Scholar] [CrossRef] [PubMed]
  28. Zaitsev, A.M. Optical Properties of Diamond; Springer Berlin Heidelberg: Berlin/Heidelberg, Germany, 2001; p. 502. [Google Scholar]
  29. Tyrrell, J.C.A.; Kinsler, P.; New, G.H.C. Pseudospectral spatial-domain: A new method for nonlinear pulse propagation in the few-cycle regime with arbitrary dispersion. J. Mod. Opt. 2005, 52, 973–986. [Google Scholar] [CrossRef]
  30. Conforti, M.; Marini, A.; Tran, T.X.; Faccio, D.; Biancalana, F. Interaction between optical fields and their conjugates in nonlinear media. Opt. Express 2013, 21, 31239–31252. [Google Scholar] [CrossRef] [PubMed]
  31. Couairon, A.; Brambilla, E.; Corti, T.; Majus, D.; de J. Ramírez-Góngora, O.; Kolesik, M. Practitioner’s guide to laser pulse propagation models and simulation. Eur. Phys. J. Spec. Top. 2011, 199, 5–76. [Google Scholar] [CrossRef]
  32. Boyd, R.W. Nonlinear Optics; Academic Press: New York, NY, USA, 2008. [Google Scholar]
  33. Rubino, E.; Lotti, A.; Belgiorno, F.; Cacciatori, S.L.; Couairon, A.; Leonhardt, U.; Faccio, D. Soliton-induced relativistic-scattering and amplification. Sci. Rep. 2012, 2, 932. [Google Scholar] [CrossRef] [PubMed] [Green Version]
  34. Conforti, M.; Baronio, F.; Trillo, S. Resonant radiation shed by dispersive shock waves. Phys. Rev. A 2014, 89, 013807. [Google Scholar] [CrossRef]
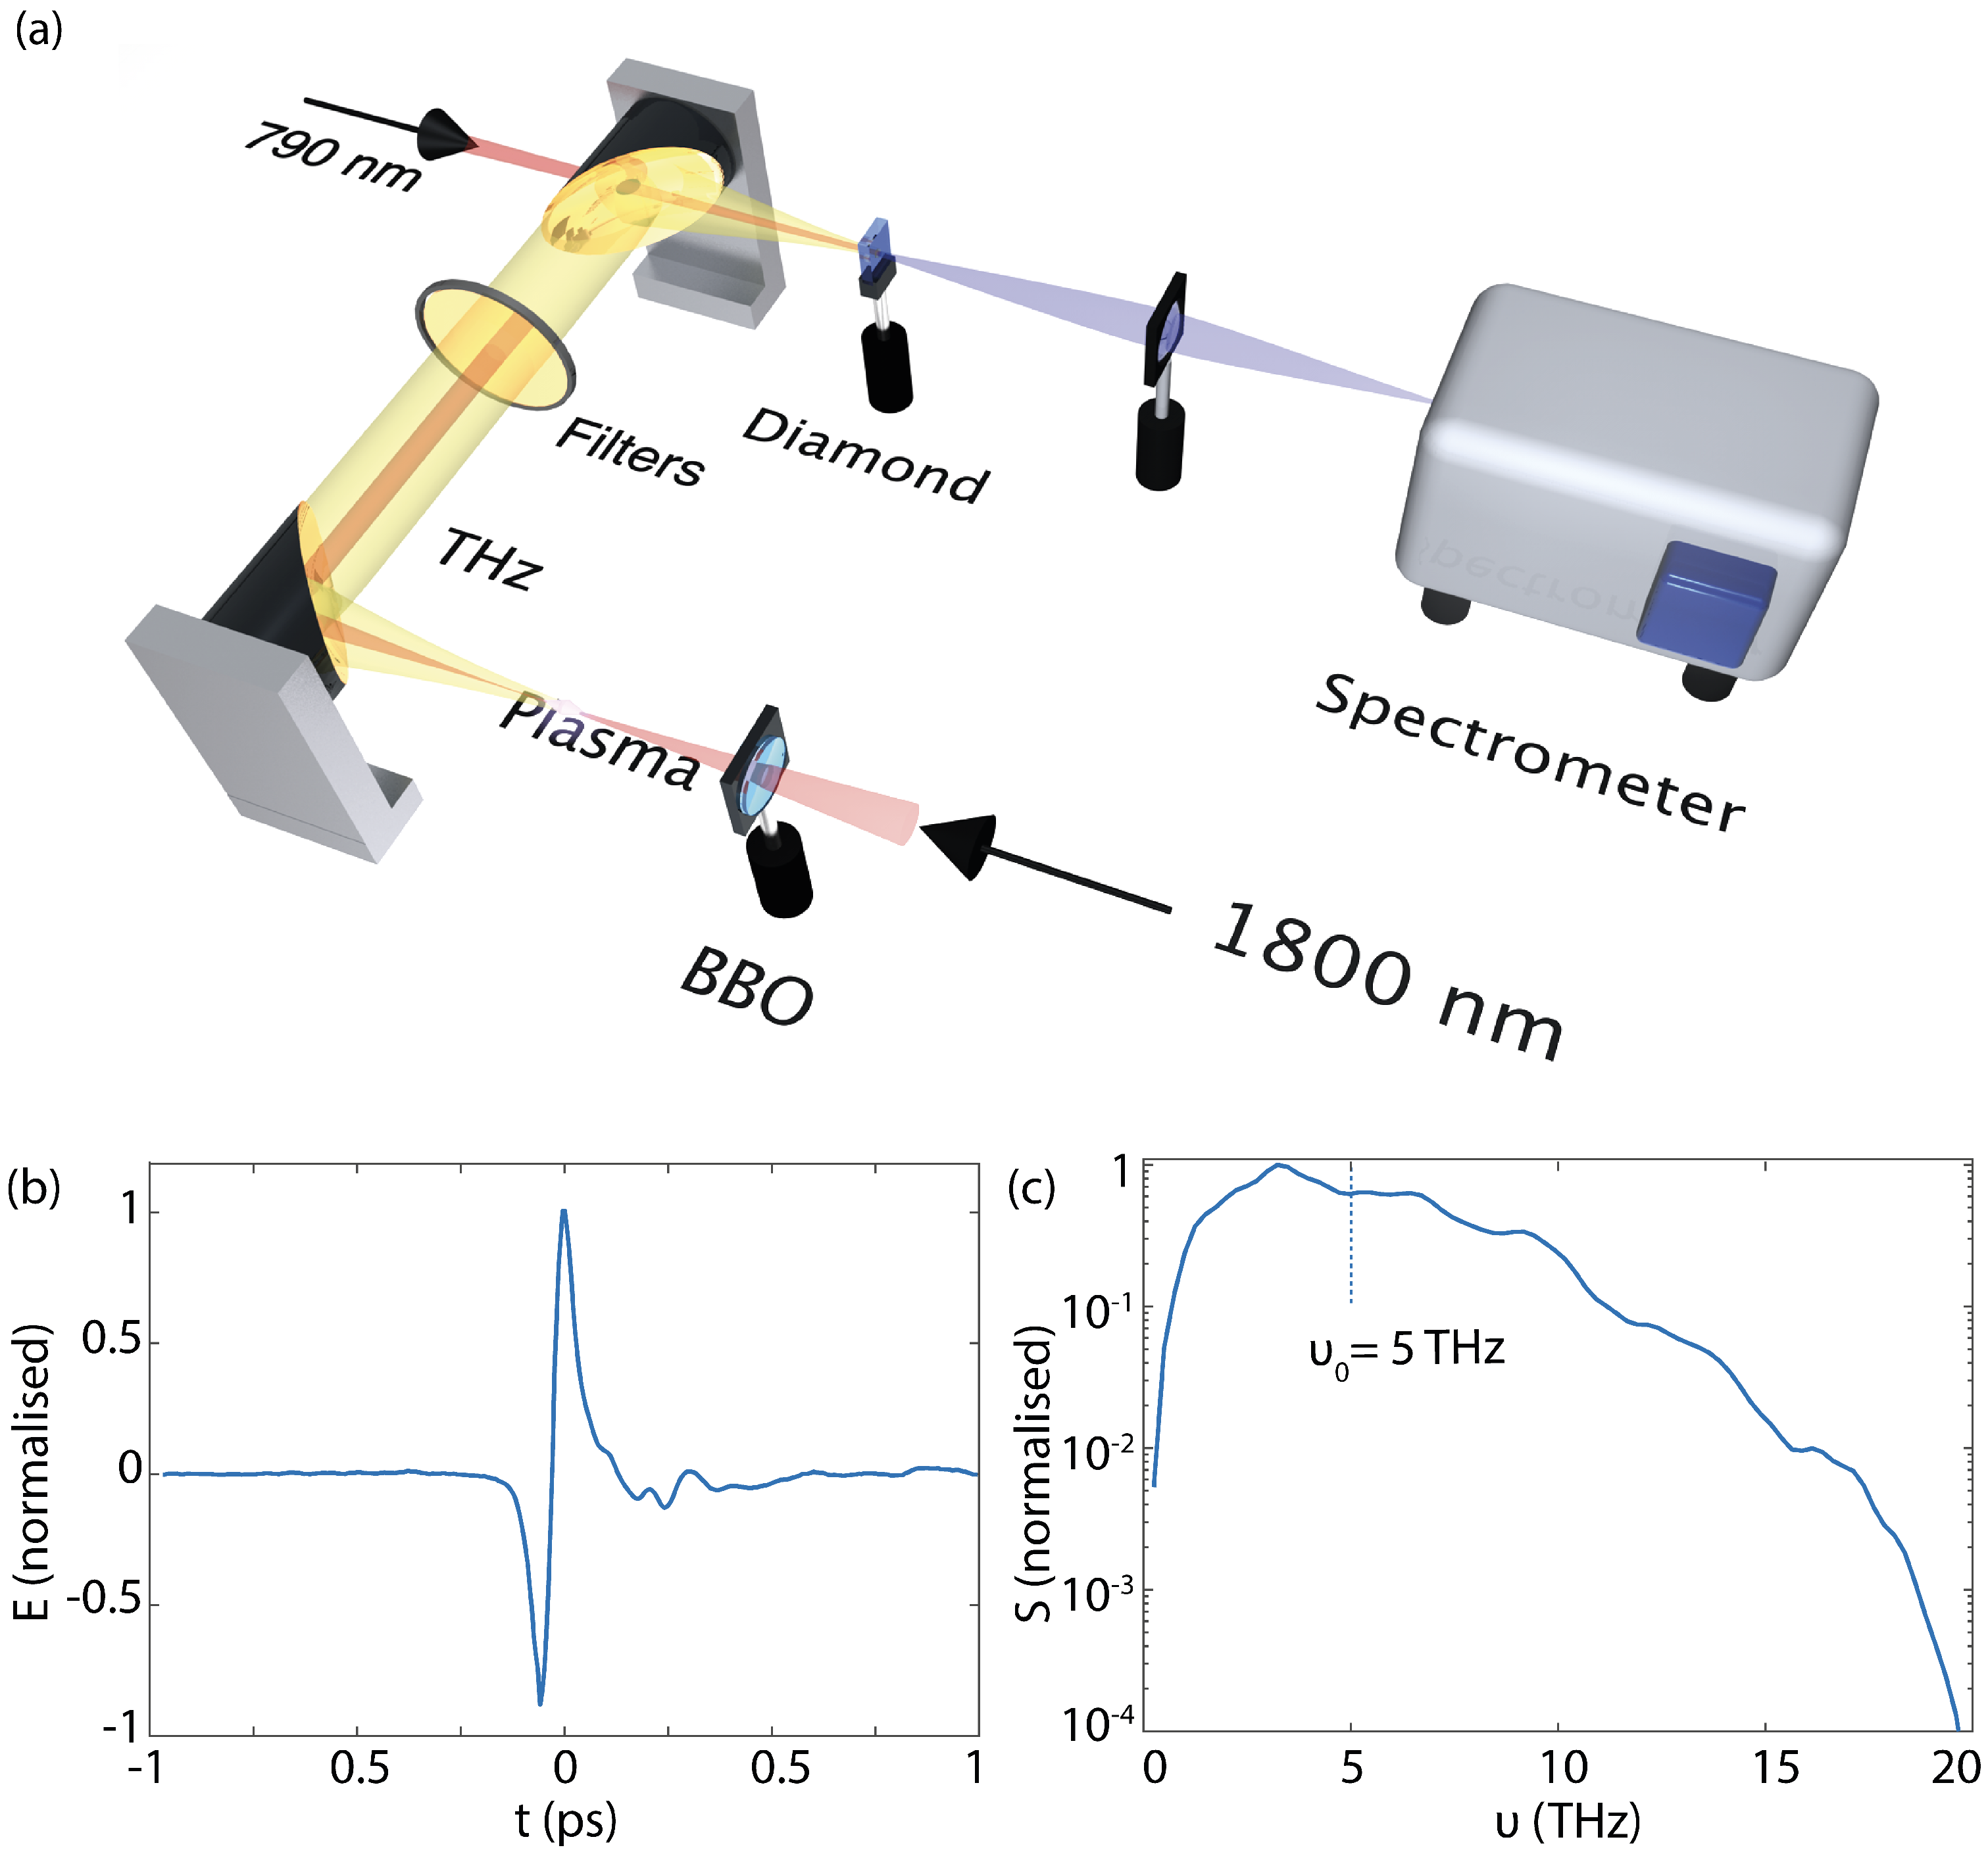
Figure 1. (a) Experimental setup. A broadband (20 THz) seed pulse is generated by field ionisation of nitrogen in an asymmetric field composed of 1800 nm and 900 nm radiation. The THz electric field recorded via air-biased coherent detection (ABCD) and its spectrum are shown in (b,c), respectively. The THz field is collimated by a gold-coated off-axis parabolic mirror and filtered by two gold mesh long pass filters in order to remove every frequency component above 20 THz. The THz pulse is then focused in a diamond single crystal sample collinearly, and is temporally overlapped with an intense 790 nm pump pulse. The generated UV radiation is collected by a lens and detected by an imaging spectrometer coupled to a charge-coupled device (CCD).
Photonics 04 00007 g001
Figure 2. (a) Experimental measurement showing the electric field-induced second harmonic (EFISH) generation signal typically observed for low pump intensities (red, shaded curve, S stands for power spectrum). The blue curve shows the pump pulse spectrum after the propagation in the crystal without any injected THz seed. The black shaded curve shows a section of the input spectrum (a very limited spectral reshaping of the pump pulse is evident); (b) as in (a), but for a higher pump pulse intensity. The occurrence of an additional signal at ∼430 nm is clearly visible in the red shaded curve.
Photonics 04 00007 g002
Figure 3. (a) Numerically simulated spectra for the total (pump and THz) field—spectra are shown at the sample output ( z = 5 mm). The light blue shaded area is for low pump intensity, while the thick black curve is for high pump intensities (S stands for power spectrum). (b) Same as in (a), but comparing—for the high energy case—the results from a full simulation (black solid curve) with those from a simulation accounting only for the P n l 1 Re | Ɛ | 2 Ɛ (red shaded curve). (c) Same as (b), but comparing the full simulation (black solid curve) with one including only the P n l 2 Re Ɛ 3 term (green shaded curve). PI: phase insensitive scattering.
Photonics 04 00007 g003
Figure 4. (a) Numerically simulated evolution of the seed field spectrum along the full 5 mm propagation distance based on Equation (4) (colormap is in logarithmic scale). (b) Dispersion, D ( ω scatter ) = k ( ω scatter ) - ω scatter / v p , for diamond calculated for the speed of the shock front, v p = 1.223 × 10 8 m/s (red curve). The horizontal line shows D ( ω seed ) = k ( ω seed ) - ω seed / v p : the intersections with D ( ω scatter ) gives the spectral location of the phase-insensitive scattering peak. The blue-shaded box shows the THz input spectrum at 1 / e 2 . For the sake of clarity, the spectral position of the 790 nm pump pulse is also shown with a vertical red dashed line.
Photonics 04 00007 g004